1. Introduction
Habitat fragmentation and the loss of natural habitats is a leading cause of the decline in wildlife populations worldwide [
1,
2]. Urbanization is a primary factor contributing to this fragmentation, and severely altered environmental conditions are largely attributed to the increasing human population and concurrent urban expansion [
3,
4]. However, urban areas, including large cities, provide an overabundance of anthropogenic resources, as well as a concurrent reduction in natural predators [
5,
6], potentially providing shelter for urban wildlife. As a result, several studies have shown how species prosper in urban areas, particularly small to medium sized meso-carnivores [
4,
7,
8,
9,
10]. These studies have shown how different aspects of animal biology are modified, such as being flexible in diet, activity and space use, aiding in the success of some wildlife in urban environments. Nevertheless, few have considered a multi-variable assessment of an urban species’ biology.
Urbanization affects carnivores in several ways. The diets of urbanized carnivores typically include a combination of vertebrate and invertebrate prey, and often plant material, and they also tend to exploit available anthropogenic resources [
7,
9,
10]. For example, in the red fox
Vulpes vulpes, anthropogenic items dominate stomach contents, particularly in individuals sampled closer to city centers [
11]. Similarly, scats of martens
Martes spp. in urban areas contain a high proportion of human garbage, while martens in non-urban areas feed mainly on insects [
8]. Habitat use of animals inhabiting urban areas is concurrently also largely influenced by the abundance and availability of preferred food resources [
9,
12]. An animal’s home range size is affected by population density, and larger home range sizes are generally correlated with smaller population densities [
3]. In urban areas, with the increased resource availability and reduced predation, species are able to attain higher population densities [
1,
6]; numerous studies have shown that home range sizes of animals are greatly reduced in urban areas, largely attributed to both the increase in population densities and greater resource availability [
4,
13,
14]. Urbanization also impacts activity patterns, particularly in larger carnivores, as a mechanism of temporal avoidance of conflict with humans [
9]. For example, Beckman et al. [
15] showed that black bears
Ursus americanus in urban areas were less active and changed to being nocturnal; both these behaviors were attributed to available anthropogenic food sources and direct human disturbances. Similarly, tigers
Panthera tigris exhibited lower activity levels in areas where they overlapped spatially with humans [
16].
Urban expansion is inexorable, and we can predict an ever-increasing number of wild animal occurrences in urban areas worldwide. It is, therefore, crucial to understand the ecology of urban species, particularly with the goal of introducing effective management plans should the need arise [
4,
13]. Our focus here is on the yellow mongoose
Cynictis penicillata, a small carnivore widely distributed in southern Africa, most commonly in open grassland habitats. Free-living yellow mongooses in southern Africa have been extensively studied, including many aspects of their ecology. They are diurnal and largely solitary foraging insectivores, but also commonly consume small mammal and avian prey. The species lives in groups of 2–13 individuals, and has evolved cooperative breeding. Mating begins in July, with a gestation period of approximately two months. Home range size is estimated as a mean of 70 ha (male home ranges being typically larger than females), and is dependent on population density of the study areas [
17,
18,
19,
20,
21]. Reported sightings in close proximity to urban areas date back to 1999 [
22], and the yellow mongoose is now a common urban resident, but research into the ecology of urban populations is a recent development [
23,
24].
We investigated the diet, spatial occurrence, activity patterns, and home range of the yellow mongooses in urban Johannesburg (South Africa), and compared these results to those of mongooses in non-urban environments in the literature. The aims of our study were to (1) describe how yellow mongooses exploit an urban environment; and (2) establish whether the yellow mongooses have a different eco-type in urban than non-urban environments. Our multi-pronged approach allowed us to consider whether one or several ecological characteristics were modified because of urbanization, and whether certain characteristics were retained from a non-urban existence, potentially making them pre-adapted to an urban setting. Overall, we expected that the yellow mongooses have modified their diet, space use and activity by incorporating available anthropogenic resources to exploit urban areas. The yellow mongooses in non-urban areas show strong seasonality in their diet as a response to food availability. We tested whether such seasonality is dampened in urban areas, where resources (e.g., food, shelter) are more predictable and constant all year round. We also investigated whether this seasonality is also dampened in space use and activity, factors that have not been studied in non-urban yellow mongooses.
2. Materials and Methods
2.1. Study Site
This study took place from March 2015 to April 2018. Field work took place in an urban ecological estate, Meyersdal, Johannesburg, South Africa (26°17′10.4″S 28°05′14.7″E). The climate in the area is warm and temperate, with an average annual temperature of 16 °C, and average precipitation of 723 mm. The warmest temperatures occur in December–February (average minimum of 14 °C and average maximum of 26 °C) and the coldest in July (average minimum of 3 °C and average maximum of 19 °C). The estate (480 ha) consists of residential development interspersed with natural areas dominated by grassland vegetation, with dispersed areas of tree cover and undulating rocky hills [
25]. Numerous outdoor trails for recreational use are located throughout the entire estate, and wildlife also occur in close proximity to human residences and utilize gardens and corridors between residential houses. Several small to large sized mammal game species occur here, as well as numerous smaller mammals, such as rock hyraxes
Procavia capensis, porcupines
Hystrix africaeaustralis and spotted genets
Genetta genetta. Potential competitors of yellow mongooses include feral and domestic cats
Felis catus, slender mongooses
Galerella sanguinea and black backed jackals
Canis mesomelas, although yellow mongooses are the most abundant carnivore (estimated at 30–40 individuals per 100 ha; pers. obs.). Predators of the yellow mongooses are mostly jackals and a breeding pair of black eagles
Ictinaetus malaiensis. Yellow mongooses are also found in neighboring Johannesburg south twons, such as Rosettenville and Alberton, which surround Meyersdal.
2.2. Diet
Yellow mongoose diet was assessed through scat sample analysis. Fresh scat samples were collected from 10 sampling sites (
Figure S1), once a month, from March 2015 to March 2016. Total sample size was 1300 scats collected over the entire study period (13 collection periods). Yellow mongoose scats were identified on the basis of their odor and appearance and were easily located at middens near denning sites, characterized by underground dens in the open grassland or in rock crevices above- and belowground. Scat samples were morphologically analyzed using the protocol described by Cronk and Pillay [
24]. The contents of scats were categorized into five types: plants, invertebrates (insects), mammals, birds, and anthropogenic. Previous studies have reported that yellow mongooses feed on amphibians and reptiles, but none were identified in scat samples in this study. To identify common prey items, a sub-sample of 200 scat samples was further analyzed and remains of invertebrates, mammalian and avian prey taxa were morphologically identified to appropriate taxonomic levels (order and family) using reference catalogues, and the assistance of relevant specialists at the University of the Witwatersrand.
The prevalence and relative importance of food categories in the diet were quantified by using two index methods: (1) frequency of occurrence (F.O.), calculated by dividing the total frequency of a food category by the total number of scats analyzed, and expressed as a percentage; and (2) percent occurrence (P.O.), calculated by dividing the occurrence of a food category by the total number of occurrences of all food categories, and expressed as a percentage [
26]. F.O. and P.O. were used since both use the presence, rather than the volume, of diet items to compare items of varying levels of digestibility (e.g., bones versus soft human food; [
9]). Moreover, these two methods have been used in previous studies, allowing for inter-study comparisons [
24]. Plants present in scats were dominated by grasses and leaves. These items do not form part of the yellow mongooses’ diet, and their presence in the scat was attributed to indirect ingestion when consuming other food [
17]. Therefore, plants were excluded from the calculation of percent occurrence to avoid overrepresentation of their importance in the yellow mongoose’s diet.
2.3. Spatial Occurrence and Activity Patterns
We used camera trap surveillance to assess the spatial and temporal occurrence of yellow mongooses throughout the estate. Three motion triggered Bushnell Essential® camera traps were used over the sampling period of May 2015 to March 2016. These were attached to rigid surfaces (rocks/trees/poles) and angled to maximize field of view of wildlife trails. Camera traps were active 24 h a day, and remained at a site for a 2-week period before being moved to a new site approximately 200 m away; no bait was used and camera traps were not placed at known mongoose dens. Camera traps were never placed in the same area in a season but were sometimes placed in close proximity to previous sites in different seasons. Cameras were checked once a week to change batteries and memory cards.
A total of 66 sites were sampled throughout the study period (
Figure S1). At each site, we recorded the GPS coordinates, the relative distance to human residences (in meters), and the vegetation cover (open: areas dominated by open fields of grasses; or closed: areas dominated by tree cover or dense bushes); these variables aided in identifying relative use of residential areas (as a proxy for access to and potential use of anthropogenic resources) as well as micro-habitat type use. From photographs obtained where a yellow mongoose was present, we recorded the date and time of occurrence; consecutive captures of yellow mongooses within a 10 min time frame were considered as a single occurrence (i.e., the same individual; [
27]). Time stamp data were used to generate the yellow mongooses’ activity patterns.
2.4. Home Range and Residential Overlap
Trapping, collaring, and tracking of two male and two female mongooses took place from March 2016 to May 2017. We used single door humane animal traps (80 × 29 × 33 cm galvanized wire mesh) placed at four different sites in different regions of the estate (at least 1 km apart), in an attempt to avoid capturing individuals that were likely to congregate in social groups (resulting in spatial correlation between individual mongooses). Traps were camouflaged, baited with off-cut deli meats, and set out in the early morning before mongoose activity was expected to start. Traps were checked every hour to reduce the stress caused by captivity. Trapped yellow mongoose were immobilized using a 0.06 mL/kg Medatomidine and 6 mg/kg Ketamine, which was administered intramuscularly by a registered veterinarian. We recorded standard weights and body measurements before fitting a GPS collar. Collars were manufactured by Africa Wildlife Tracking (HAWK-UHF device, AWT CC, Pretoria, South Africa), weighed between 65 and 85 g, and were designed with an easy release point that required minimal stress to break when snagged (i.e., repetitive pulling by mongoose would break the collar). To maximize battery life, collars were programmed to record GPS coordinates (hereafter referred to as fixes) every 3 h during daylight hours (between 5 a.m. and 7 p.m.), to coincide with yellow mongoose activity; the 3 h interval accounted for potential spatial auto-correlation between fixes. Once the collar was fitted, the mongoose was returned to the trap, and an anesthetic reversal of 0.3 mg/kg Atipamezole was administered. The veterinarian monitored when the mongoose was mobile again in order to assess whether there was any discomfort or distress from the collar. The collared mongoose was subsequently released at the site of capture.
To collect data from the collars, collared individuals were located by means of the triangulation method, using a hand-held H antenna (AWT CC, 433 MHz), and a portable VHF receiver (HAWK 433 MHz transceiver, AWT CC). Each collar had a reception range of ±1 km, and data could be downloaded from within a ±50 m range of a collared mongoose. Tracking took place on foot. All GPS locations were automatically stored on the collar which required a single download from the receiver every 2 weeks. The receiver was connected to a computer and GPS coordinates were then downloaded for later analysis.
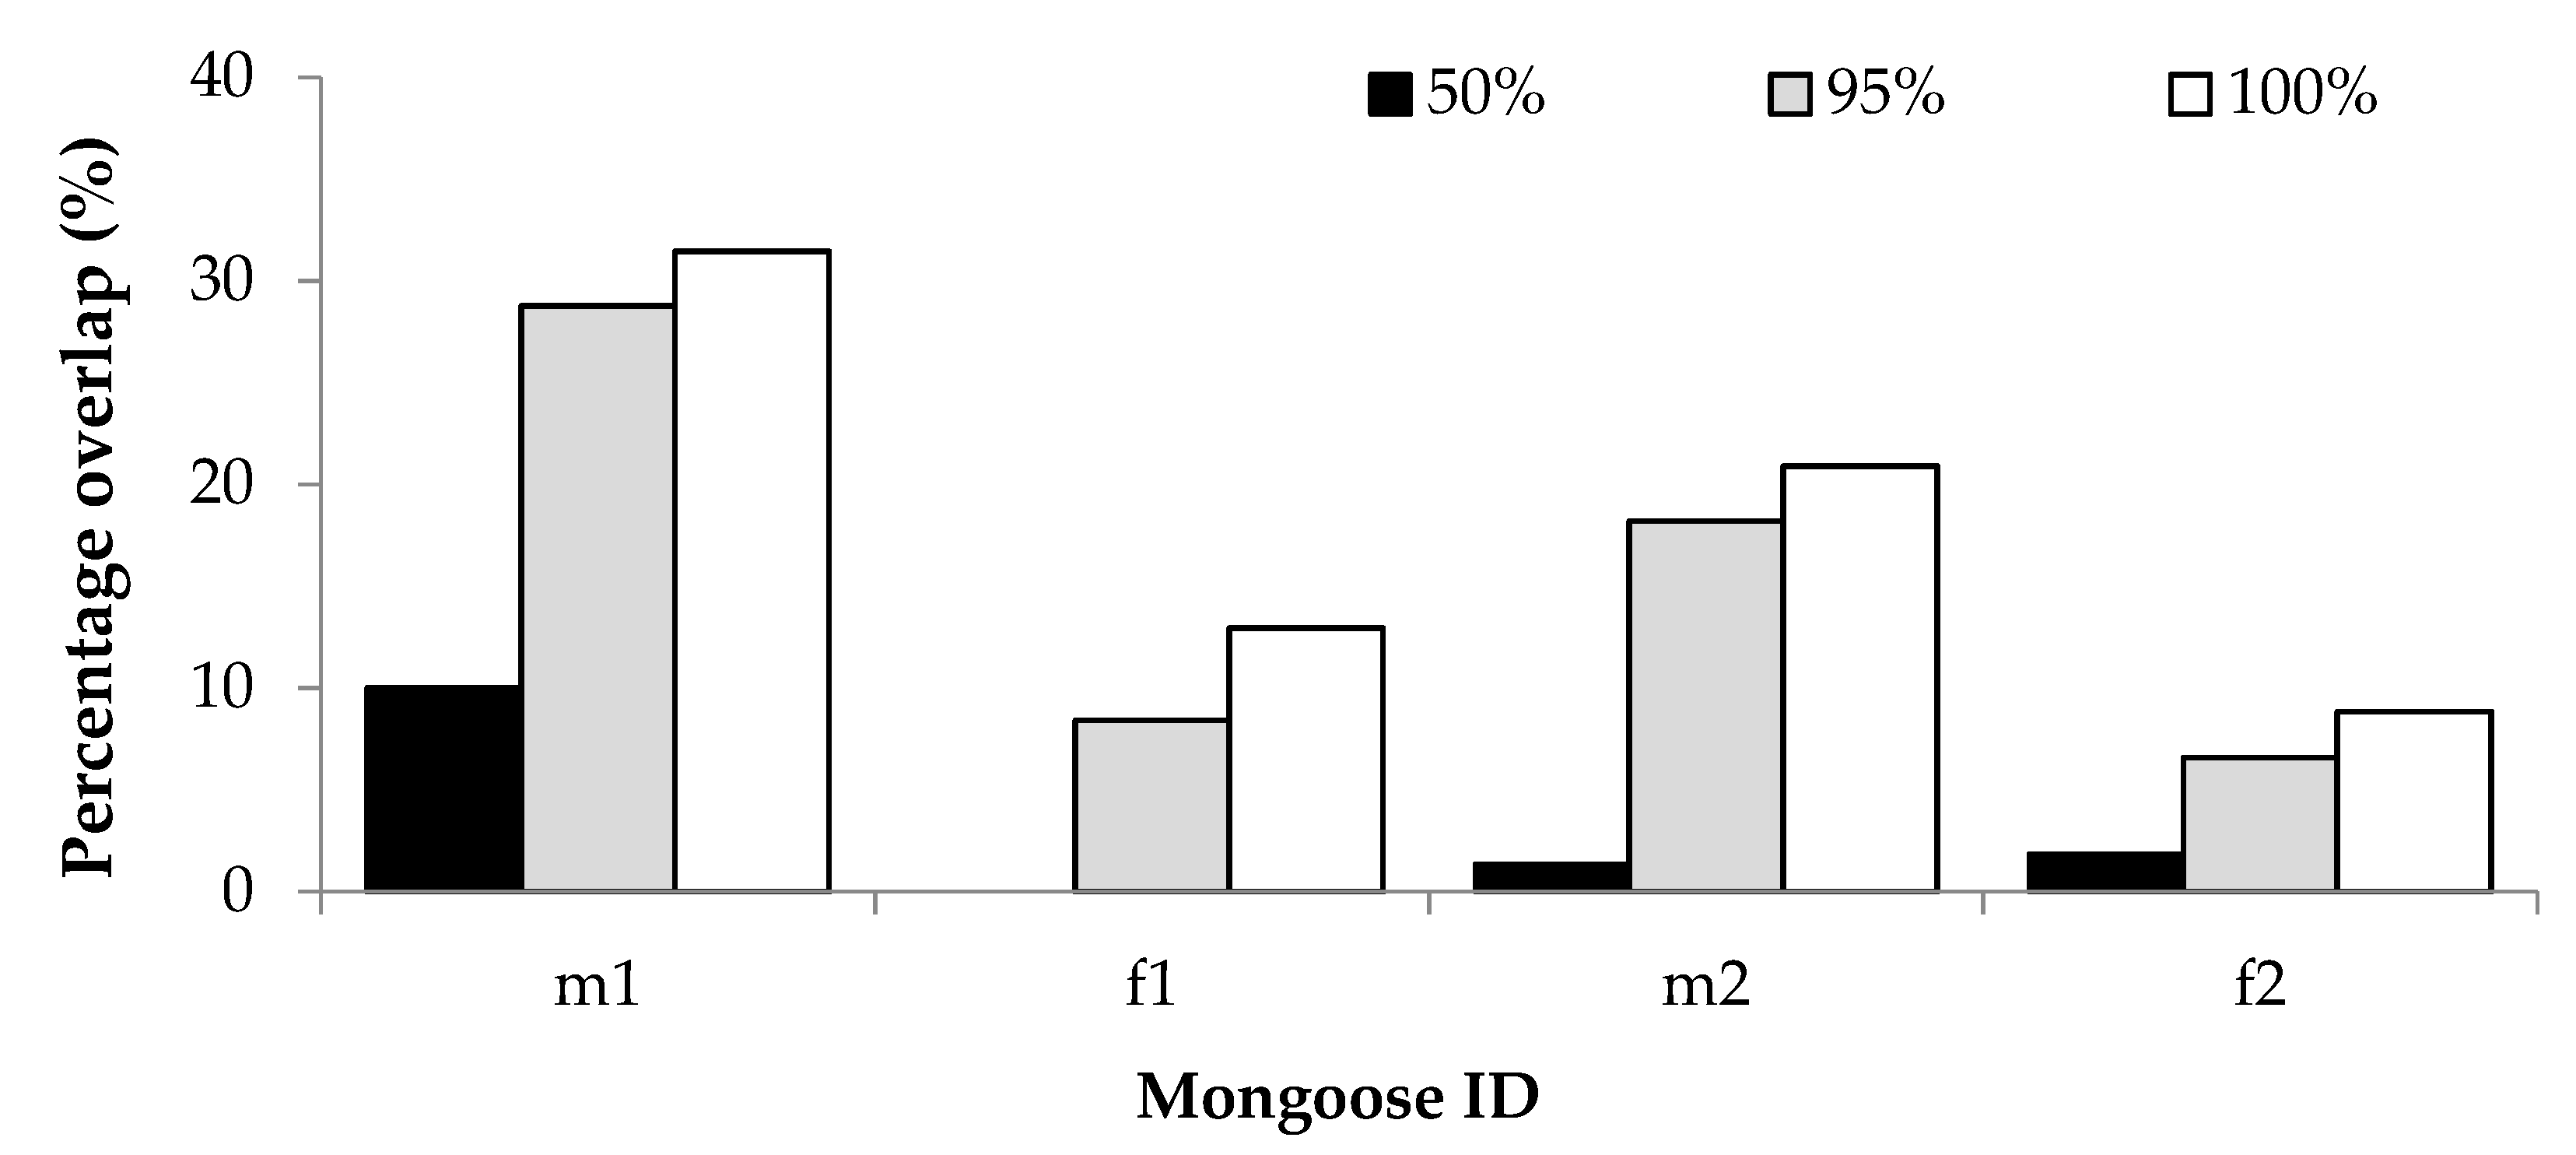
Home range size was defined by the area navigated by each collared mongoose while engaging in different activities. Home range size was established using minimum convex polygon (MCP) and kernel density estimates (KDE) methods for comparison with previous studies. Furthermore, GPS data were plotted to establish occurrence of mongooses within residential gardens, as a proxy for potential access to, and use of human provided food resources. We assessed the overlap with human residences, defined as the percentage of GPS locations found within residential gardens [
7].
2.5. Data Analyses
All data were recorded in, and graphs generated, using Microsoft Excel
® (Microsoft Corporation, 2007). All statistical analyses were conducted using R Statistical Software (
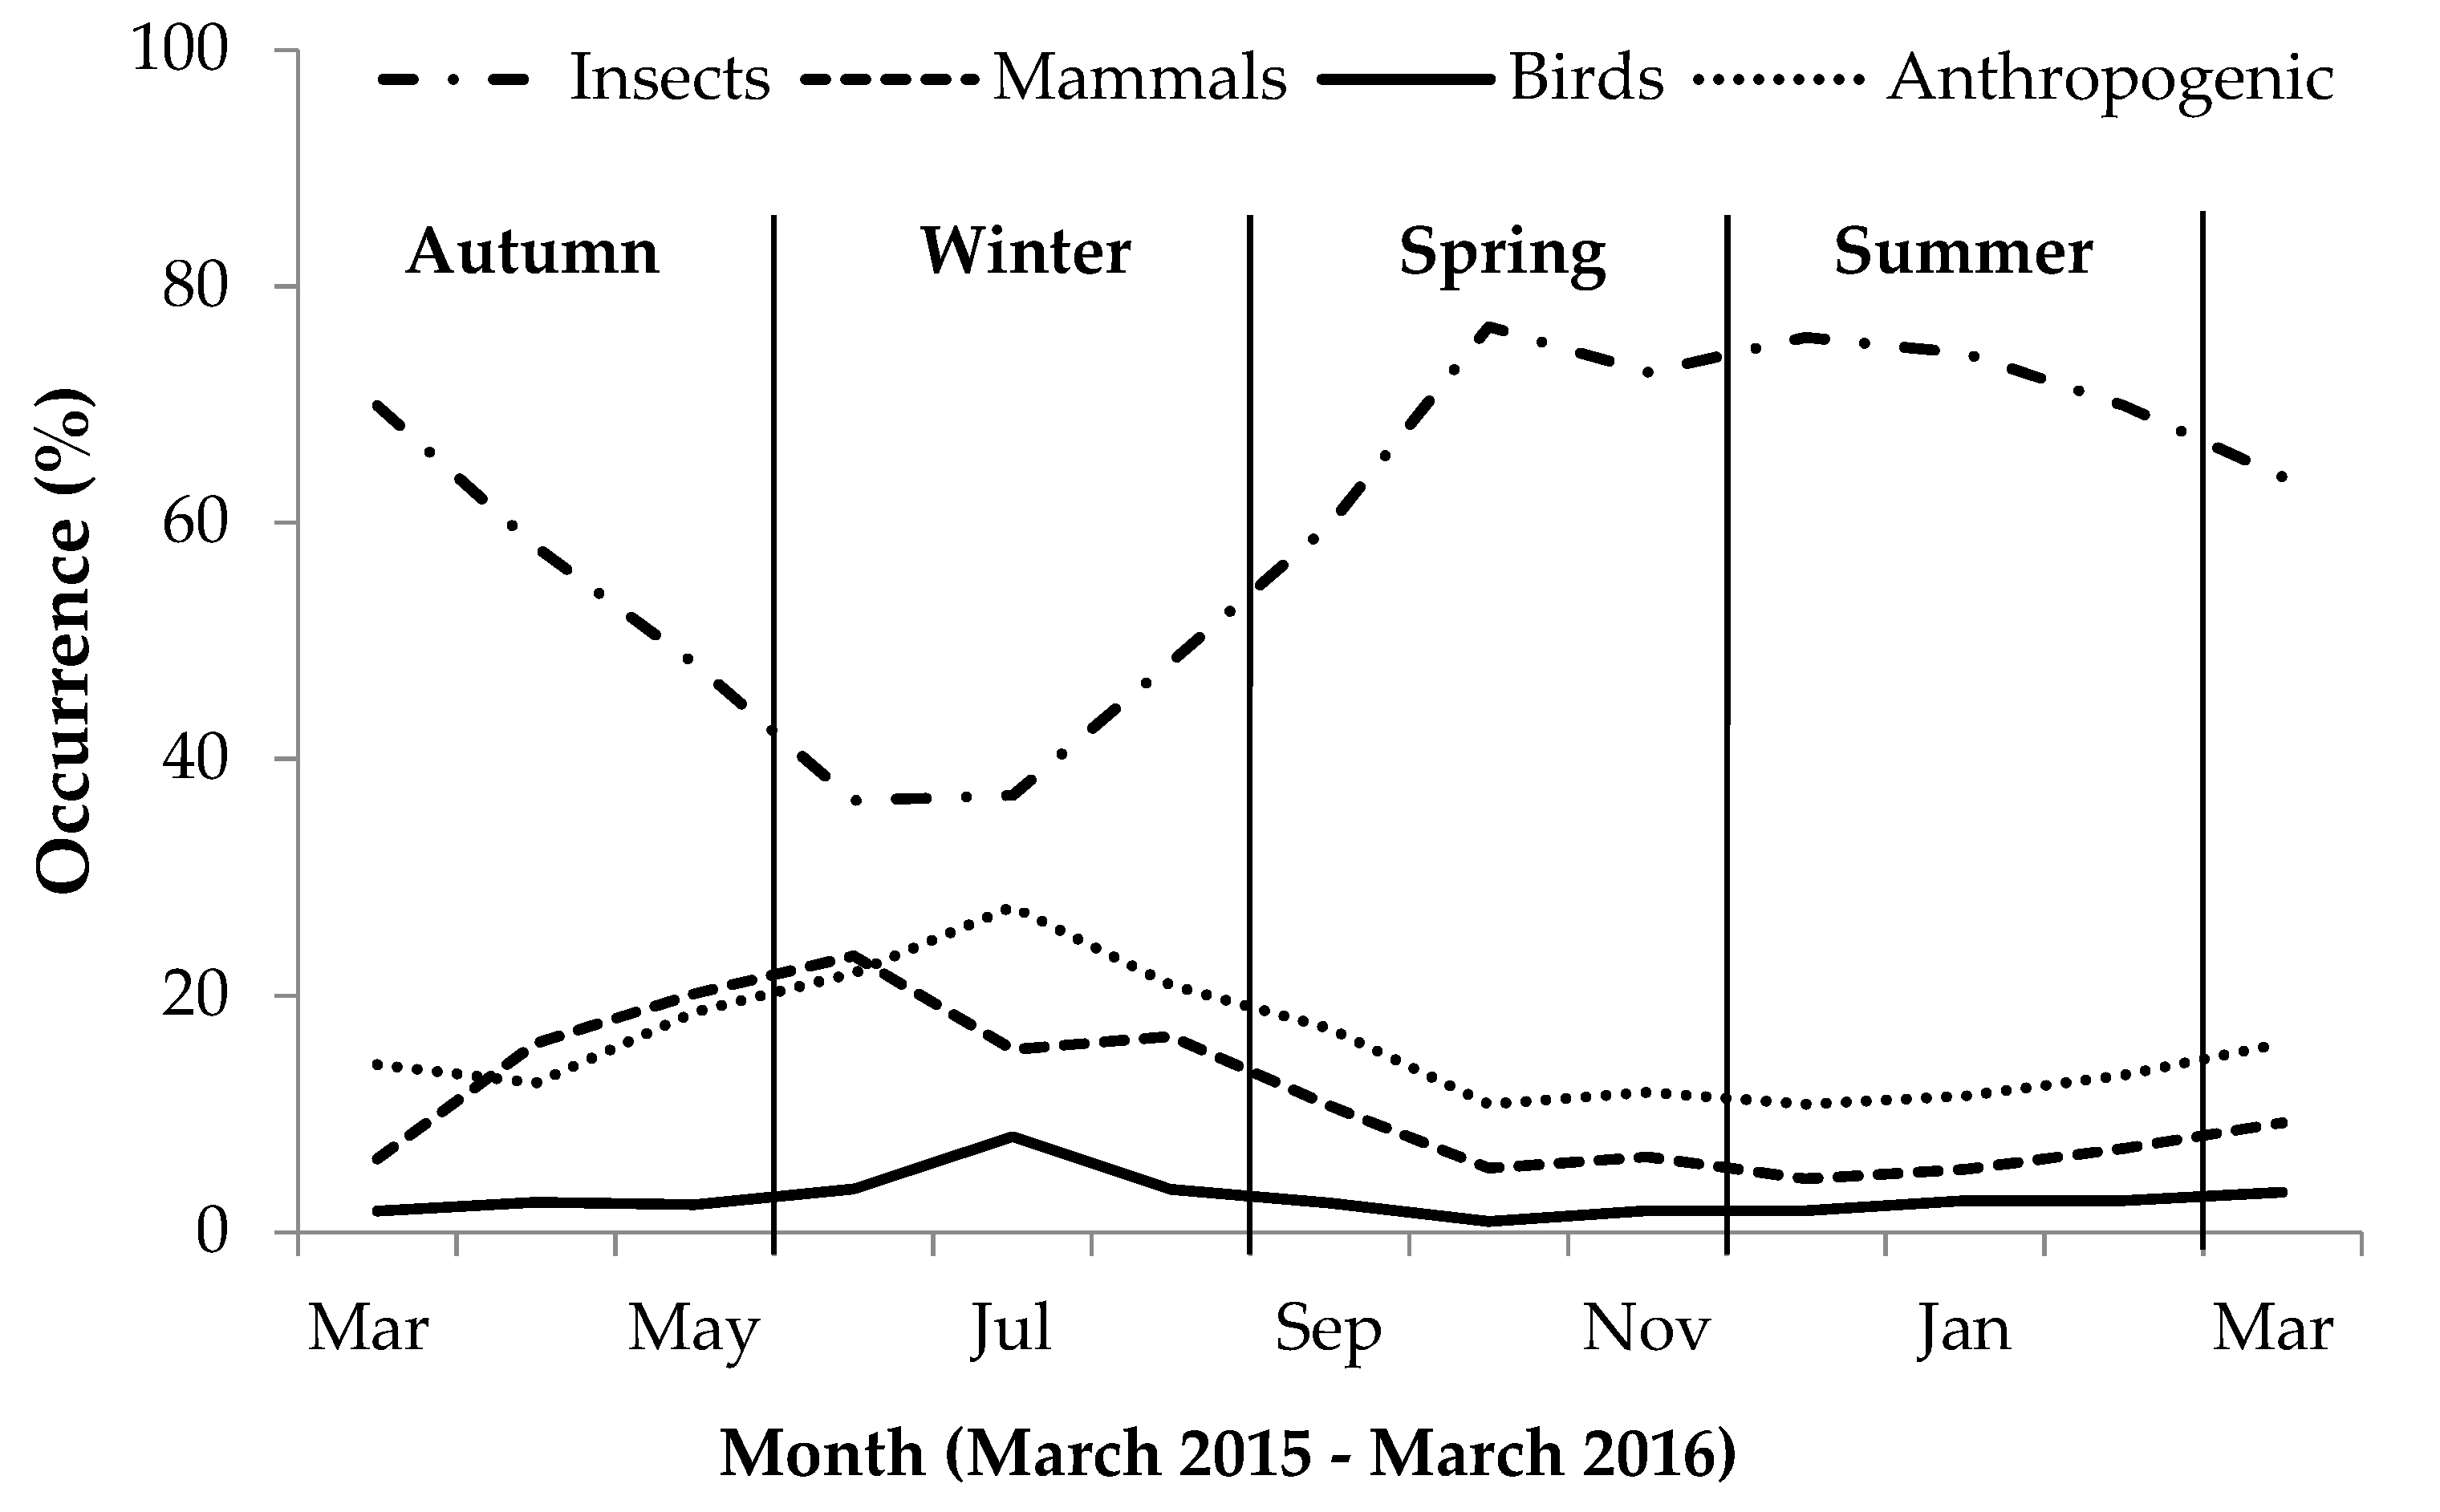
www.r-project.org, R version 3.4.3). For diet and spatial occurrence data analyses, sampling periods were divided into four seasons according to South Africa’s weather patterns: Colder seasons—autumn (March–May) and winter (June–August); and warmer seasons—spring (September–November) and summer (December–February).
2.5.1. Diet
A generalized linear model (coded glm), with a Poisson distribution and log link function, was used to identify the significant predictors of percent occurrence (dependent variable). The model comprised of single and first order interaction effects between food category and season as fixed effects. We used the lsmeans function in R to perform post-hoc tests to interpret significant outcomes. Additionally, we illustrated seasonal variation graphically by comparing percent occurrence of each food category per month.
2.5.2. Spatial Occurrence and Activity Patterns
We recorded the total number of occurrences of yellow mongoose at each site. Using a generalized linear model (coded glm), we analyzed whether the fixed effects—(1) distance relative to residences (in meters; as a continuous predictor), (2) cover (open/closed) and (3) season (autumn/winter/spring/summer)—had a significant effect on the number of photographs captured of yellow mongoose (dependent variable). We used the lsmeans function in R to perform Tukey post-hoc tests to interpret significant fixed effects. Furthermore, activity profiles comparing the colder (autumn and winter) and warmer (spring and summer) seasons were generated using time stamp data from all photographs obtained. To visualize the data graphically, we used the R package ‘
overlap’ and the function ‘
overlapEst’ (type = Dhat4, smoothing constant adjust = 1) to obtain pair-wise temporal overlap coefficients (Δ; [
28,
29]), in order to identify seasonal variation in activity patterns. Temporal overlap of activity patterns between cold and warm seasons was estimated using kernel density estimation in R following the methods proposed by Ridout and Linkie [
29] (where c = 1). The overlap coefficient generated (Δ) ranges from 0, indicating no overlap, to 1, indicating complete overlap [
30].
2.5.3. Home Range and Residential Overlap
All GPS fixes (location error estimate of 2–3 m) were downloaded from the receiver and recorded on a spreadsheet. We established the home range size for each mongoose by calculating 50%, 95% and 100% isopleths, according to MCP and KDE (h = href) methods in R using the package adehabitatHR [
31]. For the 100% KDE, the model did not converge and, subsequently, unrealistically large home range sizes were generated; these were not included in analyses (see [
32]). A minimum of 50 GPS fixes are required to estimate the home range size of yellow mongooses [
20]. However, Balmforth [
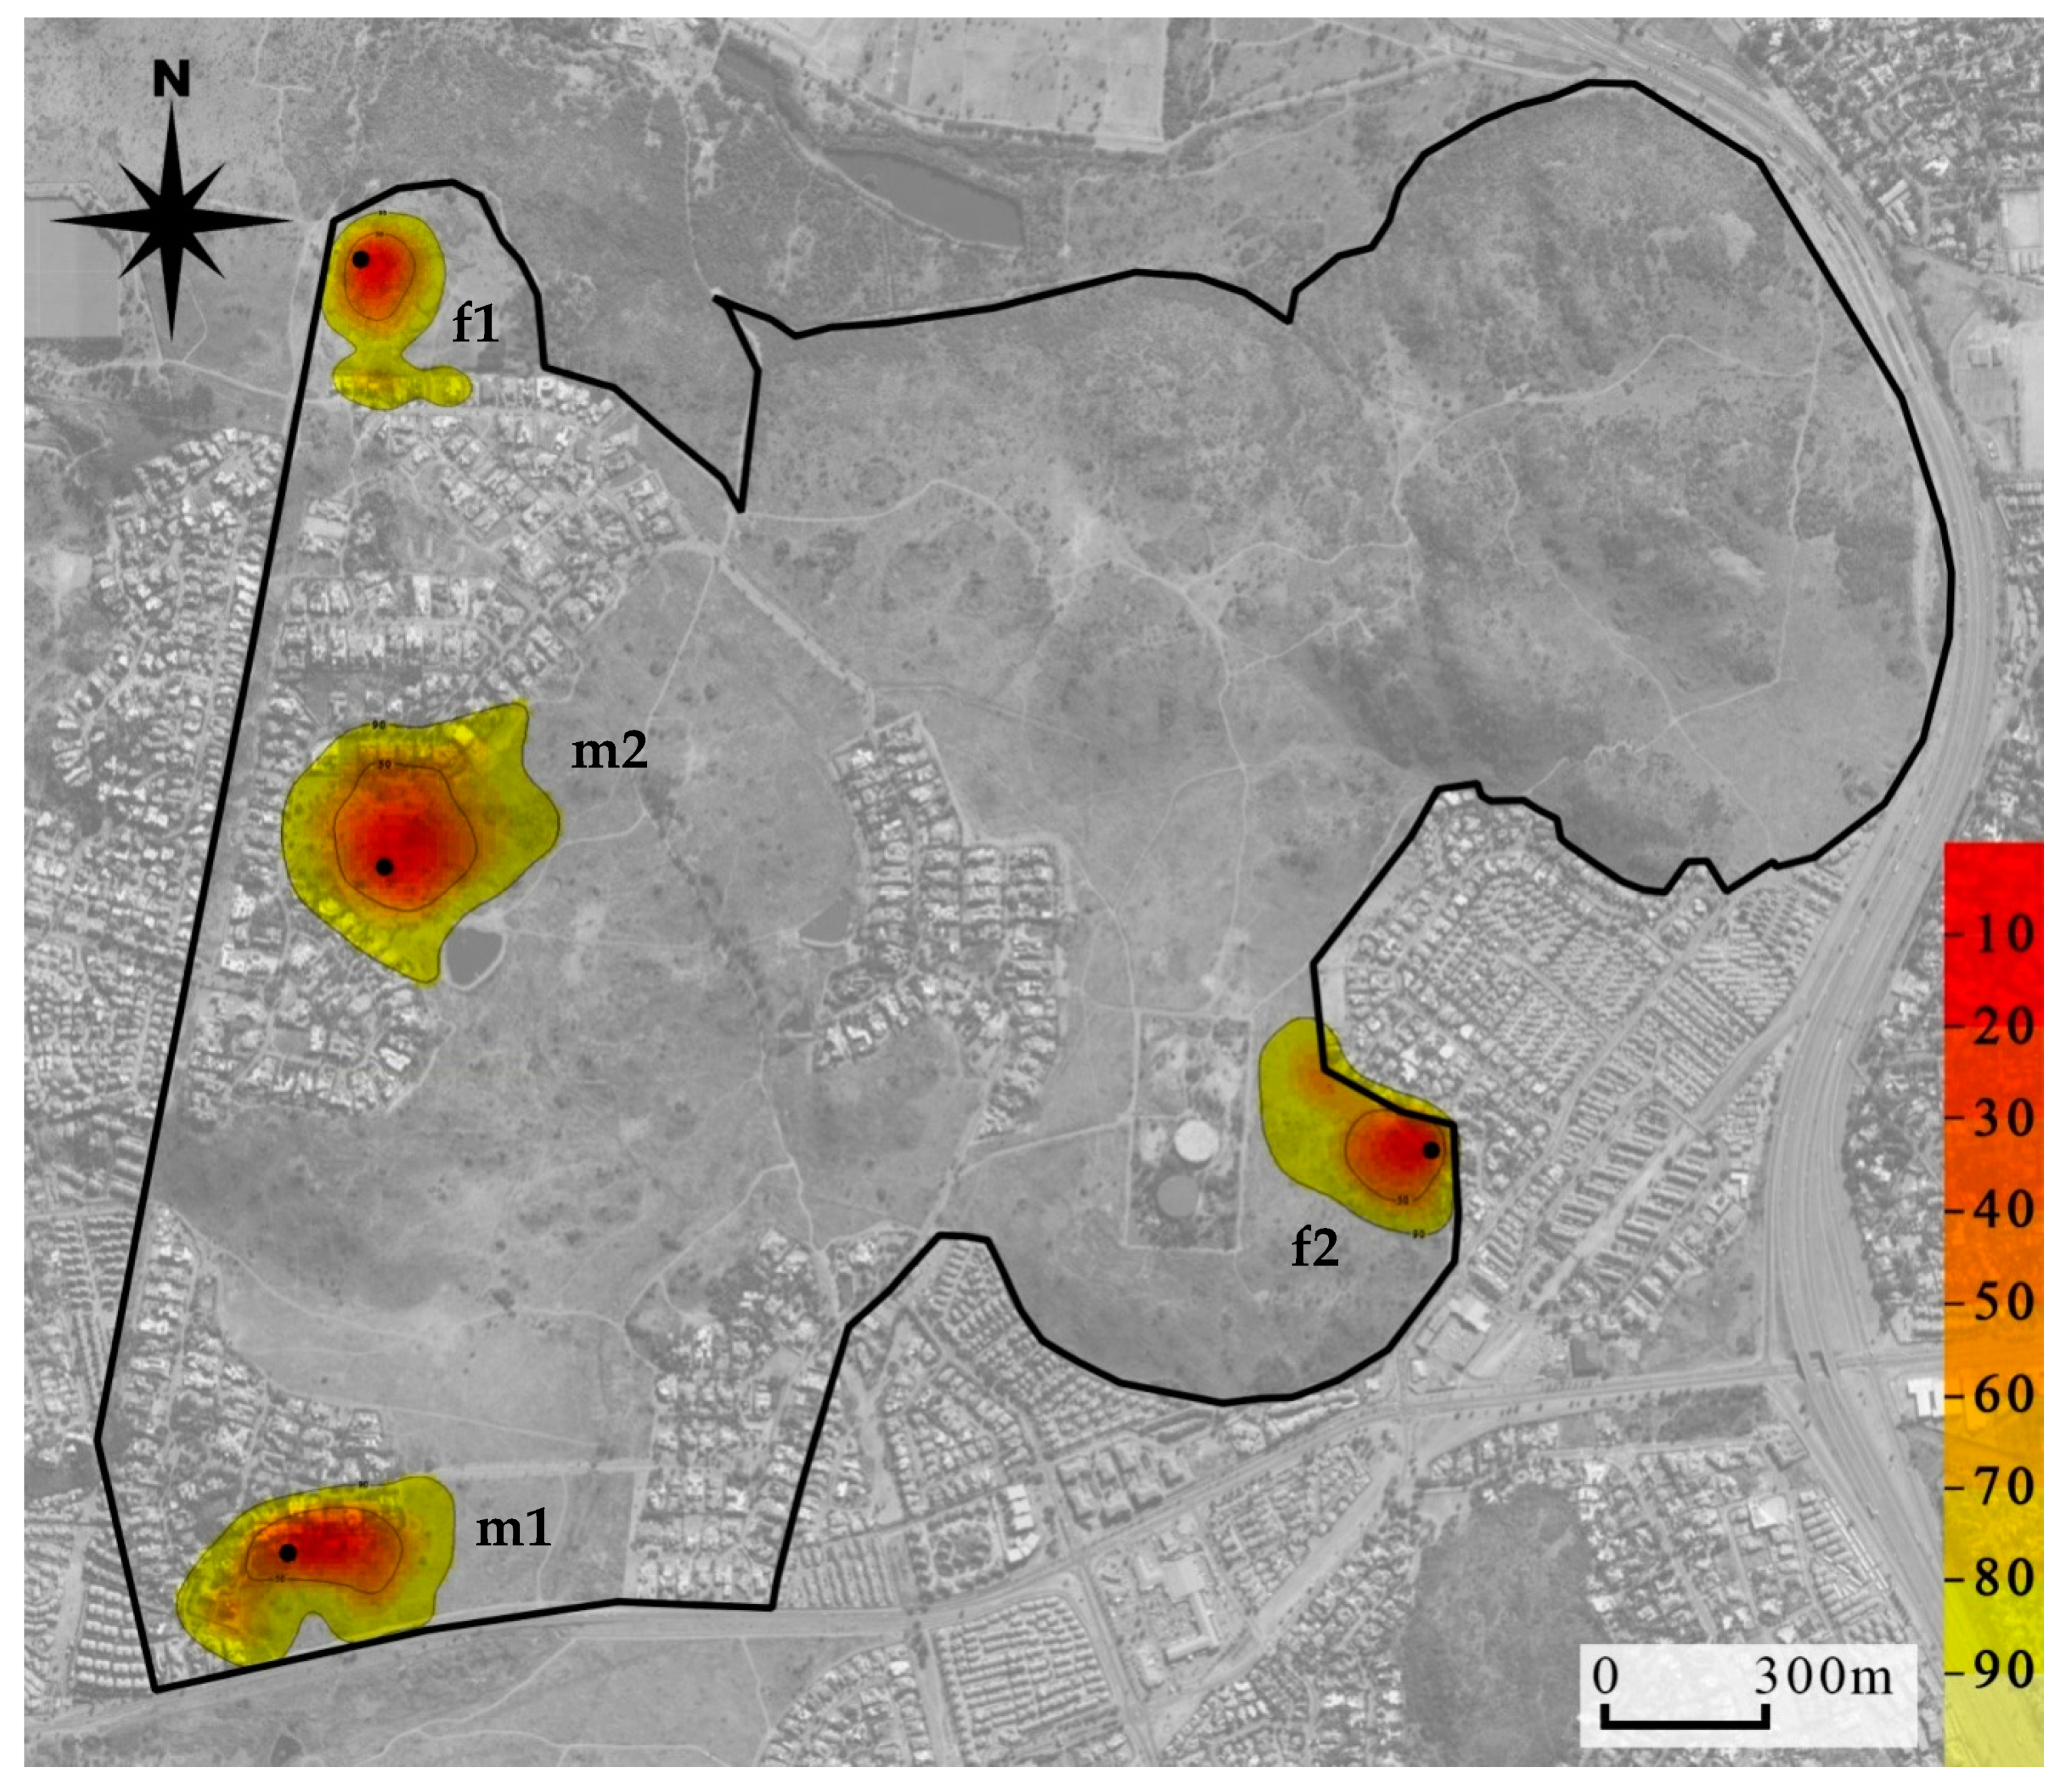
32] reported that home range sizes stabilise within the range of 100–250 GPS fixes, which was achieved for each mongoose in this study for the estimation of overall home range size. Because of the small number of mongooses collared, we qualitatively compared home range sizes between female and male mongooses. We descriptively compared home range sizes by season sampled for each mongoose separately by grouping the months sampled for each individual into seasons. In addition, overlap with human residences (as a percentage of GPS locations found within residential gardens) was compared between seasons to establish variation in use of residential gardens per individual mongoose. Kernel density estimate home range images (showing utilization distribution of the 50% and 90% isopleths) were generated using R, and graphically represented using Quantum GIS (QGIS 3.2 Bonn;
http://www.qgis.org).
4. Discussion
We investigated the ecology of urban-living yellow mongooses. We analyzed the main components of their diet, micro-habitat type use, activity patterns, home range size and overlap with human residences, as well as compared how some of these variables varied seasonally. No such studies have previously been conducted on other mongoose species in an urban setting.
Scat analysis of these urban yellow mongooses showed diets similar to previous studies on non-urban yellow mongooses, with insect (being the most prevalent), mammal, and bird prey present [
17]. In the urban yellow mongoose scat, anthropogenic items occurred more than other food categories after insects. As reported previously in studies of non-urban yellow mongoose (e.g., [
18]), their diet also varied seasonally, particularly for the invertebrates and anthropogenic item food categories, where insect presence was greater in summer than in winter and anthropogenic items presence was greater in winter than in summer. We observed that, as temperatures decreased, mammal and avian occurrences in scat increased while insects decreased, and anthropogenic items increased more than mammals and birds during this period. These results emphasize the importance of human foods in yellow mongoose diet in the study area, particularly during less favorable cold periods, when the availability of their main food (i.e., insects) is reduced [
18]. Unfortunately, in dietary analysis of urban animals, only indigestible items are identified, and any other items that are easily digested (e.g., bread) are not normally accounted for [
33]. Since we were able to identify only human garbage in scat, we propose the use of human food may be underrepresented in our study.
In the urban estate, yellow mongooses occurred more often at sites with open vegetation cover, similar to their non-urban counterparts [
21]; we did not find any seasonal influences on spatial occurrence. Habitat selection and use by carnivores is largely influenced by the abundance and availability of food resources [
12]. For yellow mongooses, open habitat represents favorable conditions for obtaining insects, its main prey, which are most abundant in open grassland areas [
18,
19]. Animals utilizing open habitats should be better able to detect potential risk, and therefore in urban areas (typically considered to have reduced vegetation cover), these species may have a higher tolerance for human disturbance and may habituate to humans [
34], which may also be the case here. In particular, yellow mongooses in our study area tolerate humans [
23]. The number of photographs captured of yellow mongooses was far greater at sites located closer to human residences in the estate. Similarly, stone martens have greater occurrence closer to urban centers (i.e., a greater human presence) and also have a greater occurrence of anthropogenic items in their diets [
7,
8]. Therefore, we suggest that meso-carnivores that occur near to and tolerate human residences have access to anthropogenic food items.
Urban carnivores, typically medium–large carnivores, show shifts in activity patterns, which is largely attributed to temporal avoidance of humans [
1,
9,
15]. In contrast, the yellow mongooses in our study maintained the same diurnal activity patterns, including seasonal variation in active periods, to those of their non-urban counterparts [
21,
35]. We suggest three reasons for this similarity. (1) The yellow mongooses’ tolerance for humans (without any negative consequences) might encourage their use of human residential spaces in daylight. (2) It is possible that the activity of the mongooses’ primary prey, invertebrates, shape their activity profile. (3). It is also likely that the smaller carnivores in urban areas are not persecuted or are more cryptic and hence retain their diurnal behavior whereas larger carnivores, which can pose a threat to humans, change their activity pattern to avoid persecution.
We investigated the home ranges of radio-collared individuals using two methods of analysis: MCP and KDE. In comparison to previous studies (focusing specifically on previously reported MCP 95%, 100% and KDE 95%), these analyses showed that the home range sizes of yellow mongooses in urban areas (average of 11.92 ha) was greatly reduced compared to their non-urban counterparts from studies using similar methods (average home range size of 38.41 ha; [
21,
32,
35,
36]). Numerous studies have reported reduced home range sizes of carnivores in urban areas, attributed to the increase in both population density and resource availability (e.g., [
4,
13,
14]). The population density of yellow mongooses in the estate (30–40/100 ha) was greater than those reported in the non-urban populations in previous studies (for example, 6–7/100 ha reported by [
35]; and 4–14/100 ha reported by [
21,
36]). We do not know whether the reduced home range sizes of yellow mongooses in our study (approximately 69% reduction in home range size) was the result of increased population density and/or increased resource availability, and requires further study. Similar to these previous studies, home range sizes of the two males were larger than those of the two females. Overall, home range sizes were smaller during the breeding period (winter and spring) than in the non-breeding period (summer and autumn; [
21,
32]). Seasonal variation in overall home range size of non-urban yellow mongooses has not been described, and was therefore not considered in this study.
The home ranges of the yellow mongooses overlapped with residential gardens. Their occurrence in residential gardens is likely due to habituation people and also the ease of access to anthropogenic resources (such as bird feeders, garbage bins and pet food; [
1]). While not statistically assessed, the overlap with residential gardens was greatest during colder seasons. This would be expected, since urban animals are reported to supplement their diet in winter with anthropogenically provided foods [
1], which are more likely to be found within residential gardens.
5. Conclusions
Yellow mongooses are recent inhabitants of urban areas in South Africa due to rapid urbanization in the country. We used a multi-pronged approach to provide a comprehensive assessment of the mechanisms the species uses to exploit urban areas. The yellow mongooses demonstrated largely similar characteristics of diet, habitat use and activity patterns to that of their non-urban counterparts. Yet, they clearly exploited anthropogenic resources, which likely represents habituation and acclimatization to urban areas, and showed tolerance of human residents, use of residential gardens, and overall smaller home range sizes, which generally suggests behavioral modifications. Thus, it appears that they have capitalized on their pre-existing adaptations to exploit urban areas and have responded flexibly to urbanization, providing evidence of behavioral adaptation to an urban environment. We do not know whether the changes between urban and non-urban mongoose are due to isolation and genetic change, or simply because of habituation to people. The results of this study warrant further investigation of yellow mongooses in other urban areas, including an assessment of other environmental parameters (e.g., resource availability and distribution) for a better understanding of the habits of this urban meso-carnivore.


