Article

Genome-Wide Association Study of H/L Traits in Chicken

1
Institute of Animal Sciences, Chinese Academy of Agricultural Sciences, Beijing 100193, China
2
State Key Laboratory of Animal Nutrition, Beijing 100193, China
3
School of Life Science and Engineering, Foshan University, Foshan 528000, China
*
Author to whom correspondence should be addressed.
Animals 2019, 9(5), 260; https://doi.org/10.3390/ani9050260
Submission received: 15 April 2019 / Revised: 15 May 2019 / Accepted: 15 May 2019 / Published: 21 May 2019
(This article belongs to the Section Animal Genetics and Genomics)

Abstract

:

Simple Summary

With the continuous increase of intensive agriculture, the poultry industry has developed rapidly. Concurrently, diseases such as avian influenza, salmonella, and Newcastle disease have brought huge losses to the poultry industry. The traditional method of disease prevention and treatment includes vaccinations, but these have been linked to concerns associated with expense and meat safety. To solve these problems, genetic breeding methods can be used. In this paper, a genome-wide association analysis was linked to heterophil/lymphocyte ratio disease-resistance traits as a means through which disease damage can be mitigated.

Abstract

Presently, the heterophil-to-lymphocyte (H/L) ratio is being studied extensively as a disease resistance trait. Through intricate mechanisms to identify and destroy pathogenic microorganisms, heterophils play a pivotal role in the immune defense systems of avian species. To reveal the genetic basis and molecular mechanisms affecting the H/L ratio, phenotypic and H/L data from 1650 white feather chicken broilers were used in performing a genome-wide association study. A self-developed, chicken-specific 55K chip was used for heterophils, lymphocytes, and H/L classification, according to individual genomic DNA profiles. We identified five significant single nucleotide polymorphisms (SNPs) when the genome-wide significance threshold was set to 5% (p < 2.42 × 10⁻⁶). A total of 15 SNPs obtained seemingly significant levels (p < 4.84 × 10⁻⁵). Gene annotation indicated that CARD11 (Caspase recruitment domain family member 11), BRIX1 (Biogenesis of ribosomes BRX1), and BANP (BTG3 associated nuclear protein) play a role in H/L-associated cell regulation and potentially constitute candidate gene regions for cellular functions dependent on H/L ratios. These results lay the foundation for revealing the genetic basis of disease resistance and future marker-assisted selection for disease resistance.

1. Introduction

With the continuous expansion of the poultry industry, production continues to be plagued with problems associated with disease. Although vaccination programs have dramatically reduced the incidence of many diseases and controlled the most prominent acute infections, they have not adequately addressed all infectious diseases [1]. Through systematic efforts, the combined impact of vaccination strategies, optimal nutrition, and genetic improvement, impressive increases in disease protection have been achieved. However, excessive use of vaccination and drugs in production is expensive and raises concerns for meat safety. Further improvement in the intrinsic resistance to disease, obtainable through the application of genetic principles and techniques, is desirable.
Avian heterophils, which are widely present in the peripheral blood of poultry, are equivalent to mammalian neutrophils in their defense-associated role against external pathogenic microorganisms [2]. Although avian heterophils are synonymous with animal neutrophils in their purpose, heterophils and neutrophils function in significantly differently ways [3,4]. Firstly, as heterophils do not secrete peroxidase and alkaline phosphatase, their antibacterial action is exerted through a non-oxidative deamination mechanism with selective cytokine activation [5]. Secondly, heterophils are capable of cell degranulation, oxidative burst, and phagocytosis. Pattern recognition receptors on the surface of heterophils interact with pathogens, recognize and exert phagocytosis, and secrete a large number of cytokines, such as beta defense molecules and leukotriene B4, and chemokines. This activates other immune defense pathways, thereby exerting immunity against disease [6,7,8].
Disease resistance in chicken can be improved through genetic selection for immunocompetence [9]. Generalized resistance to disease in birds is influenced by genetic and environmental factors, and involves both innate and acquired immunity; the latter being influenced by environmental factors to a greater degree. Lymphocytes are involved in acquired immunity [10]. As a simple index, the heterophil/lymphocyte (H/L) ratio in blood reflects immune system status [11]. Antibody titers [12] and circulating lymphocyte and macrophage numbers decrease, while the heterophil concentration increases in response to immunological challenges when low H/L ratios are observed [13].
Cell counts from blood smears have long been used to evaluate health parameters in animals. In most studies using leukocyte profiles, the focus was on the H/L ratio because this index reflects the dynamic between the main cell types [14]. The H/L ratio was initially suggested to be an indicator of stress [2], since this ratio is seen to increase when chickens are stressed. The increase in the H/L ratio has been shown to be more striking in response to the first, rather than a second, imposed stress [2]. The H/L ratio has also been used as a selection criterion for response to the Newcastle disease vaccine and general resistance to heat stress [15]. In addition, since the H/L ratio changes with different environments [16] and is associated with baseline corticosterone levels in adult birds, it is recognized as an indicator of animal welfare [17]. Consequently, following stress on the body, the change in the H/L ratio can be used as a stress index, since it is associated with body strength and stress resistance [18]. The current study is based on white feather broiler chickens farmed at the Foshan Gaoming District Xinguang Agriculture and Animal Husbandry Co., Ltd. (Foshan, China). General disease resistance mechanisms associated with the H/L ratio are poorly understood. Therefore, in order to lay the foundation for further analysis into the molecular mechanisms of the H/L ratio and subsequent molecular marker-assisted selection of breeding pairs, genomic DNA typing was achieved using a self-developed 55K single nucleotide polymorphism (SNP) chip (Beijing Compass Biotechnology Co., Ltd., Beijing, China) and a genome-wide association study (GWAS) performed in white feather broiler chicken. In performing the GWAS, monocyte, lymphocyte, heterophil, and H/L ratio data were used to identify quantitative trait loci or functional genes that affect each cell type.

2. Materials and Method

2.1. Experimental Animals

The work was approved by the Animal Management Committee of the Institute of Animal Sciences, Chinese Academy of Agricultural Sciences (IAS-CAAS, Beijing, China). Ethical approval on animal survival was given by the animal ethics committee of IAS-CAAS (approval number: IASCAAS-AE20140615).
The experimental cluster is represented by the white feather broiler B line ancestral chicken of the Guangdong Foshan Xinguang Agriculture and Animal Husbandry Co., Ltd. Raised at the same facility, the resource groups were used for breeding purposes.
The chickens were reared in a fully enclosed, shaded chicken house. The house temperature was 34 to 35 °C the first day. The difference between day and night temperatures did not exceed 1 °C. The temperature was decreased by 1 °C every three days and 2 °C per week until room temperature was achieved. The chickens were exposed to 24 hours of light for three days, 23 hours of light on the fourth day, and a 1 hour decrease in light every two days until natural lighting was achieved. Humidity in the chicken house was maintained at 70–80%. Floor space available was 1 m2 per 3 chickens. Using corn–soybean-type diets, the nutritional levels of each generation remained unchanged. Blood was collected from the wing vein at 42 days of age with anticoagulation, achieved using anticoagulant citrate dextrose 1.32% (M/V), sodium citrate (M/V), 0.48% (M/V) citric acid, and 1.47% (M/V) glucose. Anticoagulated blood samples were stored at −20 °C for genomic DNA extraction. H/L traits were individually measured at 42 days of age.

2.2. Phenotypic Measurement

At 42 days of age, two glass slides were each smeared on a single side with 10 μL of blood, freshly obtained from the lower part of the chicken’s wing. Slides were air-dried and dyed with May–Grunwald–Giemsa stain. One hundred leukocytes, including granular (heterophils) and nongranular (lymphocytes and monocytes) components, were counted on one slide for each bird and the heterophil-to-lymphocyte ratio calculated [19]. All statistics were performed using SAS 9.2 (SAS Institute, Inc., Carly, NC, USA). Data that did not have a normal distribution underwent box–cox transformation [20].

2.3. Genotyping and Quality Control

Blood samples were obtained using standard venipuncture techniques. Genomic DNA was extracted from blood samples, using a standard phenol/chloroform method and genotyped with a 55K Affymetrix Axiom Chicken Genotyping Array (Affymetrix, Inc. Santa Clara, CA, USA). Genotype quality control was performed with PLINK 1.9 [21]. Samples and SNPs with call rates lower than 90% were excluded. SNP data quality indicators included the exclusion of individuals with a genotype deletion greater than 10% and SNPs with a minimum allele frequency of less than 1%. SNPs were also excluded when the deletion rates in the case and control groups were significantly different (p < 10%). High quality, raw genotypic data are critical to the success of a GWAS analysis. The effectiveness of the research is greatly reduced if even typing errors are as low as 1%.

2.4. Genome-Wide Association Analysis

Because false associations may be due to the presence of cryptographic correlations or hidden population stratification, a simple method was used to correct the number of multiple tests needed to determine the threshold for the whole genome significant/implicit association. Prior to the GWAS, principle component analysis (PCA) was performed in PLINK 1.07 [22]. Using this approach, we obtained 20,668 recommended independent tests. The genome-wide and implied p values were 2.42 × 10⁻⁶ and 4.84 × 10⁻⁴, respectively.
We initially performed a univariate GWAS by applying a linear mixed model to account for associations between H/L and effective SNPs, using GEMMA [23]. The statistical model applied in this study is as follows:
y = Wα + xβ + u + ε
In this expression, y denotes the phenotypic values of n samples, while W refers to a covariance matrix used to control population structure, α denotes a vector of corresponding effects that comprise the intercept, x denotes the marker genotypes, β refers to the effects of the corresponding markers, u is a vector of random polygenic effects, and ε is a vector of random residuals.

2.5. Gene Identification and Annotation

Annotated genes and associated SNPs whose p values were found to be significant by GWAS analysis following correction were identified as candidate genes [24]. BioMart was used to detect genes in specific genomic regions [25]. This software has the Gallus genome version, which is supported by the Ensemble box NCBI [26].

3. Results

3.1. Phenotypic Description and Genetic Parameters

Means and standard deviations for H/L, monocytes, heterophils, and lymphocytes are presented in Table 1. Data that did not have a normal distribution underwent box–cox transformation.

3.2. Population Structure
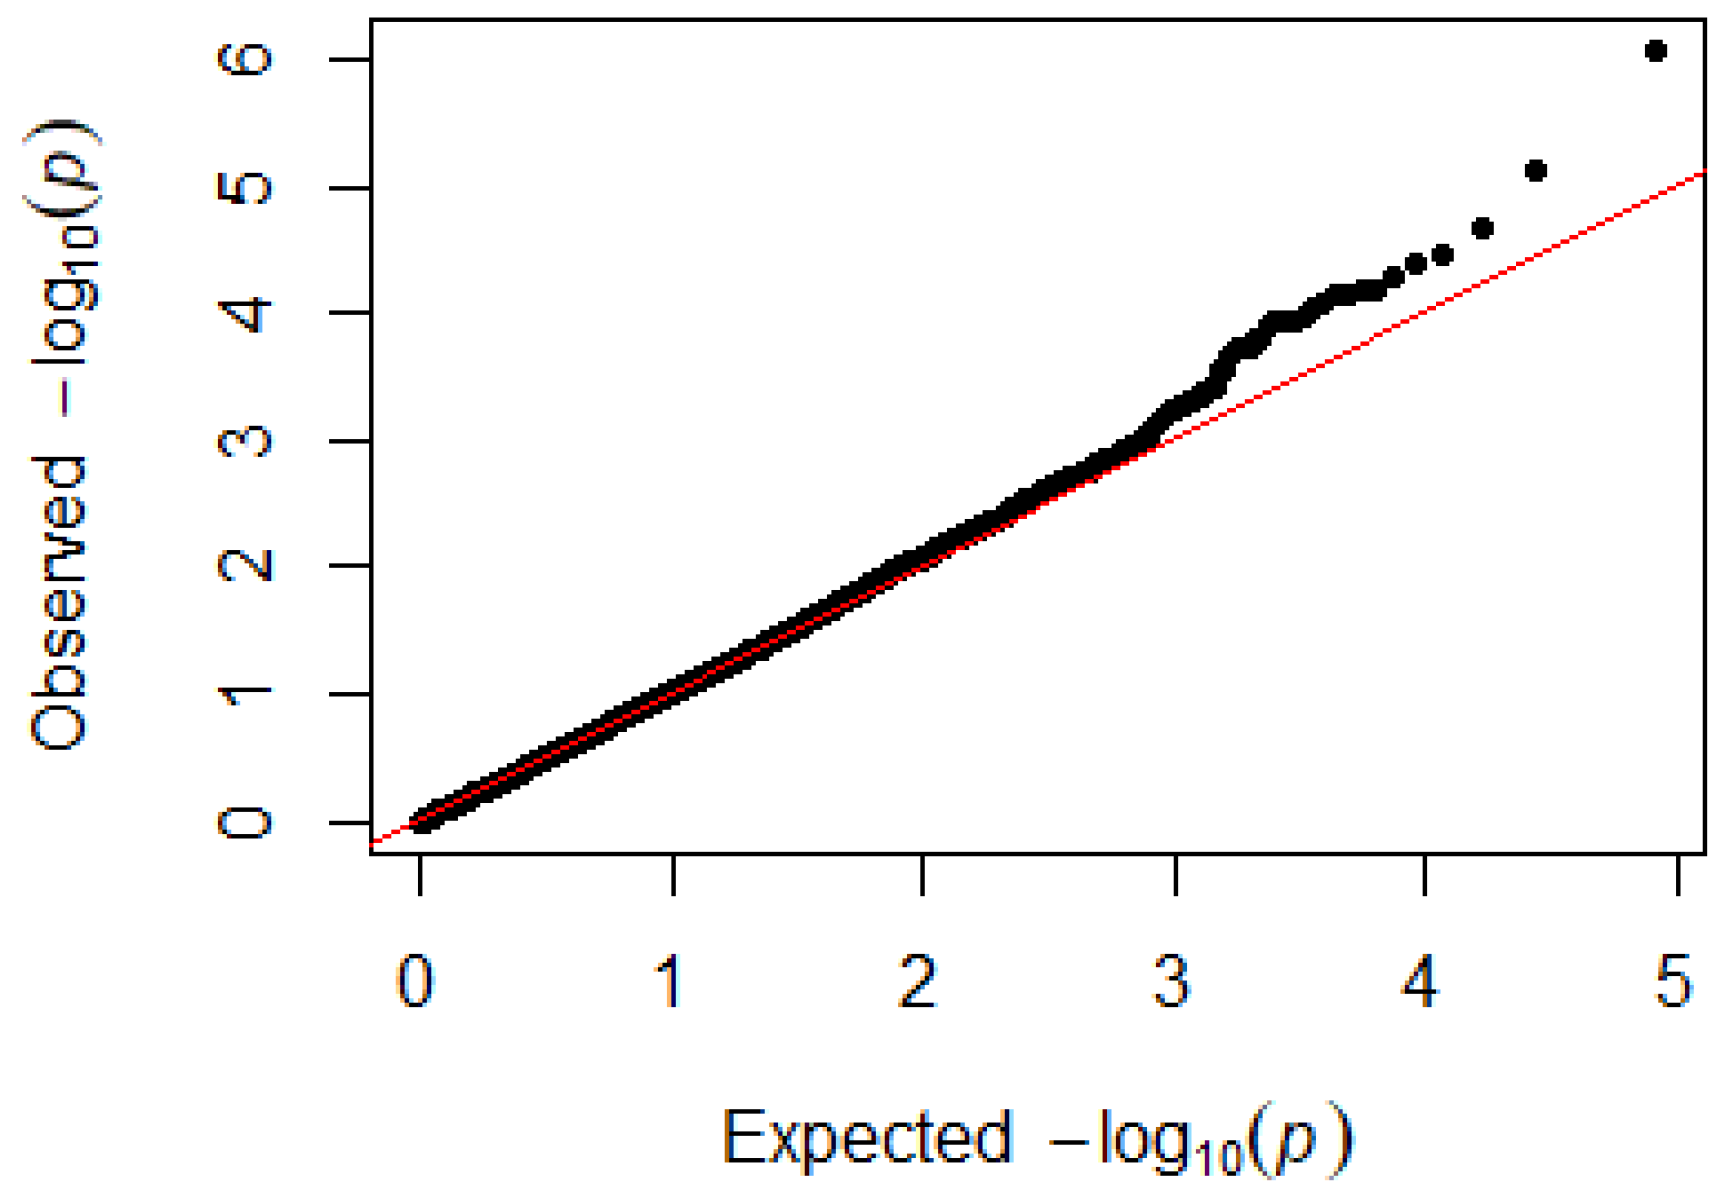
Since GEMMA (v. 0.98, University of Michigan, Ann Arbor, Michigan, USA) is based on the hybrid model and cannot avoid the group stratification problem, it is necessary to conduct stratified tests on the test population. Q–Q plots performed on the three traits indicated that the χ2 distribution calculated by SNP correlation analysis did not deviate from the null hypothesis test distribution. The χ2 value of the significant SNP locus observations is above the expected χ2 value. This showed that there was no group stratification in the population under study and that the correlation analysis results of this analytical method were reliable (Figure 1, Figure 2, Figure 3 and Figure 4).

3.3. H/L Ratio

It was found that two SNPs were significantly associated with the H/L ratio. The most significant of these is located on chromosome 14 and associated with CARD11 (Caspase recruitment domain family member 11). A second SNP is presumably associated with the H/L ratio. Specific details concerning SNPs identified as being linked to the H/L ratio and their associated genes are shown in Table 2. The Manhattan plot for the H/L ratio is shown in Figure 5.

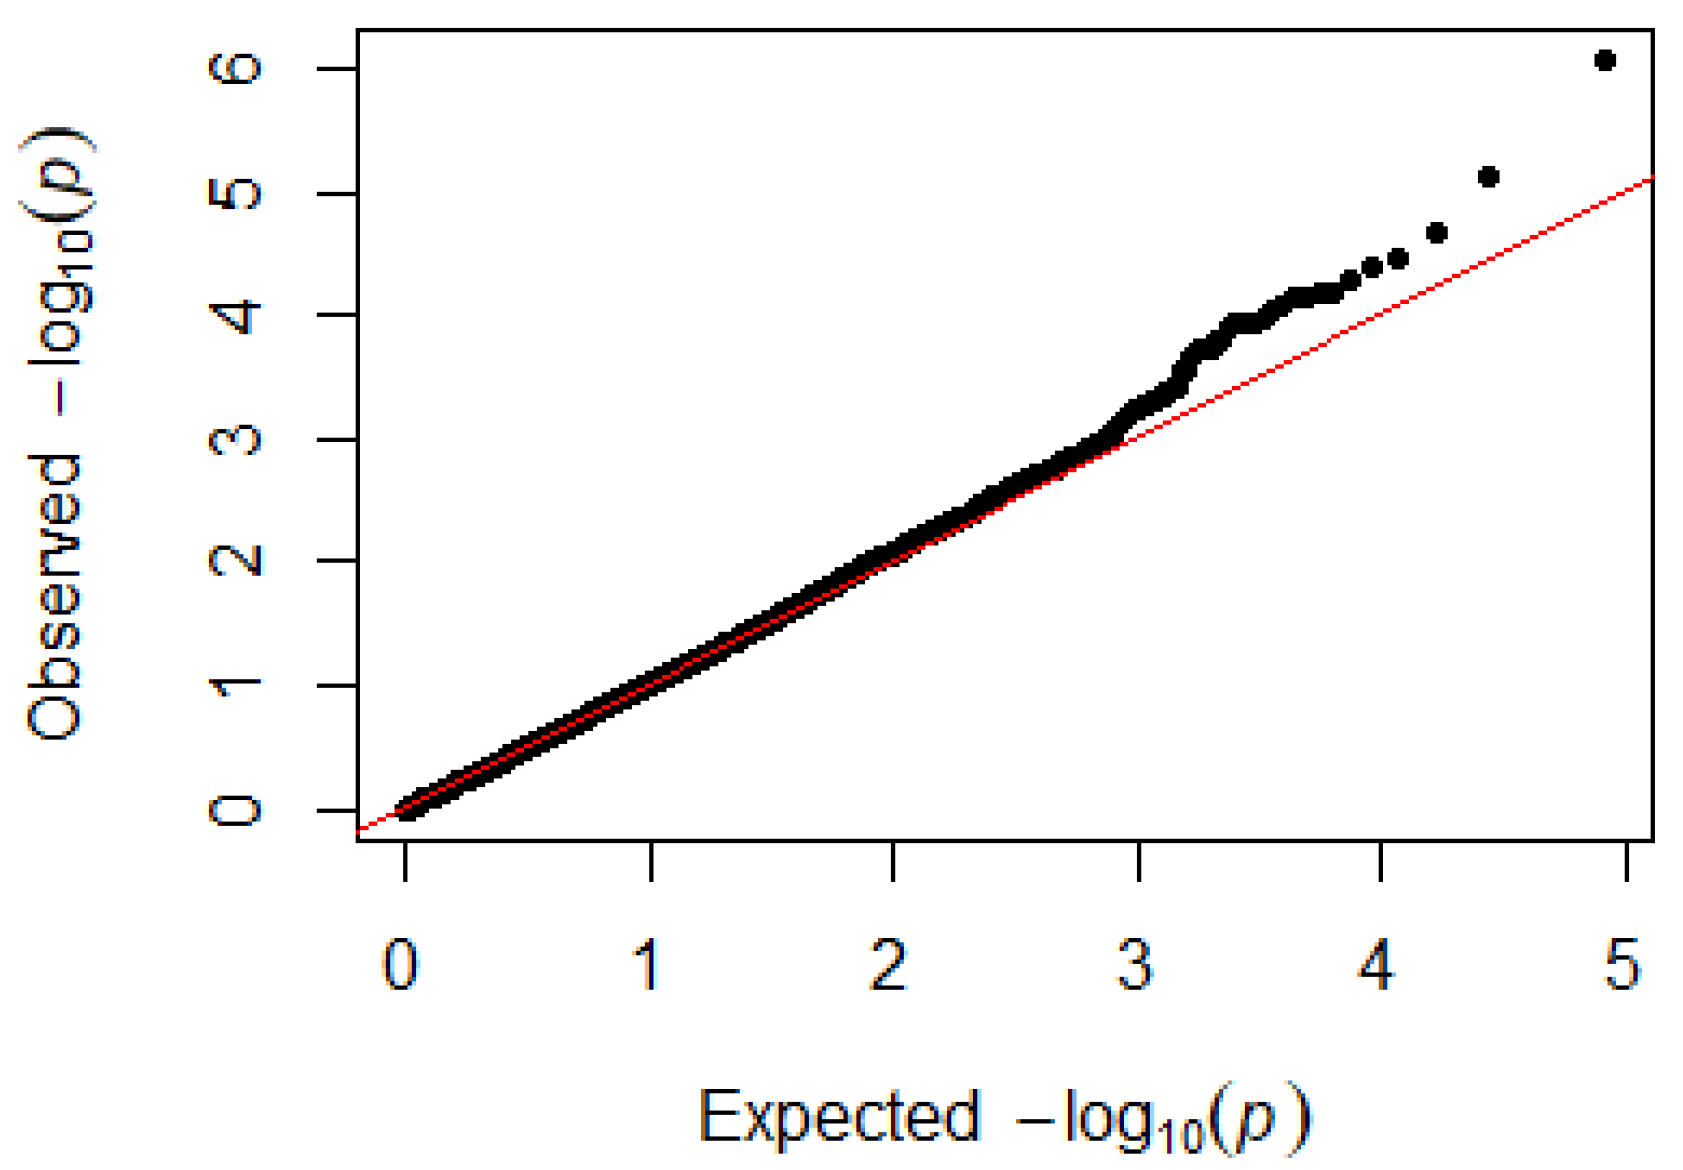
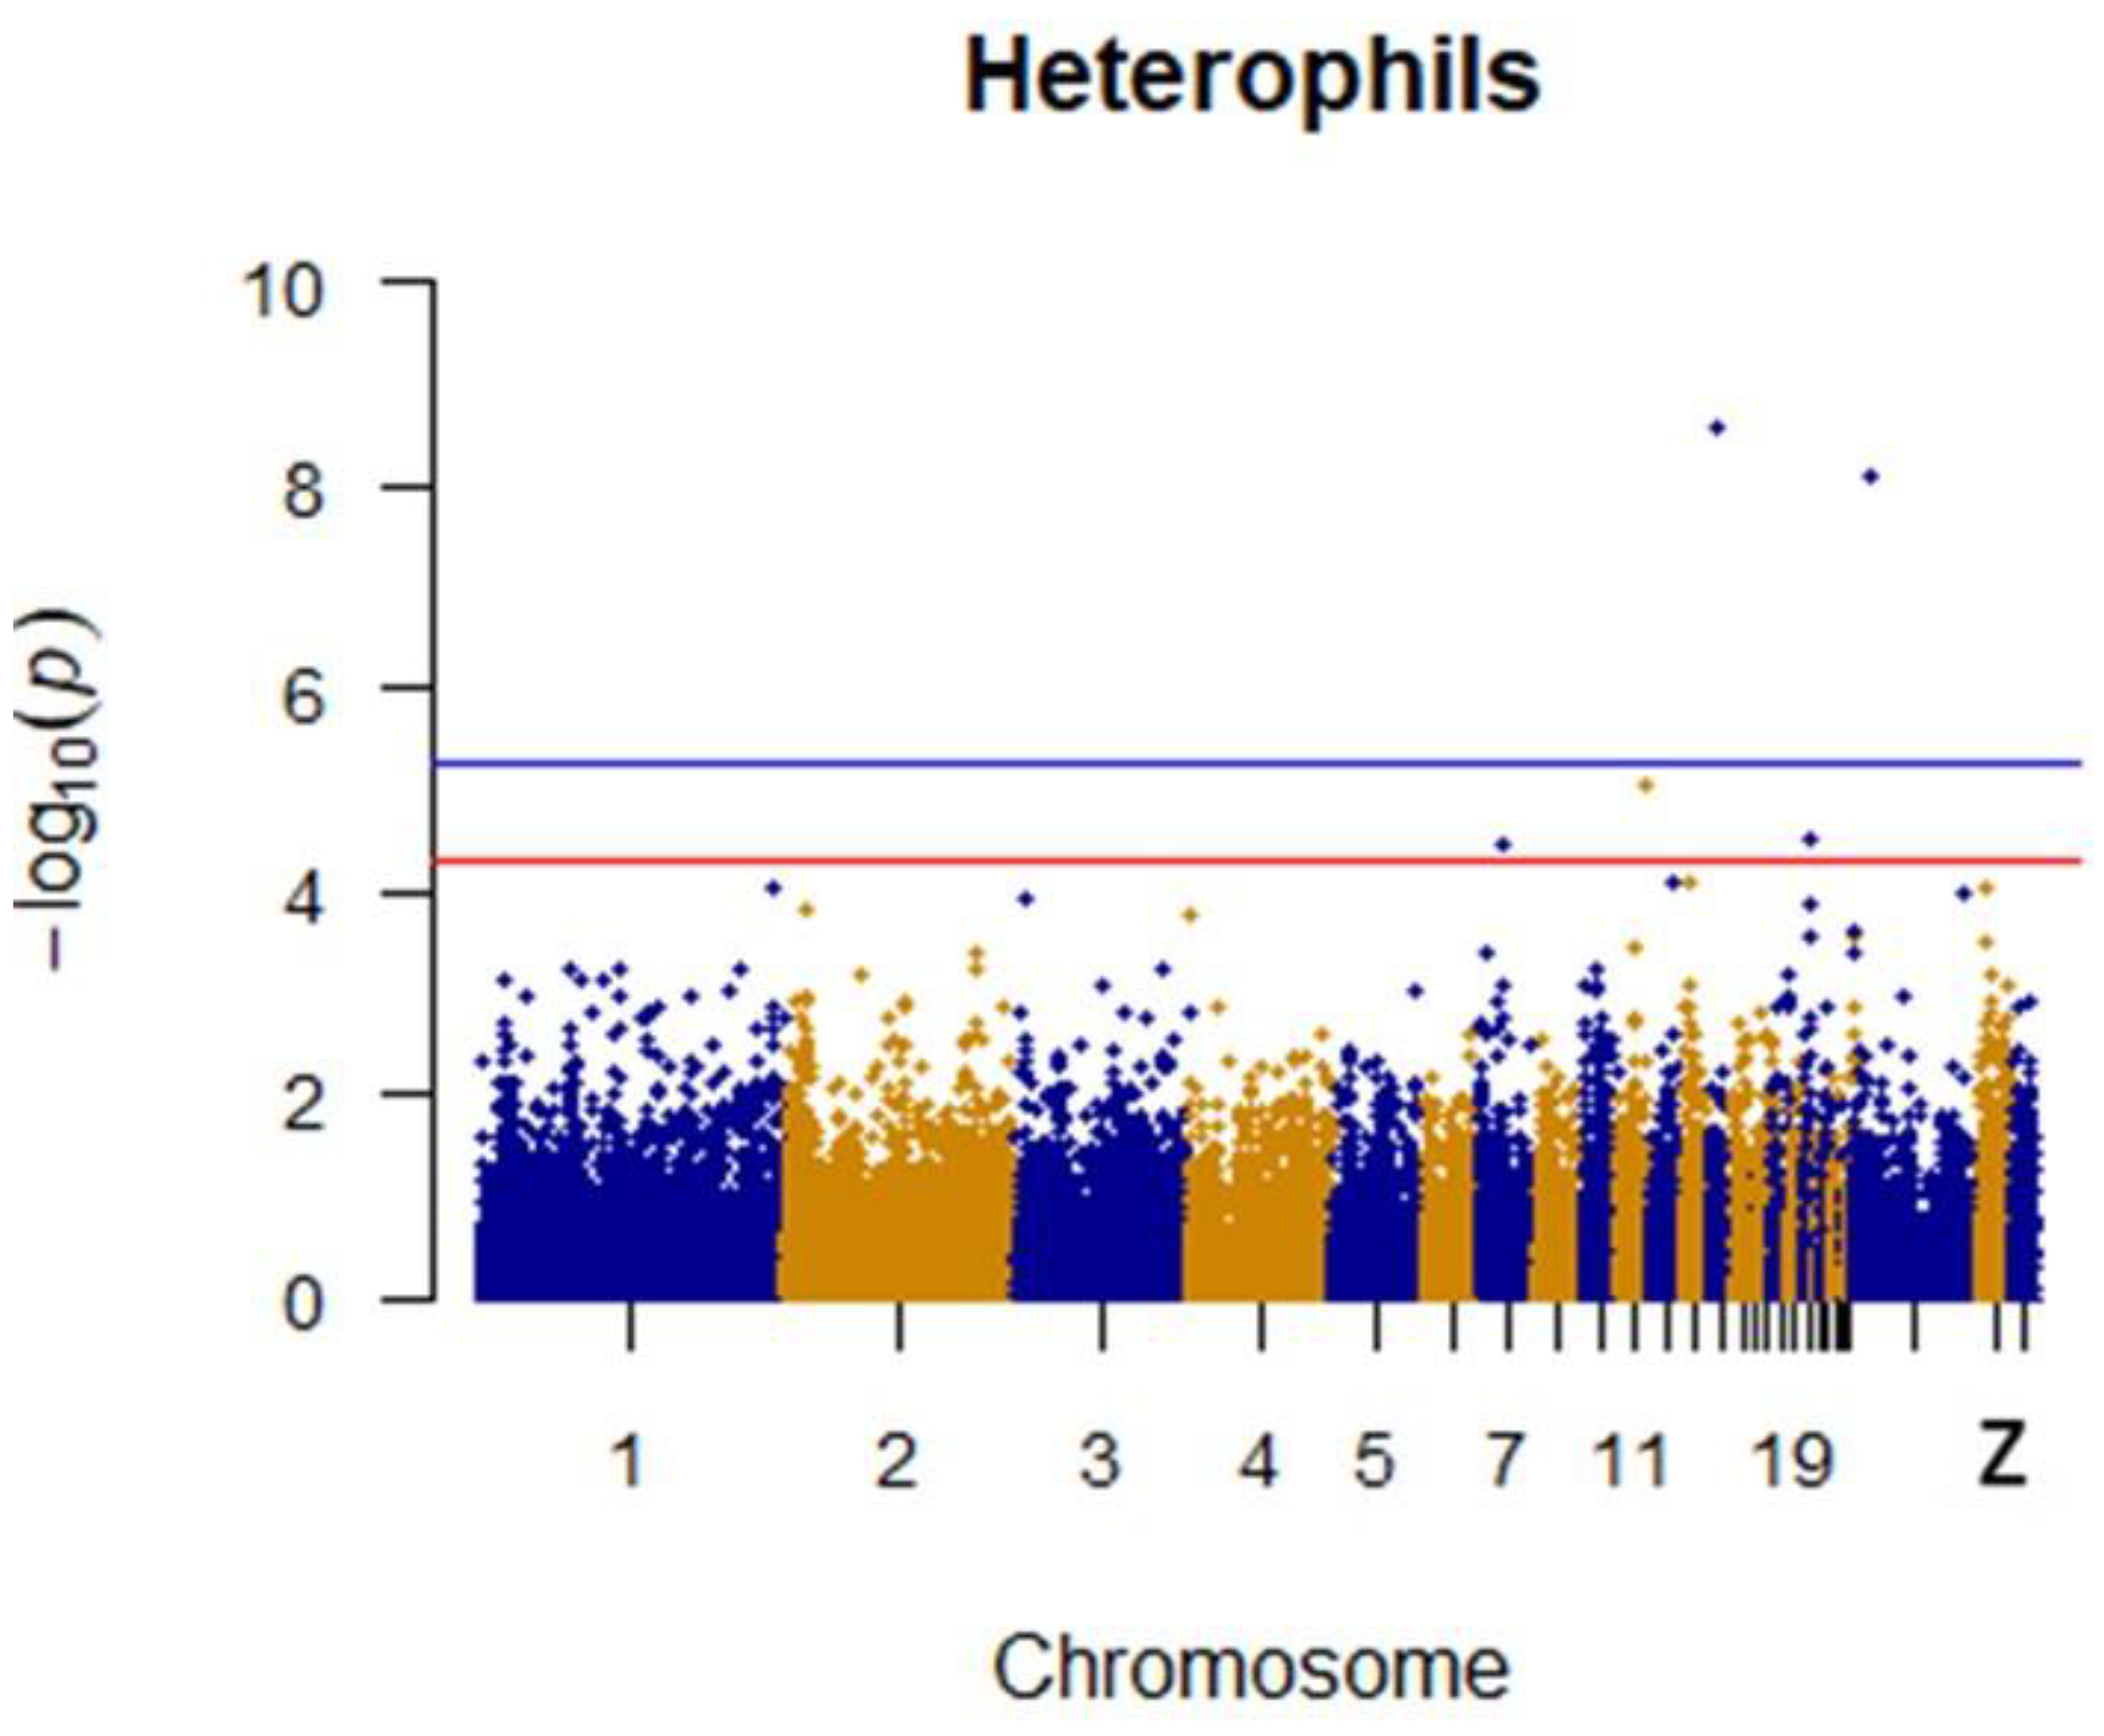
3.4. Heterophils and LYMPHOCYTES

After quality control, a total of 1500 42-day-old broiler chickens were analyzed. Manhattan mapping revealed one SNP on chromosome 2 and one SNP on chromosome 3 that were significantly associated with heterophils. A further three SNPs were located on chromosomes 14, Z, and 11. Two heterophil-associated genes were found. Located on chromosome 1 and the Z chromosome, respectively, two novel SNPs were significantly associated with lymphocytes. Two SNPs located on chromosomes 14 and 21 appeared to be associated with lymphocytes. Specific details are shown in Table 3. Manhattan plots for heterophils and lymphocytes are shown in Figure 6 and Figure 7, respectively.

3.5. Monocytes

Two SNPs significantly associated with monocytes and two SNPs with suggestive associations to monocytes were located on chromosomes 9, 6, and 5. SNPs on chromosome 6 were linked to multiple loci, which included the TMEM26(Transmembrane protein 26) and RHOBTB1(Rho related BTB domain containing 1). Specific details are shown in Table 4. The Manhattan plot for monocytes is shown in Figure 8.

4. Discussion

The H/L ratio in chicken peripheral blood has been widely accepted as a reliable and accurate physiological indicator of chicken stress response [15]. With high or low temperature, excessive NH3 exposure, bacterial infection, and other stress reactions, the number of lymphocytes decreases while the number of heterophils increases [27,28]. The number and proportion of heterophils and lymphocytes are highly heritable, with a heritability estimated to exceed 0.5 [29], indicating that these traits should respond well to selection. In this study, one fairly correlated SNP and two significantly associated SNPs were linked to the H/L ratio. The SNP with the most significant association to the H/L ratio is located 103.4 kb downstream of the CARD11 gene on chromosome 14. The protein encoded by this gene belongs to the membrane-associated guanylate kinase family, a class of proteins that are used as molecular scaffolds. Polyprotein complexes are assembled in specific regions of the plasma membrane. This protein is likewise a member of the CARD protein family, as defined by carrying a characteristic caspase-associated recruitment domain (CARD). This protein has a domain structure similar to the CARD14 protein. The CARD domain of both proteins has been shown to specifically interact with BCL10 [30], a protein that has been recognized for acting as a positive regulator of apoptosis and NF-κB (Nuclear factor kappa B subunit 1) activation [31,32]. When expressed in cells, BCL10 activates NF-κB and induces phosphorylation of BCL10 [30,33,34]. Siwekidentified CARD11 as a candidate gene for the quantitative trait locus linked to the immune response in chicken [35]. Slawinska echoed this finding [36].
Another significant site located 0.3 kb downstream of the BRIX1 (Biogenesis of ribosomes BRX1) gene on the Z chromosome was found. BRIX1 (ribosomal biogenesis protein BRX1) is a protein-coding gene associated with the gastric cancer network pathway and neural development of the chicken brain [37].
There is also a suggestion that a heterophil-associated SNP is located in an intronic region of the BANP gene on chromosome 11. This gene encodes a protein that binds to the matrix attachment region to form a complex with p53. So doing, it negatively regulates p53 transcription and acts as a tumor suppressor and cell cycle regulator. Binding to the scaffold/matrix attachment region β occurs in an ATC-rich DNA sequence, located upstream of the T cell receptor β enhancer region. V(D)J recombination during T cell development is controlled by inhibition of the T cell receptor β enhancer function. By recruiting HDAC1(Histone deacetylase 1) to its promoter region, H3K9ac, H3S10ph, and H4K8ac levels are reduced to inhibit cyclin D1 transcription. This promotes phosphorylation and nuclear accumulation of TP53 Ser-15, leading to cell cycle arrest by similarity [38].
In addition, an SNP that was significantly associated with lymphocytes is located 252.4 kb upstream of C1H21ORF91 on chromosome 1 and is involved in staphylococcal toxemia [39].
The nearest gene to one of the SNPs that is significantly associated with monocytes is EPHA4. This gene belongs to the heparin receptor subfamily of the protein–tyrosine kinase family. EPH receptor-associated molecules are involved in mediating developmental events, particularly in the nervous system. Diseases associated with EPHA4 (Ephrin type-A receptor 4) include lung mucoepidermoid carcinoma and Duane retraction syndrome [40].
TMEM26 (Transmembrane protein 26), which encodes a protein containing multiple transmembrane helices, was also described as being linked to the SNP significantly associated with monocytes. It is a selective surface protein marker for beige fat cells that can coexist with classical brown fat cells in brown adipose tissue [41].
A third monocyte-associated SNP was located 10.0 kb upstream of RASA2 (RAS P21 protein activator 2). The protein encoded by this gene is a member of the general amino-acid permease 1 family of GTP1 (Guanosine triphosphate1) activating proteins. This gene product stimulates GTPase (Guanosine triphosphate enzyme) activity in normal RAS p21 molecules, but does not stimulate its carcinogenic counterpart. As an inhibitor of RAS function, this protein enhances the weak intrinsic GTPase activity of the RAS protein, resulting in an inactive GDP binding form of RAS, which controls cell proliferation and differentiation [42].
On chromosome 6, TMEM26 and RHOBTB1 were identified as genes linked to the monocyte-associated SNPs. While TMEM26 encodes proteins containing multiple transmembrane helices, which act as selective surface protein markers for brown/beige fat cells that can coexist with classical brown fat cells in brown adipose tissue [41,43,44], the protein encoded by RHOBTB1 belongs to the Rho family of the small GTPase superfamily. It contains a GTPase domain, a proline-rich region, a tandem of two BTB (wide complex, tram, and bric-a-brac) domains, and a conserved C-terminal region. This protein plays a role in small GTPase-mediated signal transduction and organization of the actin filament system [38]. In this region, these two genes appear frequently, and are reportedly associated with genes linked to feed conversion rate and eggshell weight [45].
The final SNP site under discussion is located 18.9 kb downstream of the PID1 (Phosphotyrosine interaction domain containing 1) gene and is associated with an increased proliferation of pre-adipocytes without affecting adipocyte differentiation [46].

5. Conclusions

In conclusion, considering their physical location and biological function, the four novel genes identified in this study appear to be promising candidate genes for H/L-associated traits. Chromosome 6 may also be an important candidate region for monocytes. Due to its connection to desirable immune traits, results from this study may be useful for subsequent studies to reveal the mechanism of action associated with the H/L ratio. Since the measurement of the H/L ratio from blood smears is simple and inexpensive, individuals with low H/L ratios can be readily identified for selection and, along with other desirable traits, contribute to improved disease resistance. Future experiments should include replicating the candidate genes identified in this study to provide transcriptomic data from artificial infection experiments.

Author Contributions

B.Z. performed the study; R.L. and M.Z. contributed to the interpretation of data; Q.L., J.W., and G.Z. contributed to the design of the study; Q.L. and G.Z. contributed to the design of the study and modifying the manuscript.

Funding

This research was funded by the National High-Tech R&D Program (2015BAD03B03), China Agriculture Research System (CARS42) and the Agricultural Science and Technology Innovation Program (ASTIPIAS04) of the Chinese Academy of Agricultural Sciences.

Conflicts of Interest

The authors declare no conflict of interest.

References

  1. Sarker, N.; Tsudzuki, M.; Nishibori, M.; Yamamoto, Y. Direct and correlated response to divergent selection for serum immunoglobulin M and G levels in chickens. Poult. Sci. 1999, 78, 1–7. [Google Scholar] [CrossRef] [PubMed]
  2. Gross, W.B.; Siegel, H.S. Evaluation of the heterophil/lymphocyte ratio as a measure of stress in chickens. Avian Dis. 1983, 27, 972–979. [Google Scholar] [CrossRef]
  3. Stabler, J.G.; McCormick, T.W.; Powell, K.C.; Kogut, M.H. Avian heterophils and monocytes: Phagocytic and bactericidal activities against Salmonella enteritidis. Vet. Microbiol. 1994, 38, 293–305. [Google Scholar] [CrossRef]
  4. Kogut, M.H.; Hsin-I, C.; Swaggerty, C.L.; Pevzner, I.Y.; Huaijun, Z. Gene expression analysis of toll-like receptor pathways in heterophils from genetic chicken lines that differ in their susceptibility to salmonella enteritidis. Front. Genet. 2012, 3, 121. [Google Scholar] [CrossRef]
  5. Genovese, K.J.; He, H.; Swaggerty, C.L.; Kogut, M.H. The avian heterophil. Dev. Comp. Immunol. 2013, 41, 334–340. [Google Scholar] [CrossRef]
  6. Al-Murrani, W.K.; Al-Rawi, I.K.; Raof, N.M. Genetic resistance to Salmonella typhimurium in two lines of chickens selected as resistant and sensitive on the basis of heterophil/lymphocyte ratio. Br. Poult. Sci. 2002, 43, 501–507. [Google Scholar] [CrossRef]
  7. Dijk, A.V. Chicken heterophils are recruited to the site of Salmonella infection and release antibacterial mature Cathelicidin-2 upon stimulation with LPS. Mol. Immunol. 2009, 46, 1517–1526. [Google Scholar] [CrossRef] [PubMed]
  8. Kogut, M.H. Expression and function of Toll-like receptors in chicken heterophils. Dev. Comp. Immunol. 2005, 29, 791–807. [Google Scholar] [CrossRef]
  9. Maxwell, M.H.; Robertson, G.W. The avian heterophil leucocyte: A review. World’s Poult. Sci. J. 1998, 54, 155–178. [Google Scholar] [CrossRef]
  10. Dehnhard, N.; Quillfeldt, P.; Hennicke, J.C. Leucocyte profiles and H/L ratios in chicks of Red-tailed Tropicbirds reflect the ontogeny of the immune system. J. Comp. Physiol. B Biochem. Syst. Environ. Physiol. 2011, 181, 641–648. [Google Scholar] [CrossRef]
  11. Lentfer, T.L.; Pendl, H.; Gebhardt-Henrich, S.G.; FroHlich, E.K.F.; Von Borell, E. H/L ratio as a measurement of stress in laying hens—Methodology and reliability. Br. Poult. Sci. 2015, 56, 157–163. [Google Scholar] [CrossRef]
  12. Zhang, L.; Li, P.; Liu, R.R.; Zheng, M.Q.; Sun, Y.; Wu, D.; Zhao, G.P.; Wen, J. The identification of loci for immune traits in chickens using a genome-wide association study. PLoS ONE 2015, 10, e0117269. [Google Scholar] [CrossRef]
  13. Bayona, J.A.M.; Karuppannan, A.K.; Barreda, D.R. Contribution of leukocytes to the induction and resolution of the acute inflammatory response in chickens. Dev. Comp. Immunol. 2017, 74, 167–177. [Google Scholar] [CrossRef]
  14. Pieper, J.; Locke, M.; Ruzaike, G.; Voigt, S.; Methner, U.; Berndt, A. In vitro and in vivo generation of heterophil extracellular traps after Salmonella exposure. Vet. Immunol. Immunopathol. 2017, 188, 1–11. [Google Scholar] [CrossRef]
  15. Al-Murrani, W.K.; Kassab, A.; Al-Sam, H.Z.; Al-Athari, A.M.K. Heterophil/lymphocyte ratio as a selection criterion for heat resistance in domestic fowls. Br. Poult. Sci. 1997, 38, 159–163. [Google Scholar] [CrossRef]
  16. Mutibvu, T.; Chimonyo, M.; Halimani, T. Tonic immobility, heterophil to lymphocyte ratio, and organ weights in slow-growing chickens. J. Appl. Poult. Res. 2017, 26, 226–235. [Google Scholar] [CrossRef]
  17. Scanes, C.G. Biology of stress in poultry with emphasis on glucocorticoids and the heterophil to lymphocyte ratio. Poult. Sci. 2016, 95, 2208–2215. [Google Scholar] [CrossRef]
  18. Clark, P. Observed variation in the heterophil to lymphocyte ratio values of birds undergoing investigation of health status. Comp. Clin. Pathol. 2015, 24, 1151–1157. [Google Scholar] [CrossRef]
  19. Fidan, E.D.; Nazligül, A.; Türkyilmaz, M.K.; Karaarslan, S.; Kaya, M. Effects of photoperiod length and light intensity on performance, carcass characteristics and heterophil to lymphocyte ratio in broilers. Kafkas Univ. Vet. Fak. Derg. 2017, 23, 39–45. [Google Scholar]
  20. Wang, W.; Zhang, T.; Wang, J.; Zhang, G.; Wang, Y.; Zhang, Y.; Zhang, J.H.; Li, G.H.; Xue, Q.; Han, K.P.; et al. Genome-wide association study of 8 carcass traits in Jinghai Yellow chickens using specific-locus amplified fragment sequencing technology. Poult. Sci. 2016, 95, 500–506. [Google Scholar] [CrossRef] [PubMed]
  21. Chang, C.C.; Chow, C.C.; Tellier, L.C.; Vattikuti, S.; Purcell, S.M.; Lee, J.J. Second-generation plink: rising to the challenge of larger and richer datasets. Giga Sci. 2015, 4, 7. [Google Scholar] [CrossRef] [PubMed]
  22. Purcell, S.; Neale, B.; Toddbrown, K.; Thomas, L.; Ferreira, M.; Bender, D. Plink: A tool set for whole-genome association and population-based linkage analyses. Am. J. Hum. Genet. 2007, 81, 559–575. [Google Scholar] [CrossRef] [PubMed]
  23. Xiang, Z.; Stephens, M. Genome-wide efficient mixed-model analysis for association studies. Nat. Genet. 2012, 44, 821–824. [Google Scholar] [Green Version]
  24. McLaren, W.; Pritchard, B.; Rios, D.; Chen, Y.; Flicek, P.; Cunningham, F. Deriving the consequences of genomic variants with the ensembl API and SNP effect predictor. Bioinformatics 2010, 26, 2069–2070. [Google Scholar] [CrossRef]
  25. Kasprzyk, A. Biomart: Driving a paradigm change in biological data management. Database 2011, 1, 56–65. [Google Scholar] [CrossRef] [PubMed]
  26. Kinsella, R.J.; Kähäri, A.; Haider, S.; Zamora, J.; Proctor, G.; Spudich, G.; Almeida-King, J.; Staines, D.; Derwent, P.; Kersey, A.K.P.; et al. Ensembl BioMarts: A hub for data retrieval across taxonomic space. Database 2011, 2011, bar030. [Google Scholar] [CrossRef] [PubMed]
  27. Mcfarlane, J.M.; Curtis, S.E. Multiple concurrent stressors in chicks. 3. Effects on plasma corticosterone and the heterophil:lymphocyte ratio. Poult. Sci. 1989, 68, 522–527. [Google Scholar] [CrossRef]
  28. Gross, W.B.; Curtis, S.E. Factors affecting chicken thrombocyte morphology and the relationship with heterophil: Lymphocyte ratios. Br. Poult. Sci. 1989, 30, 919–925. [Google Scholar] [CrossRef]
  29. Campo, J.L.; Davila, S.G. Estimation of heritability for heterophil: Lymphocyte ratio in chickens by restricted maximum likelihood. Effects of age, sex, and crossing. Poult. Sci. 2002, 81, 1448–1453. [Google Scholar] [CrossRef]
  30. Gross, O.; Grupp, C.; Steinberg, C.; Zimmermann, S.; Strasser, D.; Hannesschläger, N.; Reindl, W.; Jonsson, H.; Huo, H.; Littman, D.R.; et al. Multiple ITAM-coupled NK-cell receptors engage the Bcl10/Malt1 complex via Carma1 for NF-κB and MAPK activation to selectively control cytokine production. Blood 2008, 112, 2421–2428. [Google Scholar] [CrossRef]
  31. Georg, L. Oncogenic CARD11 mutations in human diffuse large B cell lymphoma. Science 2008, 319, 1676–1679. [Google Scholar]
  32. Bertin, J.; Wang, L.; Guo, Y.; Jacobson, M.D.; Poyet, J.L.; Srinivasula, S.M. CARD11 and CARD14 are novel caspase recruitment domain (CARD)/membrane-associated guanylate kinase (MAGUK) family members that interact with BCL10 and activate NF-kappa B. J. Biol. Chem. 2001, 276, 11877–11882. [Google Scholar] [CrossRef]
  33. Pomerantz, J.L.; Denny, E.M.; David, B. CARD11 mediates factor-specific activation of NF-kappaB by the T cell receptor complex. EMBO J. 2014, 21, 5184–5194. [Google Scholar] [CrossRef]
  34. Gaide, O.; Martinon, F.; Micheau, O.; Bonnet, D.; Thome, M.; Tschopp, J. Carma1, a CARD-containing binding partner of Bcl10, induces Bcl10 phosphorylation and NF-κB activation 1. FEBS Lett. 2001, 496, 121–127. [Google Scholar] [CrossRef]
  35. Siwek, M.; Slawinska, A.; Rydzanicz, M.; Wesoly, J.; Fraszczak, M.; Suchocki, T. Identification of candidate genes and mutations in qtl regions for immune responses in chicken. Anim. Genet. 2015, 46, 247–254. [Google Scholar] [CrossRef]
  36. Slawinska, A.; Witkowski, A.; Bednarczyk, M.; Siwek, M. In silico analysis of candidate genes associated with humoral innate immune response in chicken. BMC Proc. 2011, 5, S36. [Google Scholar] [CrossRef]
  37. Feng, L.; Yang, X.; Asweto, C.O.; Wu, J.; Zhang, Y.; Hu, H. Genome-wide transcriptional analysis of cardiovascular-related genes and pathways induced by PM2.5 in human myocardial cells. Environ. Sci. Pollut. Res. 2017, 24, 11683–11693. [Google Scholar] [CrossRef]
  38. Zhu, M.; Xu, Y.; Chen, Y.; Yan, F. Circular BANP, an upregulated circular RNA that modulates cell proliferation in colorectal cancer. Biomed. Pharmacother. 2017, 88, 138–144. [Google Scholar] [CrossRef]
  39. Li, S.S.; Qu, Z.; Haas, M.; Ngo, L.; Heo, Y.J.; Kang, H.J.; Britto, M.J.; Cullen, H.D.; Vanyai, H.K.; Tan, S.S.; et al. The HSA21 gene EURL/C21ORF91 controls neurogenesis within the cerebral cortex and is implicated in the pathogenesis of Down Syndrome. Sci. Rep. 2016, 6, 29514. [Google Scholar] [CrossRef] [Green Version]
  40. Fu, W.Y.; Chen, Y.; Sahin, M.; Zhao, X.S.; Shi, L.; Bikoff, J.B. Cdk5 regulates EphA4-mediated dendritic spine retraction through an ephexin1-dependent mechanism. Nat. Neurosci. 2007, 10, 67–76. [Google Scholar] [CrossRef]
  41. Town, L.; Mcglinn, E.; Davidson, T.L.; Browne, C.M.; Chawengsaksophak, K.; Koopman, P. Tmem26 is dynamically expressed during palate and limb development but is not required for embryonic survival. PLoS ONE 2011, 6, e25228. [Google Scholar] [CrossRef] [PubMed]
  42. Gao, C.; Shi, Q.; Wei, J.; Zhou, W.; Xiao, K.; Wang, J. The associations of two SNPs in miRNA-146a and one SNP in ZBTB38-RASA2 with the disease susceptibility and the clinical features of the Chinese patients of sCJD and FFI. Prion 2018, 12, 34–41. [Google Scholar] [CrossRef] [Green Version]
  43. Nass, N.; Dittmer, A.; Hellwig, V.; Lange, T.; Beyer, J.M.; Leyh, B.; Ignatov, A.; Weiβenborn, C.; Kirkegaard, T.; Lykkesfeldt, A.E.; et al. Expression of transmembrane protein 26 (TMEM26) in breast cancer and its association with drug response. Oncotarget 2016, 7, 38408–38426. [Google Scholar] [CrossRef] [Green Version]
  44. Barr, A.J.; Ugochukwu, E.; Lee, W.H.; King, O.N.F.; Filippakopoulos, P.; Alfano, I. Large-scale structural analysis of the classical human protein tyrosine phosphatome. Cell 2009, 136, 352–363. [Google Scholar] [CrossRef]
  45. Shah, T.M.; Patel, N.V.; Patel, A.B.; Upadhyay, M.R.; Joshi, C.G. A genome-wide approach to screen for genetic variants in broilers (gallus gallus) with divergent feed conversion ratio. Mol. Genet. Genom. 2016, 291, 1715–1725. [Google Scholar] [CrossRef]
  46. Wang, B.; Zhang, M.; Ni, Y.H.; Liu, F.; Fan, H.Q.; Fei, L.; Pan, X.Q.; Guo, M.; Chen, R.H.; Guo, X.R. Identification and characterization of NYGGF4, a novel gene containing a phosphotyrosine-binding (PTB) domain that stimulates 3T3-L1 preadipocytes proliferation. Gene 2006, 379, 132–140. [Google Scholar] [CrossRef]
Figure 1. Quantile–quantile plots of p-values for H/L. The x-axis is the expected −log10 p-value and the y-axis is the observed −log10 p-value.
Animals 09 00260 g001
Figure 2. Quantile–quantile plots of p-values for heterophils. The x-axis is the expected −log10 p-value and the y-axis is the observed −log10 p-value.
Animals 09 00260 g002
Figure 3. Quantile–quantile plots of p-values for lymphocytes. The x-axis is the expected −log10 p-value and the y-axis is the observed −log10 p-value.
Animals 09 00260 g003
Figure 4. Quantile–quantile plots of p-values for monocytes. The x-axis is the expected −log10 p-value and the y-axis is the observed −log10 p-value.
Animals 09 00260 g004
Figure 5. Manhattan plot for H/L in chicken. The x-axis is the position of each single nucleotide polymorphism (SNP) on the chicken chromosomes 1–28 and linkage group and the y-axis is the −log10 p-value.
Animals 09 00260 g005
Figure 6. Manhattan plot for heterophils in chicken. The x-axis is the position of each single nucleotide polymorphism (SNP) on the chicken chromosomes 1–28 and linkage group and the y-axis is the −log10 p-value.
Animals 09 00260 g006
Figure 7. Manhattan plot for lymphocytes in chicken. The x-axis is the position of each single nucleotide polymorphism (SNP) on the chicken chromosomes 1–28 and linkage group and the y-axis is the −log10 p-value.
Animals 09 00260 g007
Figure 8. Manhattan plot for monocytes in chicken. The x-axis is the position of each single nucleotide polymorphism (SNP) on the chicken chromosomes 1–28 and linkage group and the y-axis is the −log10 p-value.
Animals 09 00260 g008
Table 1. Descriptive statistics of phenotypic data.
TraitsMeanSDDeviationMinMaxCV1 (%)
Monocytes (M, n)33701787
Heterophils (H, n)2798826434
Lymphocytes (L, n)7318333218825
H /L (H/L, %)4020001.750
Abbreviations: Mean = arithmetic mean; SD = standard deviation; Min = minimum; Max = maximum; CV = coefficient of variation.
Table 2. Single nucleotide polymorphisms (SNPs) with genome-wide significance for H/L traits.
TraitsChromosomeSNP IDPosition 1 (BP)p_WaldNearest GeneDistance 2
H/L14rs1500563933321171.55 × 109CARD11D103.6
H/LZrs314642216105706001.59 × 10−9BRIX1D3.4
H/L11rs14028611182803412.27 × 10−5BANPwithin
H/L12New129114364.16 × 10−5PTPRGwithin
H/L7rs312628231158940924.32 × 10−5NFE2L2D10.6
1 SNP positions are obtained from ENSEMBLE. 2 U = upstream, D = downstream. The unit of the distance is kb. CARD11 = Caspase recruitment domain family member 11). BRIX1 = Biogenesis of ribosomes. BANP = BTG3 associated nuclear protein. PTPRG = Protein tyrosine phosphatase receptor type G. NFE2L2 = Nuclear factor, erythroid 2 like 2.
Table 3. SNPs with genome-wide significance for heterophil and lymphocyte traits.
TraitsChromosomeSNP IDPosition 1 (BP)p_WaldNearest GeneDistance 2
Heterophils14rs1500563933321172.54 × 10−9CARD11D103.6
HeterophilsZrs314642216105706008.06 × 10−9BRIX1D3.4
Heterophils11rs14028611182803418.81 × 10−6BANPwithin
Heterophils3rs31644423832692673.13 × 10−5PIK3CDU192.3
Heterophils2rs312628231158940923.52 × 10−5NFE2L2D10.6
LymphocytesZrs314642216105706005.88 × 10−6BRIX1U3.4
Lymphocytes1New1.02E+089.87 × 10⁻⁶C1H21ORF91U2524.9
Lymphocytes14rs1500563933321172.14 × 10−5CARD11D103.6
Lymphocytes21New129114364.30 × 10−5PTPRGwithin
1 SNP positions are obtained from ENSEMBLE. 2 U = upstream, D = downstream. The unit of the distance is kb. CARD11 = Caspase recruitment domain family member 11. BRIX1 = Biogenesis of ribosomes BRX1. BANP = BTG3 associated nuclear protein. PIK3CD = Phosphatidylinositol-4,5-bisphosphate 3-kinase catalytic subunit delta. NFE2L2 = Nuclear factor, erythroid 2 like 2. BRIX1 = Biogenesis of ribosomes BRX1. C1H21ORF91 = Chromosome 21 open reading frame 91. CARD11 = Caspase recruitment domain family member 11. PTPRG = Protein tyrosine phosphatase receptor type G.
Table 4. SNPs with genome-wide significance for monocyte traits.
TraitsChromosomeSNP IDPosition 1 (BP)p_waldNearest GeneDistance 2
Monocytes9New77191738.62 × 10−7EPHA4within
Monocytes6rs31394368085568727.59 × 10−6TMEM26
RHOBTB1
within
U87.7
Monocytes9New101133762.08 × 10−5RASA2U100.5
PID1U189.3
Monocytes9New83016053.42 × 10−5WDFY1within
Monocytes5rs313016555446386044.01 × 10−5CPSF2within
1 SNP positions are obtained from ENSEMBLE. 2 U = upstream, D = downstream. The unit of the distance is kb. EPHA4 = Ephrin type-A receptor 4. TMEM26 = Transmembrane protein 26. RHOBTB1 = Rho related BTB domain containing 1. RASA2 = RAS P21 protein activator 2. PID1 = Phosphotyrosine interaction domain containing 1. WDFY1 = WD repeat and FYVE domain containing 1. CPSF2 = Cleavage and polyadenylation specific factor 2.

