Spatialities of Dog Theft: A Critical Perspective

Simple Summary
Abstract
1. Introduction
2. Materials and Methods
2.1. Data Search for Dog Theft Data
2.2. Data Collection and Geographic Information System (GIS) Analyses
What was the total number of dog theft crimes in 2015/2016/2017?What was the outcome (charge/summons, community resolution, active investigation, evidential difficulties, no suspect identified) for each dog theft crime in 2015/2016/2017?
"Although excess cost removes the forces obligations under the Freedom of Information Act, as a gesture of goodwill, I have supplied information, relative to your request, retrieved or available before it was realised that the fees limit would be exceeded. I trust this is helpful, but it does not affect our legal right to rely on the fees regulations for the remainder of your request."
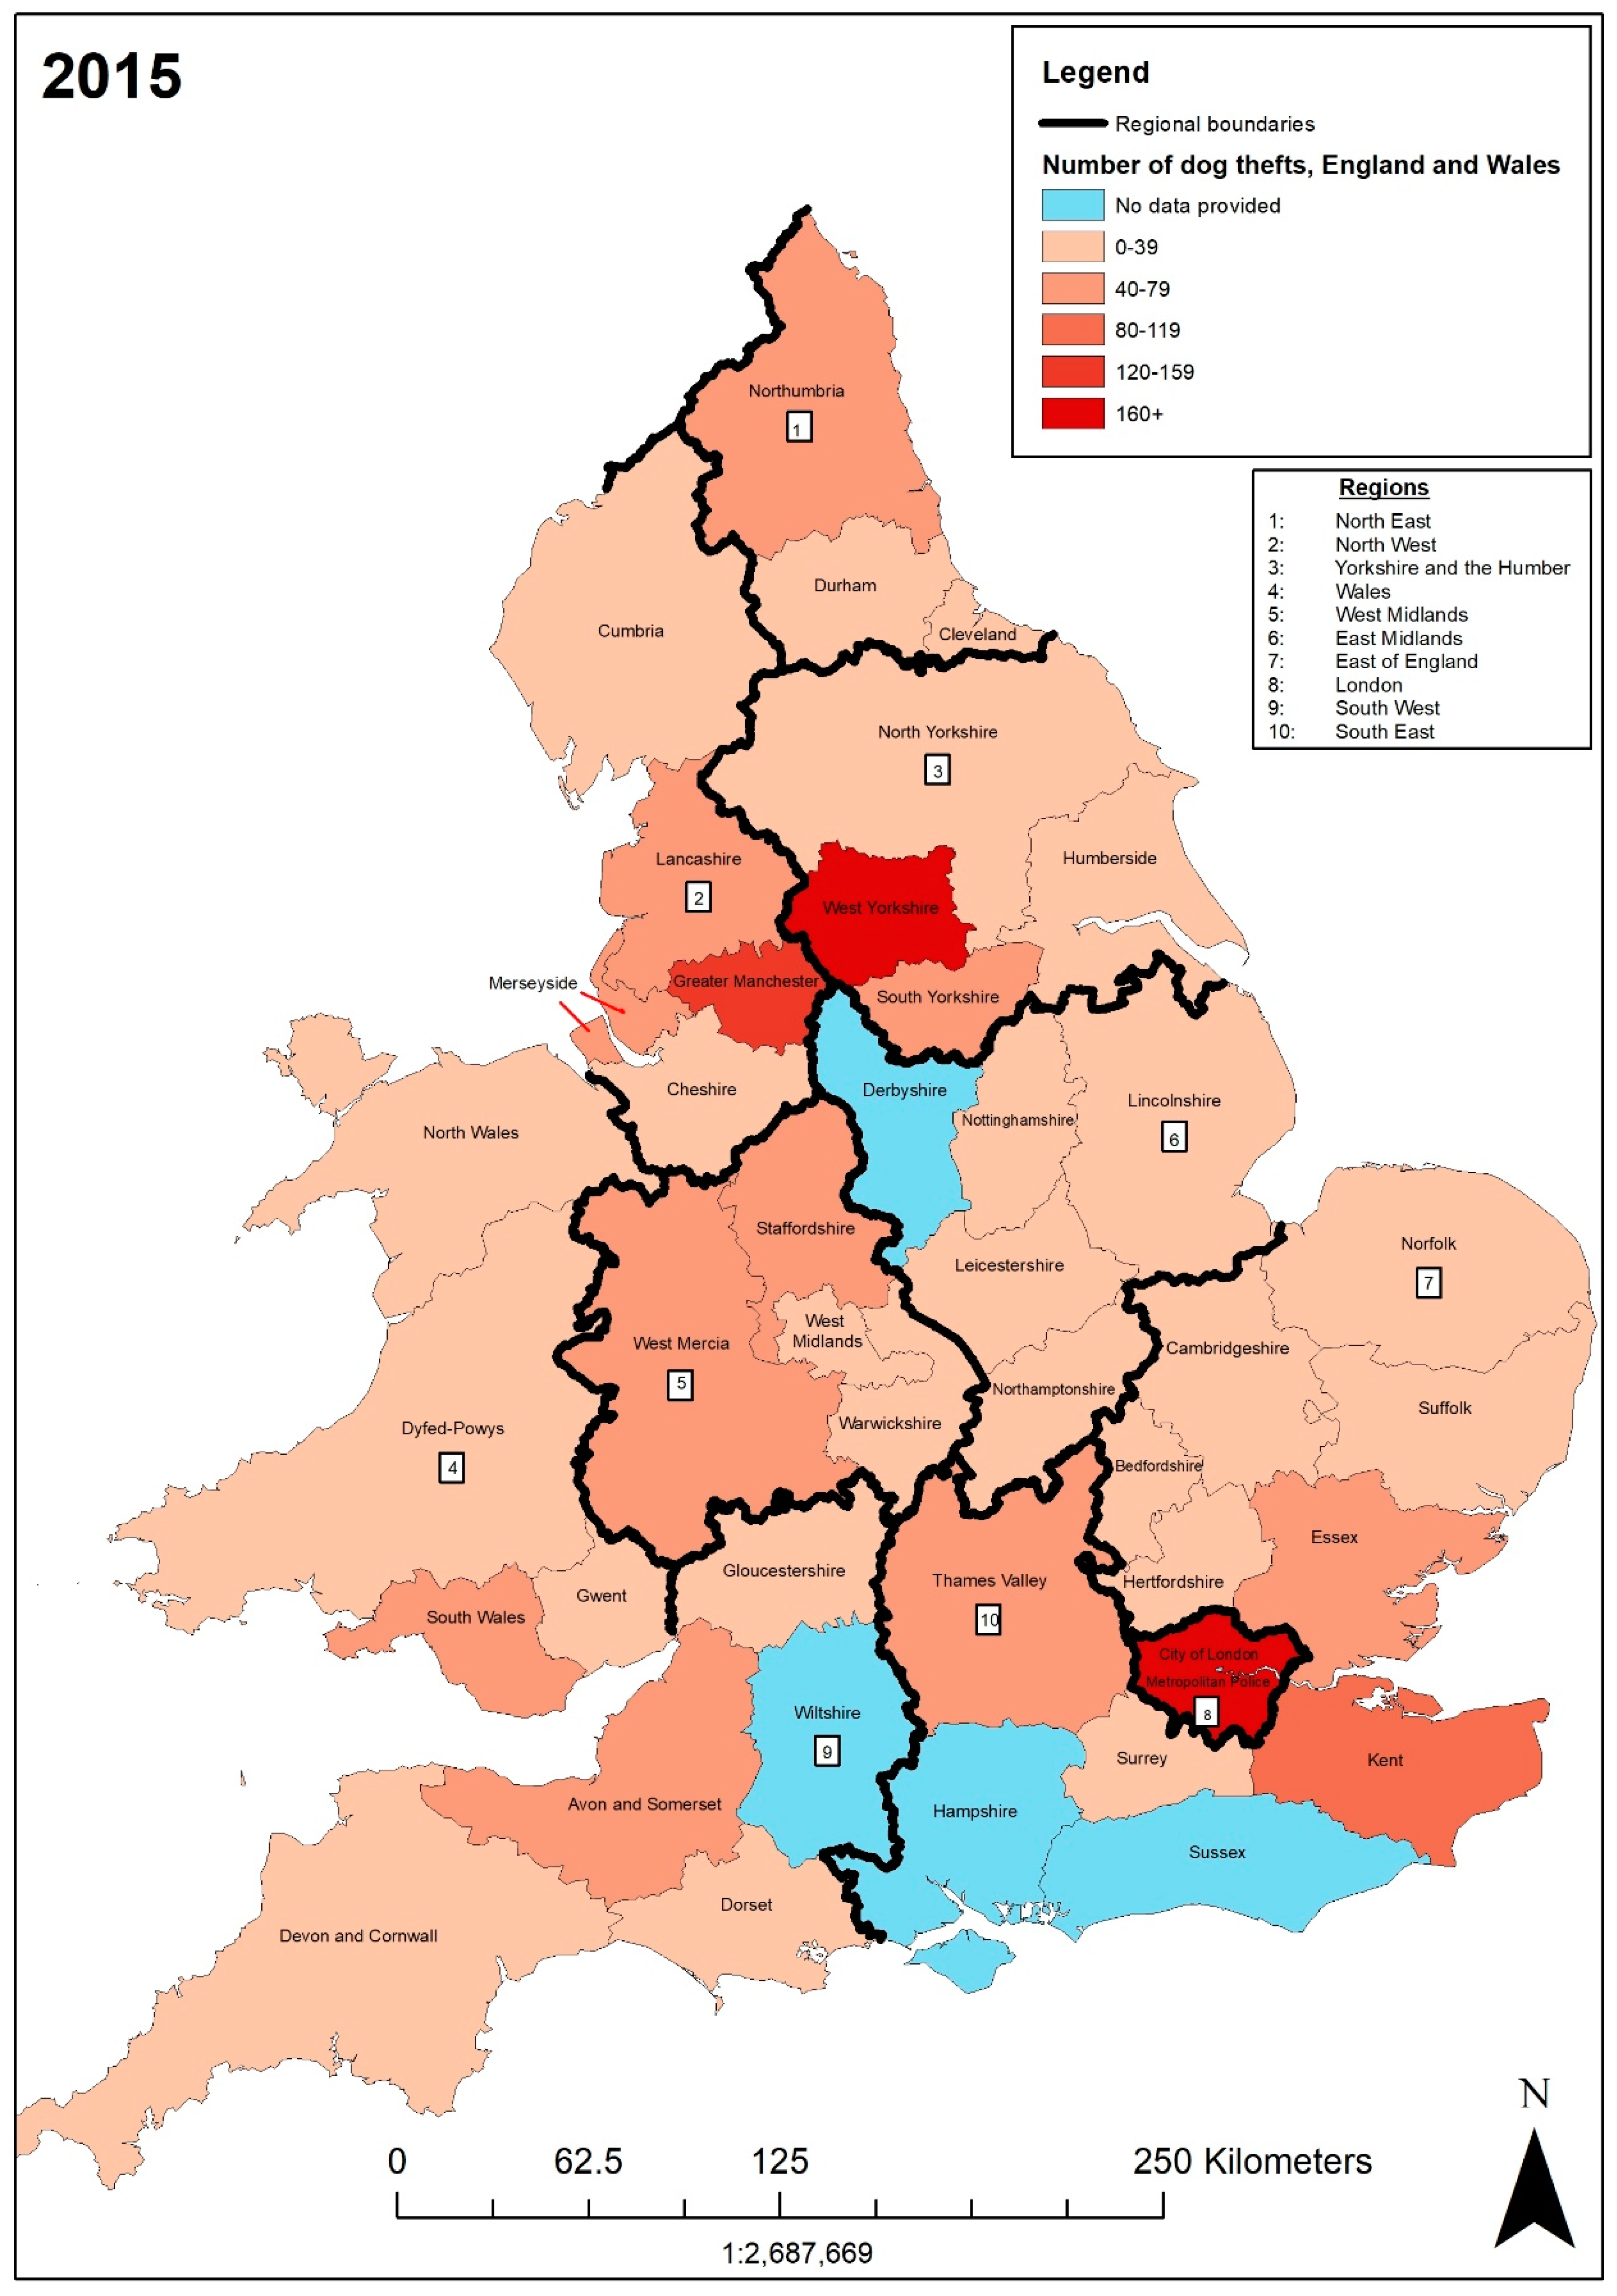
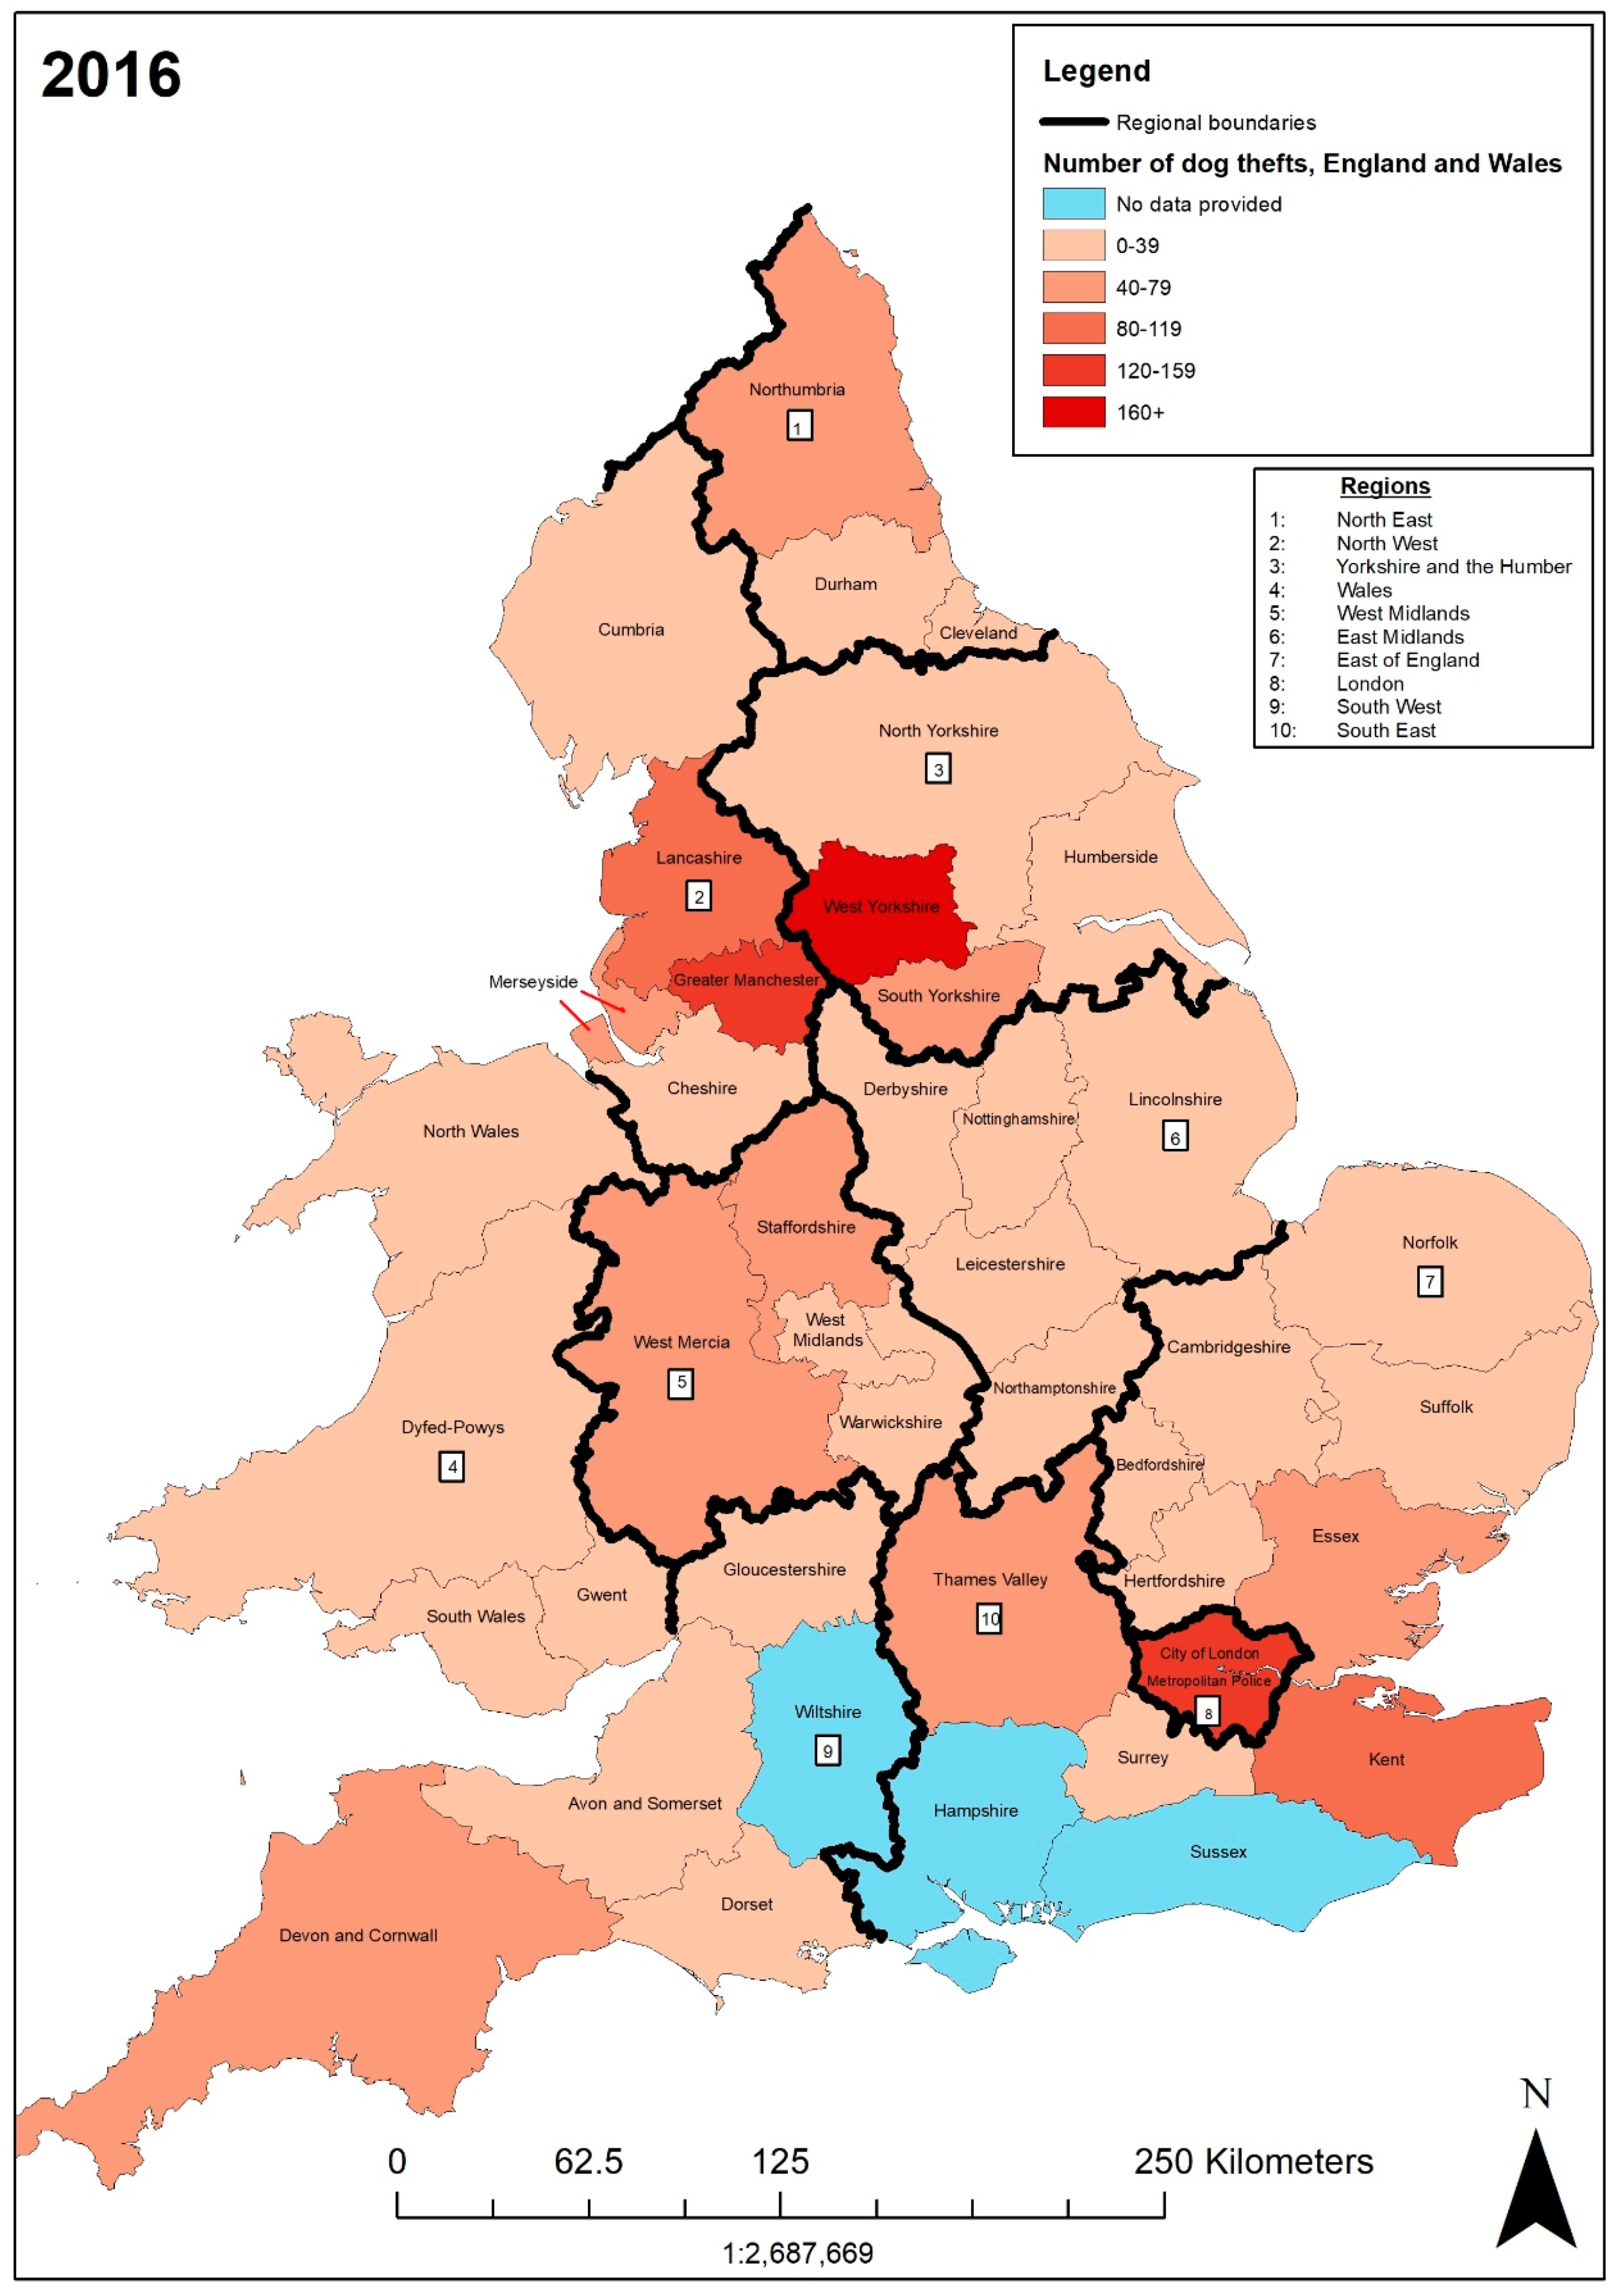
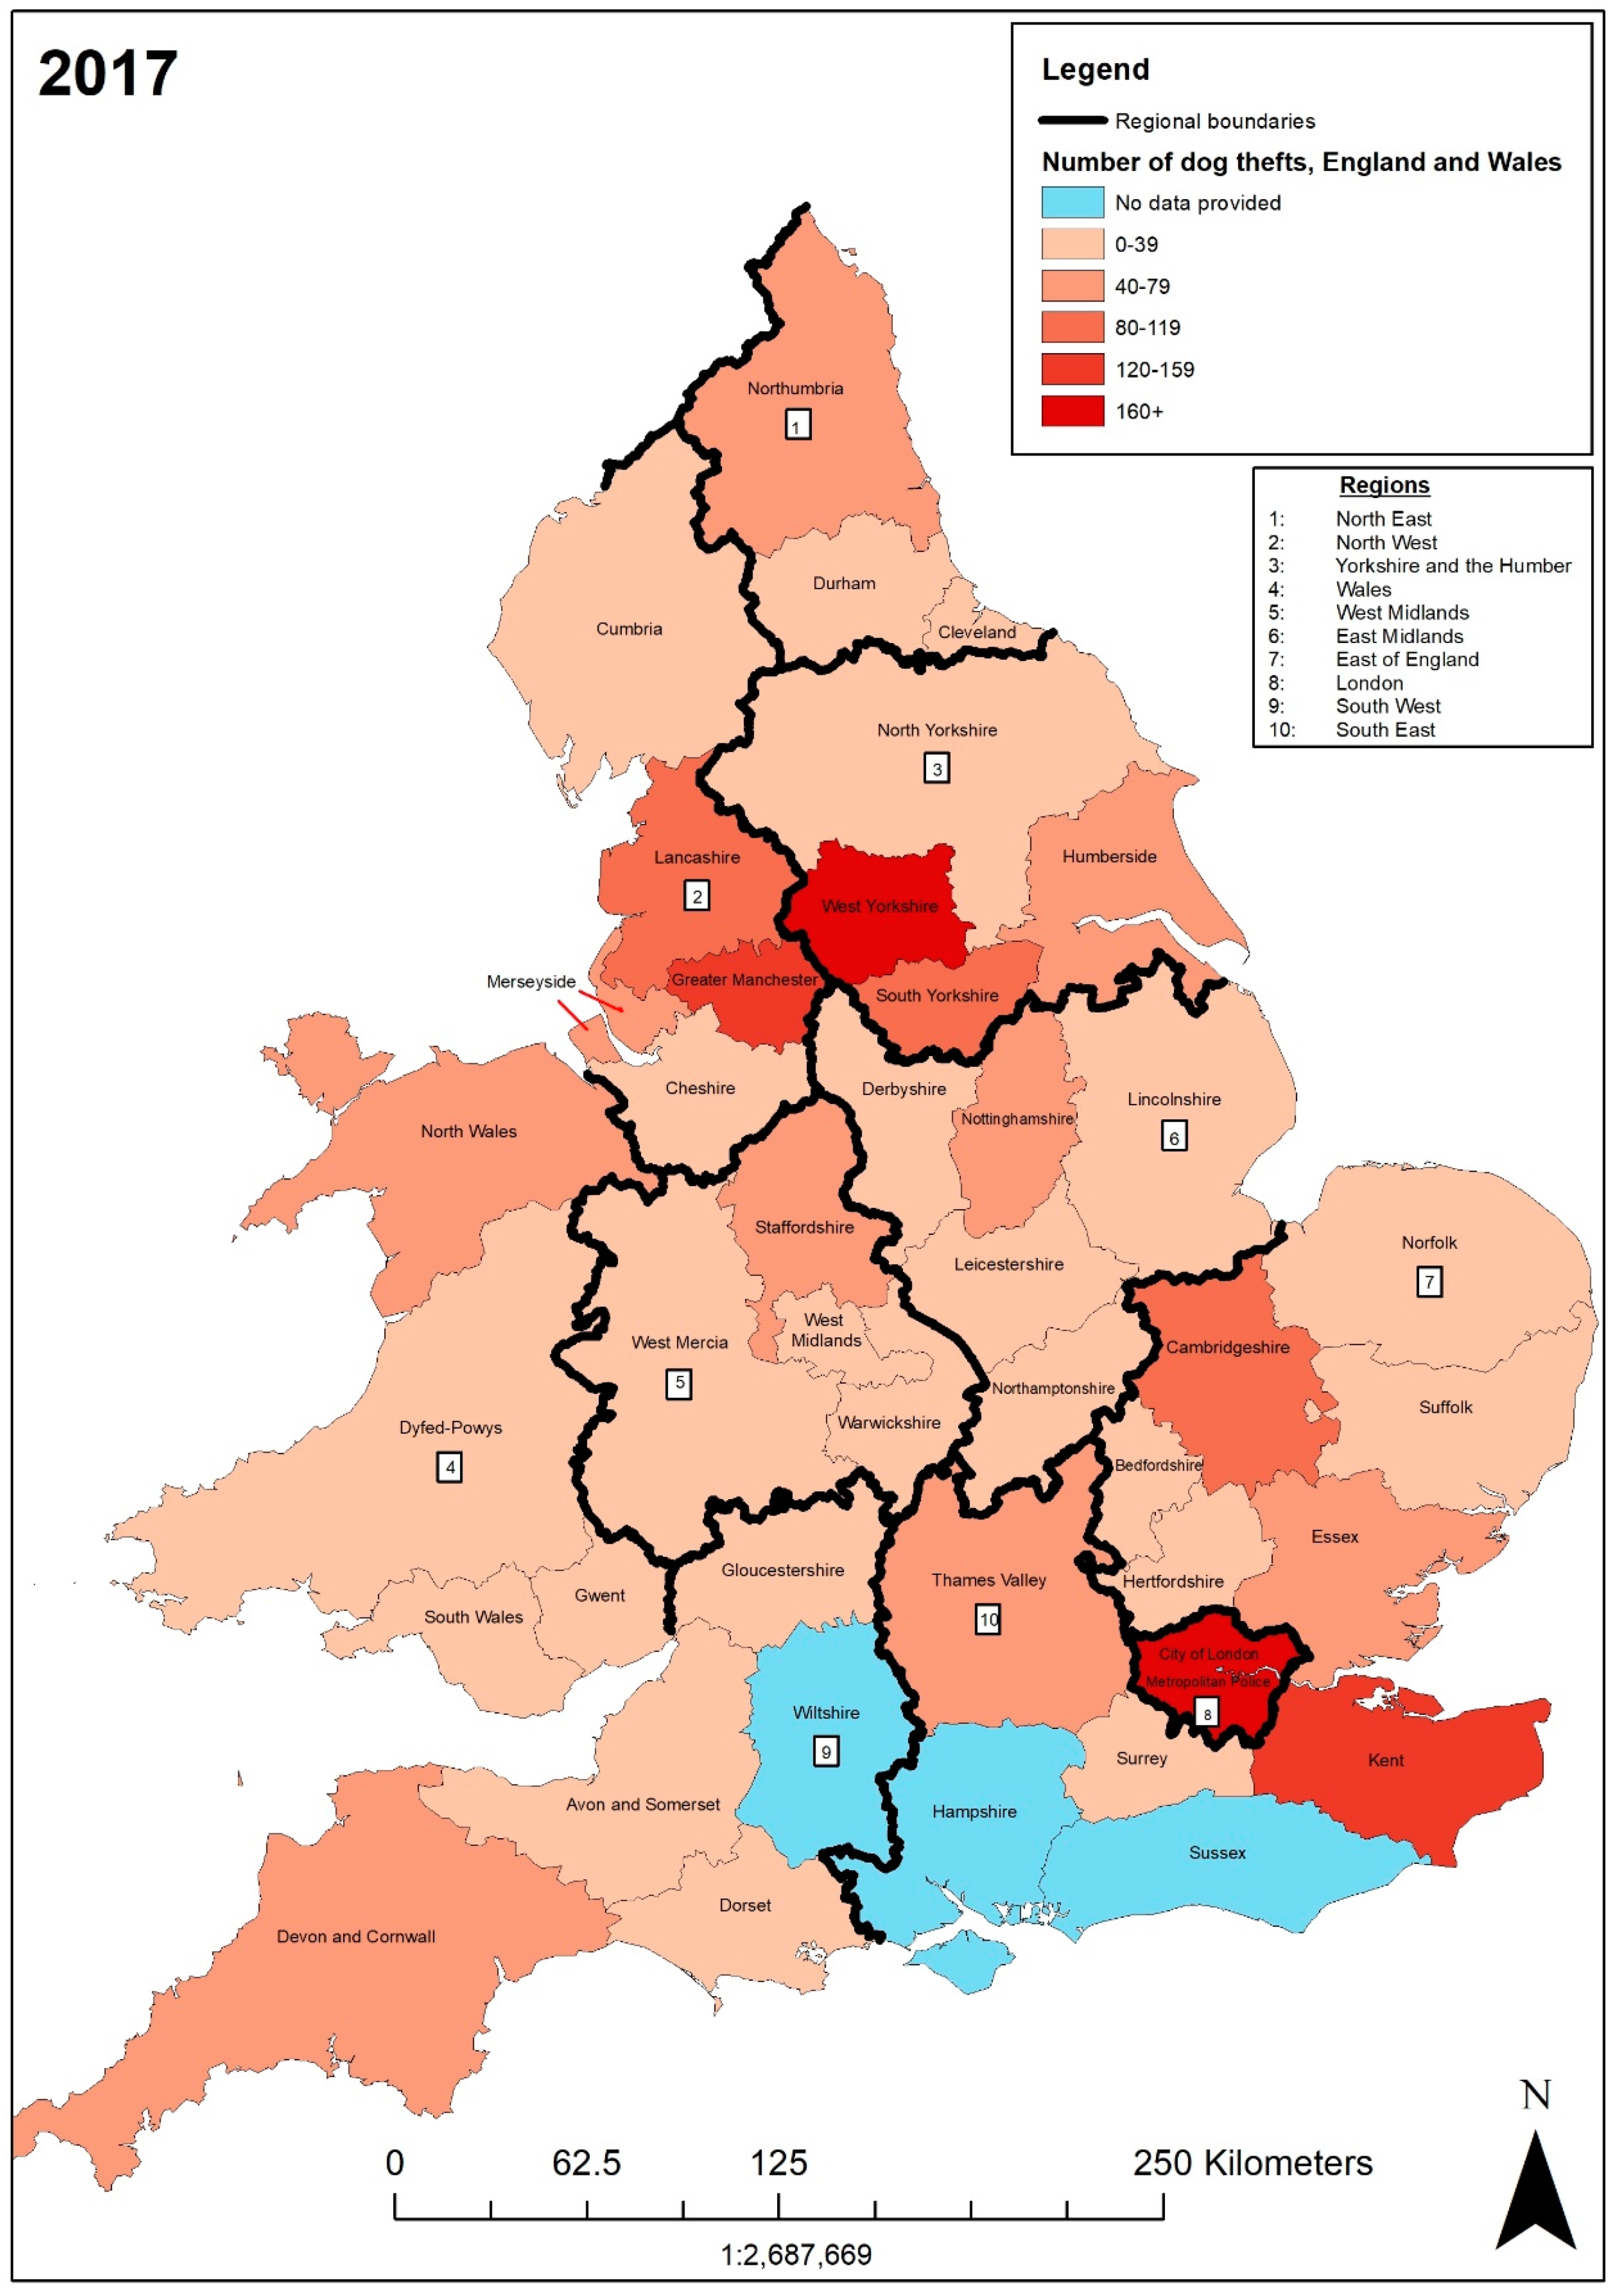
2.3. GIS Spatial Mapping
2.4. Crime Rates
3. Results and Analysis
3.1. Theft in England and Wales
3.2. Dog Theft in England and Wales
4. Conclusions
Author Contributions
Funding
Acknowledgments
Conflicts of Interest
References
- Theft Act 1968. Available online: https://www.legislation.gov.uk/ukpga/1968/60/contents (accessed on 22 December 2018).
- Sentencing Council. Theft Offences Definitive Guideline. 2016. Available online: https://www.sentencingcouncil.org.uk/wp-content/uploads/SC-Theft-Offences-Definitive-Guideline-content_FINAL-web_.pdf (accessed on 10 March 2019).
- Fox, R. Animal Behaviours, Post-Human Lives: Everyday Negotiations of the Animal-Human Divide in Pet-Keeping. Soc. Cul. Geogr. 2006, 7, 525–537. [Google Scholar] [CrossRef]
- Shir-Vertesh, R. “Flexible personhood”: Loving Animals as Family Members in Israel. Am. Anthropol. 2012, 114, 420–432. [Google Scholar] [CrossRef]
- Irvine, L.; Cilia, L. More-than-human families: Pets, People, and Practices in Multispecies Households. Sociol Compass 2017, 11, 1–13. [Google Scholar] [CrossRef]
- Charles, N. ‘Animals just love you as you are’: Experiencing Kinship across the Species Barrier. Sociology 2014, 48, 715–730. [Google Scholar] [CrossRef]
- Stolen and Missing Pets Alliance. Available online: https://www.stolenandmissingpetsalliance.co.uk/ (accessed on 22 December 2018).
- Harris, L.K. Dog Theft: A Case for Tougher Sentencing Legislation. Animals 2018, 8, 78. [Google Scholar] [CrossRef] [PubMed]
- Fox, R.; Gee, N.R. Changing Conceptions of Care. Soc. Anim. 2016, 24, 107–128. [Google Scholar] [CrossRef]
- Charles, N. Post-Human Families? Dog-Human Relations in the Domestic Sphere. Sociol. Res. Online 2016, 21, 1–12. [Google Scholar] [CrossRef]
- Tipper, B. ‘A dog who I know well’: Everyday Relationships Between Children and Animals. Child. Geogr. 2011, 9, 145–165. [Google Scholar] [CrossRef]
- Wlodarczyk, J. Be More Dog: The Human-Canine Relationship in Contemporary Dog-Training Methodologies. Perform. Res. 2017, 22, 40–47. [Google Scholar] [CrossRef]
- Power, E.R. Furry Families: Making a Human-Dog Family through Home. Soc. Cult. Geogr. 2008, 9, 535–555. [Google Scholar] [CrossRef]
- Nast, H.J. Critical Pet Studies? Antipode 2006, 38, 894–906. [Google Scholar] [CrossRef]
- Howell, P. A Place for the Animal Dead: Pets, Pet Cemeteries and Animal Ethics in Late Victorian Britain. Ethics Place Envir. 2002, 5, 5–22. [Google Scholar] [CrossRef]
- Sanders, C.R. The Impact of Guide Dogs on the Identity of People with Visual Impairments. Anthrozoos 2000, 13, 131–139. [Google Scholar] [CrossRef]
- Cutt, H.; Giles-Corti, B.; Knuiman, M.; Burke, V. Dog Ownership, Health and Physical Activity: A Critical Review of the Literature. Health Place 2007, 13, 261–272. [Google Scholar] [CrossRef] [PubMed]
- Gillespie, K.; Lawson, V. ‘My dog is my home’: Multispecies Care and Poverty Politics in Los Angeles, California and Austin, Texas. Gend. Place Cult. 2017, 24, 774–793. [Google Scholar] [CrossRef]
- Wood, L.J.; Giles-Corti, B.; Bulsara, M.K.; Bosch, D.A. More than a Furry Companion: The Ripple Effect of Companion Animals on Neighbourhood Interactions and Sense of Community. Soc. Anim. 2007, 15, 43–56. [Google Scholar] [CrossRef]
- Power, E.R. Dogs and Practices of Community and Neighboring. Anthrozoos 2013, 26, 579–591. [Google Scholar] [CrossRef]
- Despret, V. The Body we Care for: Figures of Anthropo-zoo-genesis. Body Soc. 2004, 10, 111–134. [Google Scholar] [CrossRef]
- Sanders, C.R. Understanding Dogs: Caretakers’ Attributions of Mindedness in Canine-Human Relationships. J. Contemp. Ethnogr. 1993, 22, 205–226. [Google Scholar] [CrossRef]
- Haraway, D.J. The companion species manifesto. Dogs, people, and significant otherness; Prickly Paradigm Press: Chicago, IL, USA, 2003. [Google Scholar]
- Haraway, D.J. When species meet; University of Minnesota Press: Minneapolis, MN, USA, 2008. [Google Scholar]
- Redmalm, D. Pet Grief: When is Non-Human Life Grieveable? Sociol. Rev. 2015, 63, 19–35. [Google Scholar] [CrossRef]
- Howell, P. Flush and the Banditti: Dog-Stealing in Victorian London. In Animal spaces, beastly places, 1st ed.; Philo, C., Wilbert, C., Eds.; Routledge: London, UK, 2000; pp. 35–55. ISBN 0415198461. [Google Scholar]
- Direct Line. Dog theft—How to prevent your dog being stolen. 2018. Available online: https://www.directline.com/pet-cover/dog-theft (accessed on 22 December 2018).
- Daniel, A. (Keele University, Keele, UK); Emporium Insurance (York, UK). Personal communication, FOI request statistics for stolen dogs in England and Wales in 2015, 2016 and 2017. 2018.
- O’Flynn, H. Lincolnshire ‘dog theft capital of Britain’—and THESE are the pooches thieves most want to steal. Lincolnshire Live. 2018. Available online: https://www.lincolnshirelive.co.uk/news/local-news/lincolnshire-dog-theft-capital-britain-1342962 (accessed on 23 December 2018).
- Harries, R. Dog thefts increase by more than 200% in Dyfed-Powys area in just one year. Wales Online. 2018. Available online: https://www.walesonline.co.uk/news/wales-news/dog-thefts-increase-more-200-14529006 (accessed on 23 December 2018).
- E-petition 212174. Reclassify the theft of a pet to a specific crime in its own right. Available online: https://petition.parliament.uk/petitions/212174 (accessed on 22 December 2018).
- House of Commons Hansard. Pet Theft. 2018. Available online: https://hansard.parliament.uk/commons/2018-07-02/debates/05B60093-01C7-43ED-B469-55E8164A0D2B/PetTheft (accessed on 22 December 2018).
- Pets (Theft) Bill 2017-19. Available online: https://services.parliament.uk/bills/2017-19/petstheft.html (accessed on 22 December 2018).
- Office for National Statistics (ONS). Police Force Areas (December 2016) Full Clipped Boundaries in England and Wales. 2016. Available online: http://geoportal.statistics.gov.uk/datasets/3e5a096a8c7c456fb6d3164a3f44b005_0 (accessed on 12 November 2018).
- Office for National Statistics. Crime in England and Wales: Police Force Area Data Tables. 2019. Available online: https://www.ons.gov.uk/peoplepopulationandcommunity/crimeandjustice/datasets/policeforceareadatatables?fbclid=IwAR1X31WiJgwxwRPMNUUuqV9GQbf6Y8yMR9qoqlfIUolF5fNX4pUdpD5KPkg (accessed on 10 March 2019).
- Daniel, A. (Keele University, Keele, UK); Ministry of Justice (UK). Personal communication, Freedom of Information FOI 181017015. 2018.
- Allen, G.; Zayed, Y. Police Service Strength. House of Commons Library, Briefing Paper Number 00634. 2018. Available online: https://researchbriefings.files.parliament.uk/documents/SN00634/SN00634.pdf?fbclid=IwAR11omsYv309s67920j7YegxBrL45RKW8iSlkr7VfyNlDslLUp6xTEpAFLQ (accessed on 10 March 2019).
- Allen, D. (Keele University, Keele, UK); Lincolnshire Police (Lincolnshire, UK). Personal communication, FOI request 002633/18. 2018.


| Merged Categories: | Explanation/Rationale: |
|---|---|
| Theft in public: | Any instance where the pet was taken in the public, such as at an ATM or in a store. This does not include thefts taking place in vehicles (separate classification, below) or thefts taking place within buildings deemed as businesses. |
| Theft of/from a vehicle: | Any instance where a pet was taken from a car, or was within a car when the vehicle was stolen. |
| Evidential difficulties: | This includes instances where either the police deemed there not to be enough evidence to proceed, thus closing the case, or where the public were willing to cooperate but could not provide evidence. |
| Withdrawn support/unwilling to assist: | Instances where the public could not or did not cooperate with the police investigation, therefore closing the case. This is separated from evidential difficulties as it could demonstrate false reporting, such as a domestic dispute over pet ownership etc. |
| Not in public interest (police decision)/prevented: | This includes instances where the crime was classified as “prevented”―the assumption is that the crime did not happen. It also includes instances where the police deemed the prosecution as not being worth pursuing, usually because the dispute was settled. |
| No further action: | Instances where “no further action” was listed in the data, where the case was cancelled or transferred by the force, or where the case was falsely recorded. |
| Penalty notice/caution/other: | Any instance where a penalty notice or fine was implemented as punishment, where a police caution was given instead of an arrest, or where a court summons is recorded but the outcome of which is not described further. This also includes categories such as youth restorative programmes, extended professional opinions, situations where complaints were made, or where another force had primacy jurisdiction. It also includes court disposal of cases or instances where prosecution time was marked as “expired”. |
| Class | A | B | C | D | E | F |
|---|---|---|---|---|---|---|
| Range | Null | 0–39 | 40–79 | 80–119 | 120–159 | 160+ |
| Year | Theft Offences | Burglary | Domestic Burglary | Non-Domestic Burglary | Vehicle Offences | Theft from the Person | Bicycle Theft | Shoplifting | Other Theft Offences |
|---|---|---|---|---|---|---|---|---|---|
| 2015 | 1,762,473 | 401,718 | 193,851 | 207,867 | 364,468 | 82,384 | 87,895 | 333,671 | 492,337 |
| 2016 | 1,820,079 (+3.26%) | 404,282 (+0.63%) | 200,659 (+3.51%) | 203,623 (−2.04%) | 389,371 (+6.83%) | 86,548 (+5.05%) | 90,910 (+3.43%) | 358,235 (+7.36%) | 490,733 (−0.32%) |
| 2017 | 2,011,942 (+10.54%) | 438,971 (+8.58%) | 288,728 (+43.88%) | 150,243 (−26.21%) | 452,683 (+16.16%) | 99,101 (+14.50%) | 102,581 (+12.83%) | 385,265 (+7.54%) | 533,341 (+8.68%) |
| Police Force Area | Number of Dog Theft Crimes, 2015 | Crime Rate Per 100,000, 2015 | Number of Dog Theft Crimes 2016 | Crime Rate Per 100,000 2016 | Number of Dog Theft Crimes, 2017 | Crime Rate Per 100,000, 2017 | Police Per 100,000 Population (Rank) [37] |
|---|---|---|---|---|---|---|---|
| Avon and Somerset | 48 | 2.88 | 21 | 1.24 | 21 | 1.23 | 153 (35) |
| Bedfordshire | 15 | 2.29 | 16 | 2.41 | 20 | 3.00 | 170 (22) |
| Cambridgeshire | 16 | 1.90 | 25 | 2.97 | 41 | 4.83 | 163 (32) |
| Cheshire | 6 | 0.57 | 19 | 1.81 | 4 | 0.37 | 192 (15) |
| Cleveland | 16 | 2.84 | 22 | 3.89 | 25 | 4.41 | 222 (6) |
| Cumbria | 15 | 3.01 | 12 | 2.40 | 24 | 4.81 | 220 (8) |
| Derbyshire | No Data | No Data | 4 | 0.38 | 11 | 1.04 | 166 (26) |
| Devon and Cornwall | 36 | 2.09 | 62 | 3.57 | 78 | 4.45 | 169 (23) |
| Dorset | 7 | 0.91 | 12 | 1.56 | 16 | 2.07 | 164 (31) |
| Durham | 13 | 2.07 | 23 | 3.66 | 37 | 5.87 | 181 (16) |
| Dyfed-Powys | 18 | 3.48 | 14 | 2.71 | 31 | 5.99 | 229 (3) |
| Essex | 74 | 4.14 | 67 | 3.70 | 52 | 2.85 | 162 (33) |
| Gloucestershire | 18 | 2.91 | 13 | 2.08 | 10 | 1.59 | 171 (20) |
| Greater Manchester | 120 | 4.35 | 132 | 4.74 | 146 | 5.21 | 227 (5) |
| Gwent | 30 | 5.15 | 31 | 5.30 | 31 | 5.27 | 216 (11) |
| Hampshire | No Data | No Data | No Data | No Data | No Data | No Data | 143 (39) |
| Hertfordshire | 23 | 1.97 | 18 | 1.53 | 17 | 1.43 | 165 (27) |
| Humberside | 33 | 3.56 | 31 | 3.34 | 44 | 4.73 | 193 (14) |
| Kent | 102 | 5.66 | 107 | 5.88 | 130 | 6.72 | 178 (17) |
| Lancashire | 59 | 3.99 | 100 | 6.73 | 93 | 6.23 | 199 (13) |
| Leicestershire | 24 | 2.27 | 29 | 2.71 | 23 | 2.12 | 164 (29) |
| Lincolnshire | 14 | 1.90 | 21 | 2.81 | 24 | 3.19 | 145 (38) |
| Merseyside | 53 | 3.79 | 65 | 4.60 | 68 | 4.79 | 244 (2) |
| Metropolitan Police | 167 | 1.92 | 137 | 1.56 | 169 | 1.91 | 352 (1) |
| Norfolk | 32 | 3.61 | 15 | 1.68 | 29 | 3.22 | 173 (19) |
| North Wales | 16 | 2.30 | 21 | 3.02 | 40 | 5.74 | 214 (12) |
| North Yorkshire | 21 | 2.59 | 23 | 2.81 | 15 | 1.82 | 164 (30) |
| Northamptonshire | 25 | 3.45 | 11 | 1.50 | 15 | 2.02 | 219 (9) |
| Northumbria | 44 | 3.06 | 61 | 4.22 | 74 | 5.10 | 165 (28) |
| Nottinghamshire | 15 | 1.33 | 16 | 1.40 | 43 | 3.74 | 167 (25) |
| South Wales | 62 | 4.74 | 27 | 2.04 | 17 | 1.28 | 220 (7) |
| South Yorkshire | 58 | 4.21 | 65 | 4.69 | 82 | 5.88 | 176 (18) |
| Staffordshire | 55 | 4.93 | 68 | 6.07 | 70 | 6.21 | 141 (41) |
| Suffolk | 18 | 2.42 | 12 | 1.59 | 13 | 1.71 | 149 (37) |
| Surrey | 12 | 1.02 | 10 | 0.84 | 8 | 0.67 | 168 (24) |
| Sussex | No Data | No Data | No Data | No Data | No Data | No Data | 151 (36) |
| Thames Valley | 47 | 1.99 | 47 | 1.97 | 72 | 3.01 | 170 (21) |
| Warwickshire | 13 | 2.34 | 13 | 2.32 | 13 | 2.29 | 143 (40) |
| West Mercia | 43 | 3.44 | 61 | 4.83 | 35 | 2.75 | 155 (34) |
| West Midlands | 25 | 0.88 | 25 | 0.87 | 29 | 1.00 | 227 (4) |
| West Yorkshire | 166 | 7.27 | 197 | 8.58 | 172 | 7.45 | 217 (10) |
| Wiltshire | No Data | No Data | No Data | No Data | No Data | No Data | 139 (42) |
| Year | Number of Thefts Nationally | No Further Action (NFA) | % NFA | Number Charged | % Charged |
|---|---|---|---|---|---|
| 2015 | 1559 | 853 | 54.71% | 64 | 3.97% |
| 2016 | 1653 (+6.03%) | 1013 (+18.76%) | 61.28% | 51 (−20.31%) | 3.08% |
| 2017 | 1842 (+11.43%) | 1075 (+6.12) | 58.36% | 39 (−23.53%) | 2.11% |
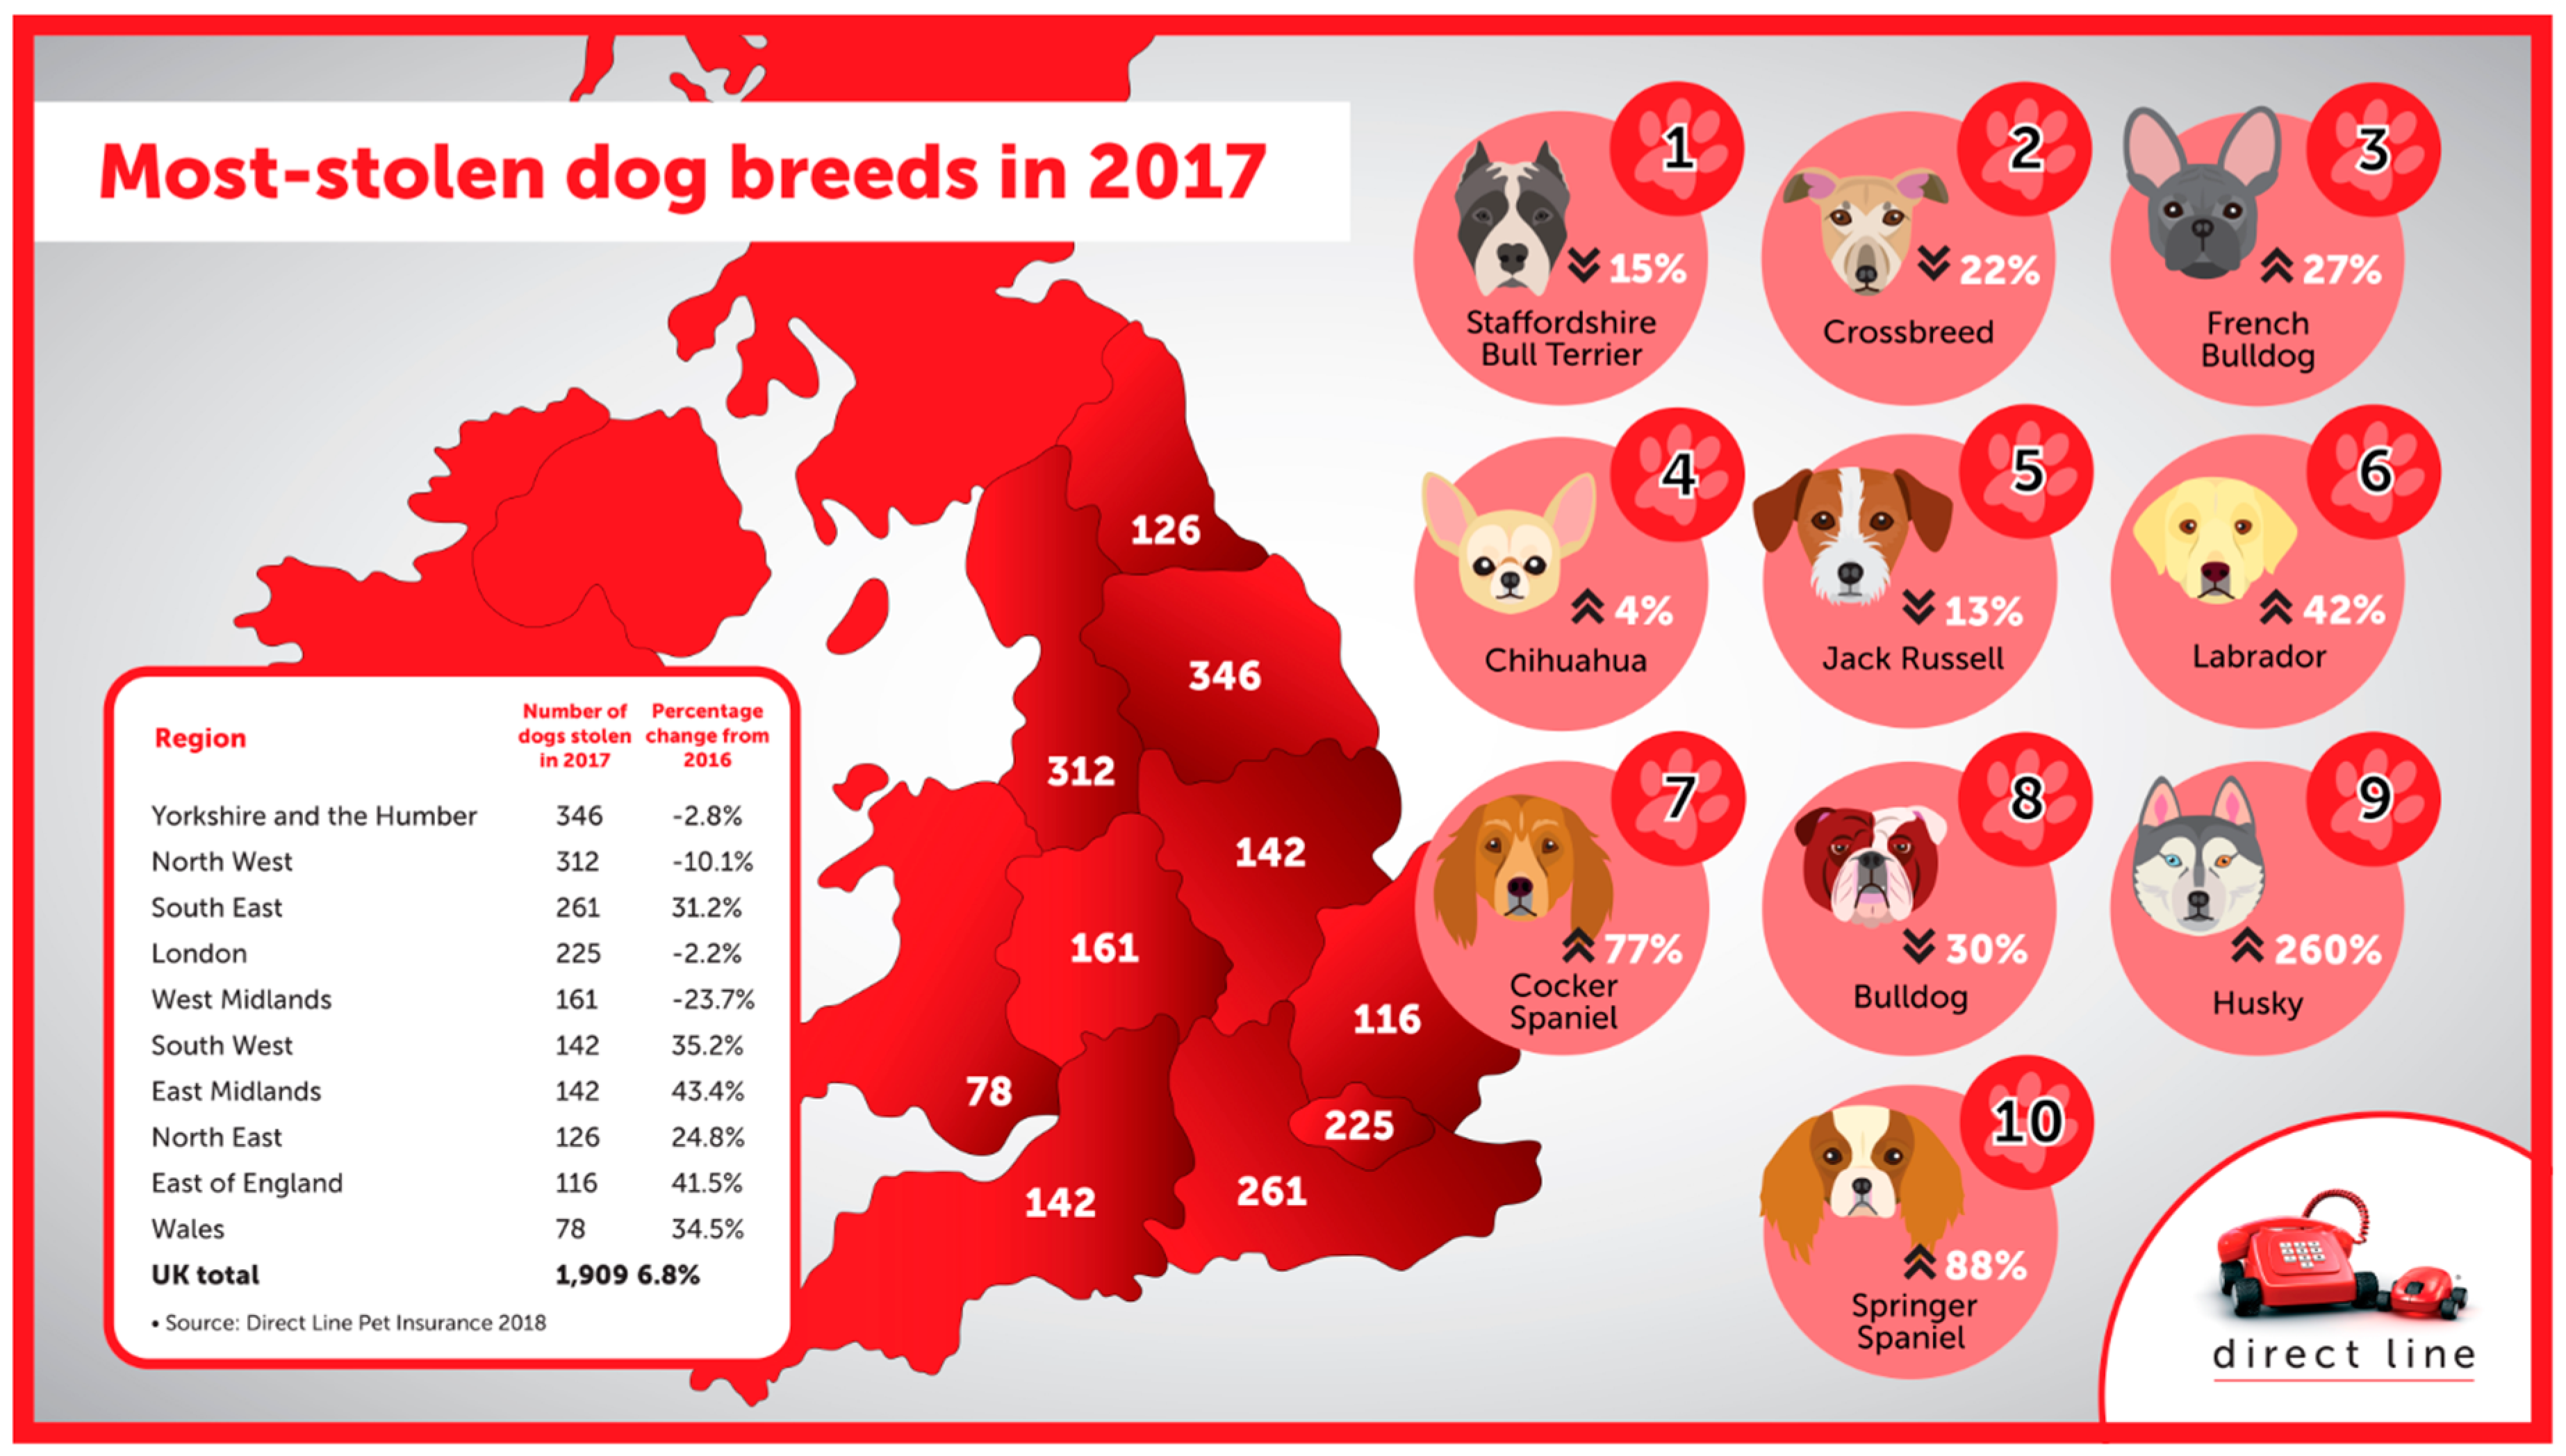
| Police Force Area | Number of Dogs Stolen 2017 (Emporium, FOI January 2018) | Number of Dogs Stolen 2017 (Direct Line, FOI February 2018) | Number of Dog Theft Crimes 2017 (Allen et al., FOI May 2018) |
|---|---|---|---|
| Avon and Somerset | 19 | 21 | 21 |
| Bedfordshire | 17 | 18 | 20 |
| Cambridgeshire | 36 | 40 | 41 |
| Cheshire | 1 | 4 | 4 |
| City of London | 0 | 0 | 0 |
| Cleveland | 24 | 28 | 25 |
| Cumbria | No Data | 23 | 24 |
| Derbyshire | 11 | 11 | 11 |
| Devon and Cornwall | 80 | 80 | 65 |
| Dorset | 28 | 28 | 16 |
| Durham | 51 | 51 | 37 |
| Dyfed-Powys | 70 | 36 | 31 |
| Essex | 60 | No Data | 52 |
| Gloucestershire | 14 | 13 | 10 |
| Greater Manchester | 148 | 157 | 146 |
| Gwent | 14 | 12 | 21 |
| Hampshire | No Data | No Data | No Data |
| Hertfordshire | 22 | 17 | 17 |
| Humberside | 44 | 52 | 51 |
| Kent | 130 | 160 | 130 |
| Lancashire | 116 | 99 | 93 |
| Leicestershire | 23 | 27 | 23 |
| Lincolnshire | 152 | 27 | 24 |
| Merseyside | 29 | 29 | 68 |
| Metropolitan Police | 225 | 225 | 169 |
| Norfolk | 31 | 29 | 29 |
| North Wales | No Data | No Data | 40 |
| North Yorkshire | 15 | 19 | 15 |
| Northamptonshire | 15 | 34 | 15 |
| Northumbria | 47 | 47 | 74 |
| Nottinghamshire | 43 | 43 | 43 |
| South Wales | 22 | 30 | 17 |
| South Yorkshire | 108 | 103 | 82 |
| Staffordshire | 73 | 76 | 70 |
| Suffolk | No Data | 12 | 13 |
| Surrey | 9 | 8 | 8 |
| Sussex | No Data | No Data | No Data |
| Thames Valley | No Data | 93 | 72 |
| Warwickshire | 12 | 12 | 13 |
| West Mercia | 63 | 40 | 35 |
| West Midlands | 31 | 33 | 29 |
| West Yorkshire | 221 | 172 | 172 |
| Wiltshire | 17 | No Data | No Data |
© 2019 by the authors. Licensee MDPI, Basel, Switzerland. This article is an open access article distributed under the terms and conditions of the Creative Commons Attribution (CC BY) license (http://creativecommons.org/licenses/by/4.0/).
Share and Cite
Allen, D.; Peacock, A.; Arathoon, J. Spatialities of Dog Theft: A Critical Perspective. Animals 2019, 9, 209. https://doi.org/10.3390/ani9050209
Allen D, Peacock A, Arathoon J. Spatialities of Dog Theft: A Critical Perspective. Animals. 2019; 9(5):209. https://doi.org/10.3390/ani9050209
Chicago/Turabian StyleAllen, Daniel, Adam Peacock, and Jamie Arathoon. 2019. "Spatialities of Dog Theft: A Critical Perspective" Animals 9, no. 5: 209. https://doi.org/10.3390/ani9050209
APA StyleAllen, D., Peacock, A., & Arathoon, J. (2019). Spatialities of Dog Theft: A Critical Perspective. Animals, 9(5), 209. https://doi.org/10.3390/ani9050209