Gut Microbiota Shifts in Pup Athymic BALB/c Mice: An Updated Identification in Nude Mice

Simple Summary
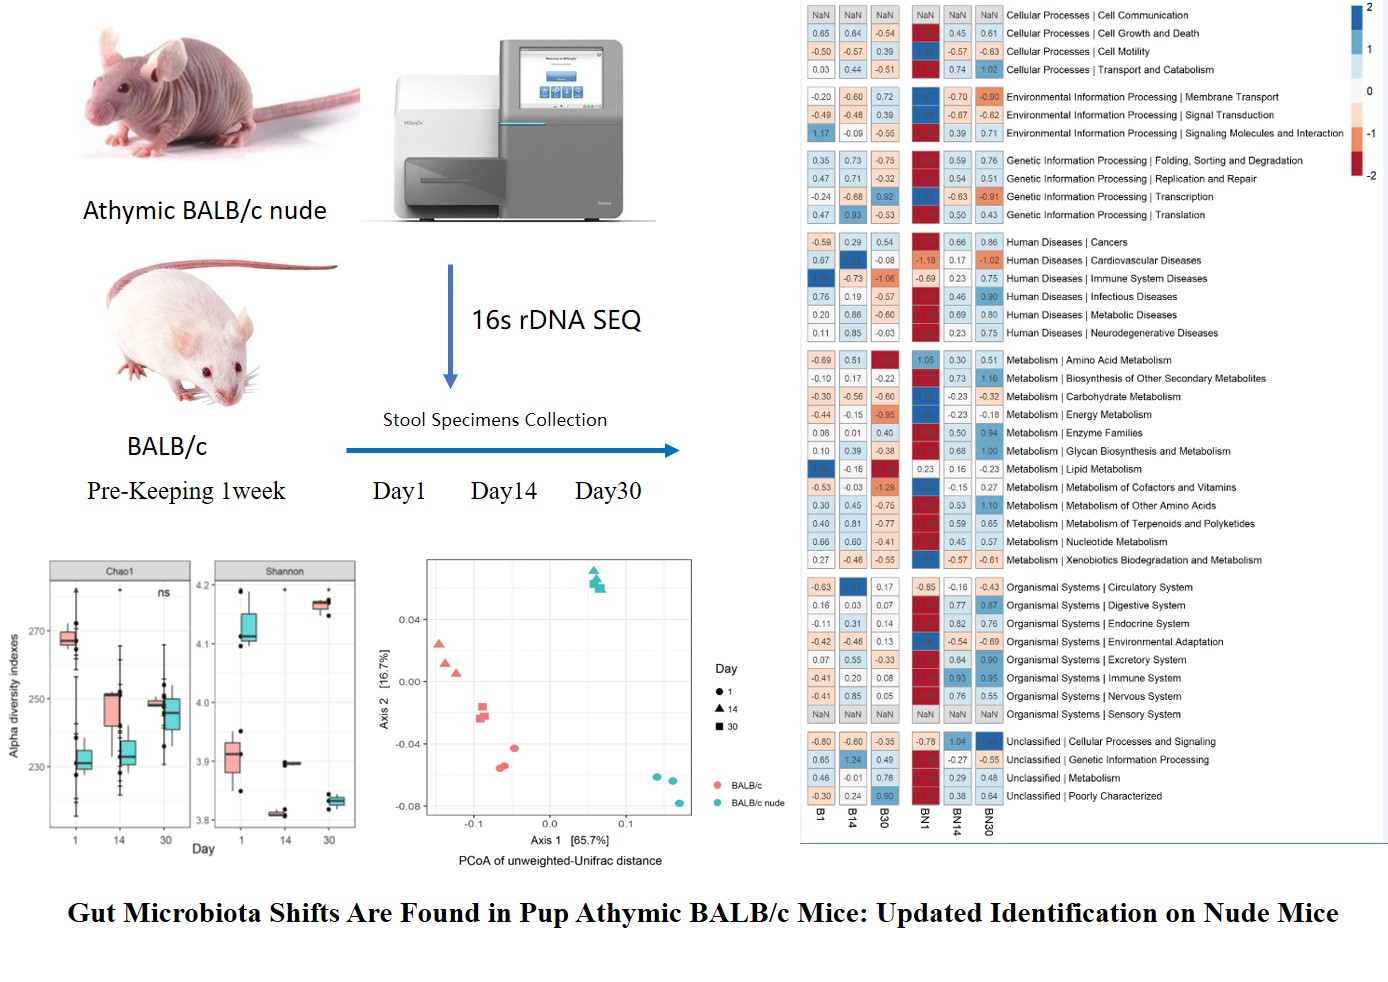
Abstract

1. Introduction
2. Materials and Methods
2.1. Subjects and Sampling
2.2. Sequencing and Reads Assembly
2.3. Statistical Analysis
3. Results
3.1. Overview of 16S rDNA Sequencing Data
3.2. Variation in Gut Microbioal Diversities in Nude Mice
3.3. Variation in Gut Microbial Composition of Nude Mice
3.4. Functional Variation in Gut Microbiota in Nude Mice
4. Discussion
5. Conclusions
Supplementary Materials
Author Contributions
Funding
Acknowledgments
Conflicts of Interest
References
- Ley, R.E.; Lozupone, C.A.; Hamady, M.; Knight, R.; Gordon, J.I. Worlds within worlds: evolution of the vertebrate gut microbiota. Nature Rev. Microbiol. 2008, 6, 776–788. [Google Scholar] [CrossRef]
- Grönlund, M.-M.; Arvilommi, H.; Kero, P.; Lehtonen, O.-P.; Isolauri, E. Importance of intestinal colonisation in the maturation of humoral immunity in early infancy: a prospective follow up study of healthy infants aged 0–6 months. Arch. Dis. Child. Fetal Neonatal Ed. 2000, 83, F186–F192. [Google Scholar] [CrossRef] [PubMed]
- Emmerling, P.; Finger, H.; Bockemühl, J. Listeria monocytogenes infection in nude mice. Infect. Immun. 1975, 12, 437–439. [Google Scholar] [PubMed]
- Belizário, J.E. Immunodeficient Mouse Models: An Overview. Open Immunol. J. 2009, 2, 79–85. [Google Scholar] [CrossRef]
- Fogh, J.; Fogh, J.M.; Orfeo, T. One hundred and twenty-seven cultured human tumor cell lines producing tumors in nude mice. J. Natl. Cancer Inst. 1977, 59, 221–226. [Google Scholar] [CrossRef]
- Brown, J.F.; Balish, E. Gastrointestinal Microecology of BALB/c Nude Mice. Appl. Environ. Microbiol. 1978, 36, 144–159. [Google Scholar]
- Lutter, L.; van Konijnenburg, D.P.H.; Brand, E.C.; Oldenburg, B.; van Wijk, F. The elusive case of human intraepithelial T cells in gut homeostasis and inflammation. Nat. Clin. Pract. Gastroenterol. Hepatol. 2018, 15, 637–649. [Google Scholar] [CrossRef]
- Chen, B.; Ni, X.; Sun, R.; Zeng, B.; Wei, H.; Tian, Z.; Wei, H. Commensal Bacteria-Dependent CD8αβ(+) T Cells in the Intestinal Epithelium Produce Antimicrobial Peptides. Front. Immunol. 2018, 9, 1065. [Google Scholar] [CrossRef]
- Grizotte-Lake, M.; Zhong, G.; Duncan, K.; Kirkwood, J.; Iyer, N.; Smolenski, I.; Isoherranen, N.; Vaishnava, S. Commensals Suppress Intestinal Epithelial Cell Retinoic Acid Synthesis to Regulate Interleukin-22 Activity and Prevent Microbial Dysbiosis. Immunity 2018, 49, 1103–1115.e1106. [Google Scholar] [CrossRef] [PubMed]
- Campbell, C.; Dikiy, S.; Bhattarai, S.K.; Chinen, T.; Matheis, F.; Calafiore, M.; Hoyos, B.; Hanash, A.; Mucida, D.; Bucci, V.; et al. Extrathymically Generated Regulatory T Cells Establish a Niche for Intestinal Border-Dwelling Bacteria and Affect Physiologic Metabolite Balance. Immunity 2018, 48, 1245–1257. [Google Scholar] [CrossRef] [PubMed]
- Lau, J.T.; Whelan, F.J.; Herath, I.; Lee, C.H.; Collins, S.M.; Bercik, P.; Surette, M.G. Capturing the diversity of the human gut microbiota through culture-enriched molecular profiling. Genome Med. 2016, 8, 72. [Google Scholar] [CrossRef]
- Caporaso, J.G.; Kuczynski, J.; Stombaugh, J.; Bittinger, K.; Bushman, F.D.; Costello, E.K.; Fierer, N.; Peña, A.G.; Goodrich, J.K.; Gordon, J.I.; et al. QIIME allows analysis of high-throughput community sequencing data. Nat. Methods 2010, 7, 335–336. [Google Scholar] [CrossRef]
- Shatzkes, K.; Tang, C.; Singleton, E.; Shukla, S.; Zuena, M.; Gupta, S.; Dharani, S.; Rinaggio, J.; Connell, N.D.; Kadouri, D.E. Effect of predatory bacteria on the gut bacterial microbiota in rats. Sci. Rep. 2017, 7, e43483. [Google Scholar] [CrossRef]
- McMurdie, P.J.; Holmes, S. Waste Not, Want Not: Why Rarefying Microbiome Data Is Inadmissible. PLoS Comput. Biol. 2014, 10, e1003531. [Google Scholar] [CrossRef]
- Liu, G.; Yan, W.; Ding, S.; Jiang, H.; Ma, Y.; Wang, H.; Fang, J. Effects of IRW and IQW on Oxidative Stress and Gut Microbiota in Dextran Sodium Sulfate-Induced Colitis. Cell. Physiol. Biochem. 2018, 51, 441–451. [Google Scholar] [CrossRef]
- Lozupone, C.; Lladser, M.E.; Knights, D.; Stombaugh, J.; Knight, R. UniFrac: an effective distance metric for microbial community comparison. ISME J. 2010, 5, 169–172. [Google Scholar] [CrossRef]
- Van Immerseel, F.; Ducatelle, R.; De Vos, M.; Boon, N.; Van De Wiele, T.; Verbeke, K.; Rutgeerts, P.; Sas, B.; Louis, P.; Flint, H.J. Butyric acid-producing anaerobic bacteria as a novel probiotic treatment approach for inflammatory bowel disease. J. Med. Microbiol. 2010, 59, 141–143. [Google Scholar] [CrossRef]
- McHardy, I.H.; Goudarzi, M.; Tong, M.; Ruegger, P.M.; Schwager, E.; Weger, J.R.; Graeber, T.G.; Sonnenburg, J.L.; Horvath, S.; Huttenhower, C.; et al. Integrative analysis of the microbiome and metabolome of the human intestinal mucosal surface reveals exquisite inter-relationships. Microbiome 2013, 1, 17. [Google Scholar] [CrossRef]
- De Muinck, E.J.; Trosvik, P. Individuality and convergence of the infant gut microbiota during the first year of life. Nat. Commun. 2018, 9, 2233. [Google Scholar] [CrossRef]
- Bäckhed, F.; Roswall, J.; Peng, Y.; Feng, Q.; Jia, H.; Kovatcheva-Datchary, P.; Li, Y.; Xia, Y.; Xie, H.; Zhong, H.; et al. Dynamics and Stabilization of the Human Gut Microbiome during the First Year of Life. Cell Host Microbe 2015, 17, 690–703. [Google Scholar] [CrossRef]
- Pan, W.; Kang, Y. Gut microbiota and chronic kidney disease: implications for novel mechanistic insights and therapeutic strategies. Int. Urol. Nephrol. 2018, 50, 289–299. [Google Scholar] [CrossRef]
- Turnbaugh, P.J.; Ley, R.E.; Mahowald, M.A.; Magrini, V.; Mardis, E.R.; Gordon, J.I. An obesity-associated gut microbiome with increased capacity for energy harvest. Nature 2006, 444, 1027–1031. [Google Scholar] [CrossRef]
- Bäckhed, F.; Ding, H.; Wang, T.; Hooper, L.V.; Koh, G.Y.; Nagy, A.; Semenkovich, C.F.; Gordon, J.I. The gut microbiota as an environmental factor that regulates fat storage. Proc. Natl. Acad. Sci. USA 2004, 101, 15718–15723. [Google Scholar] [CrossRef]
- Gueimonde, M.; Sakata, S.; Kalliomaki, M.; Isolauri, E.; Benno, Y.; Salminen, S. Effect of maternal consumption of Lactobacillus GG on transfer and establishment of fecal bifidobacterial microbiota in neonates. J. Ped. Gastroenterol. Nutr. 2006, 42, 166–170. [Google Scholar] [CrossRef]
- Hinde, K. Milk composition varies in relation to the presence and abundance of Balantidium coli in the mother in captive rhesus macaques (Macaca mulatta). Am. J. Primatol. 2007, 69, 625–634. [Google Scholar] [CrossRef]
- Jenness, R. Composition of Milk. In Fundamentals of Dairy Chemistry; Jenness, R., Keeney, M., Marth, E.H., Eds.; Springer: Boston, MA, USA, 1988; pp. 1–38. [Google Scholar] [CrossRef]
- Hougen, H.P. The athymic nude rat Immunobiological characteristics with special reference to establishment of non-antigen-specific T-cell reactivity and induction of antigen-specific immunity. APMIS 1991, 99, 9–39. [Google Scholar] [CrossRef]
- Nyangahu, D.D.; Lennard, K.S.; Brown, B.P.; Darby, M.G.; Wendoh, J.M.; Havyarimana, E.; Smith, P.; Butcher, J.; Stintzi, A.; Mulder, N.; et al. Disruption of maternal gut microbiota during gestation alters offspring microbiota and immunity. Microbiome 2018, 6, 124. [Google Scholar] [CrossRef]
- Milani, C.; Duranti, S.; Bottacini, F.; Casey, E.; Turroni, F.; Mahony, J.; Belzer, C.; Delgado Palacio, S.; Arboleya Montes, S.; Mancabelli, L.; et al. The First Microbial Colonizers of the Human Gut: Composition, Activities, and Health Implications of the Infant Gut Microbiota. Microbiol. Mol. Biol. Rev. 2017, 81, e00036-17. [Google Scholar] [CrossRef]
- Kosumi, K.; Hamada, T.; Koh, H.; Borowsky, J.; Bullman, S.; Twombly, T.S.; Nevo, D.; Masugi, Y.; Liu, L.; da Silva, A.; et al. The Amount of Bifidobacterium Genus in Colorectal Carcinoma Tissue in Relation to Tumor Characteristics and Clinical Outcome. Am. J. Pathol. 2018, 188, 2839–2852. [Google Scholar] [CrossRef]
- Mooser, C.; Gomez de Agüero, M.; Ganal-Vonarburg, S.C. Standardization in host–microbiota interaction studies: Challenges, gnotobiology as a tool, and perspective. Curr. Opin. Microbiol. 2018, 44, 50–60. [Google Scholar] [CrossRef]
- Langille, M.G.I.; Zaneveld, J.; Caporaso, J.G.; McDonald, D.; Knights, D.; Reyes, J.A.; Clemente, J.C.; Burkepile, D.E.; Vega Thurber, R.L.; Knight, R.; et al. Predictive functional profiling of microbial communities using 16S rRNA marker gene sequences. Nat. Biotechnol. 2013, 31, 814–821. [Google Scholar] [CrossRef]
- Carmody, R.N.; Turnbaugh, P.J. Host-microbial interactions in the metabolism of therapeutic and diet-derived xenobiotics. J. Clin. Investig. 2014, 124, 4173–4181. [Google Scholar] [CrossRef]
- Chua, W.-J.; Hansen, T.H. Vitamins prime immunity. Nature 2012, 491, 680. [Google Scholar] [CrossRef]


© 2019 by the authors. Licensee MDPI, Basel, Switzerland. This article is an open access article distributed under the terms and conditions of the Creative Commons Attribution (CC BY) license (http://creativecommons.org/licenses/by/4.0/).
Share and Cite
Li, Y.; Sun, H.; Du, B.; Xu, H. Gut Microbiota Shifts in Pup Athymic BALB/c Mice: An Updated Identification in Nude Mice. Animals 2019, 9, 151. https://doi.org/10.3390/ani9040151
Li Y, Sun H, Du B, Xu H. Gut Microbiota Shifts in Pup Athymic BALB/c Mice: An Updated Identification in Nude Mice. Animals. 2019; 9(4):151. https://doi.org/10.3390/ani9040151
Chicago/Turabian StyleLi, Yuting, Hao Sun, Beibei Du, and Hui Xu. 2019. "Gut Microbiota Shifts in Pup Athymic BALB/c Mice: An Updated Identification in Nude Mice" Animals 9, no. 4: 151. https://doi.org/10.3390/ani9040151
APA StyleLi, Y., Sun, H., Du, B., & Xu, H. (2019). Gut Microbiota Shifts in Pup Athymic BALB/c Mice: An Updated Identification in Nude Mice. Animals, 9(4), 151. https://doi.org/10.3390/ani9040151