Data Mining and Validation of AMPK Pathway as a Novel Candidate Role Affecting Intramuscular Fat Content in Pigs


Abstract
:Simple Summary
Abstract
1. Introduction
2. Materials and Methods
2.1. GEO Data Collection
2.2. Identification of DEGs
2.3. Signaling Pathway Enrichment Analysis of DEGs
2.4. Animals and Tissue Collection
2.5. Determination of IMF Content
2.6. RNA Extraction and Quantitative Real-Time Reverse Transcription-Polymerase Chain Reaction (Qrt-PCR) Arrays
2.7. Western Blot Analysis
2.8. Statistical Analysis of the Qrt-PCR Array Results
3. Results
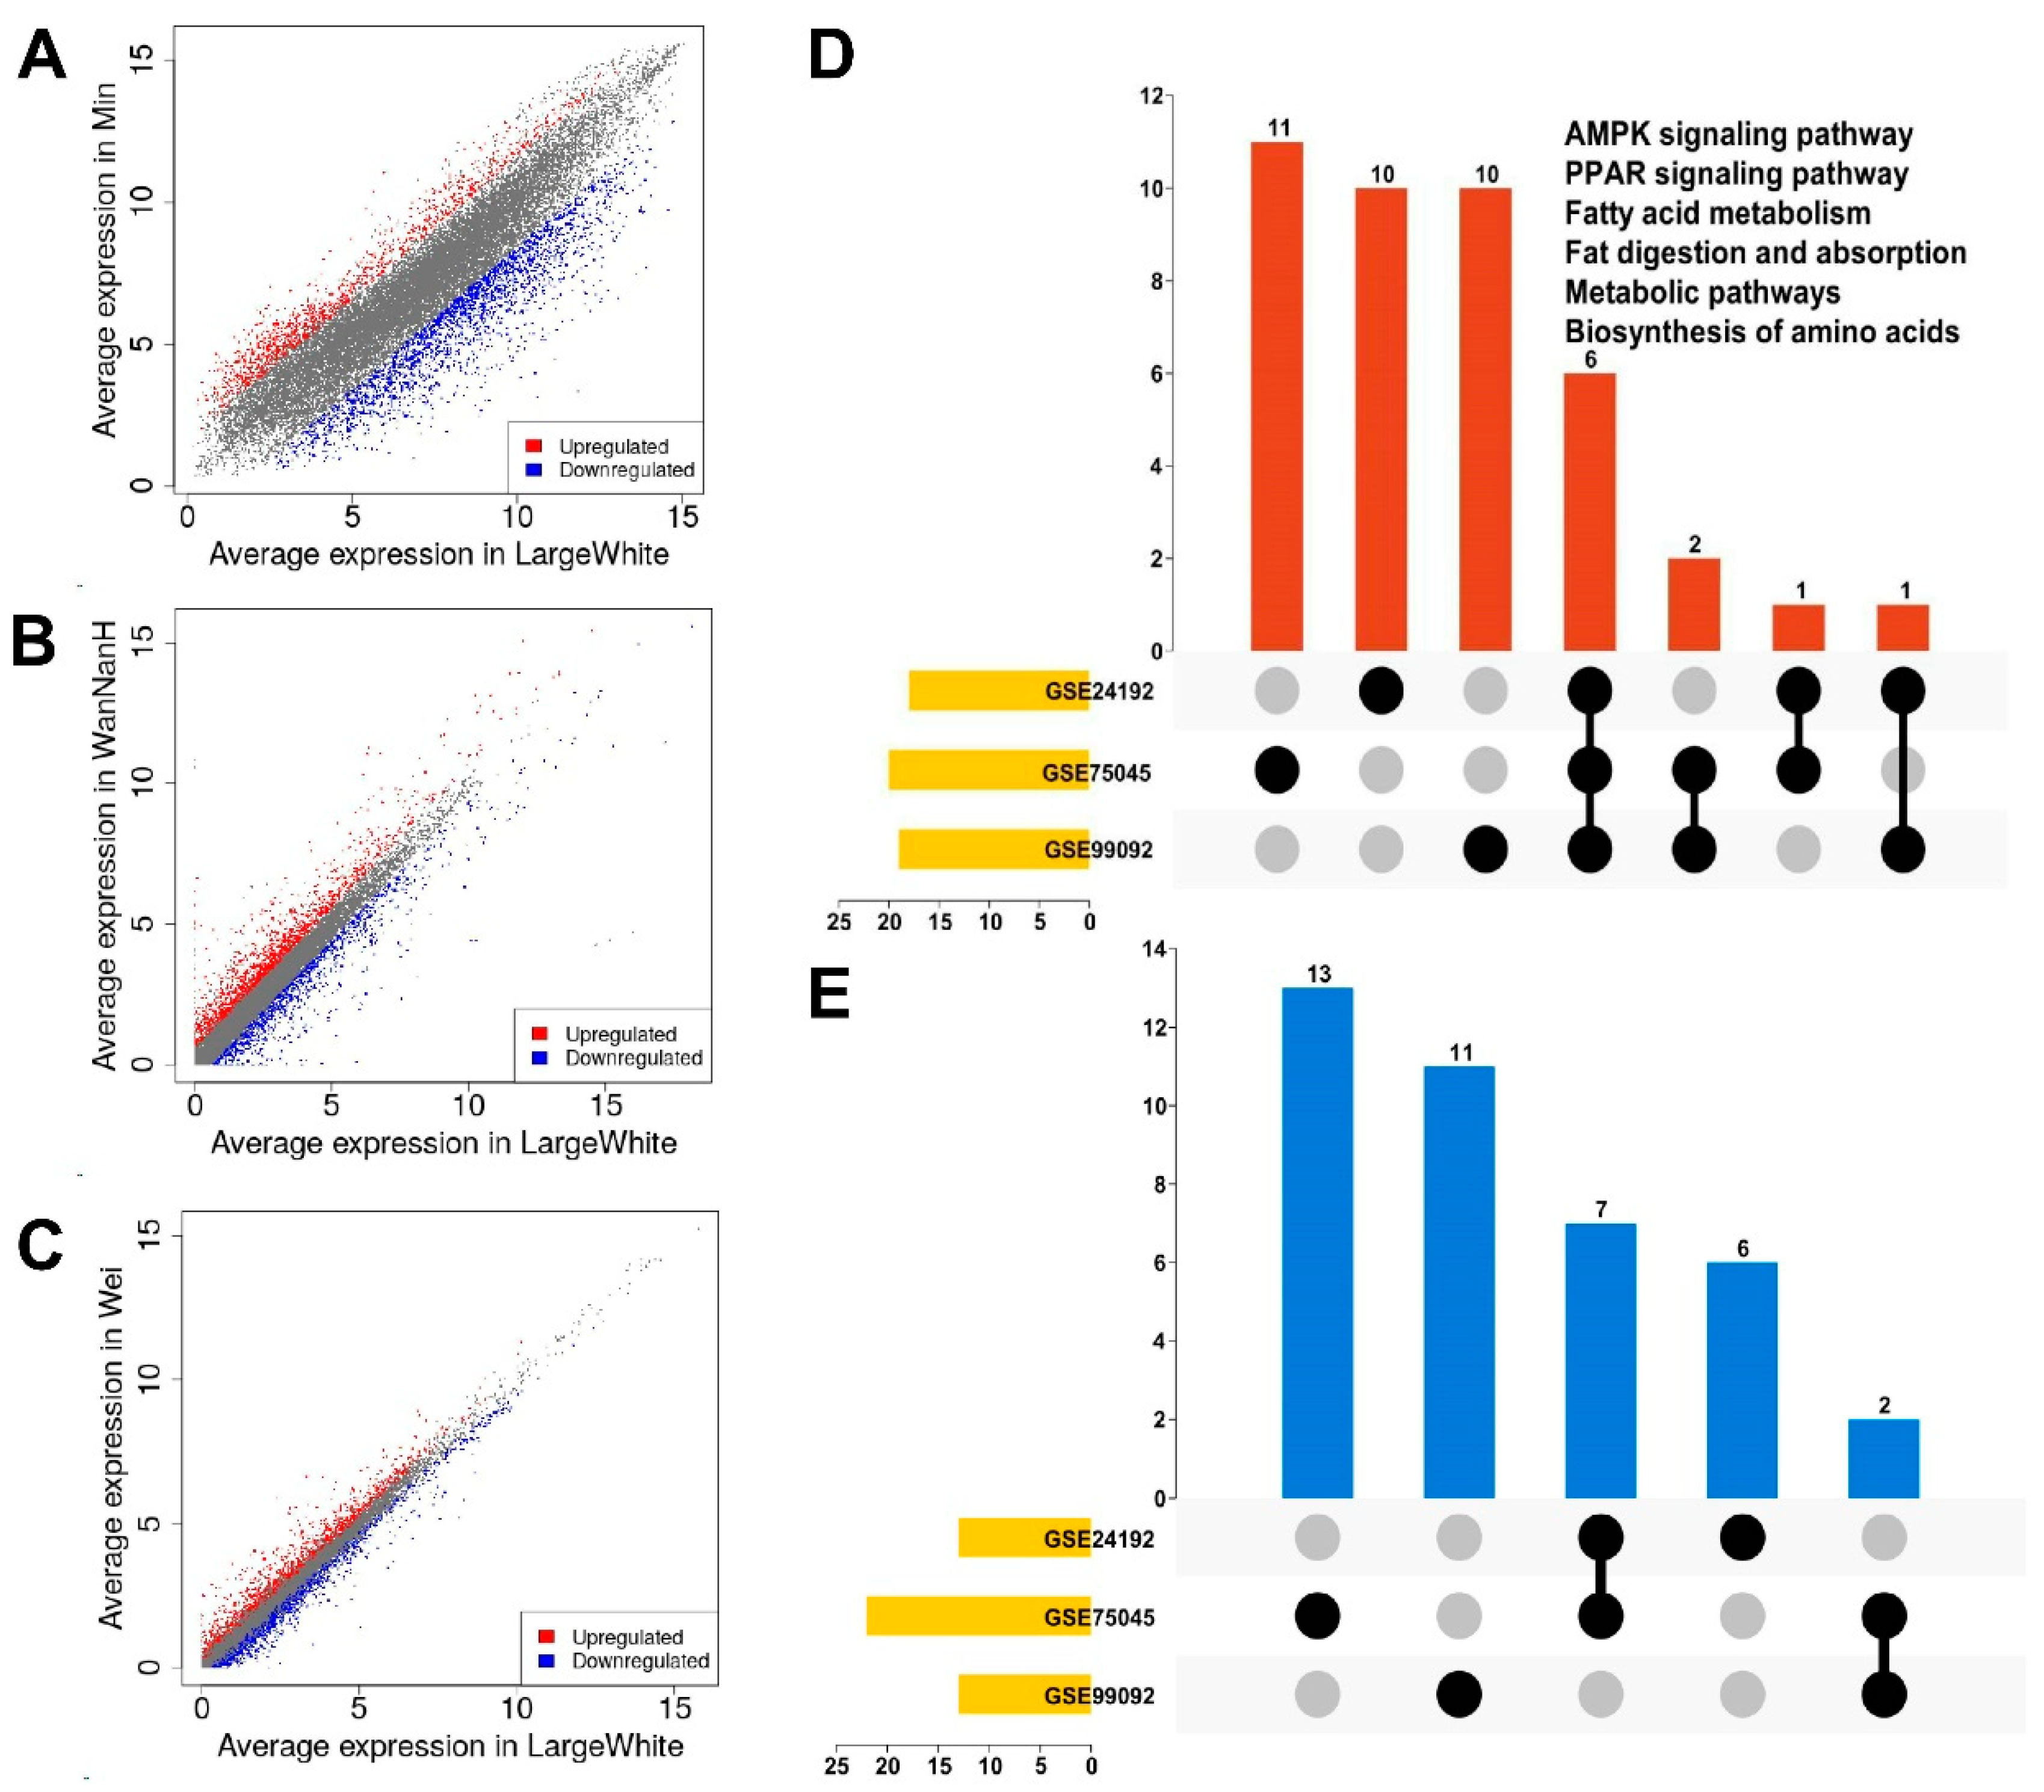
3.1. Identification of DEGs in GEO Datasets
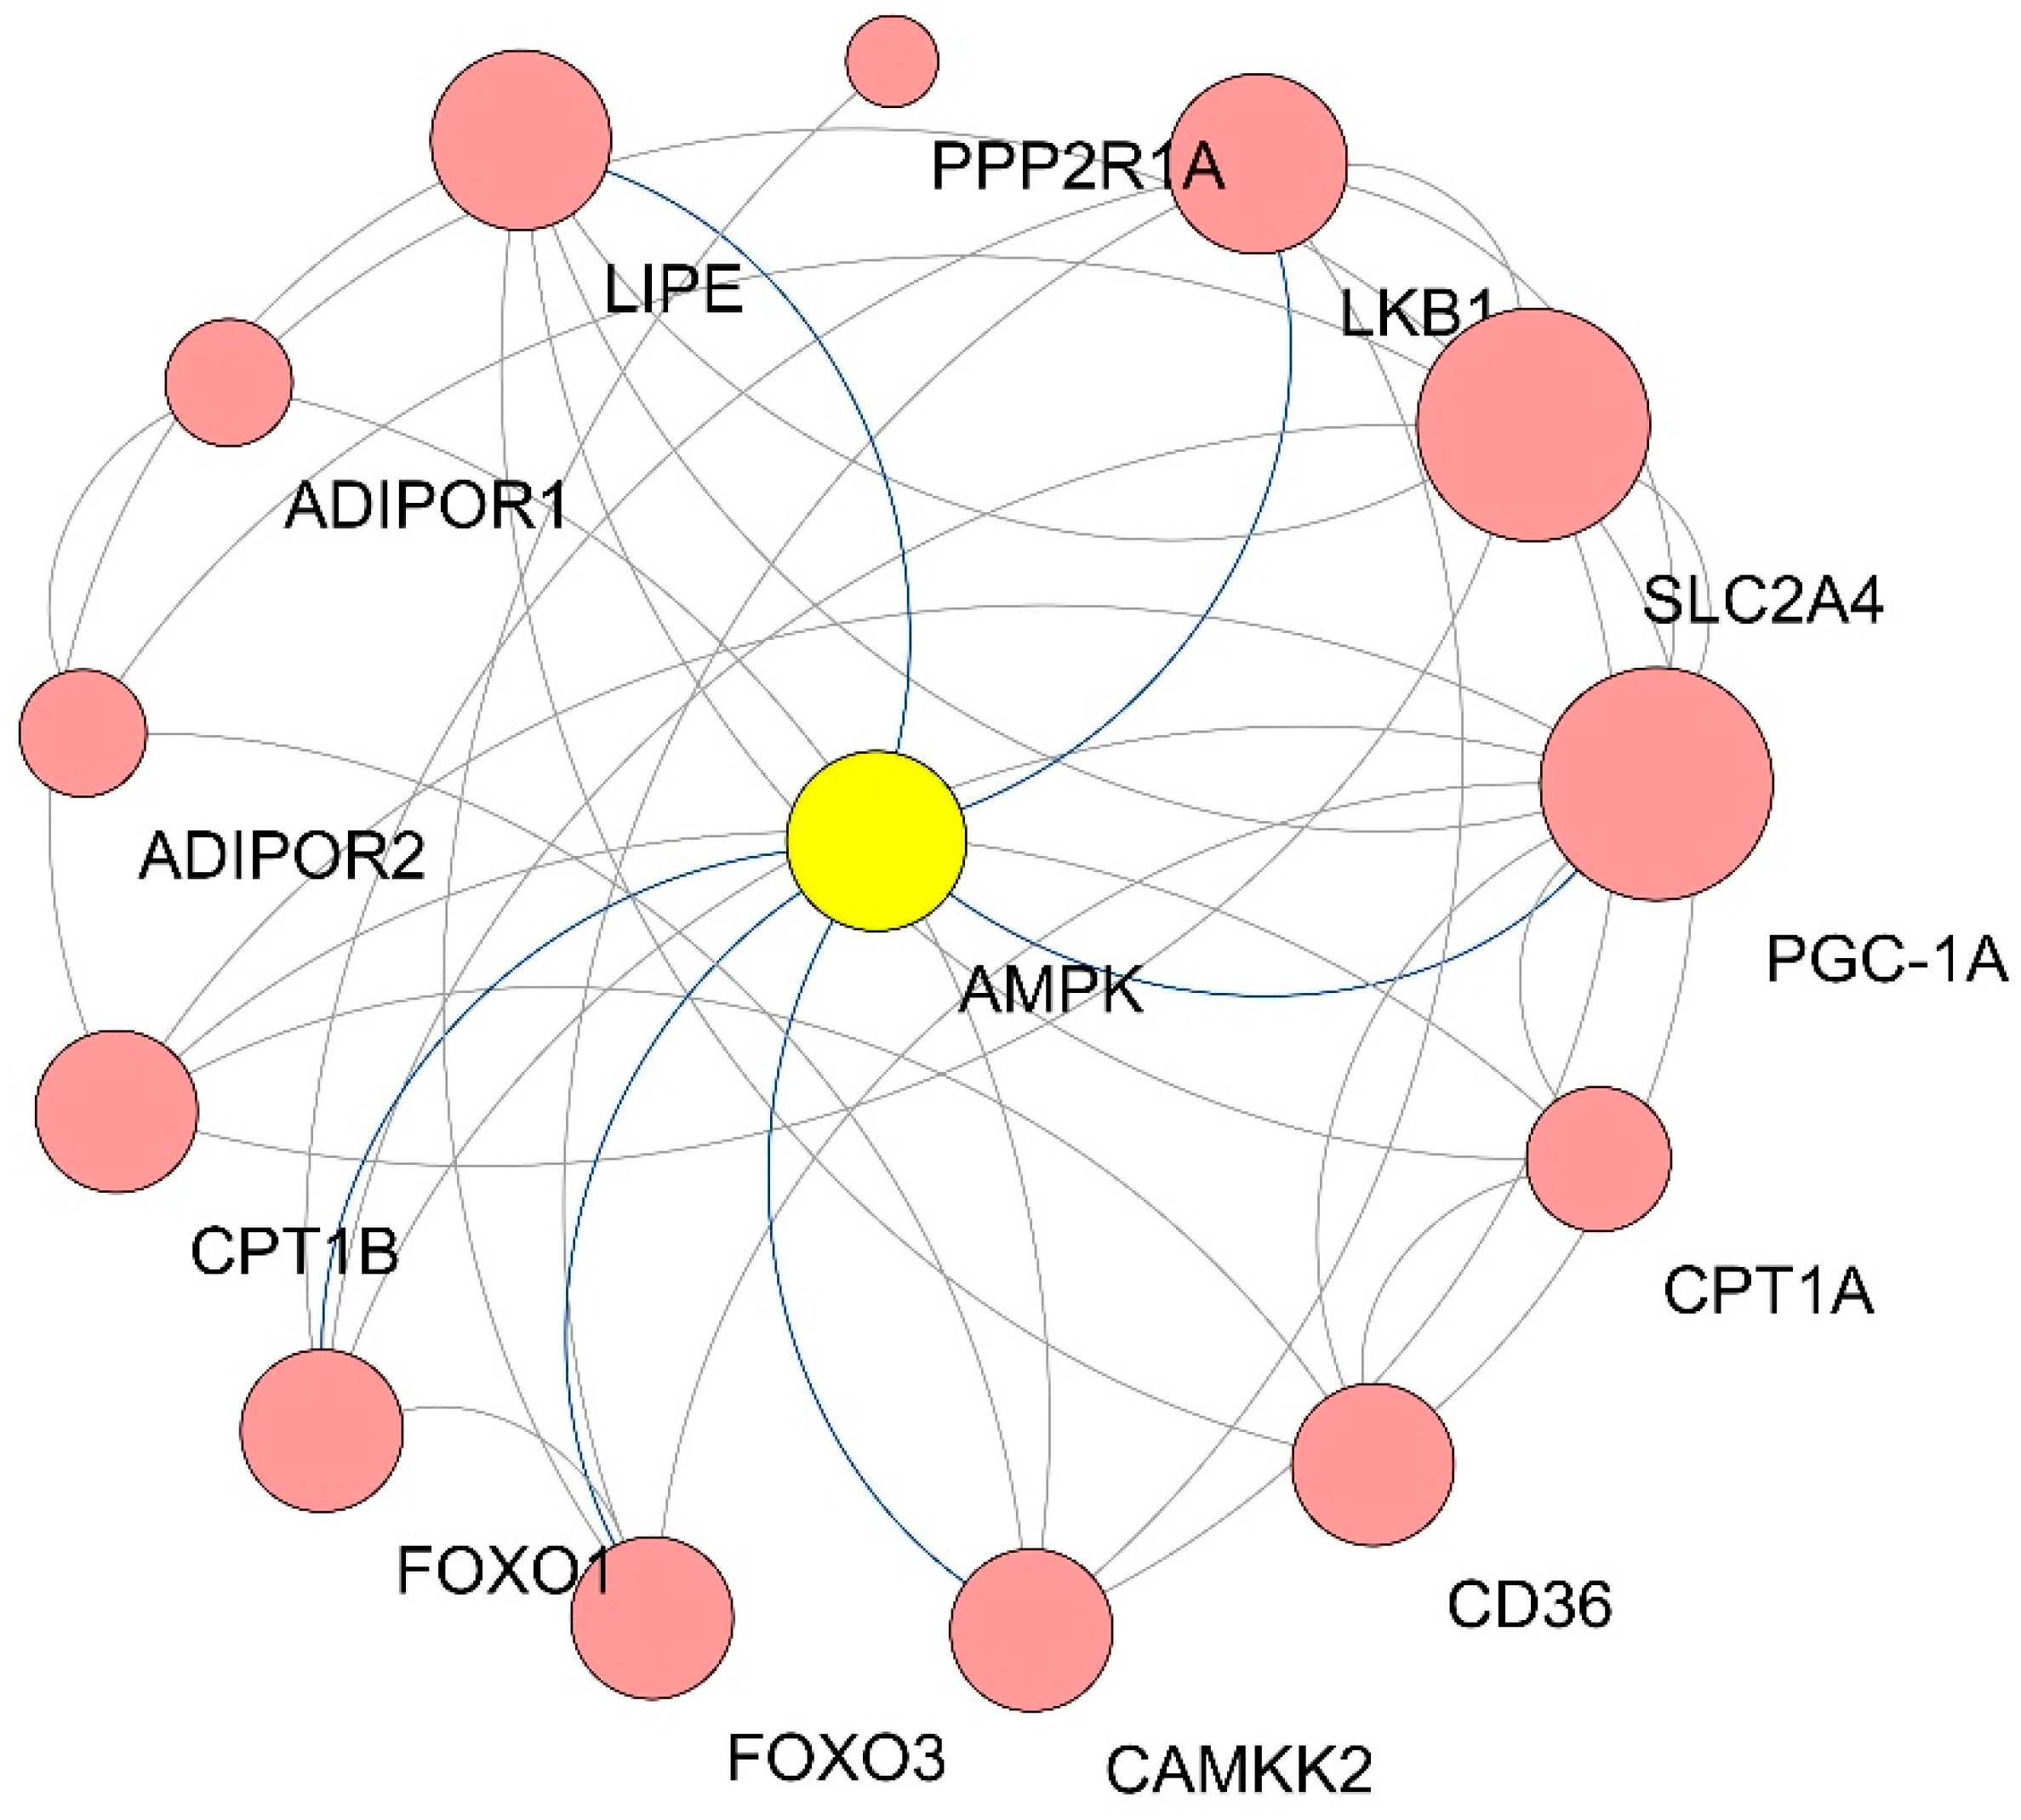
3.2. Pathway Enrichment of DEGs in GEO Datasets
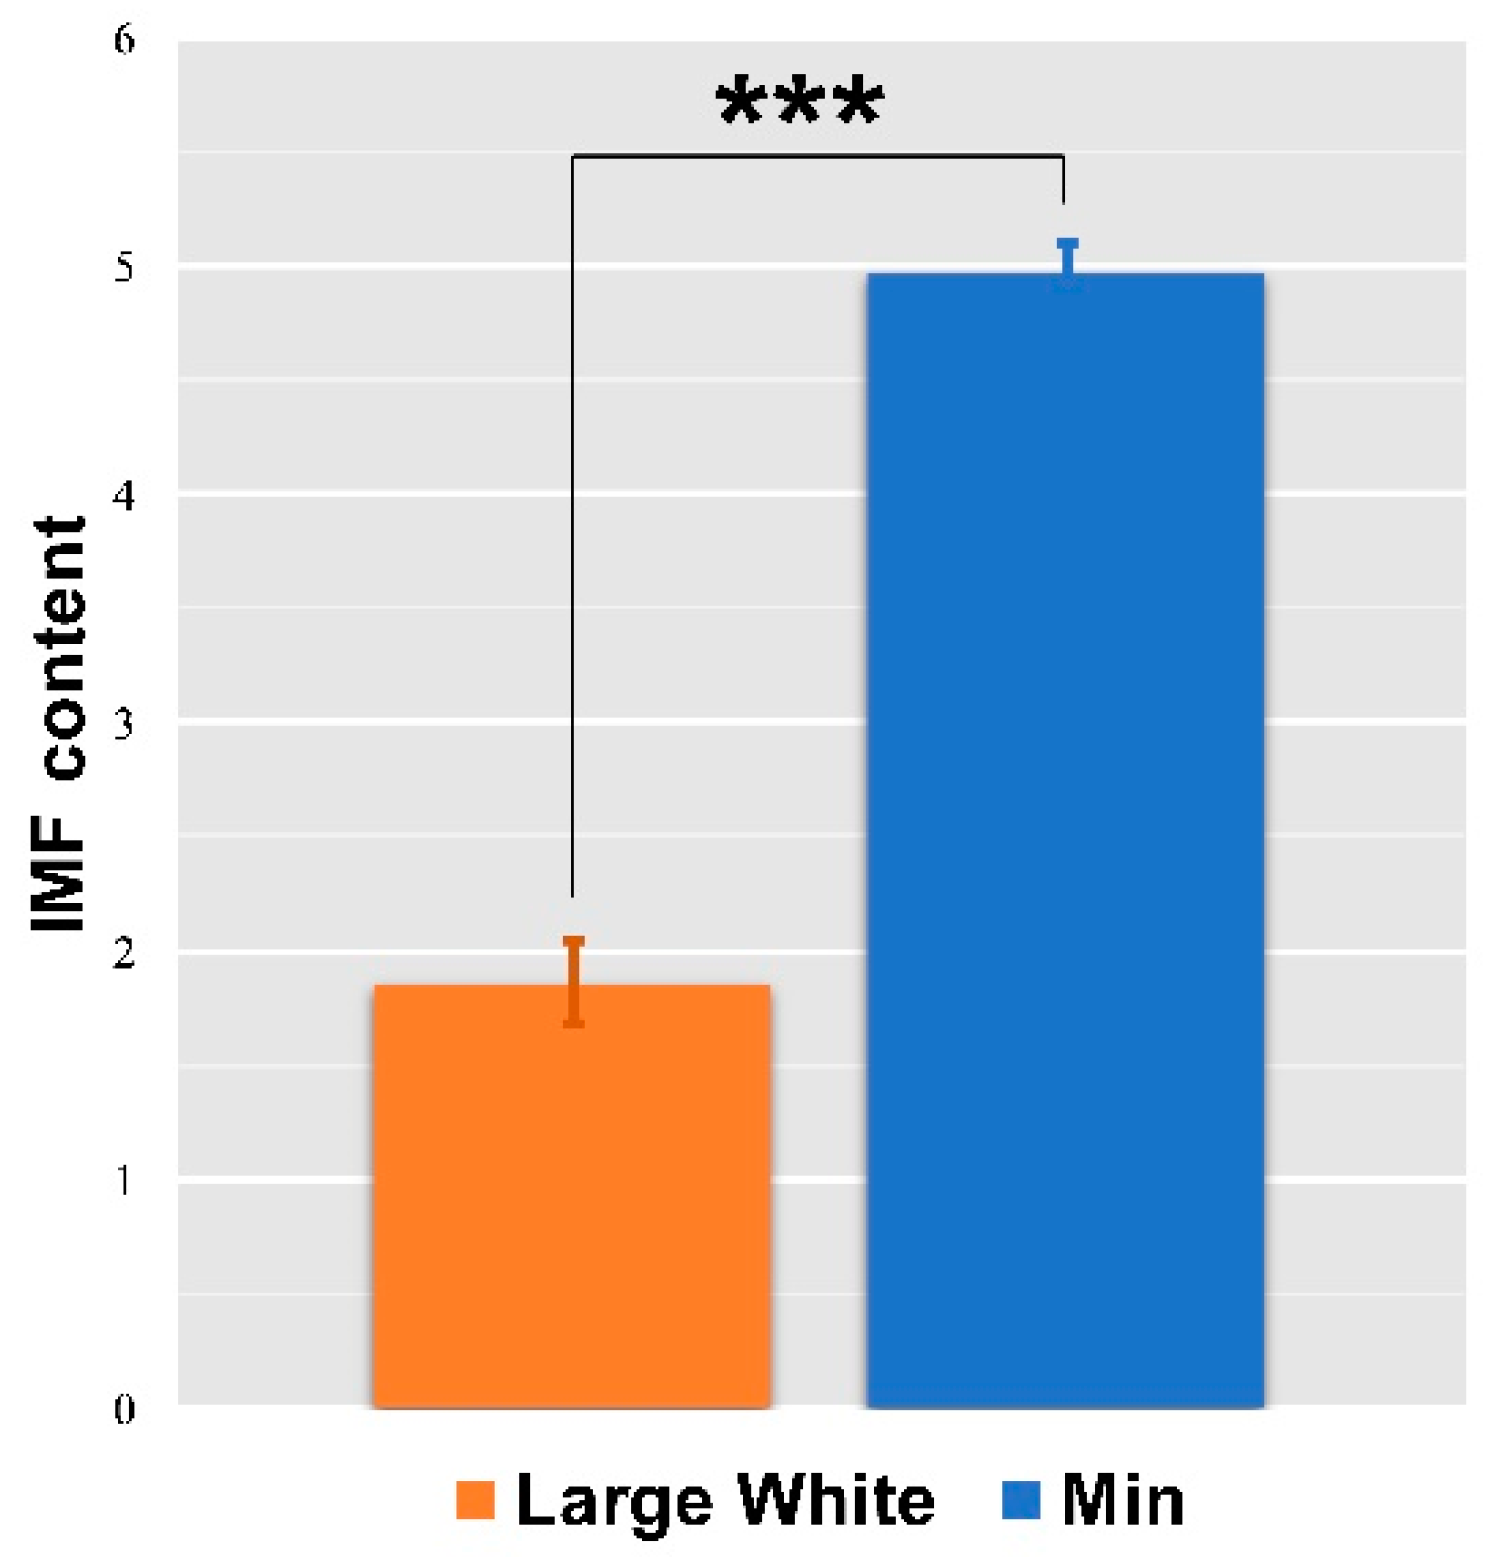
3.3. IMF Content of LD Muscles in the Two Pigs
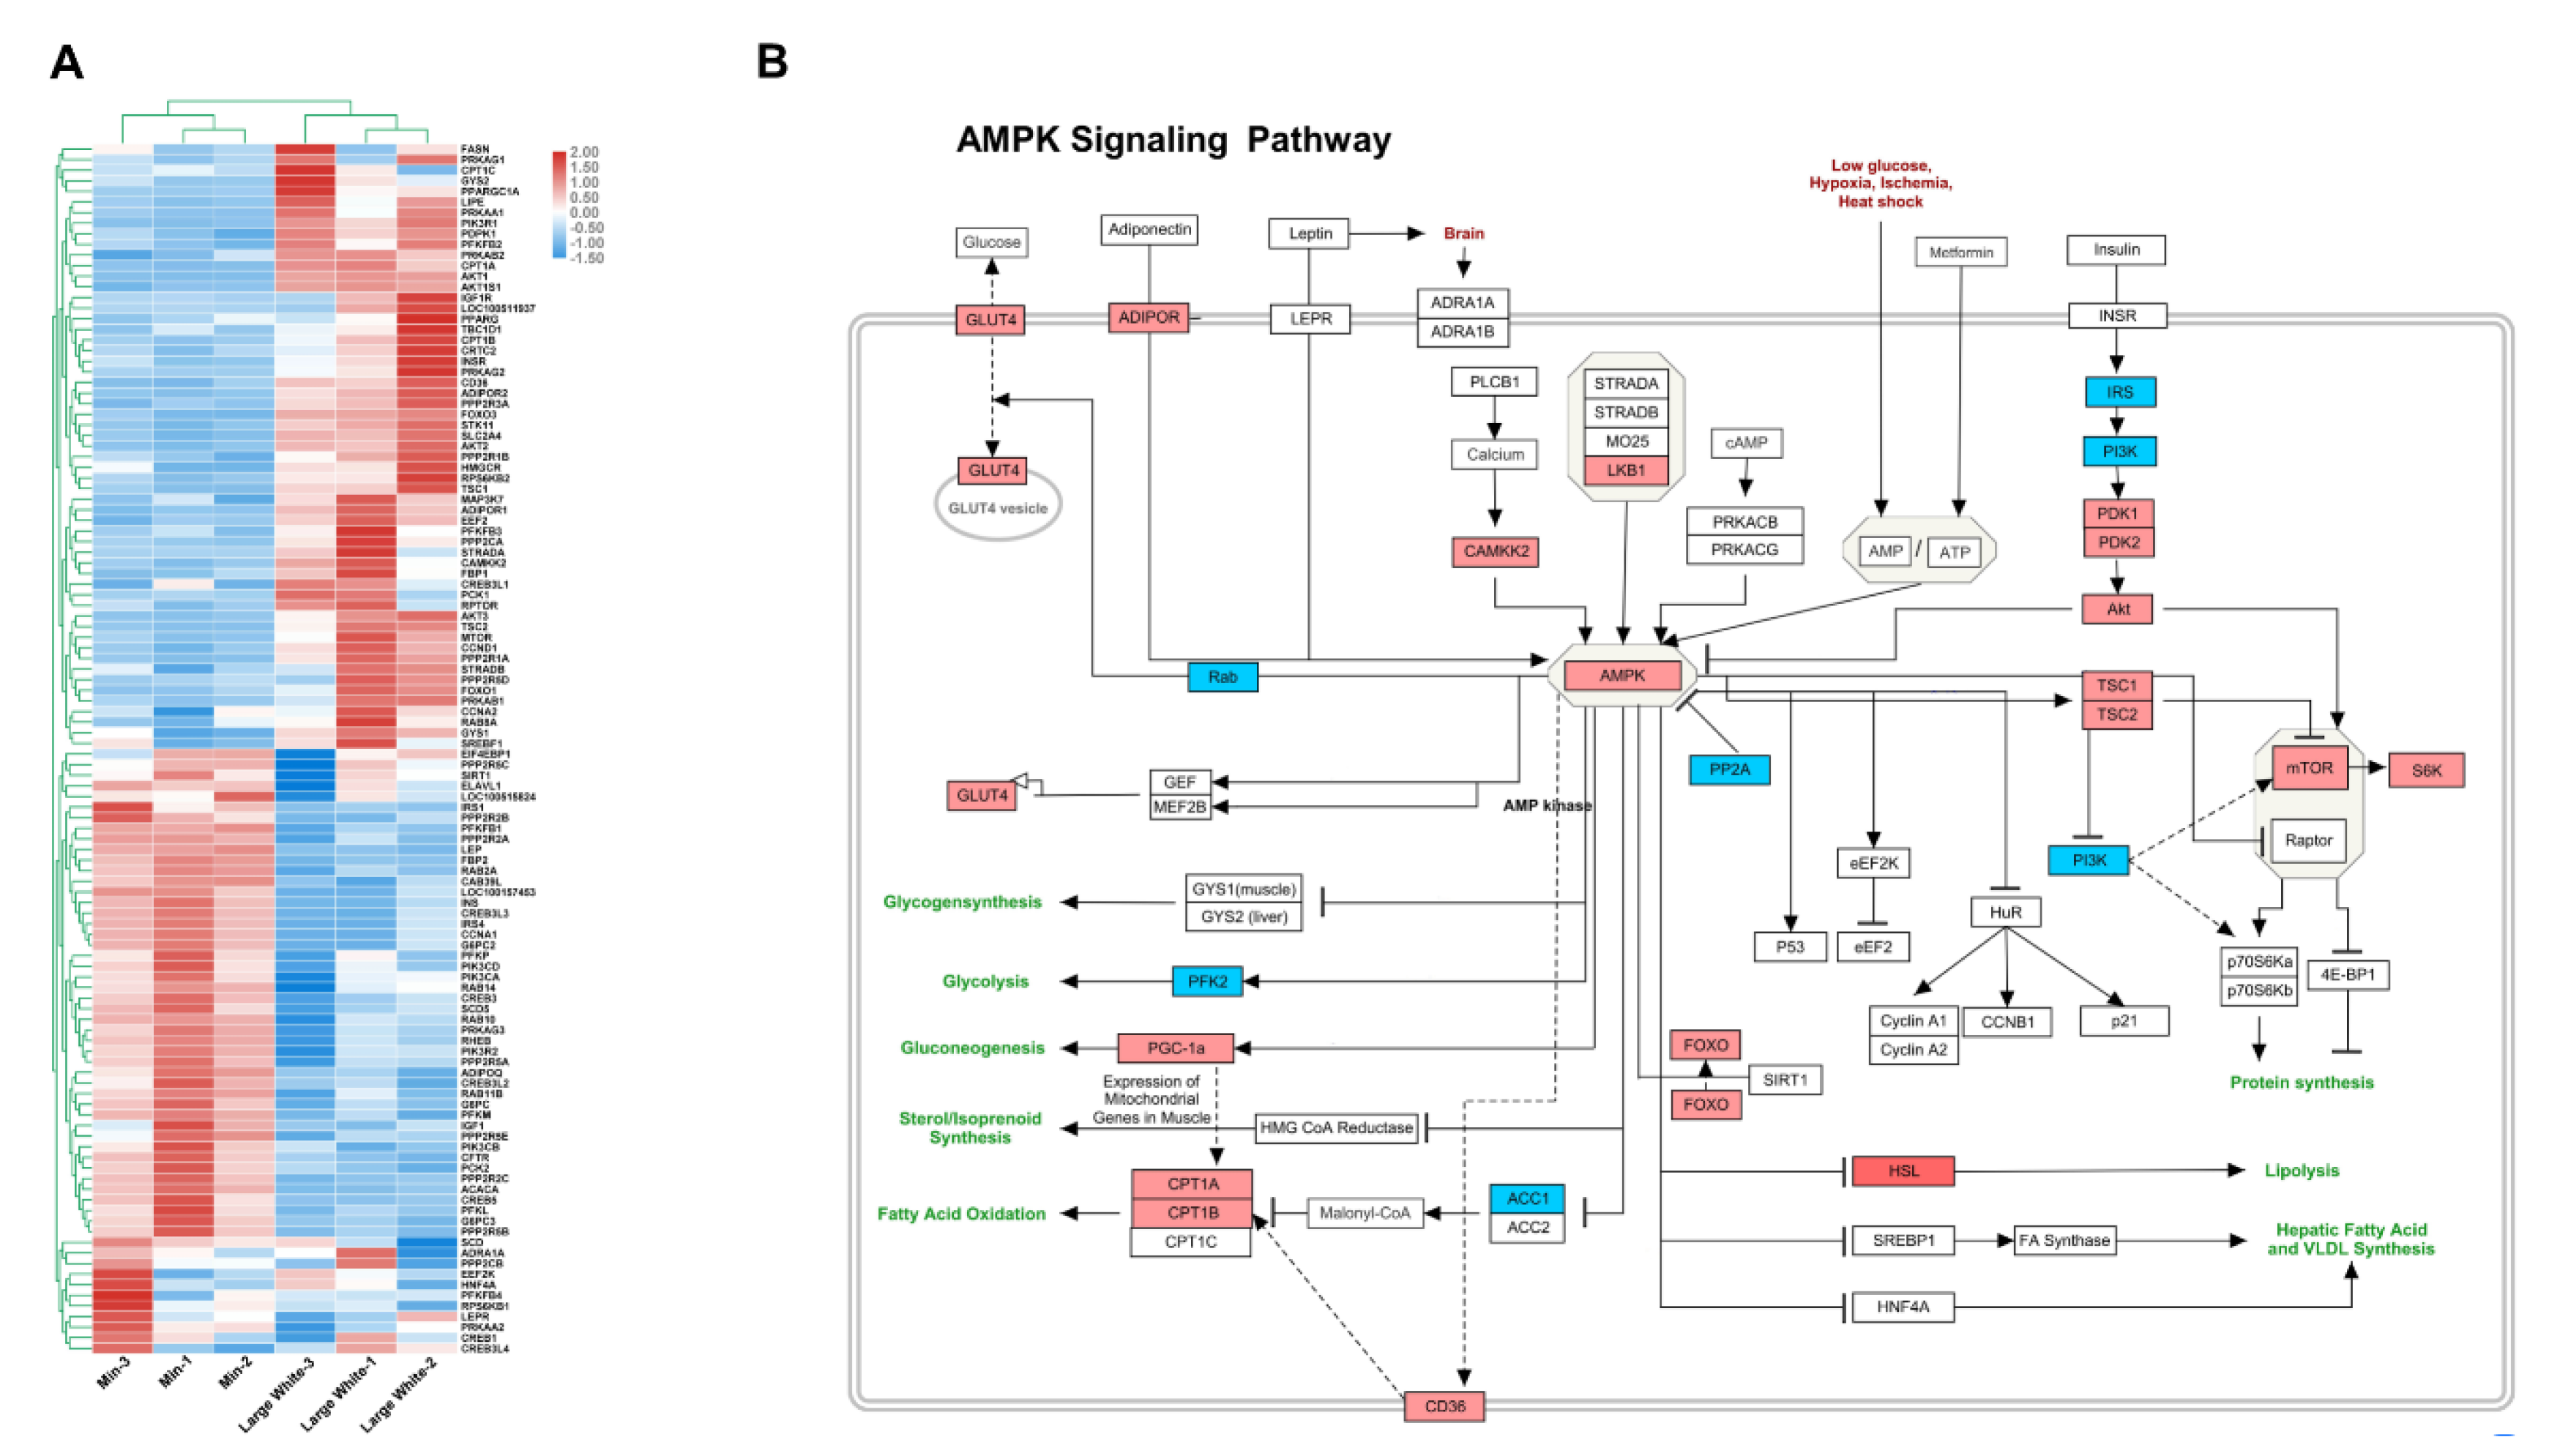
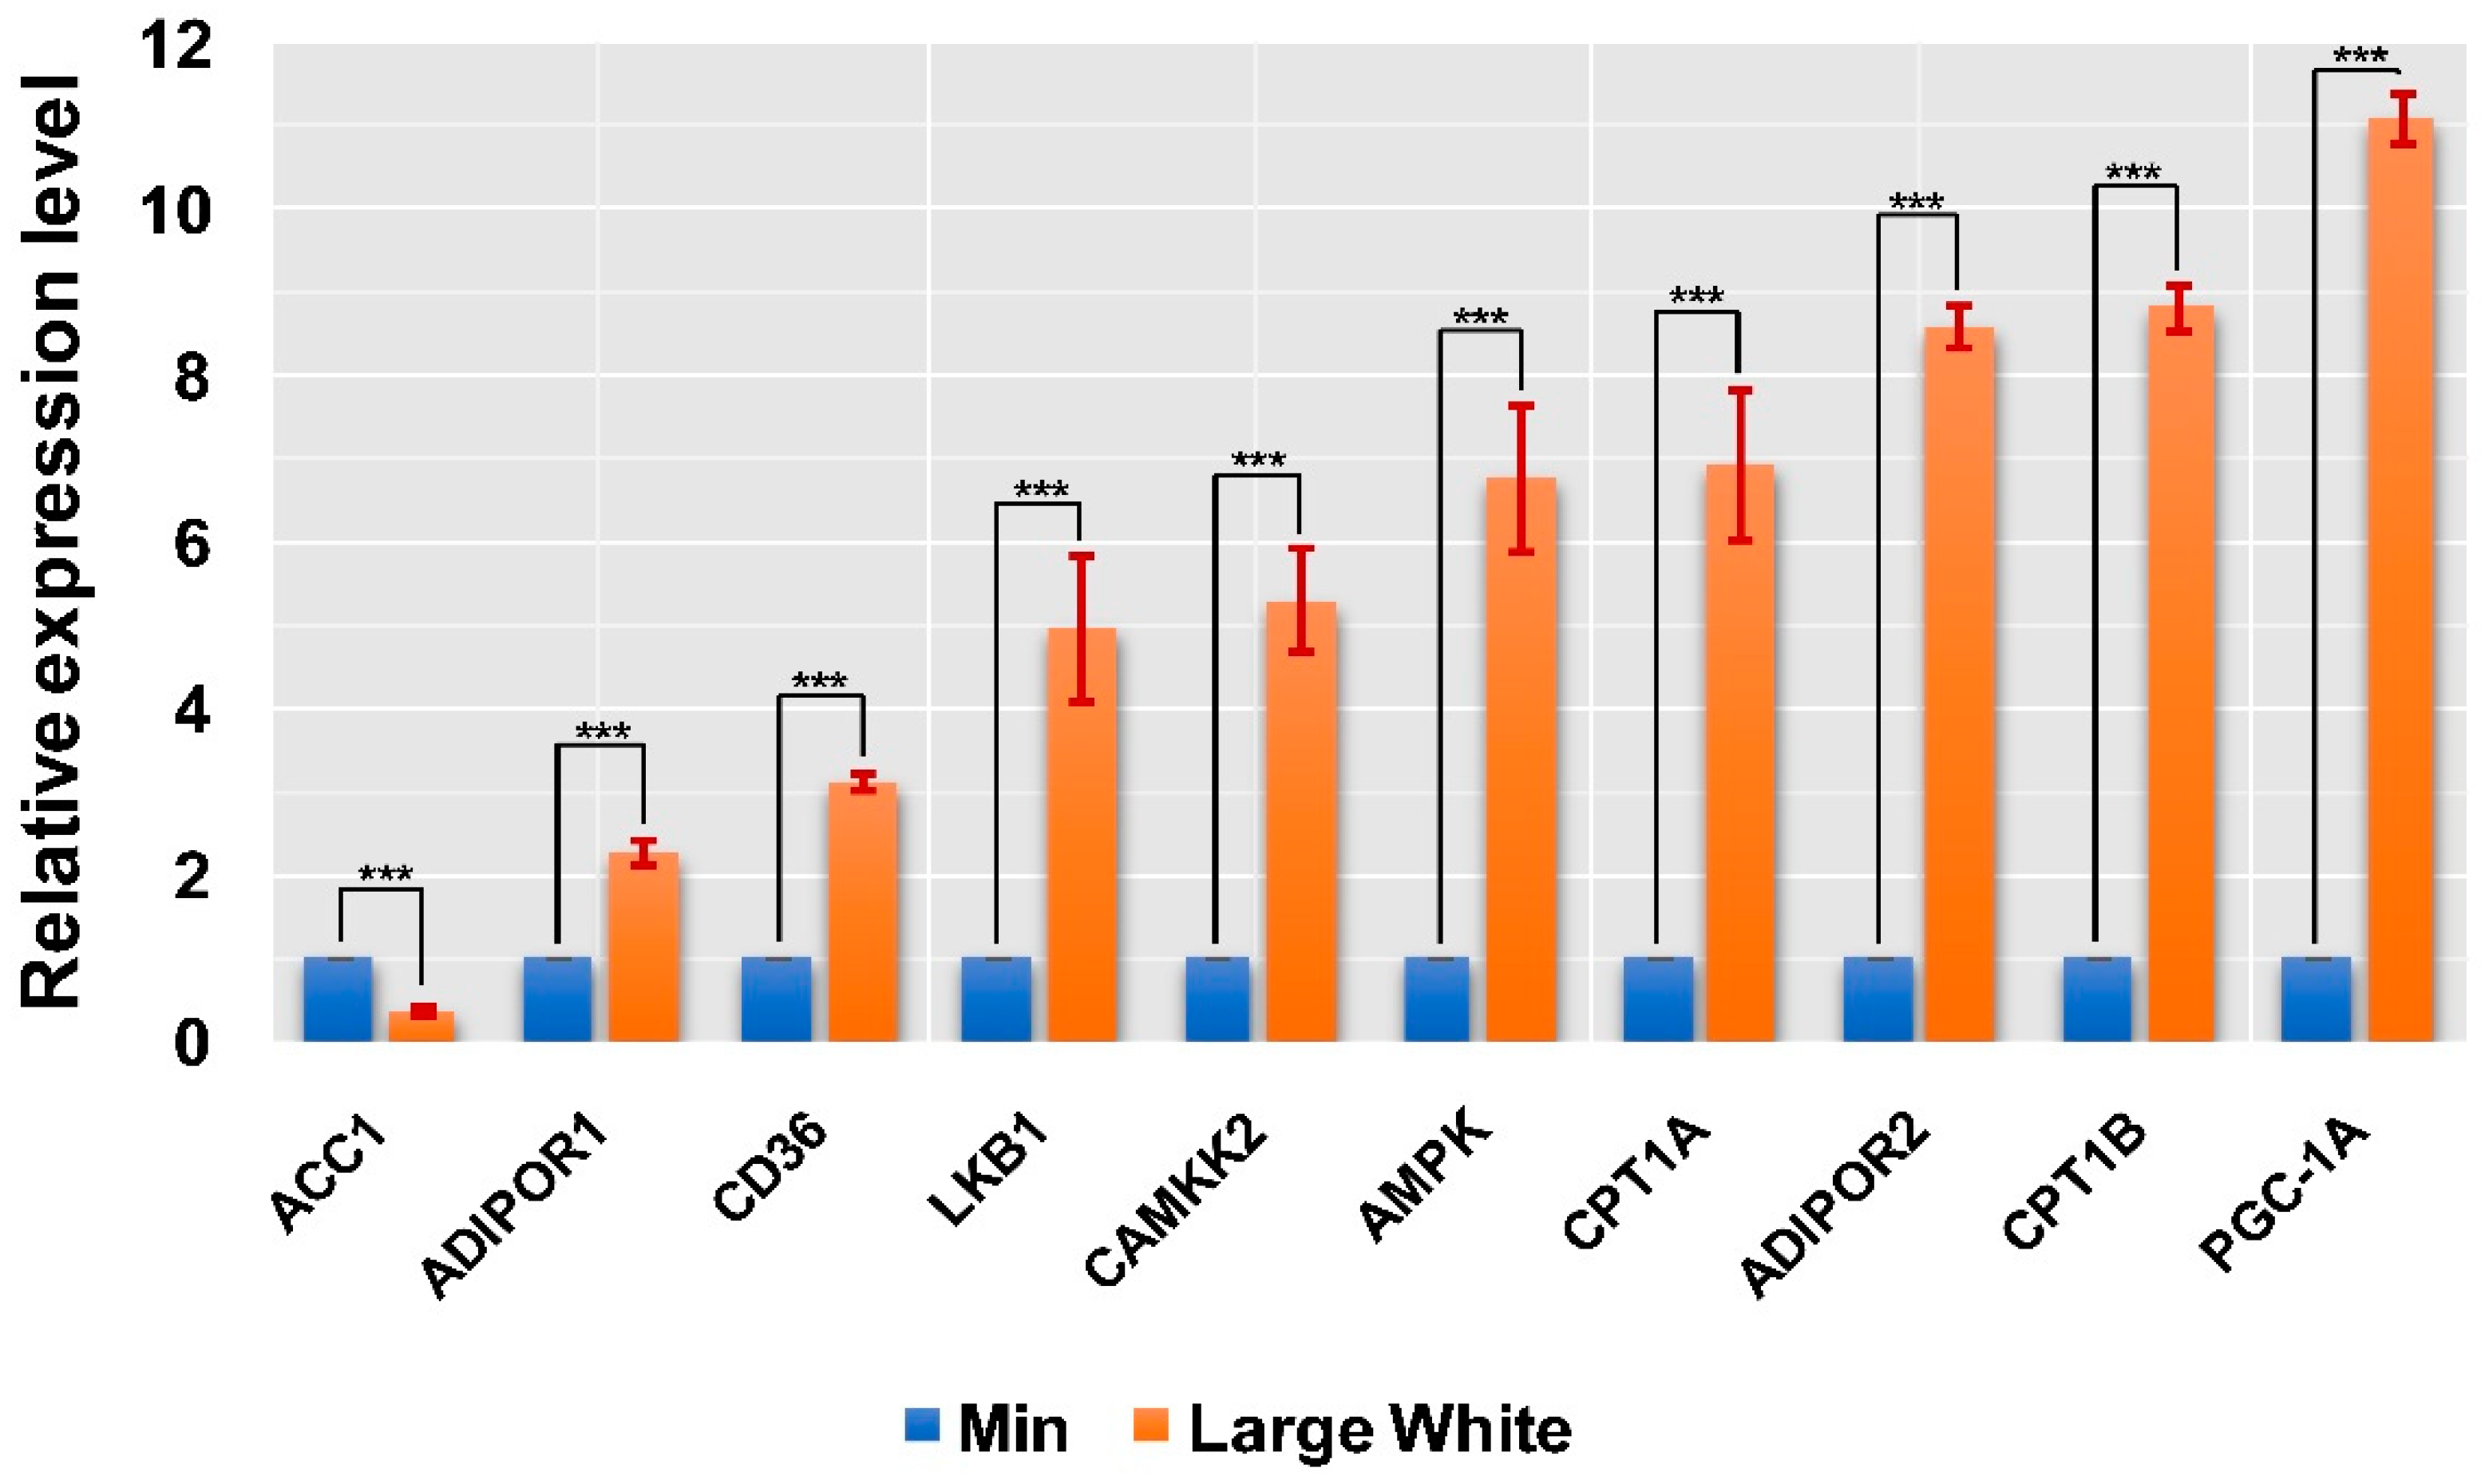
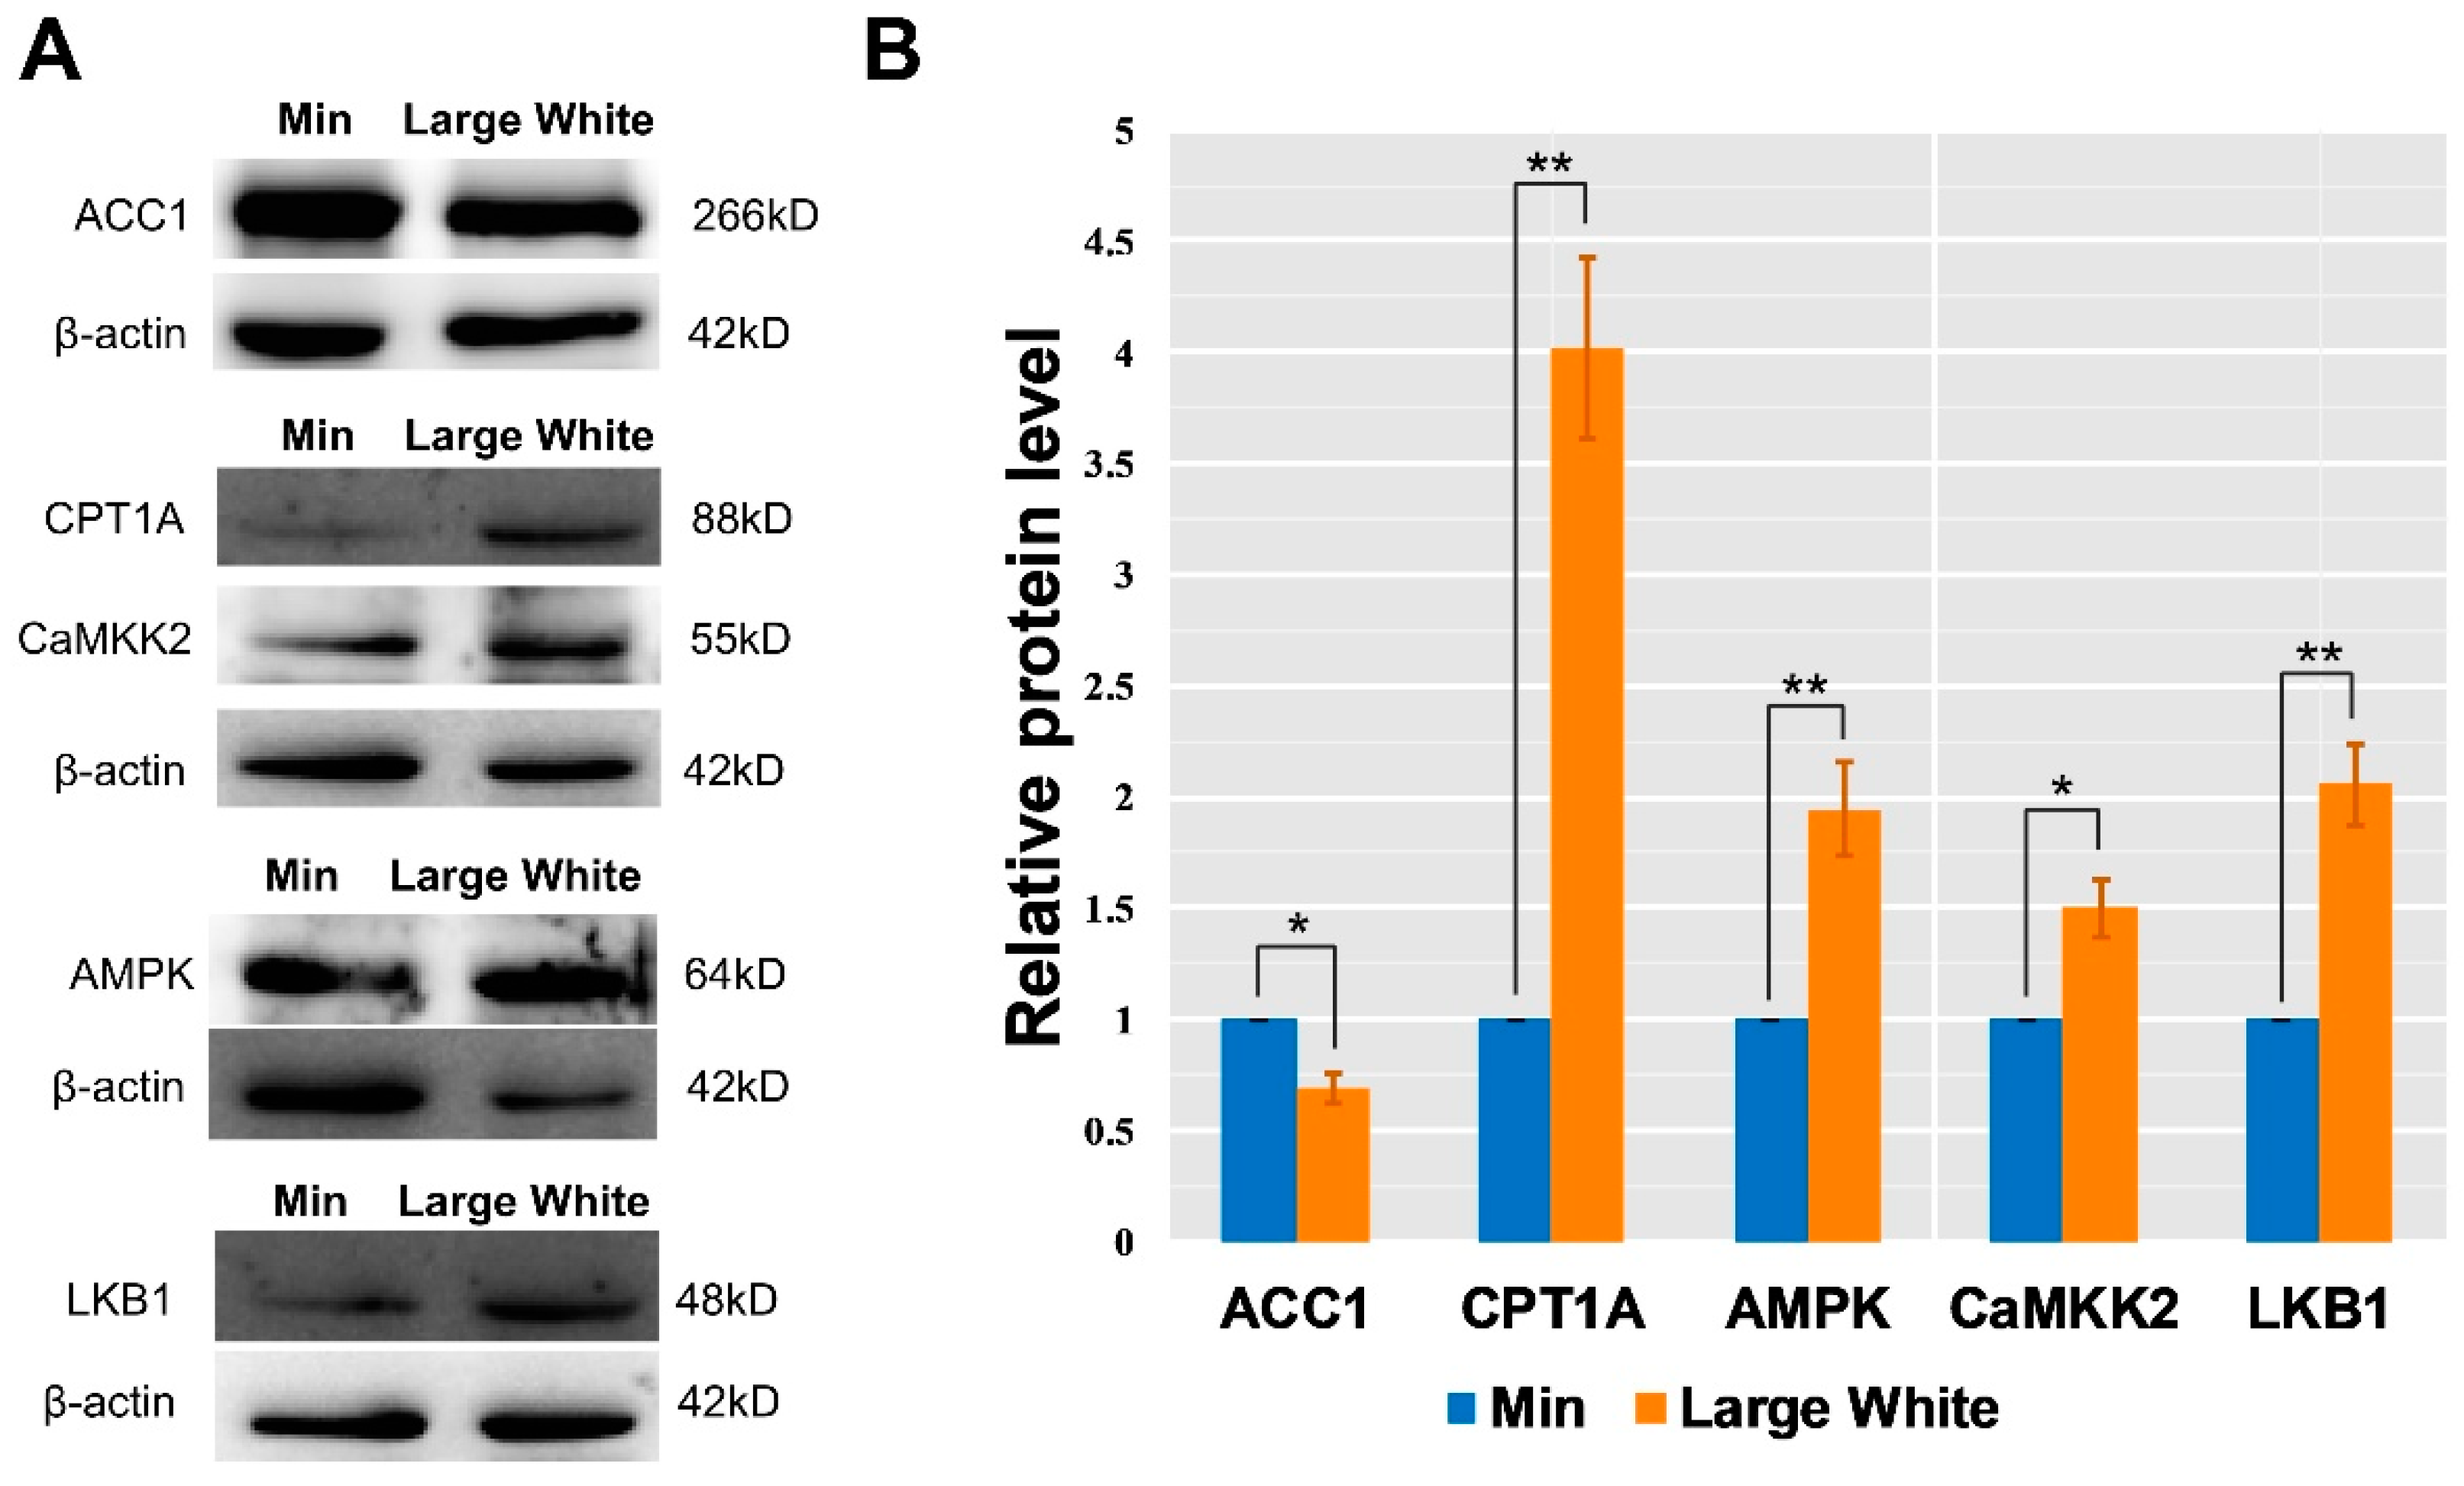
3.4. Validation of the AMPK Signaling Pathway in the LD Muscles of the Two Pig Breeds
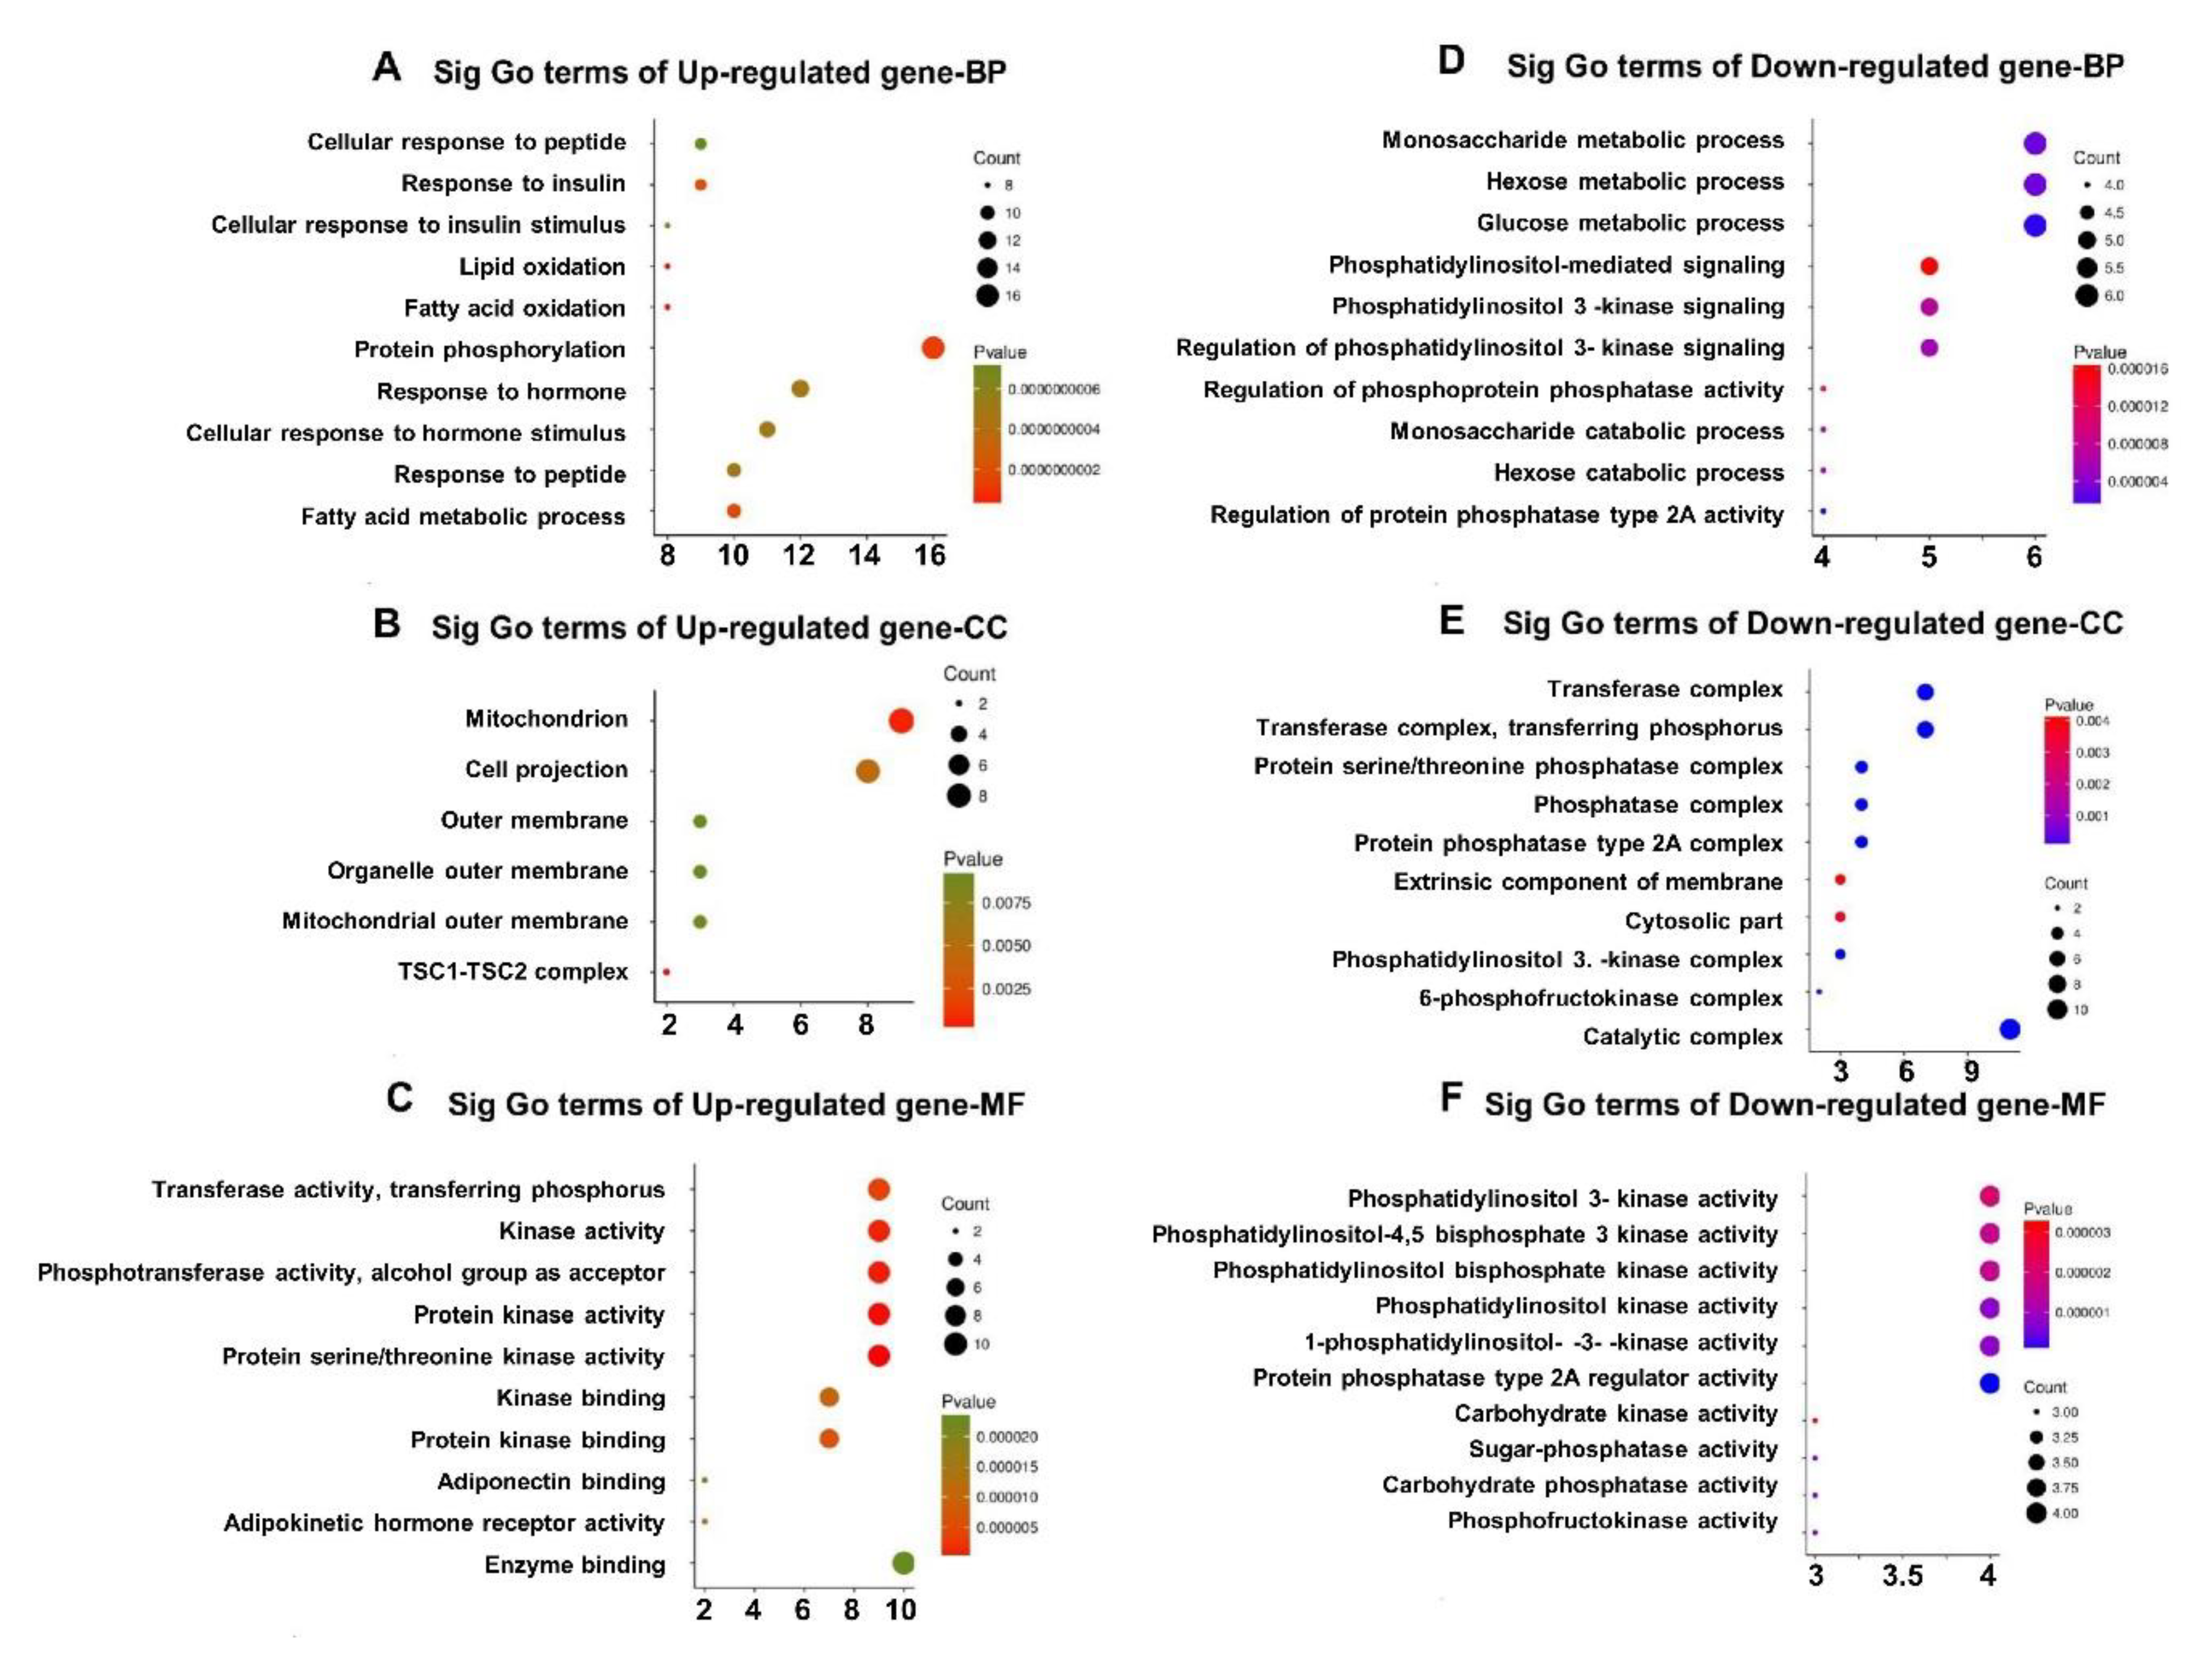
3.5. GO Enrichment of DEGs in Qrt-PCR Arrays
4. Discussion
5. Conclusions
Supplementary Materials
Author Contributions
Funding
Acknowledgments
Conflicts of Interest
References
- Puig-Oliveras, A.; Ramayo-Caldas, Y.; Corominas, J.; Estelle, J.; Perez-Montarelo, D.; Hudson, N.J.; Casellas, J.; Folch, J.M.; Ballester, M. Differences in Muscle Transcriptome among Pigs Phenotypically Extreme for Fatty Acid Composition. PLoS ONE 2014, 9, e99720. [Google Scholar] [CrossRef] [PubMed]
- Font-I-Furnols, M.; Tous, N.; Esteve-Garcia, E.; Gispert, M. Do all the consumers accept marbling in the same way? The relationship between eating and visual acceptability of pork with different intramuscular fat content. Meat Sci. 2012, 91, 448–453. [Google Scholar] [CrossRef] [PubMed]
- Nonneman, D.J.; Shackelford, S.D.; King, D.A.; Wheeler, T.L.; Wiedmann, R.T.; Snelling, W.M.; Rohrer, G.A. Genome-wide association of meat quality traits and tenderness in swine1,2. J. Anim. Sci. 2013, 91, 4043–4050. [Google Scholar] [CrossRef] [PubMed]
- Larzul, C.; Lefaucheur, L.; Ecolan, P.; Gogué, J.; Talmant, A.; Sellier, P.; Le Roy, P.; Monin, G. Phenotypic and genetic parameters for longissimus muscle fiber characteristics in relation to growth, carcass, and meat quality traits in large white pigs. J. Anim. Sci. 1997, 75, 3126. [Google Scholar] [CrossRef] [PubMed]
- Wang, X.W.; Ding, R.R.; Quan, J.P.; Yang, L.X.; Yang, M.; Zheng, E.Q.; Liu, D.W.; Cai, G.Y.; Wu, Z.F.; Yang, J. Genome-wide association analysis reveals genetic loci and candidate genes associated with intramuscular fat in Duroc pigs. Front. Agric. Sci. Eng. 2017, 4, 335–341. [Google Scholar] [CrossRef]
- Won, S.; Jung, J.; Park, E.; Kim, H.; Kim, H.B. Identification of genes related to intramuscular fat content of pigs using genome-wide association study. Asian-Australas. J. Anim. Sci. 2017, 31, 157–162. [Google Scholar] [CrossRef]
- Brewer, M.; Zhu, L.; McKeith, F. Marbling effects on quality characteristics of pork loin chops: Consumer purchase intent, visual and sensory characteristics. Meat Sci. 2001, 59, 153–163. [Google Scholar] [CrossRef]
- Lim, K.S.; Lee, K.T.; Park, J.E.; Chung, W.H.; Jang, G.W.; Choi, B.H.; Hong, K.C.; Kim, T.H. Identification of differentially expressed genes in longissimus muscle of pigs with high and low intramuscular fat content using RNA sequencing. Anim. Genet. 2016, 48, 166–174. [Google Scholar] [CrossRef]
- Suzuki, K.; Irie, M.; Kadowaki, H.; Shibata, T.; Kumagai, M.; Nishida, A. Genetic parameter estimates of meat quality traits in Duroc pigs selected for average daily gain, longissimus muscle area, backfat thickness, and intramuscular fat content. J. Anim. Sci. 2005, 83, 2058–2065. [Google Scholar] [CrossRef]
- Van Laack, R.L.; Stevens, S.G.; Stalder, K.J. The influence of ultimate pH and intramuscular fat content on pork tenderness and tenderization. J. Anim. Sci. 2001, 79, 392. [Google Scholar] [CrossRef] [PubMed]
- Dai, F.W.; Feng, D.Y.; Cao, Q.Y.; Ye, H.; Zhang, C.M.; Xia, W.G.; Zuo, J.J. Developmental differences in carcass, meat quality and muscle fibre characteristics between the Landrace and a Chinese native pig. S. Afr. J. Anim. Sci. 2009, 39, 267–273. [Google Scholar] [CrossRef]
- Gao, Y.; Zhang, Y.; Jiang, H.; Xiao, S.; Wang, S.; Ma, Q.; Sun, G.; Li, F.; Deng, Q.; Dai, L.; et al. Detection of differentially expressed genes in the longissimus dorsi of Northeastern Indigenous and Large White pigs. Genet. Mol. Res. 2011, 10, 779–791. [Google Scholar] [CrossRef]
- Wang, Y.; Ma, C.; Sun, Y.; Li, Y.; Kang, L.; Jiang, Y. Dynamic transcriptome and DNA methylome analyses on longissimus dorsi to identify genes underlying intramuscular fat content in pigs. BMC Genom. 2017, 18, 780. [Google Scholar] [CrossRef] [PubMed]
- Wu, T.; Zhang, Z.; Yuan, Z.; Lo, L.J.; Chen, J.; Wang, Y.; Peng, J. Distinctive Genes Determine Different Intramuscular Fat and Muscle Fiber Ratios of the longissimus dorsi Muscles in Jinhua and Landrace Pigs. PLoS ONE 2013, 8, e53181. [Google Scholar] [CrossRef] [PubMed]
- Xiong, X.; Liu, X.; Zhou, L.; Yang, J.; Yang, B.; Ma, H.; Xie, X.; Huang, Y.; Fang, S.; Xiao, S.; et al. Genome-wide association analysis reveals genetic loci and candidate genes for meat quality traits in Chinese Laiwu pigs. Mamm Genome 2015, 26, 181–190. [Google Scholar] [CrossRef]
- Yang, S.; Li, X.; Li, K.; Fan, B.; Tang, Z. A genome-wide scan for signatures of selection in Chinese indigenous and commercial pig breeds. BMC Genet. 2014, 15, 7. [Google Scholar] [CrossRef]
- Li, B.; Weng, Q.; Dong, C.; Zhang, Z.; Li, R.; Liu, J.; Jiang, A.; Li, Q.; Jia, C.; Wu, W.; et al. A Key Gene, PLIN1, Can Affect Porcine Intramuscular Fat Content Based on Transcriptome Analysis. Genes 2018, 9, 194. [Google Scholar] [CrossRef]
- Pena, R.N.; Quintanilla, R.; Manunza, A.; Gallardo, D.; Casellas, J.; Amills, M. Application of the microarray technology to the transcriptional analysis of muscle phenotypes in pigs. Anim. Genet. 2014, 45, 311–321. [Google Scholar] [CrossRef]
- Tao, X.; Liang, Y.; Yang, X.; Pang, J.; Zhong, Z.; Chen, X.; Yang, Y.; Zeng, K.; Kang, R.; Lei, Y.; et al. Transcriptomic profiling in muscle and adipose tissue identifies genes related to growth and lipid deposition. PLoS ONE 2017, 12, e0184120. [Google Scholar] [CrossRef]
- Li, X.; Zhou, J.; Liu, L.; Qian, K.; Wang, C. Identification of genes in longissimus dorsi muscle differentially expressed between Wannanhua and Yorkshire pigs using RNA-sequencing. Anim. Genet. 2016, 47, 324–333. [Google Scholar] [CrossRef]
- Xu, J.; Wang, C.; Jin, E.; Gu, Y.; Li, S. Identification of differentially expressed genes in longissimus dorsi muscle between Wei and Yorkshire pigs using RNA sequencing. Genes Genom. 2017, 40, 413–421. [Google Scholar] [CrossRef]
- Smyth, G.K. limma: Linear Models for Microarray Data. Bioinform. Comput. Biol. Solut. Using R Bioconductor 2005, 397–420. [Google Scholar] [CrossRef]
- Xie, C.; Mao, X.; Huang, J.; Ding, Y.; Wu, J.; Dong, S.; Kong, L.; Gao, G.; Li, C.-Y.; Wei, L. KOBAS 2.0: A web server for annotation and identification of enriched pathways and diseases. Acids Res. 2011, 39, W316–W322. [Google Scholar] [CrossRef]
- Yu, G.; Wang, L.-G.; Han, Y.; He, Q.-Y. clusterProfiler: An R Package for Comparing Biological Themes Among Gene Clusters. OMICS 2012, 16, 284–287. [Google Scholar] [CrossRef] [PubMed]
- Supakankul, P.; Mekchay, S. Association of NLK polymorphisms with intramuscular fat content and fatty acid composition traits in pigs. Meat Sci. 2016, 118, 61–65. [Google Scholar] [CrossRef] [PubMed]
- Szklarczyk, D.; Franceschini, A.; Wyder, S.; Forslund, K.; Heller, D.; Huerta-Cepas, J.; Simonovic, M.; Roth, A.; Santos, A.; Tsafou, K.P.; et al. STRING v10: Protein–protein interaction networks, integrated over the tree of life. Acids Res. 2014, 43, D447–D452. [Google Scholar] [CrossRef] [PubMed]
- Shannon, P.; Markiel, A.; Ozier, O.; Baliga, N.S.; Wang, J.T.; Ramage, D.; Amin, N.; Schwikowski, B.; Ideker, T. Cytoscape: A Software Environment for Integrated Models of Biomolecular Interaction Networks. Genome Res. 2003, 13, 2498–2504. [Google Scholar] [CrossRef]
- Carling, D. The AMP-activated protein kinase cascade—A unifying system for energy control. Biochem. Sci. 2004, 29, 18–24. [Google Scholar] [CrossRef]
- Tong, J.; Zhu, M.J.; Underwood, K.R.; Hess, B.W.; Ford, S.P.; Du, M. AMP-activated protein kinase and adipogenesis in sheep fetal skeletal muscle and 3T3-L1 cells1. J. Anim. Sci. 2008, 86, 1296–1305. [Google Scholar] [CrossRef] [PubMed]
- Underwood, K.; Means, W.; Zhu, M.; Ford, S.; Hess, B.; Du, M. AMP-activated protein kinase is negatively associated with intramuscular fat content in longissimus dorsi muscle of beef cattle. Meat Sci. 2008, 79, 394–402. [Google Scholar] [CrossRef]
- Underwood, K.R.; Tong, J.; Zhu, M.J.; Shen, Q.W.; Means, W.J.; Ford, S.P.; Paisley, S.I.; Hess, B.W.; Du, M. Relationship between Kinase Phosphorylation, Muscle Fiber Typing, and Glycogen Accumulation inLongissimusMuscle of Beef Cattle with High and Low Intramuscular Fat. J. Agric. Chem. 2007, 55, 9698–9703. [Google Scholar] [CrossRef] [PubMed]
- Yamauchi, T.; Iwabu, M.; Okada-Iwabu, M.; Kadowaki, T. Adiponectin receptors: A review of their structure, function and how they work. Best Pract. Res. Clin. Endocrinol. Metab. 2014, 28, 15–23. [Google Scholar] [CrossRef] [PubMed]
- Yamauchi, T.; Kamon, J.; Minokoshi, Y.; Ito, Y.; Waki, H.; Uchida, S.; Yamashita, S.; Noda, M.; Kita, S.; Ueki, K.; et al. Adiponectin stimulates glucose utilization and fatty-acid oxidation by activating AMP-activated protein kinase. Nat. Med. 2002, 8, 1288–1295. [Google Scholar] [CrossRef]
- Yamauchi, T.; Nio, Y.; Maki, T.; Kobayashi, M.; Takazawa, T.; Iwabu, M.; Okada-Iwabu, M.; Kawamoto, S.; Kubota, N.; Kubota, T.; et al. Targeted disruption of AdipoR1 and AdipoR2 causes abrogation of adiponectin binding and metabolic actions. Nat. Med. 2007, 13, 332–339. [Google Scholar] [CrossRef] [PubMed]
- Yoon, M.J.; Lee, G.Y.; Chung, J.-J.; Ahn, Y.H.; Hong, S.H.; Kim, J.B. Adiponectin Increases Fatty Acid Oxidation in Skeletal Muscle Cells by Sequential Activation of AMP-Activated Protein Kinase, p38 Mitogen-Activated Protein Kinase, and Peroxisome Proliferator-Activated Receptor. Diabetes 2006, 55, 2562–2570. [Google Scholar] [CrossRef]
- Abbott, M.J.; Edelman, A.M.; Turcotte, L.P. CaMKK is an upstream signal of AMP-activated protein kinase in regulation of substrate metabolism in contracting skeletal muscle. Am. J. Physiol. Integr. Comp. Physiol. 2009, 297, R1724–R1732. [Google Scholar] [CrossRef]
- Green, M.F.; Anderson, K.A.; Means, A.R. Characterization of the CaMKK β-AMPK Signaling Complex. Cell. Signal. 2011, 23, 2005–2012. [Google Scholar] [CrossRef]
- Sakamoto, K.; McCarthy, A.; Smith, D.; A Green, K.; Hardie, D.G.; Ashworth, A.; Alessi, D.R. Deficiency of LKB1 in skeletal muscle prevents AMPK activation and glucose uptake during contraction. EMBO J. 2005, 24, 1810–1820. [Google Scholar] [CrossRef] [PubMed]
- Zhou, L.; Deepa, S.S.; Etzler, J.C.; Ryu, J.; Mao, X.; Fang, Q.; Liu, D.D.; Torres, J.M.; Jia, W.; Lechleiter, J.D. Adiponectin activates AMPK in muscle cells via APPL1/LKB1- and PLC/Ca2+/CaMKK-dependent pathways. J. Biol. Chem. 2009, 284, jbc-M109. [Google Scholar] [CrossRef] [PubMed]
- Qiu, F.; Xie, L.; Ma, J.-E.; Luo, W.; Zhang, L.; Chao, Z.; Chen, S.; Nie, Q.; Lin, Z.; Zhang, X. Lower Expression of SLC27A1 Enhances Intramuscular Fat Deposition in Chicken via Down-Regulated Fatty Acid Oxidation Mediated by CPT1A. Front. Physiol. 2017, 8, 449. [Google Scholar] [CrossRef]
- Zhang, Y.-F.; Yuan, Z.-Q.; Song, D.-G.; Zhou, X.-H.; Wang, Y.-Z. Effects of cannabinoid receptor 1 (brain) on lipid accumulation by transcriptional control of CPT1A and CPT1B. Anim. Genet. 2013, 45, 38–47. [Google Scholar] [CrossRef]
- Kim, J.-Y.; Hickner, R.C.; Cortright, R.L.; Dohm, G.L.; Houmard, J.A. Lipid oxidation is reduced in obese human skeletal muscle. Am. J. Physiol. Metab. 2000, 279, E1039–E1044. [Google Scholar] [CrossRef] [PubMed]
- Jones, J.E.C.; Esler, W.P.; Patel, R.; Lanba, A.; Vera, N.B.; Pfefferkorn, J.A.; Vernochet, C. Inhibition of Acetyl-CoA Carboxylase 1 (ACC1) and 2 (ACC2) Reduces Proliferation and De Novo Lipogenesis of EGFRvIII Human Glioblastoma Cells. PLoS ONE 2017, 12, e0169566. [Google Scholar] [CrossRef]
- Alam, N.; Saggerson, E.D. Malonyl-CoA and the regulation of fatty acid oxidation in soleus muscle. Biochem. J. 1998, 334, 233–241. [Google Scholar] [CrossRef]
- Saha, A.K.; Schwarsin, A.J.; Roduit, R.; Massé, F.; Kaushik, V.; Tornheim, K.; Prentki, M.; Ruderman, N.B. Activation of Malonyl-CoA Decarboxylase in Rat Skeletal Muscle by Contraction and the AMP-activated Protein Kinase Activator 5-Aminoimidazole-4-carboxamide-1-β-d-ribofuranoside. J. Boil. Chem. 2000, 275, 24279–24283. [Google Scholar] [CrossRef] [PubMed]
- Scaglia, N.; Chisholm, J.W.; Igal, R.A. Inhibition of StearoylCoA Desaturase-1 Inactivates Acetyl-CoA Carboxylase and Impairs Proliferation in Cancer Cells: Role of AMPK. PLoS ONE 2009, 4, e6812. [Google Scholar] [CrossRef]
- Schenk, S.; Horowitz, J.F. Coimmunoprecipitation of FAT/CD36 and CPT I in skeletal muscle increases proportionally with fat oxidation after endurance exercise training. Am. J. Physiol. Metab. 2006, 291, E254–E260. [Google Scholar] [CrossRef] [PubMed]
- Smith, B.K.; Jain, S.S.; Rimbaud, S.; Dam, A.; Quadrilatero, J.; Bonen, A.; Holloway, G.P.; Ventura-Clapier, R.; Ventura-Clapier, R. FAT/CD36 is located on the outer mitochondrial membrane, upstream of long-chain acyl-CoA synthetase, and regulates palmitate oxidation. Biochem. J. 2011, 437, 125–134. [Google Scholar] [CrossRef] [PubMed]
- Bonen, A.; Campbell, S.E.; Benton, C.R.; Chabowski, A.; Coort, S.L.M.; Han, X.-X.; Koonen, D.P.Y.; Glatz, J.F.C.; Luiken, J.J.F.P. Regulation of fatty acid transport by fatty acid translocase/CD36. Proc. Nutr. Soc. 2004, 63, 245–249. [Google Scholar] [CrossRef] [PubMed]
- Campbell, S.E.; Tandon, N.N.; Woldegiorgis, G.; Bonen, A.; Luiken, J.J.F.P.; Glatz, J.F.C. A Novel Function for Fatty Acid Translocase (FAT)/CD36. J. Boil. Chem. 2004, 279, 36235–36241. [Google Scholar] [CrossRef]
- Ibrahimi, A.; Bonen, A.; Blinn, W.D.; Hajri, T.; Li, X.; Zhong, K.; Cameron, R.; Abumrad, N.A. Muscle-specific Overexpression of FAT/CD36 Enhances Fatty Acid Oxidation by Contracting Muscle, Reduces Plasma Triglycerides and Fatty Acids, and Increases Plasma Glucose and Insulin. J. Boil. Chem. 1999, 274, 26761–26766. [Google Scholar] [CrossRef]
- Louet, J.F.; Hayhurst, G.; Gonzalez, F.J.; Girard, J.; Decaux, J.F. The coactivator PGC-1 is involved in the regulation of the liver carnitine palmitoyltransferase I gene expression by cAMP in combination with HNF4 alpha and cAMP-response element-binding protein (CREB). J. Biol. Chem. 2002, 277, 37991–38000. [Google Scholar] [CrossRef] [PubMed]
- Beeson, C.C.; Beeson, G.C.; Buff, H.; Eldridge, J.; Zhang, A.; Seth, A.; Demcheva, M.; Vournakis, J.N.; Muise-Helmericks, R.C. Integrin-Dependent Akt1 Activation Regulates PGC-1 Expression and Fatty Acid Oxidation. J. Vasc. Res. 2012, 49, 89–100. [Google Scholar] [CrossRef] [PubMed]
- Li, Q.; Wang, Z.; Zhang, B.; Lu, Y.; Yang, Y.; Ban, D.; Wu, C.; Zhang, H. Single Nucleotide Polymorphism Scanning and Expression of the Pig PPARGC1A Gene in Different Breeds. Lipids 2014, 49, 1047–1055. [Google Scholar] [CrossRef] [PubMed]
- Yu, K.; Shu, G.; Yuan, F.; Zhu, X.; Gao, P.; Wang, S.; Wang, L.; Xi, Q.; Zhang, S.; Zhang, Y.; et al. Fatty Acid and Transcriptome Profiling of Longissimus Dorsi Muscles between Pig Breeds Differing in Meat Quality. Int. J. Boil. Sci. 2013, 9, 108–118. [Google Scholar] [CrossRef]


| Pathway ID | Name | Gene Count | p-Value |
|---|---|---|---|
| Upregulated DEGs | |||
| ssc04145 | Phagosome | 36 | 1.66 × 10⁻²² |
| ssc01100 | Metabolic pathways | 87 | 2.06 × 10⁻¹⁸ |
| ssc00100 | Steroid biosynthesis | 6 | 3.08 × 10⁻⁵ |
| ssc00330 | Arginine and proline metabolism | 8 | 4.48 × 10⁻⁵ |
| ssc04062 | Chemokine signaling pathway | 15 | 5.27 × 10⁻⁵ |
| ssc00590 | Arachidonic acid metabolism | 9 | 5.59 × 10⁻⁵ |
| ssc01230 | Biosynthesis of amino acids | 9 | 8.49 × 10⁻⁵ |
| ssc04923 | Regulation of lipolysis in adipocytes | 8 | 1.32 × 10⁻⁴ |
| ssc04060 | Cytokine-cytokine receptor interaction | 16 | 1.92 × 10⁻⁴ |
| ssc00010 | Glycolysis/gluconeogenesis | 8 | 2.24 × 10⁻⁴ |
| ssc04810 | Regulation of actin cytoskeleton | 15 | 2.75 × 10⁻⁴ |
| ssc04390 | Hippo signaling pathway | 12 | 2.98 × 10⁻⁴ |
| ssc00592 | alpha-Linolenic acid metabolism | 5 | 4.30 × 10⁻⁴ |
| ssc03320 | PPAR signaling pathway | 8 | 4.72 × 10⁻⁴ |
| ssc04152 | AMPK signaling pathway | 10 | 9.76 × 10⁻⁴ |
| ssc04975 | Fat digestion and absorption | 5 | 2.28 × 10⁻³ |
| ssc00071 | Fatty acid degradation | 5 | 4.66 × 10⁻³ |
| ssc01212 | Fatty acid metabolism | 5 | 7.78 × 10⁻³ |
| Downregulated DEGs | |||
| ssc00190 | Oxidative phosphorylation | 17 | 1.67 × 10⁻¹³ |
| ssc01100 | Metabolic pathways | 38 | 5.02 × 10⁻¹⁰ |
| ssc01210 | 2-Oxocarboxylic acid metabolism | 4 | 5.24 × 10⁻⁵ |
| ssc04024 | cAMP signaling pathway | 10 | 5.68 × 10⁻⁵ |
| ssc01230 | Biosynthesis of amino acids | 5 | 7.29 × 10⁻⁴ |
| ssc04960 | Aldosterone-regulated sodium reabsorption | 4 | 9.76 × 10⁻⁴ |
| ssc04931 | Insulin resistance | 6 | 1.03 × 10⁻³ |
| ssc00220 | Arginine biosynthesis | 3 | 1.33 × 10⁻³ |
| ssc04923 | Regulation of lipolysis in adipocytes | 4 | 2.79 × 10⁻³ |
| ssc00400 | Phenylalanine, tyrosine, and tryptophan biosynthesis | 2 | 3.14 × 10⁻³ |
| ssc03320 | PPAR signaling pathway | 4 | 5.59 × 10⁻³ |
| ssc04920 | Adipocytokine signaling pathway | 4 | 5.86 × 10⁻³ |
| ssc00250 | Alanine, aspartate, and glutamate metabolism | 3 | 6.59 × 10⁻³ |
| Pathway ID | Name | Gene Count | p-Value |
|---|---|---|---|
| Upregulated DEGs | |||
| ssc04922 | Glucagon signaling pathway | 18 | 2.68 × 10⁻⁷ |
| ssc04910 | Insulin signaling pathway | 20 | 5.21 × 10⁻⁶ |
| ssc00010 | Glycolysis/gluconeogenesis | 13 | 9.46 × 10⁻⁶ |
| ssc01230 | Biosynthesis of amino acids | 14 | 1.18 × 10⁻⁵ |
| ssc01200 | Carbon metabolism | 14 | 5.35 × 10⁻⁴ |
| ssc04152 | AMPK signaling pathway | 14 | 1.01 × 10⁻³ |
| ssc00500 | Starch and sucrose metabolism | 8 | 2.01 × 10⁻³ |
| ssc00760 | Nicotinate and nicotinamide metabolism | 6 | 2.10 × 10⁻³ |
| ssc04974 | Protein digestion and absorption | 10 | 2.29 × 10⁻³ |
| ssc04911 | Insulin secretion | 9 | 4.71 × 10⁻³ |
| ssc04931 | Insulin resistance | 12 | 4.82 × 10⁻³ |
| ssc00051 | Fructose and mannose metabolism | 6 | 6.50 × 10⁻³ |
| ssc01100 | Metabolic pathways | 67 | 8.00 × 10⁻³ |
| ssc00620 | Pyruvate metabolism | 6 | 8.50 × 10⁻³ |
| ssc04022 | cGMP-PKG signaling pathway | 14 | 9.21 × 10⁻³ |
| ssc04015 | Rap1 signaling pathway | 16 | 9.32 × 10⁻³ |
| ssc00030 | Pentose phosphate pathway | 5 | 9.47 × 10⁻³ |
| ssc01212 | Fatty acid metabolism | 7 | 1.37 × 10⁻² |
| ssc03320 | PPAR signaling pathway | 6 | 4.81 × 10⁻² |
| ssc04975 | Fat digestion and absorption | 4 | 4.83 × 10⁻² |
| Downregulated DEGs | |||
| ssc01100 | Metabolic pathways | 127 | 1.26 × 10⁻⁹ |
| ssc00071 | Fatty acid degradation | 16 | 1.62 × 10⁻⁷ |
| ssc01212 | Fatty acid metabolism | 16 | 2.91 × 10⁻⁷ |
| ssc03320 | PPAR signaling pathway | 16 | 2.16 × 10⁻⁵ |
| ssc00190 | Oxidative phosphorylation | 23 | 2.84 × 10⁻⁵ |
| ssc04146 | Peroxisome | 18 | 5.44 × 10⁻⁵ |
| ssc04260 | Cardiac muscle contraction | 15 | 1.18 × 10⁻⁴ |
| ssc00640 | Propanoate metabolism | 9 | 1.86 × 10⁻⁴ |
| ssc00620 | Pyruvate metabolism | 10 | 3.69 × 10⁻⁴ |
| ssc00280 | Valine, leucine, and isoleucine degradation | 11 | 5.68 × 10⁻⁴ |
| ssc01200 | Carbon metabolism | 17 | 1.05 × 10⁻³ |
| ssc00480 | Glutathione metabolism | 10 | 1.14 × 10⁻³ |
| ssc00561 | Glycerolipid metabolism | 10 | 2.15 × 10⁻³ |
| ssc00270 | Cysteine and methionine metabolism | 9 | 4.87 × 10⁻³ |
| ssc00250 | Alanine, aspartate, and glutamate metabolism | 8 | 5.33 × 10⁻³ |
| ssc00062 | Fatty acid elongation | 5 | 7.17 × 10⁻³ |
| ssc04261 | Adrenergic signaling in cardiomyocytes | 16 | 1.20 × 10⁻² |
| ssc04810 | Regulation of actin cytoskeleton | 21 | 1.53 × 10⁻² |
| ssc00061 | Fatty acid biosynthesis | 4 | 1.53 × 10⁻² |
| ssc04920 | Adipocytokine signaling pathway | 10 | 1.82 × 10⁻² |
| ssc00400 | Phenylalanine, tyrosine and tryptophan biosynthesis | 3 | 1.88 × 10⁻² |
| ssc01230 | Biosynthesis of amino acids | 9 | 4.78 × 10⁻² |
| Pathway ID | Name | Gene count | p-Value |
|---|---|---|---|
| Upregulated DEGs | |||
| ssc01200 | Carbon metabolism | 17 | 5.04 × 10⁻⁷ |
| ssc01100 | Metabolic pathways | 68 | 3.05 × 10⁻⁶ |
| ssc00071 | Fatty acid degradation | 8 | 1.72 × 10⁻⁴ |
| ssc01212 | Fatty acid metabolism | 8 | 2.37 × 10⁻⁴ |
| ssc00280 | Valine, leucine, and isoleucine degradation | 8 | 3.73 × 10⁻⁴ |
| ssc00640 | Propanoate metabolism | 6 | 5.48 × 10⁻⁴ |
| ssc01210 | 2-Oxocarboxylic acid metabolism | 5 | 8.14 × 10⁻⁴ |
| ssc00630 | Glyoxylate and dicarboxylate metabolism | 5 | 2.26 × 10⁻³ |
| ssc00350 | Tyrosine metabolism | 5 | 6.61 × 10⁻³ |
| ssc00620 | Pyruvate metabolism | 5 | 1.08 × 10⁻² |
| ssc00061 | Fatty acid biosynthesis | 3 | 1.32 × 10⁻² |
| ssc03320 | PPAR signaling pathway | 6 | 2.76 × 10⁻² |
| ssc00190 | Oxidative phosphorylation | 9 | 3.24 × 10⁻² |
| ssc04920 | Adipocytokine signaling pathway | 6 | 3.37 × 10⁻² |
| ssc00360 | Phenylalanine metabolism | 3 | 3.52 × 10⁻² |
| ssc01230 | Biosynthesis of amino acids | 6 | 3.82 × 10⁻² |
| ssc04152 | AMPK signaling pathway | 9 | 3.83 × 10⁻² |
| ssc04975 | Fat digestion and absorption | 3 | 4.38 × 10⁻² |
| ssc00380 | Tryptophan metabolism | 4 | 4.55 × 10⁻² |
| Downregulated DEGs | |||
| ssc04666 | Fc gamma R-mediated phagocytosis | 11 | 1.61 × 10⁻³ |
| ssc04130 | SNARE interactions in vesicular transport | 7 | 2.63 × 10⁻³ |
| ssc04512 | ECM-receptor interaction | 9 | 4.05 × 10⁻³ |
| ssc00100 | Steroid biosynthesis | 5 | 4.94 × 10⁻³ |
| ssc04974 | Protein digestion and absorption | 9 | 7.22 × 10⁻³ |
| ssc04810 | Regulation of actin cytoskeleton | 15 | 2.87 × 10⁻² |
| ssc00310 | Lysine degradation | 6 | 3.41 × 10⁻² |
| ssc00260 | Glycine, serine, and threonine metabolism | 5 | 4.09 × 10⁻² |
| ssc00410 | beta-Alanine metabolism | 4 | 4.29 × 10⁻² |
| ssc04330 | Notch signaling pathway | 5 | 5.34 × 10⁻² |
| ssc00230 | Purine metabolism | 12 | 4.38 × 10⁻² |
| ssc00280 | Valine, leucine, and isoleucine degradation | 5 | 4.77 × 10⁻² |
| ssc00330 | Arginine and proline metabolism | 5 | 4.77 × 10⁻² |
| Gene Symbol | Fold Change | p-Value | Regulation |
|---|---|---|---|
| CD36 | 3.189283629 | 7.67 × 10⁻³ | Up |
| PGC-1A | 11.14850152 | 4.46 × 10⁻² | Up |
| AKT2 | 3.156554305 | 3.62 × 10⁻³ | Up |
| AKT1 | 7.868832108 | 3.43 × 10⁻⁵ | Up |
| CPT1B | 8.890764573 | 3.93 × 10⁻² | Up |
| ADIPOR2 | 8.509277729 | 7.67 × 10⁻³ | Up |
| PPP2R1A | 6.599066891 | 1.04 × 10⁻² | Up |
| CPT1A | 6.846403313 | 8.26 × 10⁻⁴ | Up |
| FOXO1 | 5.397575689 | 3.18 × 10⁻² | Up |
| LIPE | 6.924041605 | 1.87 × 10⁻² | Up |
| LKB1 | 4.901757799 | 7.41 × 10⁻³ | Up |
| FOXO3 | 3.639771136 | 1.49 × 10⁻⁴ | Up |
| MTOR | 4.068698015 | 2.35 × 10⁻² | Up |
| ADIPOR1 | 2.245141118 | 3.62 × 10⁻³ | Up |
| RPS6KB2 | 3.361252687 | 4.11 × 10⁻² | Up |
| AKT3 | 5.250417157 | 2.42 × 10⁻² | Up |
| AMPK | 6.699341927 | 4.11 × 10⁻² | Up |
| PDPK1 | 1.981200539 | 7.58 × 10⁻³ | Up |
| TSC2 | 2.740754696 | 7.67 × 10⁻³ | Up |
| SLC2A4 | 9.440463793 | 1.01 × 10⁻² | Up |
| CAMKK2 | 5.359797456 | 2.16 × 10⁻² | Up |
| TSC1 | 8.141086731 | 1.08 × 10⁻² | Up |
| PFKM | −5.001312186 | 5.39 × 10⁻³ | Down |
| FBP2 | −5.808487321 | 1.08 × 10⁻² | Down |
| ACC1 | −2.601477756 | 1.86 × 10⁻² | Down |
| RAB2A | −2.652531932 | 3.07 × 10⁻³ | Down |
| PFKFB1 | −6.096200009 | 1.47 × 10⁻² | Down |
| PPP2R2A | −4.510811417 | 3.62 × 10⁻³ | Down |
| IRS1 | −8.500540176 | 1.87 × 10⁻² | Down |
| CREB3 | −5.026439516 | 1.03 × 10⁻² | Down |
| PPP2R5A | −5.729220232 | 1.53 × 10⁻² | Down |
| PPP2R5B | −3.011595315 | 7.67 × 10⁻³ | Down |
| PFKL | −2.467192832 | 2.29 × 10⁻² | Down |
| PIK3R2 | −3.841154966 | 2.35 × 10⁻² | Down |
| PPP2R5E | −1.634192954 | 3.77 × 10⁻² | Down |
| CREB5 | −1.953383525 | 1.08 × 10⁻² | Down |
| G6PC3 | −2.621247554 | 3.18 × 10⁻² | Down |
| RAB11B | −4.129252447 | 3.58 × 10⁻² | Down |
| PIK3CB | −2.137748295 | 4.37 × 10⁻² | Down |
| PIK3CD | −3.600875922 | 4.88 × 10⁻² | Down |
| Gene Symbol | Degree |
|---|---|
| SLC2A4 | 9 |
| PGC-1α | 9 |
| LKB1 | 6 |
| AMPK | 6 |
| LIPE | 6 |
| CD36 | 5 |
| CAMKK2 | 5 |
| FOXO3 | 5 |
| FOXO1 | 5 |
| CPT1B | 5 |
| CPT1A | 4 |
| ADIPOR2 | 3 |
| ADIPOR1 | 3 |
| PPP2R1A | 1 |
© 2019 by the authors. Licensee MDPI, Basel, Switzerland. This article is an open access article distributed under the terms and conditions of the Creative Commons Attribution (CC BY) license (http://creativecommons.org/licenses/by/4.0/).
Share and Cite
Yao, C.; Pang, D.; Lu, C.; Xu, A.; Huang, P.; Ouyang, H.; Yu, H. Data Mining and Validation of AMPK Pathway as a Novel Candidate Role Affecting Intramuscular Fat Content in Pigs. Animals 2019, 9, 137. https://doi.org/10.3390/ani9040137
Yao C, Pang D, Lu C, Xu A, Huang P, Ouyang H, Yu H. Data Mining and Validation of AMPK Pathway as a Novel Candidate Role Affecting Intramuscular Fat Content in Pigs. Animals. 2019; 9(4):137. https://doi.org/10.3390/ani9040137
Chicago/Turabian StyleYao, Chaogang, Daxin Pang, Chao Lu, Aishi Xu, Peixuan Huang, Hongsheng Ouyang, and Hao Yu. 2019. "Data Mining and Validation of AMPK Pathway as a Novel Candidate Role Affecting Intramuscular Fat Content in Pigs" Animals 9, no. 4: 137. https://doi.org/10.3390/ani9040137
APA StyleYao, C., Pang, D., Lu, C., Xu, A., Huang, P., Ouyang, H., & Yu, H. (2019). Data Mining and Validation of AMPK Pathway as a Novel Candidate Role Affecting Intramuscular Fat Content in Pigs. Animals, 9(4), 137. https://doi.org/10.3390/ani9040137