Article

Evaluation of Linkage Disequilibrium, Effective Population Size and Haplotype Block Structure in Chinese Cattle

1
Institute of Animal Sciences, Chinese Academy of Agricultural Sciences, Beijing, 100193, China
2
National Engineering Laboratory for Animal Breeding, Key Laboratory of Animal Genetics, Breeding and Reproduction, Ministry of Agriculture, College of Animal Science and Technology, China Agricultural University, Beijing, 100193, China
3
Institute of Animal Husbandry and Veterinary Research, Anhui Academy of Agricultural Sciences, Hefei, 230031, China
*
Authors to whom correspondence should be addressed.
These authors contributed equally this work.
Animals 2019, 9(3), 83; https://doi.org/10.3390/ani9030083
Submission received: 18 January 2019 / Revised: 21 February 2019 / Accepted: 22 February 2019 / Published: 6 March 2019
(This article belongs to the Section Animal Genetics and Genomics)

Abstract

:

Simple Summary

Evaluation of the population structure and linkage disequilibrium can offer important insights to fully understand the genetic diversity and population history of cattle, which can enable us to appropriately design and implement GWAS and GS in cattle. In this study, we characterized the extent of genome-wide LD and the haplotype block structure, and estimated the persistence of phase of Chinese indigenous cattle with Illumina BovineHD BeadChip. According to our study, 58K, 87K, 95K, 52K, and 52K markers would be necessary for SCHC, NCC, SWC, SIM, and WAG, respectively, in the implementation of GWAS and GS and combining a multipopulation with high persistence of phase is feasible for the implication of genomic selection for Chinese beef cattle.

Abstract

Understanding the linkage disequilibrium (LD) across the genome, haplotype structure, and persistence of phase between breeds can enable us to appropriately design and implement the genome-wide association (GWAS) and genomic selection (GS) in beef cattle. We estimated the extent of genome-wide LD, haplotype block structure, and the persistence of phase in 10 Chinese cattle population using high density BovinHD BeadChip. The overall LD measured by r2 between adjacent SNPs were 0.60, 0.67, 0.58, 0.73, and 0.71 for South Chinese cattle (SCHC), North Chinese cattle (NCC), Southwest Chinese cattle (SWC), Simmental (SIM), and Wagyu (WAG). The highest correlation (0.53) for persistence of phase across groups was observed for SCHC vs. SWC at distances of 0–50 kb, while the lowest correlation was 0.13 for SIM vs. SCHC at the same distances. In addition, the estimated current effective population sizes were 27, 14, 31, 34, and 43 for SCHC, NCC, SWC, SIM, and WAG, respectively. Our result showed that 58K, 87K, 95K, 52K, and 52K markers were required for implementation of GWAS and GS in SCHC, NCC, SWC, SIM, and WAG, respectively. Also, our findings suggested that the implication of genomic selection for multipopulation with high persistence of phase is feasible for Chinese cattle.

1. Introduction

High-throughput genotype technology has revolutionized genome-scale studies and offers an effective strategy to investigate population structure and genetic diversity [1]. This technology also provides new opportunities to analyze linkage disequilibrium (LD) at a genome-wide level. The power of genome-wide association study (GWAS) and predictive accuracy of genomic selection (GS) largely depend on linkage disequilibrium (LD) between quantitative trait loci (QTL) and genetic markers [2,3]. The information about LD can also provide valuable insights to explore the population history and selection, and mutations in specific genomic regions [3,4]. Extensive LD patterns can be used to characterize the selection strength in diverse cattle populations. Furthermore, as LD decays were normally found across generations, the LD level was widely utilized to estimate Ne at any particular time in the past generations [5,6]. The detection of high resolution LD pattern and characterization of haplotype block structure of the bovine genome can provide important insights into understanding economically important traits, which are under selection for different agricultural purposes [7]. Also, the extent of LD across populations depends on the maintenance of allele phase relationships between markers and QTLs [8]. Previous studies have estimated and compared the persistence of phase at various levels (across breeds, countries, or populations and generations) [9], and these findings can further be used to estimate the population history and genetic diversity [10]. Understanding of the persistence of phase between breeds are important for application of GS for small size populations as well as crossbred animals [11].
Chinese indigenous cattle have been selected for various environmental conditions and, thus, they can offer valuable resources to elucidate the genetic basis underpinning some important traits, including resistance to local diseases and parasites, fine fat deposition capabilities, adaptation to low quality feed resources, and wet-heat tolerance [12]. Many indigenous cattle normally have small population size, thus, the implementation of genomic selection in a meta-population with small population sizes will help to improve the genetic progress for these breeds. Moreover, evaluation of the extent of genome-wide LD can offer important insights to understanding the cattle genetic diversity and population history. Many studies have been carried out to quantify LD patterns using low density of markers in various indigenous cattle population from different countries and regions, such as South African [10], Spanish [13], Polish [1], Brazilian [14], Iranian [15], and Korean [16]. High density chip offers the opportunity to perform high resolution estimations of LD extension at the shortest marker distances. This genomic tool also provides a high chance to identify marker LD and construct a haplotype block map over the whole genome [17]. However, the extent of genome-wide LD and haploblock structure using BovinHD BeadChip in Chinese cattle is largely unexplored.
In this study, we characterized the extent of genome-wide LD patterns and haplotype blocks in Chinese cattle (10 Chinese indigenous cattle populations and two imported breeds) using Illumina BovineHD BeadChip (Illumina, Inc., San Diego, CA), and the persistence of phase between breeds was estimated to evaluate the feasibility of multibreed genomic prediction for these populations.

2. Material and Methods

2.1. Animal Samples and Quality Control

All experimental procedures for animals were proposed by the Chinese Council on Animal Care and the Ministry of Agriculture of China.
The samples of Chinese indigenous cattle consisted of Mongolia cattle (MGC, n = 21), Yanhuang cattle (YHC, n = 24), Caidamu cattle (CDM, n = 25), Xizang cattle (XZC, n = 26), Pingwu cattle (PWC, n = 24), Liangshan cattle (LSC, n = 22), Zhaotong cattle (ZTC, n = 23), Wenshan cattle (WSC, n = 24), Hannan cattle (HNC, n = 26), and Nandan cattle (NDC, n = 25). Simmental cattle (SIM, n = 107) and Wagyu cattle (WAG, n = 93) were used as reference groups.
Genomic DNA was extracted from blood samples using a TIANamp Blood DNA Kit (Tiangen Biotech Company Limited, Beijing, China). The samples were genotyped using Illumina BovineHD BeadChip (Illumina, Inc., San Diego, CA, USA), which consisted of 777,962 SNPs. Genotype calling and initial data quality control (QC) were performed using Genome Studio software (Illumina Inc. San Diego, CA, USA). We divided 10 Chinese indigenous cattle populations into groups by K-means clustering implemented in R package “adegenet”. K-means is a reallocation method which uses discriminant analysis of principal components, and it allows for choosing an optimal number of clusters using a principal component analysis (PCA) procedure [18,19]. The quality control of genotype data was conducted using PLINK v1.9 [20].
Unrelated individuals were kept based on pedigree and pi-hat values. Samples with total call rates <0.90 were removed from the final dataset. Only SNPs located on autosomes were considered for subsequent analyses. SNPs with call rates <0.90, minor allele frequencies (MAF) <0.05, and those that deviated significantly from Hardy–Weinberg equilibrium (p < 10−6) were excluded.

2.2. Linkage Disequilibrium

The r-squared statistic can be used to estimate the extent of LD. We calculated the r2 between SNP pairs with physical distances between 0 to 1 Mb of all autosomes to estimate the extent of LD in PLINK v1.9 separately for each group. The decays of LD were analyzed for each of 2.5 kb between SNP pairs with an interval of less than 99999 SNPs and 1 Mb. To evaluate the feasibility of marker panels in GWAS and GS, the average r2 between adjacent markers was calculated according to Badke et al. [21].

2.3. Haplotype Blocks

Haplotype blocks are particular combinations of alleles for a genomic region in which less than 5% of comparisons among informative SNP pairs show strong evidence of historical recombination [22]. The haplotype blocks were detected across autosomes within breeds using the expectation–maximization algorithm [23] approach implemented in PLINK v1.9.

2.4. Persistence of Phase Across Groups

The persistence of phase between alleles on the same autosome was estimated using r, and the estimated parameter used was the same as the r-squared for SNP pairs. The persistence of phase was measured as the Pearson correlation between the average means of linkage phase in different distances. The correlations were computed for r between each marker pairs among all pairwise populations, and a series of genomic distance intervals were set in this analysis using bins of 2.5 kb for small genetic distance (0–10 kb), 10 kb for medium genetic distance (10–100 kb), and 100 kb for large genetic distance (100–1000 kb).

2.5. Ancestral Effective Population Size

The estimated r2 was used to calculate the effective population size for past generations [24]. In general, genetic distance c was using physical distance approximated for estimating the Ne directly [8,25]. In this study, we calculated the Ne using the following formulations [26]:
N e = ( 1 4 c ) ( 1 E ( r 2 ) 1 ) ,
T = 1 2 c ,
where c is the distance in Morgan between the SNPs and assumed to be 100 Mb per Morgan. T represents the number of generations ago. For this part, r-squared was recalculated for SNP pairs with an interval less than 99999 SNPs and 20 Mb length. We inferred Ne using autosomes SNPs at distance bins of <0.025, 0.025–0.05, 0.05–0.1, 0.1–0.2, 0.2–0.4, 0.4–0.5, 0.5–0.7, 0.7–1, 1–2, 2–5, 5–10, |nd 10–50 cM. All statistical computations were conducted with R v3.0.2 [27].

3. Results

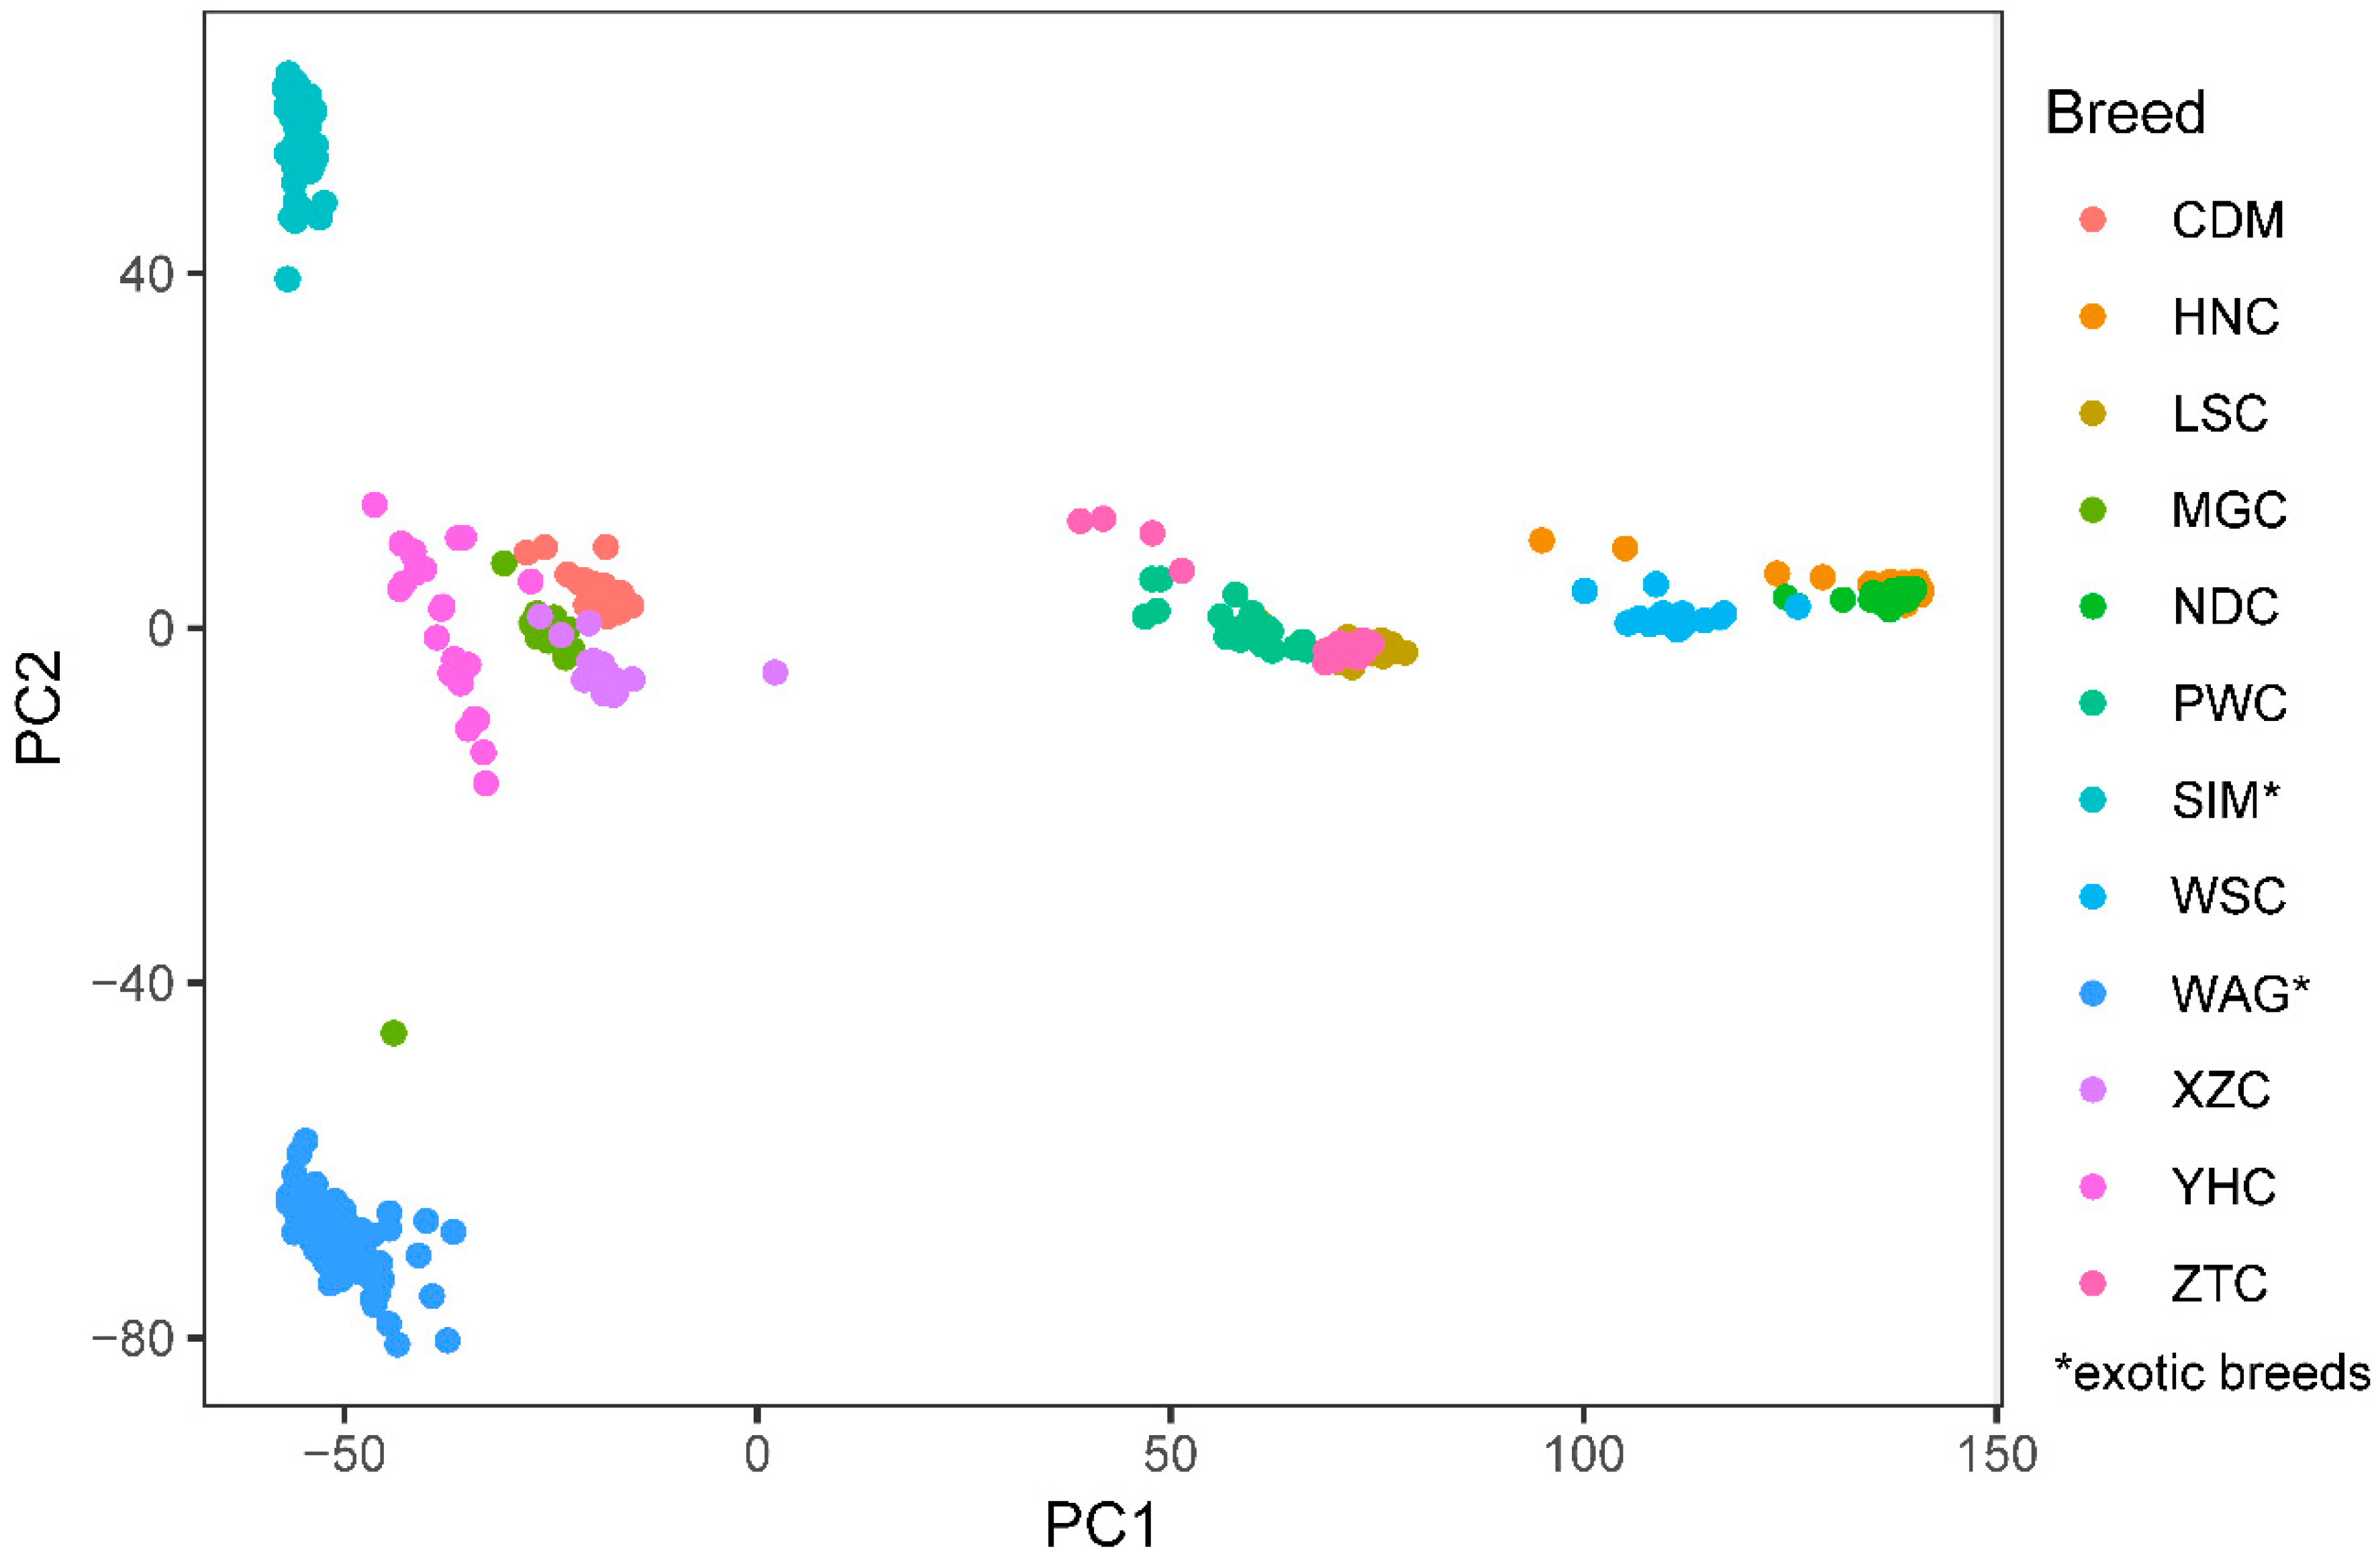
3.1. Population Structure and SNP Distribution

All samples were genotyped using the Illumina Bovine HD BeadChip (Illumina, Inc., San Diego, CA, USA), which consisted of 777,962 SNPs with an average distance of 3.60 kb. Using this genotype data set, we divided 10 Chinese indigenous cattle populations into three groups (Figure 1), including north Chinese cattle group (NCC, contains CDM, YHC, MGC, and XZC), southwest Chinese cattle group (SWC, contains LSC, PWC, and ZTC) and south Chinese cattle group (SCHC, contains HNC, NDC and WSC), which were consistent with their geographical locations in China. Based on the cluster analysis, we found that SIM and WAG were separated from other Chinese indigenous cattle. After QC, a total of 625670 SNPs remained SNPs in NCC, while 464294 SNPs remained in SCHC. The summary of SNP distributions are presented in Supplementary Table S1.

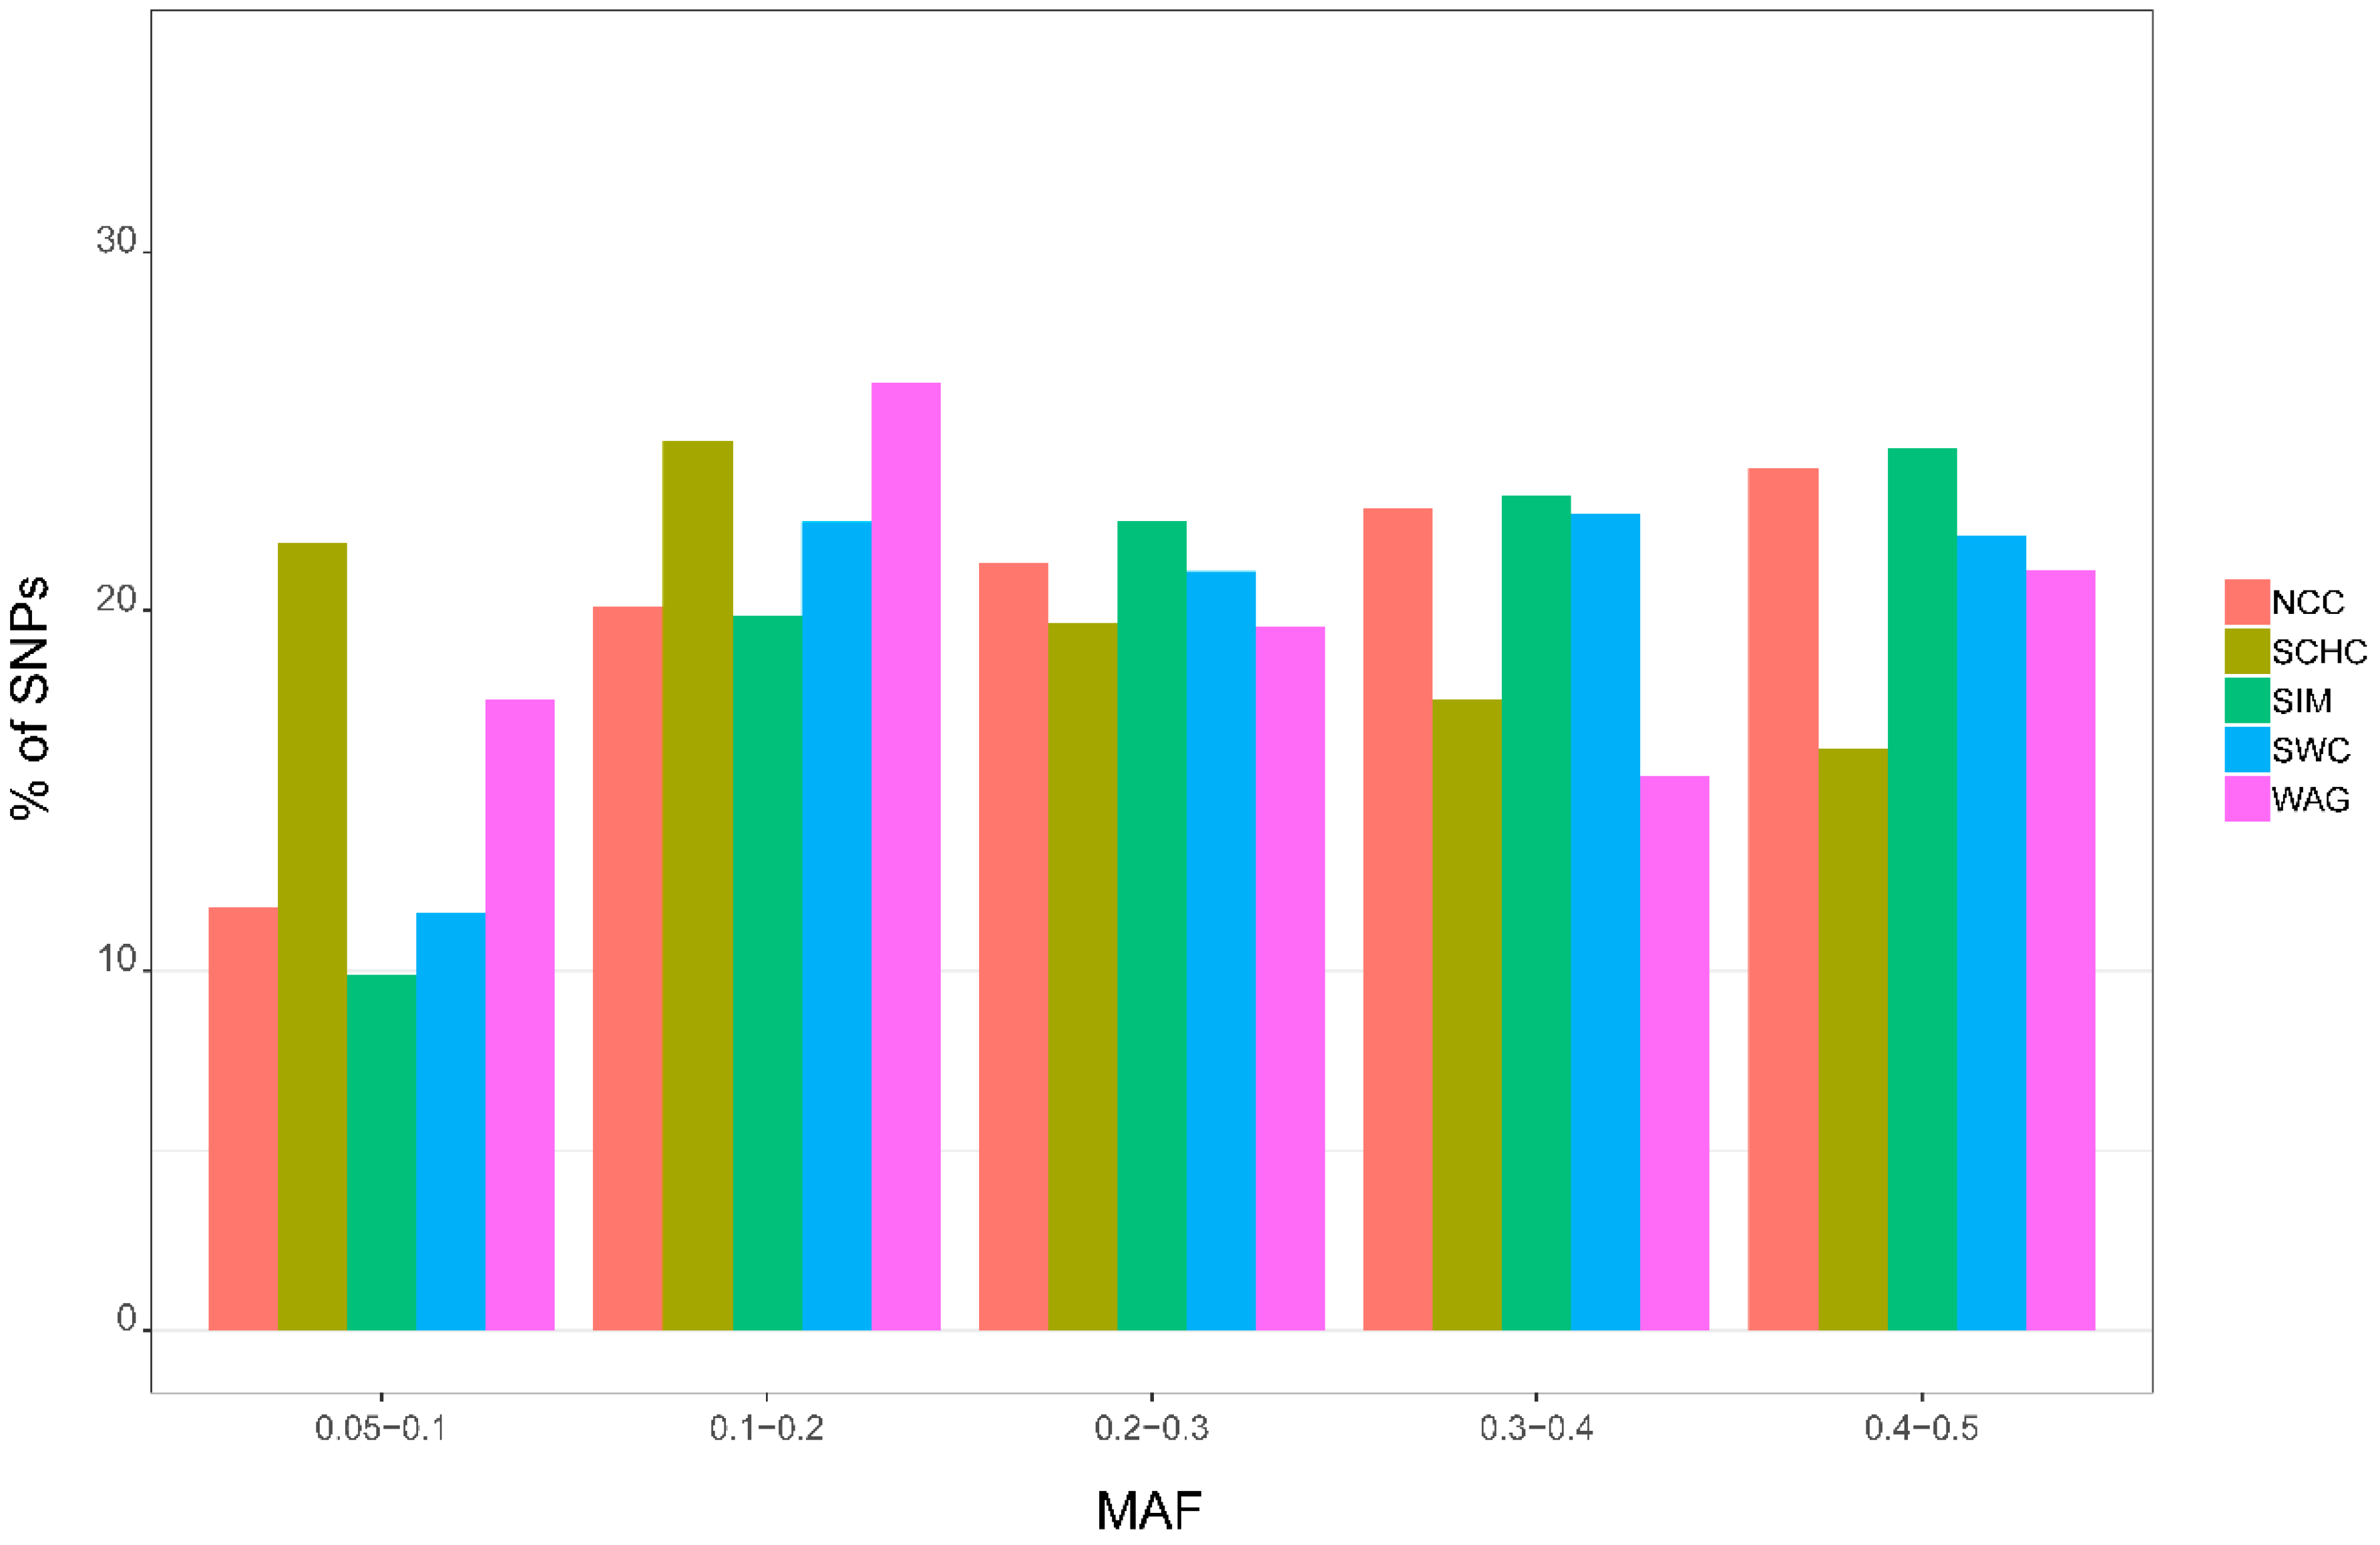
3.2. Minor Allele Frequency

The mean MAF for autosomes SNPs were 0.24 (SCHC), 0.28 (NCC), 0.27 (SWC), 0.29 (SIM), and 0.25 (WAG). The distributions of MAFs for these groups were presented in Figure 2. The percentages of SNPs with MAFs of 0.05–0.1 were high in SCHC and WAG, while the lowest were found in SIM.

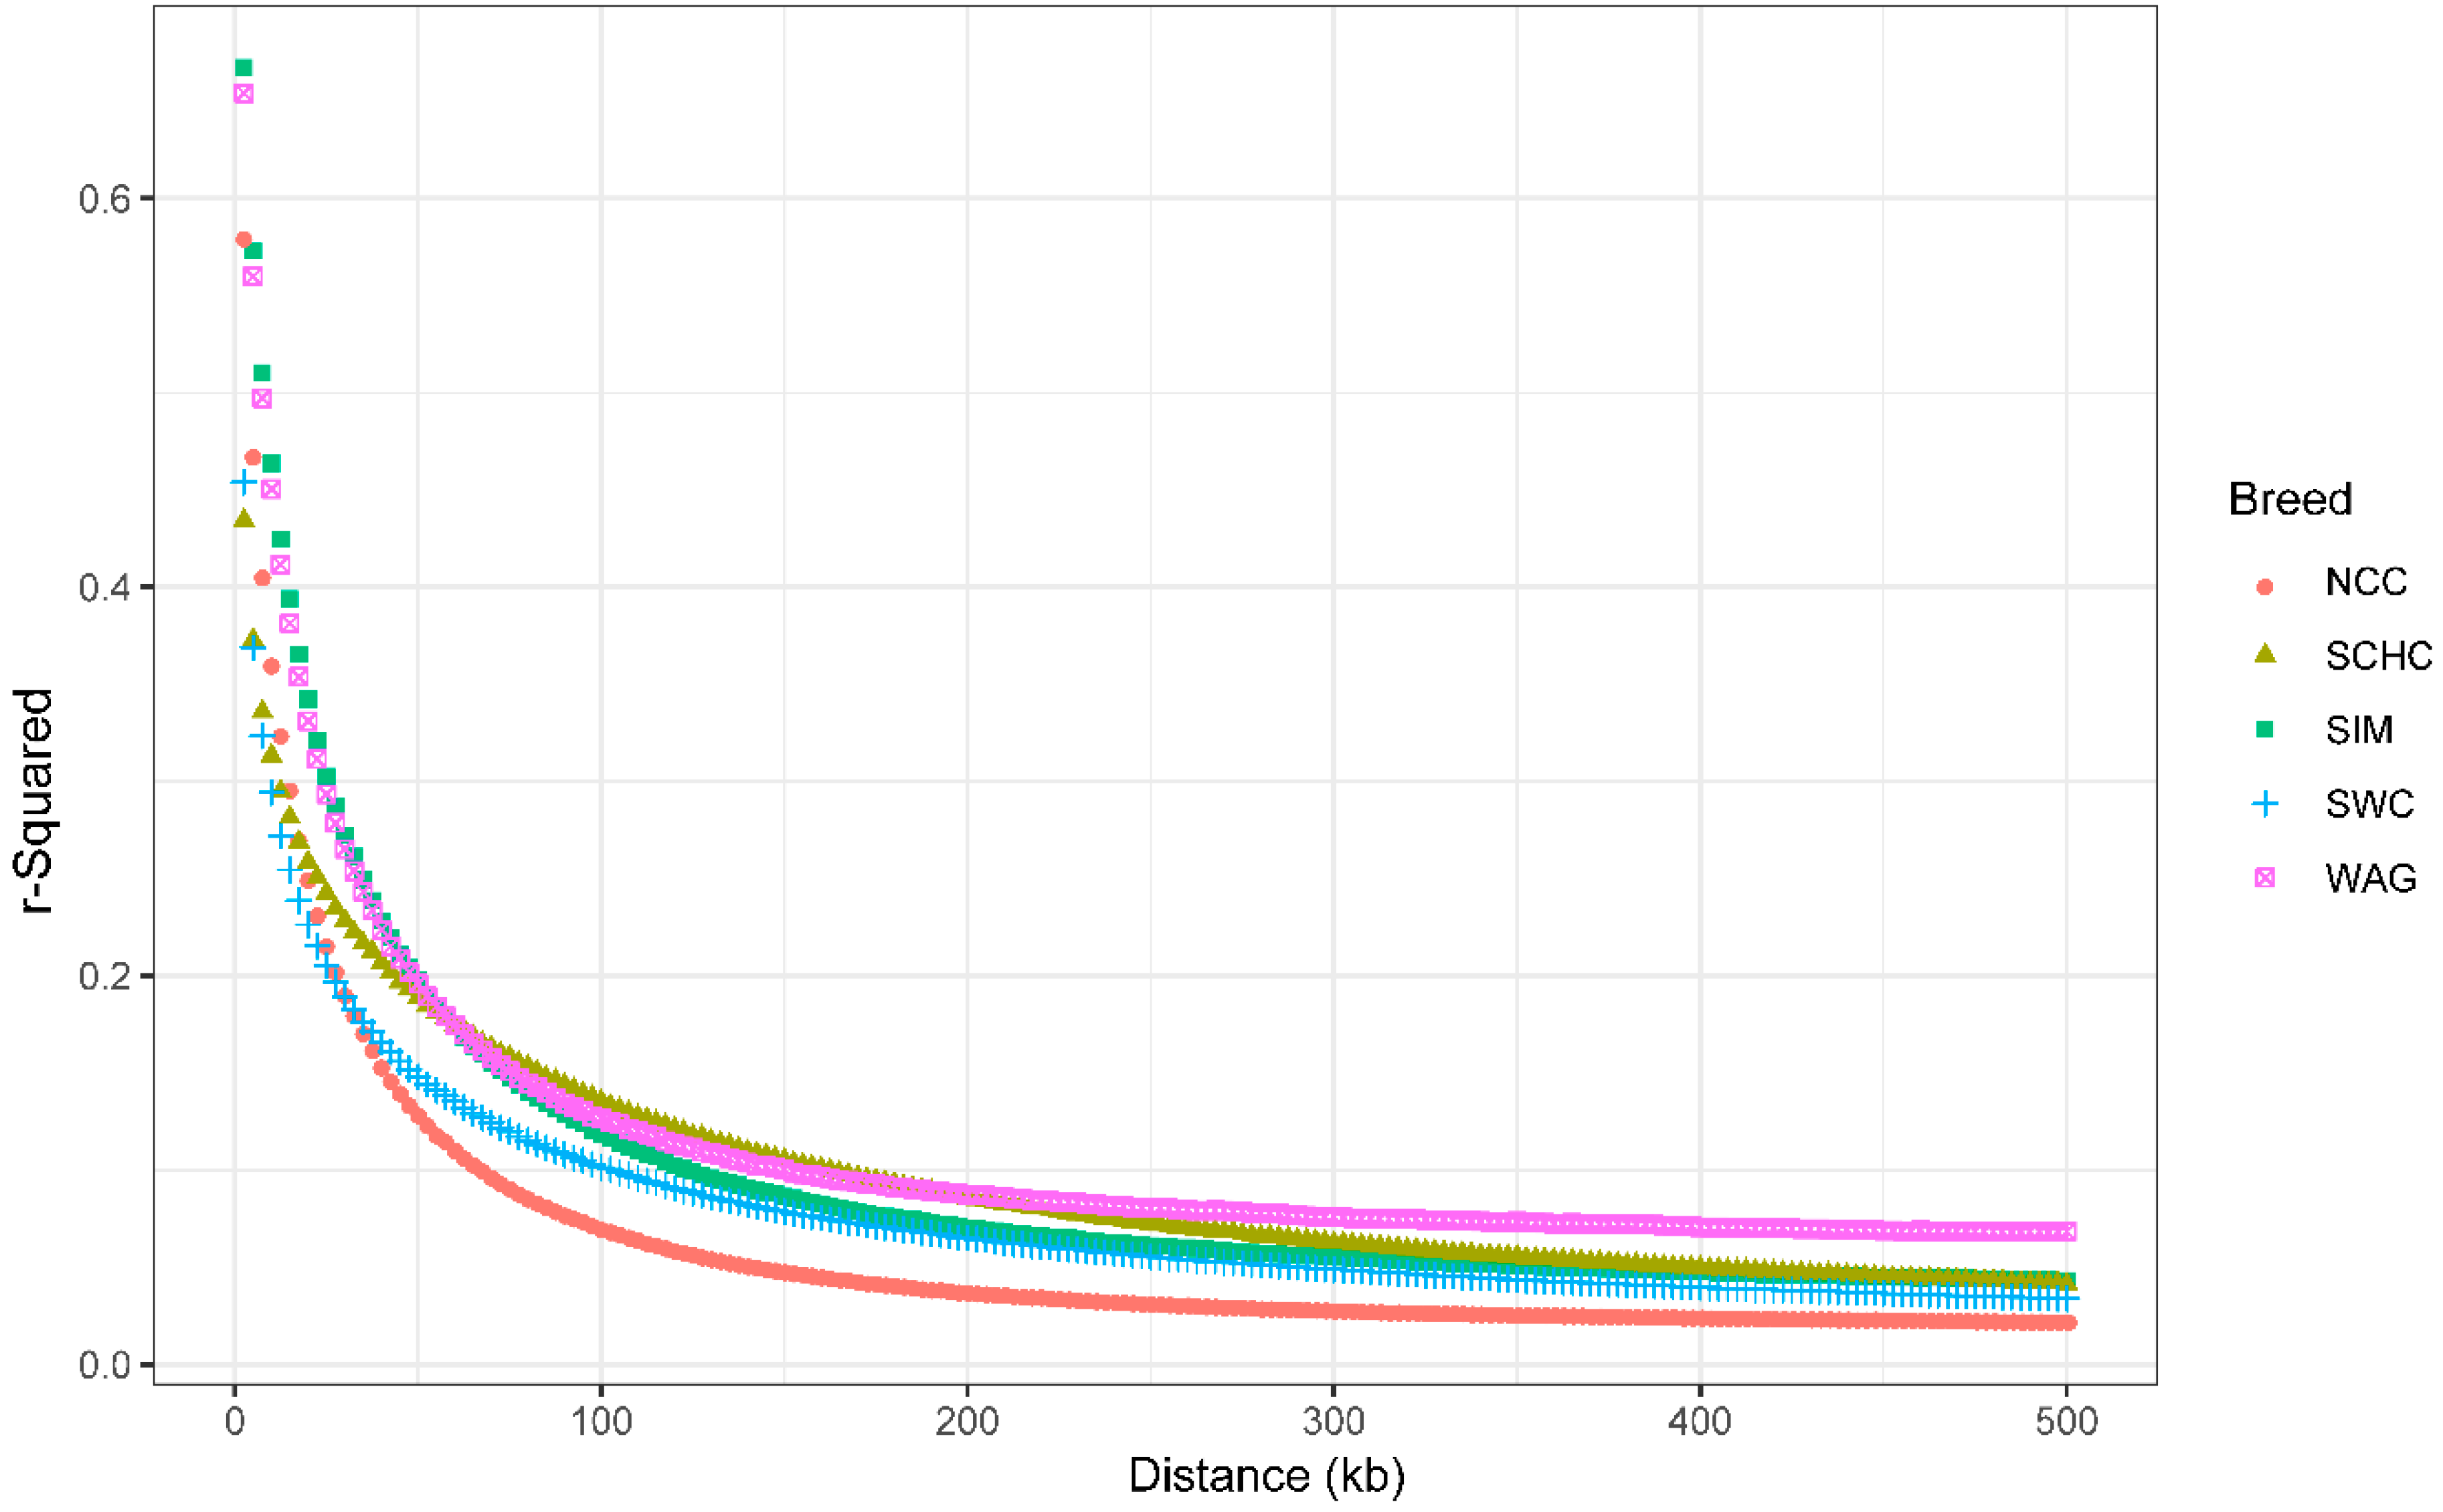
3.3. Extent of Linkage Disequilibrium

Across the autosomes, the overall LD (r2) between adjacent SNPs were 0.60, 0.67, 0.58, 0.73 and 0.71 for SCHC, NCC, SWC, SIM and WAG, respectively. Genome-wide average LD (r2) decreased with genetic distance for all groups (Figure 3, details in Supplementary Table S3). At genetic distances of 0–50kb, SIM had the highest LD level, followed by WAG, NCC, SWC, and SCHC. When r2 was set to 0.2, we observed that the corresponding distances between markers based on LD decay were around 45, 30, 27.5, 50, and 50 kb for SCHC, NCC, SWC, SIM, and WAG, respectively. The descriptive results of markers and LD (r2) between adjacent markers across autosomes were shown in Supplementary Table S2.

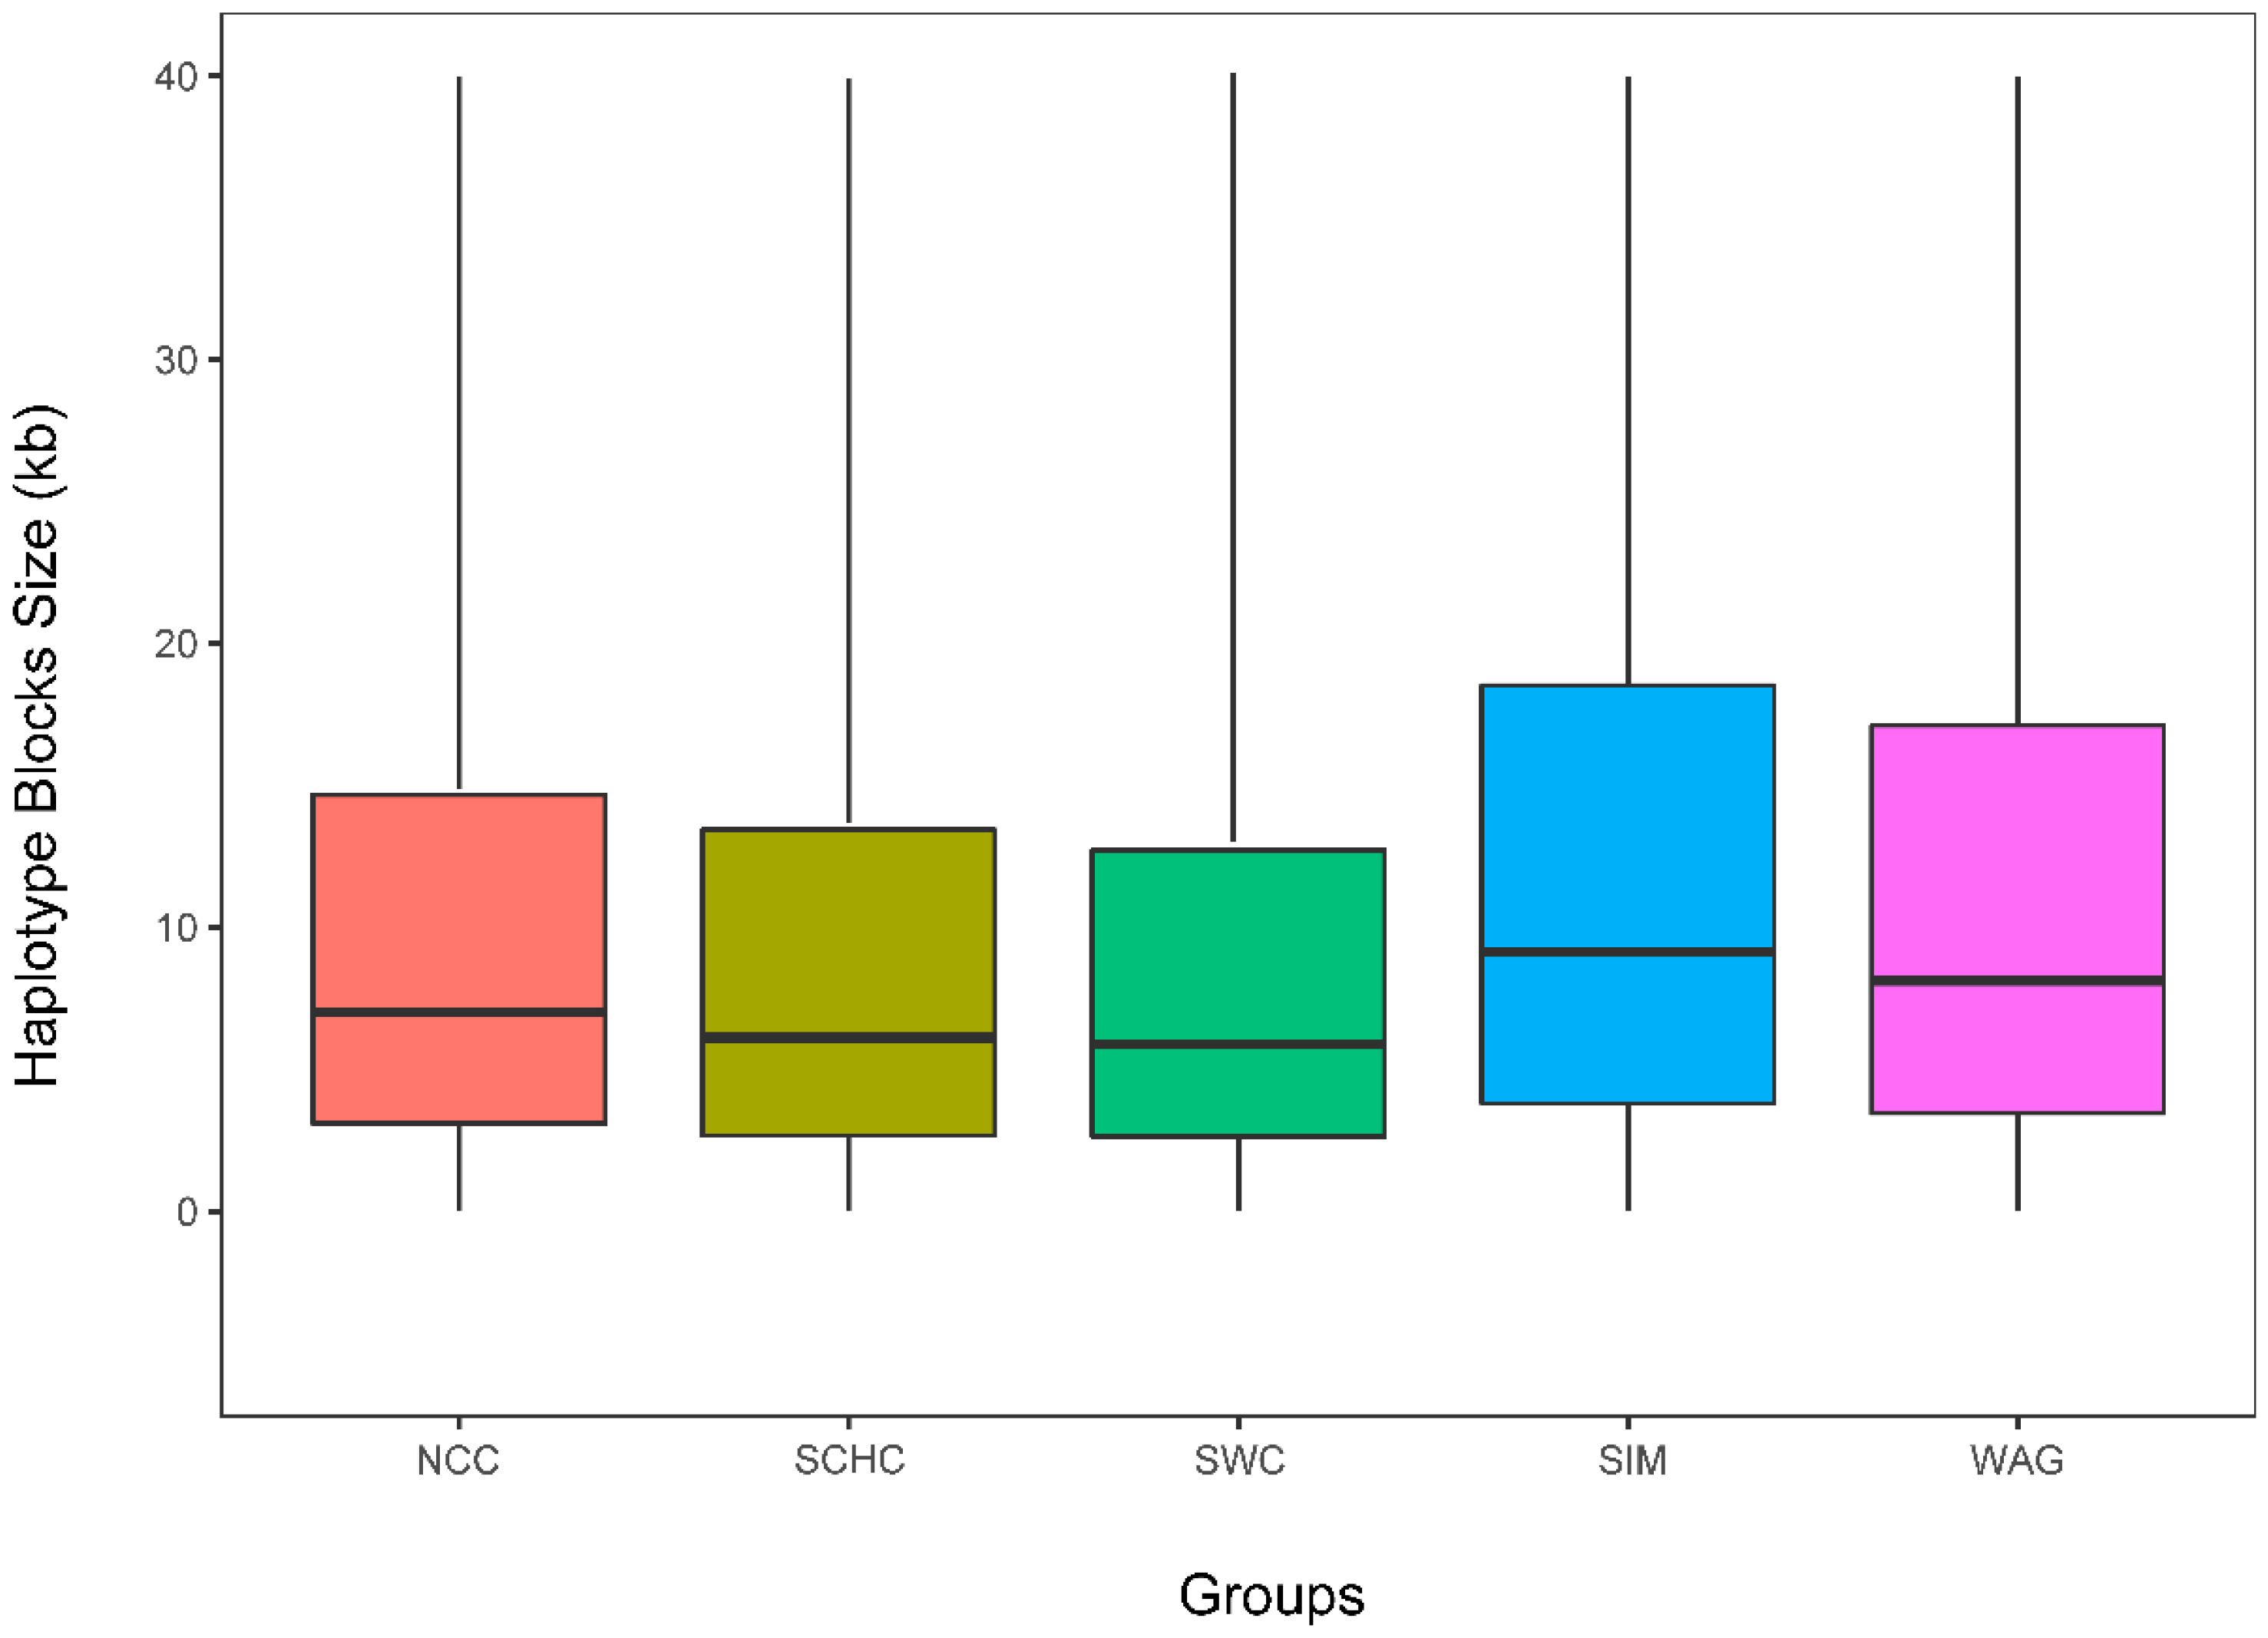
3.4. Haplotype Block Structure

The summary of genome-wide haplotype block was presented in Table 1. The total number of 61241, 88829, 86957, 72287, and 68627 haplotype blocks were detected in SCHC, NCC, SWC, SIM, and WAG respectively, and the coverage rates of cattle autosomes were 35.92%, 47.59%, 42.75%, 61.43%, and 52.25%. The distribution of haplotype block sizes is shown in Figure 4. SIM had the longest average haplotype block size, while SCHC had the shortest size. The mean number of SNPs within the haplotype blocks ranged from 4.45 (SCHC) to 7.16 (SIM). The details of shared and unique haplotype blocks for five groups were summarized in Supplementary Table S5.

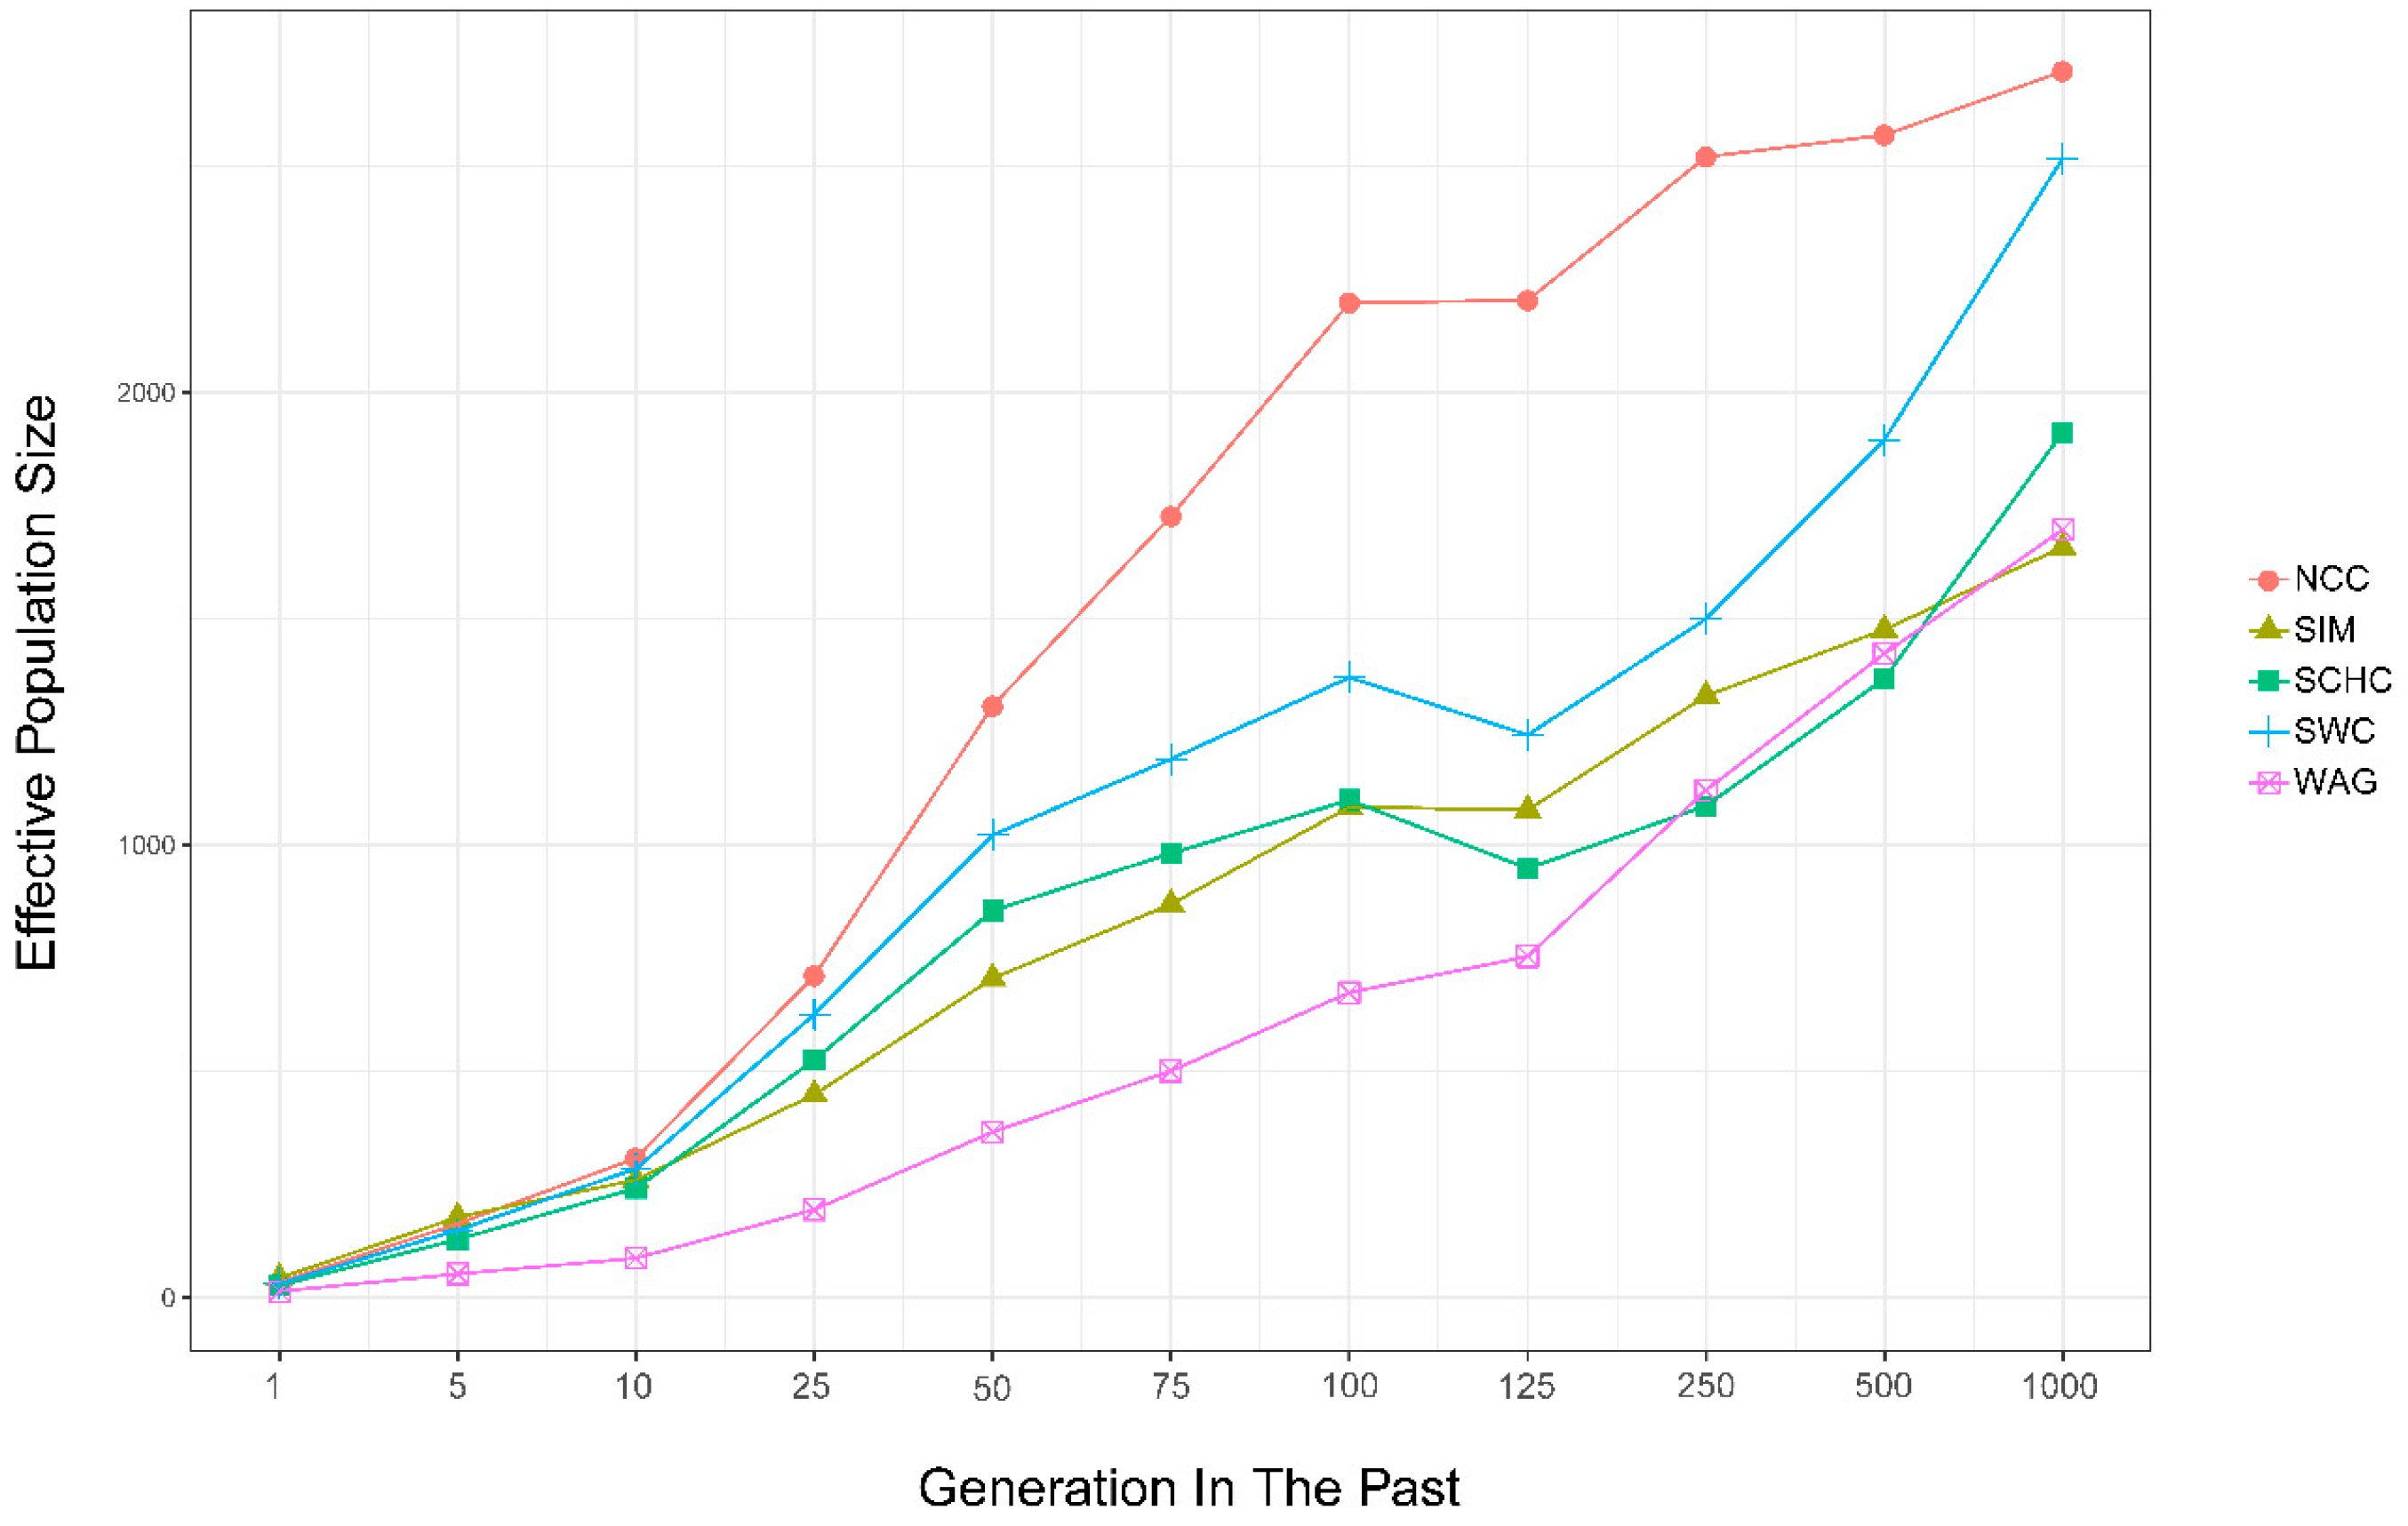
3.5. Effective Population Size

As shown in Figure 5, the estimated Ne decreased over generations for studied groups (Table 2). The estimation for Ne decreased from 2710 (1000 generations ago) to 34 (recent generation) for NCC, from 1912 to 27 for SCHC, from 2517 to 31 for SWC, from1658 to 43 for SIM, and from 1696 to 14 for WAG, which reflected a decreasing trend in Ne for all breeds. In this study, NCC had the biggest estimated Ne in the recent 100 generations, while WAG had the smallest Ne.

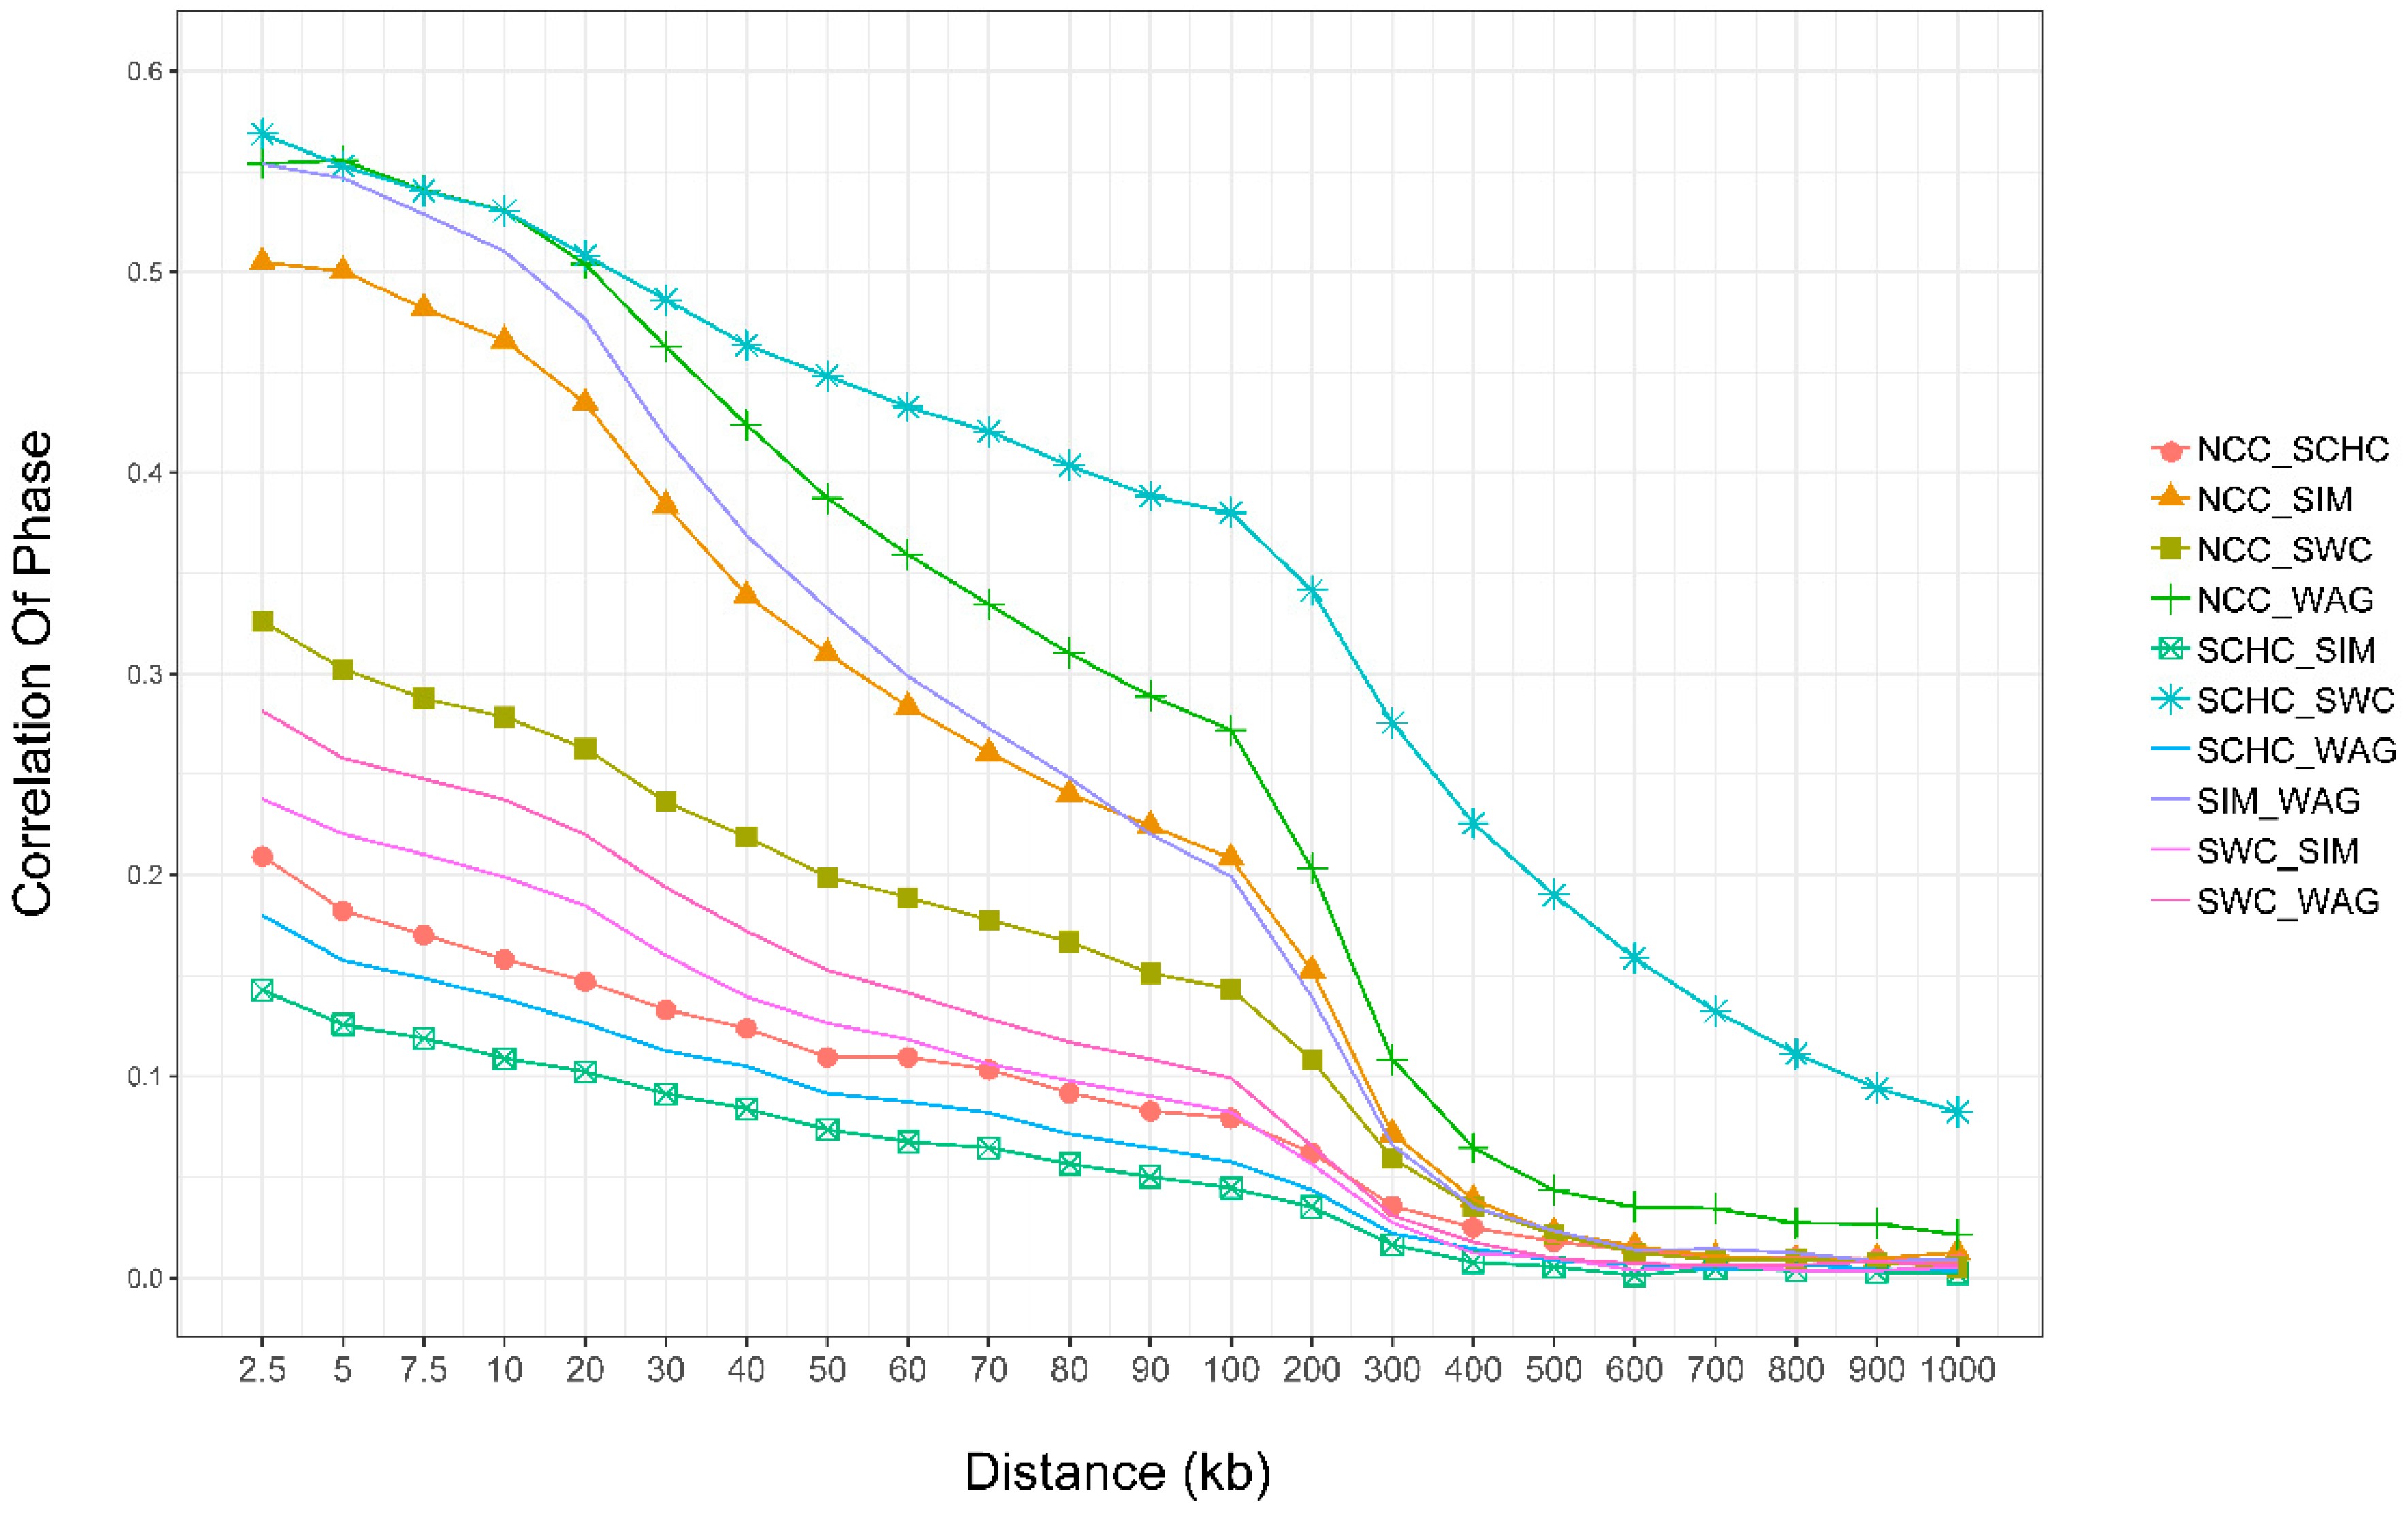
3.6. Persistence of Phase

In this study, the persistence of phase decreased with the distance for all groups (Figure 6, details in Supplementary Table S4). We found that the overall correlation of phase between markers in SCHC vs. SWC (RSCHC-SWC) was higher, and lower for SIM vs. SCHC. Phase correlations decreased rapidly with the increasing distances between SNPs, which was similar to the trend of average r2. RSCHC-SWC decreased from 0.57 with an average distance <2.5 kb to 0.08 for a marker distance of 900–1000 kb, while RSIM-SCHC decreased from 0.14 to 0.002.

4. Discussion

4.1. Animals and Grouping of Chinese Indigenous Cattle

Our study is the first attempt to estimate the extent of LD and the persistence of phase among Chinese indigenous cattle using Illumina Bovine HD SNP array. Previous studies revealed that high density SNP arrays have been widely used to identify the candidate association signals for important traits [28]. Using K-means clustering [29], we drew the population structure map from the first two principal components for 10 Chinese indigenous cattle, and divided these cattle into three groups. The cluster results for these cattle are generally consistent with their geographical location. Our findings are similar to previous studies on population history [30,31,32], that Chinese indigenous cattle are mainly composed of three distinct ancestries: East Asian taurine ancestry, Eurasian taurine ancestry, and novel Chinese indicine ancestry. Small population size is a major challenge for improving the accuracy of genomic selection for indigenous cattle, thus, joint analysis of multiple populations with a certain degree of relationship is an alternative strategy for application of genome selection in different Chinese indigenous cattle with a small population size [33].

4.2. Minor Allele Frequencies (MAF) and Linkage Disequilibrium (LD)

In our study, we found Chinese cattle have higher proportion of low MAF SNPs than the imported breed (SIM and WAG), which indicates that they have a lower percentage of polymorphic loci. Our result was similar with a previous study [10]. The lower percentage of polymorphic loci among South African cattle breeds has previously been attributed to the ascertainment bias associated with the design of the BovineSNP50K BeadChip [34], as the SNP used in the design of the assay were mostly detected in European Bos taurus breeds, which may cause lower MAF in other breeds.
We used r2 value to estimate the extent of LD, because small sample size can cause bias for the estimates of LD when the D’ value was used [17]. A previous study has illustrated that the accuracy of r2 values can reach 0.85 when 55 samples were used for the calculation [17], thus, the sample size in this study was large enough (65–106 animals) for the estimation of r2 values. Moreover, we found the levels of LD were inversely related to the distance of marker pairs (Figure 3). This result is consistent with previous studies in Angus, Holstein, and other breeds [25,35,36]. The estimate of LD for SNP pairs separated by 40–50 kb was higher in SIM (0.21), WAG (0.21), and SCHC (0.20), compared to SWC (0.15) and NCC (0.14). In previous studies, the levels of LD were reported in Ethiopian cattle (0.14) [37] and Nellore cattle (0.17) [2]. The differences in the estimated LD in the current study may be ascribed to different selection and evolutionary forces during the process of breed formation [16]. As selection can change the level of LD, our result indicated that SWC and NCC may be under moderate selection compared with SCHC [38]. In our study, the highest LD values were observed in chromosome 6 (BTA6) across five groups, which may indicate the presence of QTLs with large effects that have been under intensive selection and generate high LD with nearside markers in BTA6 [39]. For instance, some QTLs at BTA6 affecting growth traits, such as birth weight [40], carcass weight [41], and ribeye area [40], and also feed intake and body weight gain [41,42], have been reported in different breeds.
Evaluation of LD levels can also be used to determine optimal marker density in GWAS and GS [43,44]. The estimated accuracy can reach up to 85% for genomic predication when the estimated r2 is greater than 0.20 [45], thus, we considered r2 greater than 0.20 as the threshold of the suggested LD level. We observed the average distance of markers pairs with r2 of 0.2, which suggested 58K, 87K, 95K, 52K, and 52K markers were required for the implementation of GS for SCHC, NCC, SWC, SIM, and WAG respectively, and that Chinese indigenous cattle need higher density markers for genomic predication compared to SIM and WAG.

4.3. Haplotype Blocks

Many factors can influence the properties of haplotype blocks in cattle, including breed, marker types, and marker density of region [46]. In this study, the average haplotype block size ranged from 5.7 to 103.3 kb. Another study identified haplotype blocks in a crossbreed of Charolais and zebu, where they observed a total of 76,673 of blocks covering 1569.5 Mb (~61% of autosome genome) [47]. We observed that the number of blocks ranged from 61,241 to 88,829 across groups (Table 1). Meanwhile, the length of haplotype blocks in SIM and WAG were longer than those of the NCC, SWC, and SCHC groups. This result is probably due to the SIM and WAG having been strongly selected in recent decades compared to Chinese indigenous cattle.
We found the longest haplotype blocks at BTA5 in NCC and SWC, while the longest haplotype structures were observed at BTA2, BTA7, and BTA8 in SIM, SCHC, and WAG respectively. This result suggested the presence of beneficial variants of BTA5 propagating in NCC and SWC, which may possibly have been selected due to these traits being associated with cold tolerance and plateau adaptability. We compared the shared and unique haplotype block regions on chromosomes across groups (Supplementary Table S4), and the shared blocks covered ~14.07% of autosomes, while SIM had the largest region of unique blocks (~0.86% of autosomes) and the smallest (~0.27%) was found in NCC. This finding was probably due to SIM being derived from European cattle and they exhibit obvious genetic difference from Asian cattle (NCC, SCHC, SWC, and WAG).

4.4. Effective Population Size

The effective population size (Ne) can facilitate the designs of selection schemes in animal breeding [48] and the management of populations for endangered species [49]. LD pattern can be explored to comprehensively understand the population evolutionary history [50]. In this study, we computed the extent of LD at different distances between markers and estimated the ancestral effective population sizes. Ne has generally decreased since 1000 generations ago, while SCHC and SWC have increased slightly since 125–100 generations ago (Figure 5). The decrease in Ne may imply that breed formation was largely due to the post-domestication events of human migration with cattle [25]. Based on this estimation, the shrinkage of Ne depends on the number of sires and the variance of progeny number per sire [51]. We found WAG and SIM have lower Ne in the most recent 100 generations, and this could be explained by strong selection and the use of relatively few elite sires in the breeding process.

4.5. Persistence of Phase

Persistence of LD was measured to assess the extent of agreement of allele phase for pairs of markers between groups [21], which can reflect the genetic relationship among them [47]. LD persistence can also be utilized to investigate the reliability of GWAS and GS across breeds. High positive values are a result of high r2 values of the same phase between two populations, whereas high negative values indicate high r2 values with a reversed phase [52]. In our study, higher correlations were found between SCHC vs. SWC, SIM vs. NCC, SIM vs. WAG, and NCC vs. WAG when the marker pair distance was 0–5 kb. The persistence of phase analysis suggested a close genetic relationship was found between SCHC and SWC, and among SIM, NCC, and WAG. This might be explained by the fact that populations from SCHC and SWC are derived from indicine, and NCC and WAG are derived from East Asian taurine [30], while SIM is from Eurasian taurine. Therefore, our result from persistence of phase analysis suggested genomic selection can be utilized for multiple small size populations with a certain degree of genetic relationship.

5. Conclusions

We found Chinese indigenous cattle have low LD compared to Chinese Simmental and Wagyu cattle at the genetic distance of 0–50 kb, which indicated more markers are required for the implementation of genomic selection in Chinese indigenous cattle. Our finding suggested 58K, 87K, 95K, 52K, and 52K markers were required for the implementation of genomic selection in SCHC, NCC, SWC, SIM, and WAG, respectively. Multiple population genomic selection was feasible for populations with high correlations of phase.

Supplementary Materials

The following are available online at https://www.mdpi.com/2076-2615/9/3/83/s1, Table S1: Basic information for samples. Table S2: Summary of SNPs across autosomes for five groups. Table S3: Summary of SNP pairs, average, standard deviation (SD), median linkage disequilibrium (r2) for five groups. Table S4: Summary of persistence of phase between pairwise groups for different distance. Table S5: Summary of shared and unique haplotype blocks for studied breeds.

Author Contributions

Data curation, L.X. (Lei Xu), Z.W., L.X. (Ling Xu), Y.L. and H.G.; Formal analysis, L.X. (Lei Xu) and B.Z.; Funding acquisition, J.L.; Investigation, Y.C., L.Z., X.G. and H.G.; Supervision, S.Z., L.X. (Lingyang Xu), and J.L.; Writing—original draft, L.X. (Lei Xu); Writing—review & editing, L.X. (Lingyang Xu).

Funding

This study was supported by Chinese Academy of Agricultural Sciences Foundation (2016ywf-yb-6), Chinese Academy of Agricultural Sciences of Technology Innovation Project (CAAS-XTCX2016010, CAAS-ZDXT2018006, ASTIP-IAS03, ASTIP-IAS-TS-9 and ASTIP-IAS-TS-16), the National Natural Science Foundations of China (31702084 and 31372294) for the design of study and data collection. The project was also partly supported by Beijing City Board of Education Foundation (PXM2016_014207_000012) for the data analysis and interpretation of the study.

Acknowledgments

The authors would like to thank the staff at the cattle experimental unit in Beijing and Ulgai for caring of animals and collection biological samples.

Conflicts of Interest

The authors declare that they have no competing interests.

Abbreviations

The following abbreviations are used in this manuscript: QTL: quantitative trait loci; GWAS: genome-wide association study; GS: genomic selection; LD: linkage disequilibrium; Ne: effective population size; MAF: minor allele frequency; QC: quality control; SD: standard deviation; MGC: Inner Mongolia cattle, YHC: Yanhuang cattle, CDM: Caidamu cattle, XZC: Xizang cattle, PWC: Pingwu cattle, LSC: Liangshan cattle, ZTC: Zhaotong cattle, WSC: Wenshan cattle, HNC: Hannan cattle, NDC: Nandan cattle, SIM: Simmental cattle, WAG: Wagyu cattle, NCC: north Chinese cattle group (contains CDM, YHC, MGC, and XZC), SWC: southwest Chinese cattle group (contains LSC, PWC, and ZTC), SCHC: south Chinese cattle group (contains HNC, NDC, and WSC).

References

  1. Jasielczuk, I.; Gurgul, A.; Szmatoła, T.; Ząbek, T.; Pawlina, K.; Semik, E.; Bugno-Poniewierska, M. Linkage disequilibrium and haplotype block structure in Limousin, Simmental and native Polish Red cattle. Livest. Sci. 2016, 191, 57–63. [Google Scholar] [CrossRef]
  2. Espigolan, R.; Baldi, F.; Boligon, A.A.; Souza, F.R.P.; Gordo, D.G.M.; Tonussi, R.L.; Cardoso, D.F.D.F.; Oliveira, H.N.; Tonhati, H.; Sargolzaei, M.; et al. Study of whole genome linkage disequilibrium in Nellore cattle. BMC Genom. 2013, 14, 305. [Google Scholar] [CrossRef] [PubMed]
  3. Gurgul, A.; Semik, E.; Pawlina, K.; Szmatoła, T.; Jasielczuk, I.; Bugno-Poniewierska, M. The application of genome-wide SNP genotyping methods in studies on livestock genomes. J. Appl. Genet. 2014, 55, 197–208. [Google Scholar] [CrossRef] [PubMed]
  4. Pérez O’Brien, A.M.; Mészáros, G.; Utsunomiya, Y.T.; Sonstegard, T.S.; Garcia, J.F.; Van Tassell, C.P.; Carvalheiro, R.; da Silva, M.V.B.; Sölkner, J. Linkage disequilibrium levels in Bos indicus and Bos taurus cattle using medium and high density SNP chip data and different minor allele frequency distributions. Livest. Sci. 2014, 166, 121–132. [Google Scholar] [CrossRef]
  5. Bohmanova, J.; Sargolzaei, M.; Schenkel, F.S. Characteristics of linkage disequilibrium in North American Holsteins. BMC Genom. 2010, 11, 421. [Google Scholar] [CrossRef] [PubMed]
  6. Flury, C.; Tapio, M.; Sonstegard, T.; Drögemüller, C.; Leeb, T.; Simianer, H.; Hanotte, O.; Rieder, S. Effective population size of an indigenous Swiss cattle breed estimated from linkage disequilibrium. J. Anim. Breed. Genet. 2010, 127, 339–347. [Google Scholar] [CrossRef] [PubMed]
  7. McKay, S.D.; Schnabel, R.D.; Murdoch, B.M.; Matukumalli, L.K.; Aerts, J.; Coppieters, W.; Crews, D.; Neto, E.; Gill, C.A.; Gao, C.; et al. Whole genome linkage disequilibrium maps in cattle. BMC Genet. 2007, 8, 74. [Google Scholar] [CrossRef] [PubMed]
  8. Hayes, B.J.; Bowman, P.J.; Chamberlain, A.J.; Goddard, M.E. Invited review: Genomic selection in dairy cattle: Progress and challenges. J. Dairy Sci. 2009, 92, 433–443. [Google Scholar] [CrossRef] [PubMed]
  9. De Roos, A.P.W.W.; Hayes, B.J.; Spelman, R.J.; Goddard, M.E. Linkage disequilibrium and persistence of phase in Holstein-Friesian, Jersey and Angus cattle. Genetics 2008, 179, 1503–1512. [Google Scholar] [CrossRef] [PubMed]
  10. Makina, S.O.; Taylor, J.F.; Van Marle-Köster, E.; Muchadeyi, F.C.; Makgahlela, M.L.; MacNeil, M.D.; Maiwashe, A. Extent of Linkage Disequilibrium and Effective Population Size in Four South African Sanga Cattle Breeds. Front. Genet. 2015, 6, 337. [Google Scholar] [CrossRef] [PubMed]
  11. Grossi, D.A.; Jafarikia, M.; Brito, L.F.; Buzanskas, M.E.; Sargolzaei, M.; Schenkel, F.S. Genetic diversity, extent of linkage disequilibrium and persistence of gametic phase in Canadian pigs. BMC Genet. 2017, 18, 6. [Google Scholar] [CrossRef] [PubMed]
  12. National Bureau of Statistics of China. China Statistical Yearbook; National Bureau of Statistics of China: Beijing, China, 2017; ISBN 0106279181.
  13. Cañas-Álvarez, J.J.; Mouresan, E.F.; Varona, L.; Díaz, C.; Molina, A.; Baro, J.A.; Altarriba, J.; Carabaño, M.J.; Casellas, J.; Piedrafita, J. Linkage disequilibrium, persistence of phase, and effective population size in Spanish local beef cattle breeds assessed through a high-density single nucleotide polymorphism chip. J. Anim. Sci. 2016, 94, 2779–2788. [Google Scholar] [CrossRef] [PubMed]
  14. Biegelmeyer, P.; Gulias-Gomes, C.C.; Caetano, A.R.; Steibel, J.P.; Cardoso, F.F. Linkage disequilibrium, persistence of phase and effective population size estimates in Hereford and Braford cattle. BMC Genet. 2016, 17, 32. [Google Scholar] [CrossRef] [PubMed]
  15. Karimi, K.; Esmailizadeh Koshkoiyeh, A.; Gondro, C. Comparison of linkage disequilibrium levels in Iranian indigenous cattle using whole genome SNPs data. J. Anim. Sci. Technol. 2015, 57, 47. [Google Scholar] [CrossRef] [PubMed]
  16. Lee, S.H.; Cho, Y.M.; Lim, D.; Kim, H.C.; Choi, B.H.; Park, H.S.; Kim, O.H.; Kim, S.; Kim, T.H.; Yoon, D.; et al. Linkage disequilibrium and effective population size in Hanwoo Korean cattle. Asian-Australas. J. Anim. Sci. 2011, 34, 1660–1665. [Google Scholar] [CrossRef]
  17. Khatkar, M.S.; Nicholas, F.W.; Collins, A.R.; Zenger, K.R.; Cavanagh, J.A.L.L.; Barris, W.; Schnabel, R.D.; Taylor, J.F.; Raadsma, H.W. Extent of genome-wide linkage disequilibrium in Australian Holstein-Friesian cattle based on a high-density SNP panel. BMC Genom. 2008, 9, 187. [Google Scholar] [CrossRef] [PubMed]
  18. Hartigan, J.A.; Wong, M.A. Algorithm AS 136: A K-Means Clustering Algorithm. Appl. Stat. 1979, 28, 100–108. [Google Scholar] [CrossRef]
  19. Jombart, T.; Ahmed, I. adegenet 1.3-1: New tools for the analysis of genome-wide SNP data. Bioinformatics 2011, 27, 3070–3071. [Google Scholar] [CrossRef] [PubMed]
  20. Purcell, S.; Neale, B.; Todd-Brown, K.; Thomas, L.; Ferreira, M.A.R.; Bender, D.; Maller, J.; Sklar, P.; de Bakker, P.I.W.; Daly, M.J.; et al. PLINK: A Tool Set for Whole-Genome Association and Population-Based Linkage Analyses. Am. J. Hum. Genet. 2007, 81, 559–575. [Google Scholar] [CrossRef] [PubMed] [Green Version]
  21. Badke, Y.M.; Bates, R.O.; Ernst, C.W.; Schwab, C.; Steibel, J.P. Estimation of linkage disequilibrium in four US pig breeds. BMC Genom. 2012, 13, 24. [Google Scholar] [CrossRef] [PubMed]
  22. Gabriel, S.B.; Schaffner, S.F.; Nguyen, H.; Moore, J.M.; Roy, J.; Blumenstiel, B.; Higgins, J.; DeFelice, M.; Lochner, A.; Faggart, M.; et al. The structure of haplotype blocks in the human genome. Science 2002, 296, 2225–2229. [Google Scholar] [CrossRef] [PubMed]
  23. Qin, Z.H.S.; Niu, T.H.; Liu, J.S.S. Partition-ligation-expectation-maximization algorithm for haplotype inference with single-nucleotide polymorphisms. Am. J. Hum. Genet. 2002, 71, 1242–1247. [Google Scholar] [CrossRef] [PubMed]
  24. Tenesa, A.; Navarro, P.; Hayes, B.J.; Duffy, D.L.; Clarke, G.M.; Goddard, M.E.; Visscher, P.M. Recent human effective population size estimated from linkage disequilibrium. Genome Res. 2007, 17, 520–526. [Google Scholar] [CrossRef] [PubMed] [Green Version]
  25. Gautier, M.; Faraut, T.; Moazami-Goudarzi, K.; Navratil, V.; Foglio, M.; Grohs, C.; Boland, A.; Garnier, J.G.; Boichard, D.; Lathrop, G.M.; et al. Genetic and haplotypic structure in 14 European and African cattle breeds. Genetics 2007, 177, 1059–1070. [Google Scholar] [CrossRef] [PubMed]
  26. Sved, J.A. Linkage disequilibrium and homozygosity of chromosome segments in finite populations. Theor. Popul. Biol. 1971, 2, 125–141. [Google Scholar] [CrossRef]
  27. R Core Team R Development Core Team. R: A Language and Environment for Statistical Computing; R Core Team: Vienna, Austria, 2017; Volume Voulme 55, pp. 275–286. [Google Scholar]
  28. Porto-Neto, L.R.; Kijas, J.W.; Reverter, A. The extent of linkage disequilibrium in beef cattle breeds using high-density SNP genotypes. Genet. Sel. Evol. 2014, 46, 22. [Google Scholar] [CrossRef] [PubMed] [Green Version]
  29. Saatchi, M.; McClure, M.C.; McKay, S.D.; Rolf, M.M.; Kim, J.; Decker, J.E.; Taxis, T.M.; Chapple, R.H.; Ramey, H.R.; Northcutt, S.L.; et al. Accuracies of genomic breeding values in American Angus beef cattle using K-means clustering for cross-validation. Genet. Sel. Evol. 2011, 43, 40. [Google Scholar] [CrossRef] [PubMed] [Green Version]
  30. Chen, N.; Cai, Y.; Chen, Q.; Li, R.; Wang, K.; Huang, Y.; Hu, S.; Huang, S.; Zhang, H.; Zheng, Z.; et al. Whole-genome resequencing reveals world-wide ancestry and adaptive introgression events of domesticated cattle in East Asia. Nat. Commun. 2018, 9, 2337. [Google Scholar] [CrossRef] [PubMed]
  31. Gao, Y.; Gautier, M.; Ding, X.; Zhang, H.; Wang, Y.; Wang, X.; Omar Faruque, M.D.; Li, J.; Ye, S.; Gou, X.; et al. Species composition and environmental adaptation of indigenous Chinese cattle. Sci. Rep. 2017, 7. [Google Scholar] [CrossRef] [PubMed]
  32. Yang, L.; Xu, L.; Zhu, B.; Niu, H.; Zhang, W.; Miao, J.; Shi, X.; Zhang, M.; Chen, Y.; Zhang, L.; et al. Genome-wide analysis reveals differential selection involved with copy number variation in diverse Chinese Cattle. Sci. Rep. 2017, 7, 14299. [Google Scholar] [CrossRef] [PubMed] [Green Version]
  33. Pryce, J.E.E.; Gredler, B.; Bolormaa, S.; Bowman, P.J.J.; Egger-Danner, C.; Fuerst, C.; Emmerling, R.; Sölkner, J.; Goddard, M.E.E.; Hayes, B.J.J. Short communication: Genomic selection using a multi-breed, across-country reference population. J. Dairy Sci. 2011, 94, 2625–2630. [Google Scholar] [CrossRef] [PubMed]
  34. Qwabe, S.O.; vanMarle-Köster, E.; Maiwashe, A.; Muchadeyi, F.C. Evaluation of the bovineSNP50 genotyping array in four south african cattle populations. S. Afr. J. Anim. Sci. 2013, 43, 64–67. [Google Scholar]
  35. Sudrajad, P.; Seo, D.W.; Choi, T.J.; Park, B.H.; Roh, S.H.; Jung, W.Y.; Lee, S.S.; Lee, J.H.; Kim, S.; Lee, S.H. Genome-wide linkage disequilibrium and past effective population size in three Korean cattle breeds. Anim. Genet. 2017, 48, 85–89. [Google Scholar] [CrossRef] [PubMed]
  36. Lu, D.; Sargolzaei, M.; Kelly, M.; Li, C.; Voort, G.V.; Wang, Z.; Plastow, G.; Moore, S.; Miller, S.P. Linkage disequilibrium in Angus, Charolais, and Crossbred beef cattle. Front. Genet. 2012, 3, 152. [Google Scholar] [CrossRef] [PubMed]
  37. Edea, Z.; Dadi, H.; Kim, S.W.; Park, J.H.; Shin, G.H.; Dessie, T.; Kim, K.S. Linkage disequilibrium and genomic scan to detect selective loci in cattle populations adapted to different ecological conditions in Ethiopia. J. Anim. Breed. Genet. 2014, 131. [Google Scholar] [CrossRef] [PubMed]
  38. Decker, J.E.; Vasco, D.A.; McKay, S.D.; McClure, M.C.; Rolf, M.M.; Kim, J.W.; Northcutt, S.L.; Bauck, S.; Woodward, B.W.; Schnabel, R.D.; et al. A novel analytical method, Birth Date Selection Mapping, detects response of the Angus (Bos taurus) genome to selection on complex traits. BMC Genom. 2012, 13, 606. [Google Scholar] [CrossRef] [PubMed]
  39. Sargolzaei, M.; Schenkel, F.S.; Jansen, G.B.; Schaeffer, L.R. Extent of Linkage Disequilibrium in Holstein Cattle in North America. J. Dairy Sci. 2008, 91, 2106–2117. [Google Scholar] [CrossRef] [PubMed]
  40. McClure, M.C.; Morsci, N.S.; Schnabel, R.D.; Kim, J.W.; Yao, P.; Rolf, M.M.; McKay, S.D.; Gregg, S.J.; Chapple, R.H.; Northcutt, S.L.; et al. A genome scan for quantitative trait loci influencing carcass, post-natal growth and reproductive traits in commercial Angus cattle. Anim. Genet. 2010, 41, 597–607. [Google Scholar] [CrossRef] [PubMed]
  41. Lindholm-Perry, A.K.; Sexten, A.K.; Kuehn, L.A.; Smith, T.P.L.; King, D.A.; Shackelford, S.D.; Wheeler, T.L.; Ferrell, C.L.; Jenkins, T.G.; Snelling, W.M.; et al. Association, effects and validation of polymorphisms within the NCAPG—LCORL locus located on BTA6 with feed intake, gain, meat and carcass traits in beef cattle. BMC Genet. 2011. [Google Scholar] [CrossRef] [PubMed]
  42. Snelling, W.M.; Allan, M.F.; Keele, J.W.; Kuehn, L.A.; Thallman, R.M.; Bennett, G.L.; Ferrell, C.L.; Jenkins, T.G.; Freetly, H.C.; Nielsen, M.K.; et al. Partial-genome evaluation of postweaning feed intake and efficiency of crossbred beef cattle. J. Anim. Sci. 2011, 89, 1731–1741. [Google Scholar] [CrossRef] [PubMed]
  43. Ardlie, K.G.; Kruglyak, L.; Seielstad, M. Patterns of linkage disequilibrium in the human genome. Nat. Rev. Genet. 2002, 3, 299–309. [Google Scholar] [CrossRef] [PubMed]
  44. Hayes, B.J.; Lien, S.; Nilsen, H.; Olsen, H.G.; Berg, P.; Maceachern, S.; Potter, S.; Meuwissen, T.H.E. The origin of selection signatures on bovine chromosome 6. Anim. Genet. 2008, 39, 105–111. [Google Scholar] [CrossRef] [PubMed]
  45. Meuwissen, T.H.E.; Hayes, B.J.; Goddard, M.E. Prediction of total genetic value using genome-wide dense marker maps. Genetics 2001, 157, 1819–1829. [Google Scholar] [PubMed]
  46. Villa-Angulo, R.; Matukumalli, L.K.; Gill, C.A.; Choi, J.; Van Tassell, C.P.; Grefenstette, J.J. High-resolution haplotype block structure in the cattle genome. BMC Genet. 2009, 10, 19. [Google Scholar] [CrossRef] [PubMed]
  47. Mokry, F.B.; Buzanskas, M.E.; de Alvarenga Mudadu, M.; do Amaral Grossi, D.; Higa, R.H.; Ventura, R.V.; de Lima, A.O.; Sargolzaei, M.; Meirelles, S.L.C.; Schenkel, F.S.; et al. Linkage disequilibrium and haplotype block structure in a composite beef cattle breed. BMC Genom. 2014, 15, S6. [Google Scholar] [CrossRef] [PubMed] [Green Version]
  48. Caballero, A.; Toro, M.A.; López-Fanjul, C. The response to artificial selection from new mutations in Drosophila melanogaster. Genetics 1991, 128, 89–102. [Google Scholar] [PubMed]
  49. Wang, J. Estimation of effective population sizes from data on genetic markers. Philos. Trans. R. Soc. Lond. B Biol. Sci. 2005, 360, 1395–1409. [Google Scholar] [CrossRef] [PubMed] [Green Version]
  50. Hill, W.G. Estimation of effective population size from data on linkage disequilibrium. Genet. Res. 1981, 38, 209–216. [Google Scholar] [CrossRef]
  51. Nomura, T.; Honda, T.; Mukai, F. Inbreeding and effective population size of Japanese Black cattle. J. Anim. Sci. 2001, 79, 366–370. [Google Scholar] [CrossRef] [PubMed]
  52. Uimari, P.; Tapio, M. Extent of linkage disequilibrium and effective population size in finnish landrace and finnish yorkshire pig breeds. J. Anim. Sci. 2011, 89, 609–614. [Google Scholar] [CrossRef] [PubMed]
Figure 1. Principal component decomposition analysis of the genomic relationship in 12 cattle populations, each individual was colored by groups (PC1 and PC2 explain 12.92% and 4.97% of the proportion of variance, respectively).
Animals 09 00083 g001
Figure 2. Distribution of allele frequencies in different groups. North Chinese cattle (NCC), South Chinese cattle (SCHC), Southwest Chinese cattle (SWC), Simmental (SIM), and Wagyu (WAG).
Animals 09 00083 g002
Figure 3. Linkage disequilibrium (LD) decay by distance across the studied groups. North Chinese cattle (NCC), South Chinese cattle (SCHC), Southwest Chinese cattle (SWC), Simmental (SIM) and Wagyu (WAG).
Animals 09 00083 g003
Figure 4. Box plots of haploblock size in different groups. North Chinese cattle (NCC), South Chinese cattle (SCHC), Southwest Chinese cattle (SWC), Simmental (SIM), and Wagyu (WAG).
Animals 09 00083 g004
Figure 5. Genome-wide estimates of historical effective population size (Ne) over the past generations based on estimates of linkage disequilibrium.
Animals 09 00083 g005
Figure 6. Correlation of allele phase by physical distance. North Chinese cattle (NCC), South Chinese cattle (SCHC), Southwest Chinese cattle (SWC), Simmental (SIM), and Wagyu (WAG).
Animals 09 00083 g006
Table 1. Summary statistics for haploblocks across cattle groups.
GroupsNCCSCHCSWCSIMWAG
Blocks (n)88,82961,24186,95772,28768,627
Total block length a (Mb)1237.49933.961111.531597.171358.55
Mean block length (kb)13.9315.2512.7822.0919.8
SNP% in blocks74.55%57.88%63.98%86.67%80.68%
Coverage rate of autosomes47.59%35.92%42.75%61.43%52.25%
Mean num of SNPs in blocks5.294.454.647.166.4
Max num of SNPs in blocks14512299225162
a Cumulative length of detected haplotype blocks.
Table 2. Effective population size (Ne) over the past generations based on linkage disequilibrium.
Number of Generations AgoNCCSCHCSWCSIMWAGAverage
1342731431430
516312914917852134
1030824128426087236
25710525625448194500
5013078541022705366851
75172698111898695001053
10021981099137010836731285
1252204948124310777531245
250252110861499132911211511
500256913671895147614221746
1000271019122517165816962099
North Chinese cattle (NCC), South Chinese cattle (SCHC), Southwest Chinese cattle (SWC), Simmental (SIM), and Wagyu (WAG).

