The Pattern of Superficial Body Temperatures in Leisure Horses Lunged with Commonly Used Lunging Aids

 ,
,
Simple Summary
Abstract
1. Introduction
2. Materials and Methods
3. Results
4. Discussion
5. Conclusions
Author Contributions
Funding
Acknowledgments
Conflicts of Interest
References
- Petsche, V.M.; Derksen, F.J.; Berney, C.E.; Robinson, N.E. Effect of Head position on upper airway function in exercising horses. Equine Vet. J. 1995, 27, 18–22. [Google Scholar] [CrossRef]
- Kienapfel, K.; Link, Y.; van Borstel, U.K. Prevalence of different head-neck positions in horses shown at dressage competitions and their relation to conflict behavior and performance marks. PLoS ONE 2014, 9, e103140. [Google Scholar] [CrossRef] [PubMed]
- Rhodin, M.; Johnston, C.; Roethlisberger, K.; Wennerstrand, J.; Drevemo, S. The influence of head and neck position on kinematics of the back in ridden horses at the walk and trot. Equine Vet. J. 2005, 37, 7–11. [Google Scholar] [CrossRef] [PubMed]
- Becker-Birck, M.; Schmidt, A.; Wulf, M.; Aurich, J.; von der Wense, A.; Mostl, E.; Berz, R.; Aurich, C. Cortisol release, heart rate and heart rate variability, and superficial body temperature, in horses lunged either with hyperflexion of the neck or with an extended head and neck position. JAPAN 2013, 97, 322–330. [Google Scholar] [CrossRef] [PubMed]
- Biau, S.; Couve, O.; Lemaire, S.; Barrey, E. The effect of reins on kinetic variables of locomotion. Equine Vet. J. Suppl. 2012, 34, 359–362. [Google Scholar] [CrossRef] [PubMed]
- Gómez-Alvarez, C.B.; Rhodin, M.; Bobber, M.F.; Meyer, H.; Weishaupt, M.A.; Johnston, C.; Van Weeren, P.R. The effect of head and neck position on the thoracolumbar kinematics in the unridden horse. Equine Vet. J. 2006, 36, 445–451. [Google Scholar] [CrossRef]
- Clayton, H.M.; Kaiser, L.J.; Lavaginino, M.; Stubbs, N.C. Evaluation of intersegmental vertebral motion during performance of dynamic mobilization exercises in cervical lateral bending in horses. Am. J. Vet. Res. 2012, 73, 1153–1159. [Google Scholar] [CrossRef]
- Clayton, H.M.; Larson, B.; Kaiser, L.J.; Lavagnino, M. Length and elasticity of side reins affect rein tension at trot. Vet. J. 2011, 188, 291–294. [Google Scholar] [CrossRef]
- Daly, J. Recreation and Sport Planning and Design; Human Kinetics: Champaign, IL, USA, 2000; pp. 1825–5076. [Google Scholar]
- Janczarek, I.; Wilk, I. Leisure riding horses: Research topics versus the needs of stakeholders. Anim. Sci. J. 2017, 88, 953–958. [Google Scholar] [CrossRef]
- Blokhuis, M.Z.; Lundgren, C. Riders’ Perceptions of Equestrian Communication in Sports Dressage. Soc. Anim. 2017, 25, 573–591. [Google Scholar] [CrossRef]
- Evans, G.P.; Behiri, J.C.; Vaughan, L.C.; Bonfield, W. The response of equine cortical bone to loading at strains rates experienced in vivo by the galloping horse. Equine Vet. J. 1992, 24, 125–128. [Google Scholar] [CrossRef] [PubMed]
- Sleutjens, J.; Smiet, E.; van Weeren, R.; van der Kolk, J.; Back, W.; Wijnberg, I.D. Effect of head and neck position on intrathoracic pressure and arterial blood gas values in Dutch Warmblood ridden horses during moderate exercise. Am. J. Vet. Res. 2012, 73, 522–528. [Google Scholar] [CrossRef] [PubMed]
- Arruda, T.Z.; Brass, K.E.; de la Corte, F.D. Thermographic assessment of saddles used on jumping horses. JEVS 2011, 31, 625–629. [Google Scholar] [CrossRef]
- Simon, E.L.; Gaughan, E.M.; Epp, T.; Spire, M. Influence of exercise on thermographically determined surface temperatures of thoracic and pelvic limbs in horses. JAVMA 2006, 229, 1940–1944. [Google Scholar] [CrossRef] [PubMed]
- Redaelli, V.; Bergero, D.; Zucca, E.; Ferruci, F.; Costa, L.N.; Luzi, F. Use of thermography techniques in equines: Principles and applications. JEVS 2014, 34, 345–350. [Google Scholar] [CrossRef]
- Soroko, M.; Jodkowska, E.; Zablocka, M. The use of thermography to evaluate back musculoskeletal responses of young racehorses to training. Thermol. Int. 2012, 22, 152–156. [Google Scholar]
- Purohit, R. Standards for thermal imaging in veterinary medicine. Proceedings of XIth European Congress of Thermology. Thermol. Int. 2009, 19, 99. [Google Scholar] [CrossRef]
- Moine, S.; Flammer, S.A.; de Jesus Maia-Nussbaumer, P.; Klopfenstein Bregger, M.D.; Gerber, V. Evaluation of the effects of performance dentistry on equine rideability: A randomized, blinded, controlled trial. Vet. Q. 2017, 37, 195–199. [Google Scholar] [CrossRef]
- Schmidt, A.; Aurich, J.; Mostl, E.; Muller, J.; Aurich, C. Changes in cortisol release and heart rate and heart rate variability during the initial training of three-year-old sport horses. Horm. Behav. 2010, 58, 628–636. [Google Scholar] [CrossRef]
- Wijnberg, I.D.; Sleutjens, J.; van der Kolk, J.H.; Back, W. Effect of head and neck position on outcome of quantitative neuromuscular diagnostic techniques in Warmblood ridden horses directly following moderate exercise. Equine Vet. J. 2010, 38, 261–267. [Google Scholar] [CrossRef]
- Pfau, T.; Stubbs, N.C.; Kaiser, L.J.; Brown, L.E.; Clayton, H.M. Effect of trotting speed and circle radius on movement symmetry in horses during lunging on a soft surface. Am. J. Vet. Res. 2012, 73, 1890–1899. [Google Scholar] [CrossRef] [PubMed]
- Dunbar, D.C.; Macpherson, J.M.; Simmons, R.W.; Zarcades, A. Stabilization and mobility of the head, neck and trunk in horses during overground locomotion: Comparisons with humans and other primates. J. Exp. Biol. 2008, 211, 3889–3907. [Google Scholar] [CrossRef] [PubMed]
- Manfredi, J.; Clayton, H.M.; Rosenstein, D. Radiographic study of bit position within the horses oral cavity. Equine Comp. Exerc. Physiol. 2005, 2, 195–201. [Google Scholar] [CrossRef]
- Tokuriki, M.; Aoki, O. Neck muscles activity in horses during locomotion with and without a rider. Equine Exerc. Physiol. 1991, 3, 146–150. [Google Scholar]
- Gellman, K.S.; Bertram, J.E.S. The equine nuchal ligament 2: Passive dynamic energy exchange in locomotion. Vet. Comp. Orthop. Traumatol. 2002, 15, 7–14. [Google Scholar] [CrossRef]
- Paulekas, R.; Haussler, K.K. Principles and practice of therapeutic exercise for horses. JEVS 2009, 29, 870–893. [Google Scholar] [CrossRef]
- De Cocq, P.; Van Weeren, P.R.; Back, W. Effects of girth, saddle and weight on movements of the horse. Equine Vet. J. 2004, 36, 758–763. [Google Scholar] [CrossRef]
- Rekant, S.I.; Lyons, M.A.; Pacheco, J.M.; Arzt, J.; Rodriguez, L.L. Veterinary applications of infrared thermography. Am. J. Vet. Res. 2015, 77, 98–107. [Google Scholar] [CrossRef]
- Soroko, M.; Śpitalniak-Bajerska, K.; Zaborski, D.; Poźniak, B.; Dudek, K.; Janczarek, I. Exercise-induced changes in skin temperature and blood parameters in horses. Arch. Anim. Breed. 2019, 62, 205–213. [Google Scholar] [CrossRef]
- Redaelli, V.; Luzi, F.; Mazzola, S.; Bariffi, G.D.; Zappaterra, M.; Nanni Costa, L.; Padalino, B. The Use of Infrared Thermography (IRT) as Stress Indicator in Horses Trained for Endurance: A Pilot Study. Animals 2019, 9, 84. [Google Scholar] [CrossRef]
- Fenner, K.; Yoon, S.; White, P.; Starling, M.; McGreevy, P. The effect of noseband tightening on horses’ behavior, eye temperature, and cardiac responses. PLoS ONE 2016, 11, e0154179. [Google Scholar] [CrossRef]


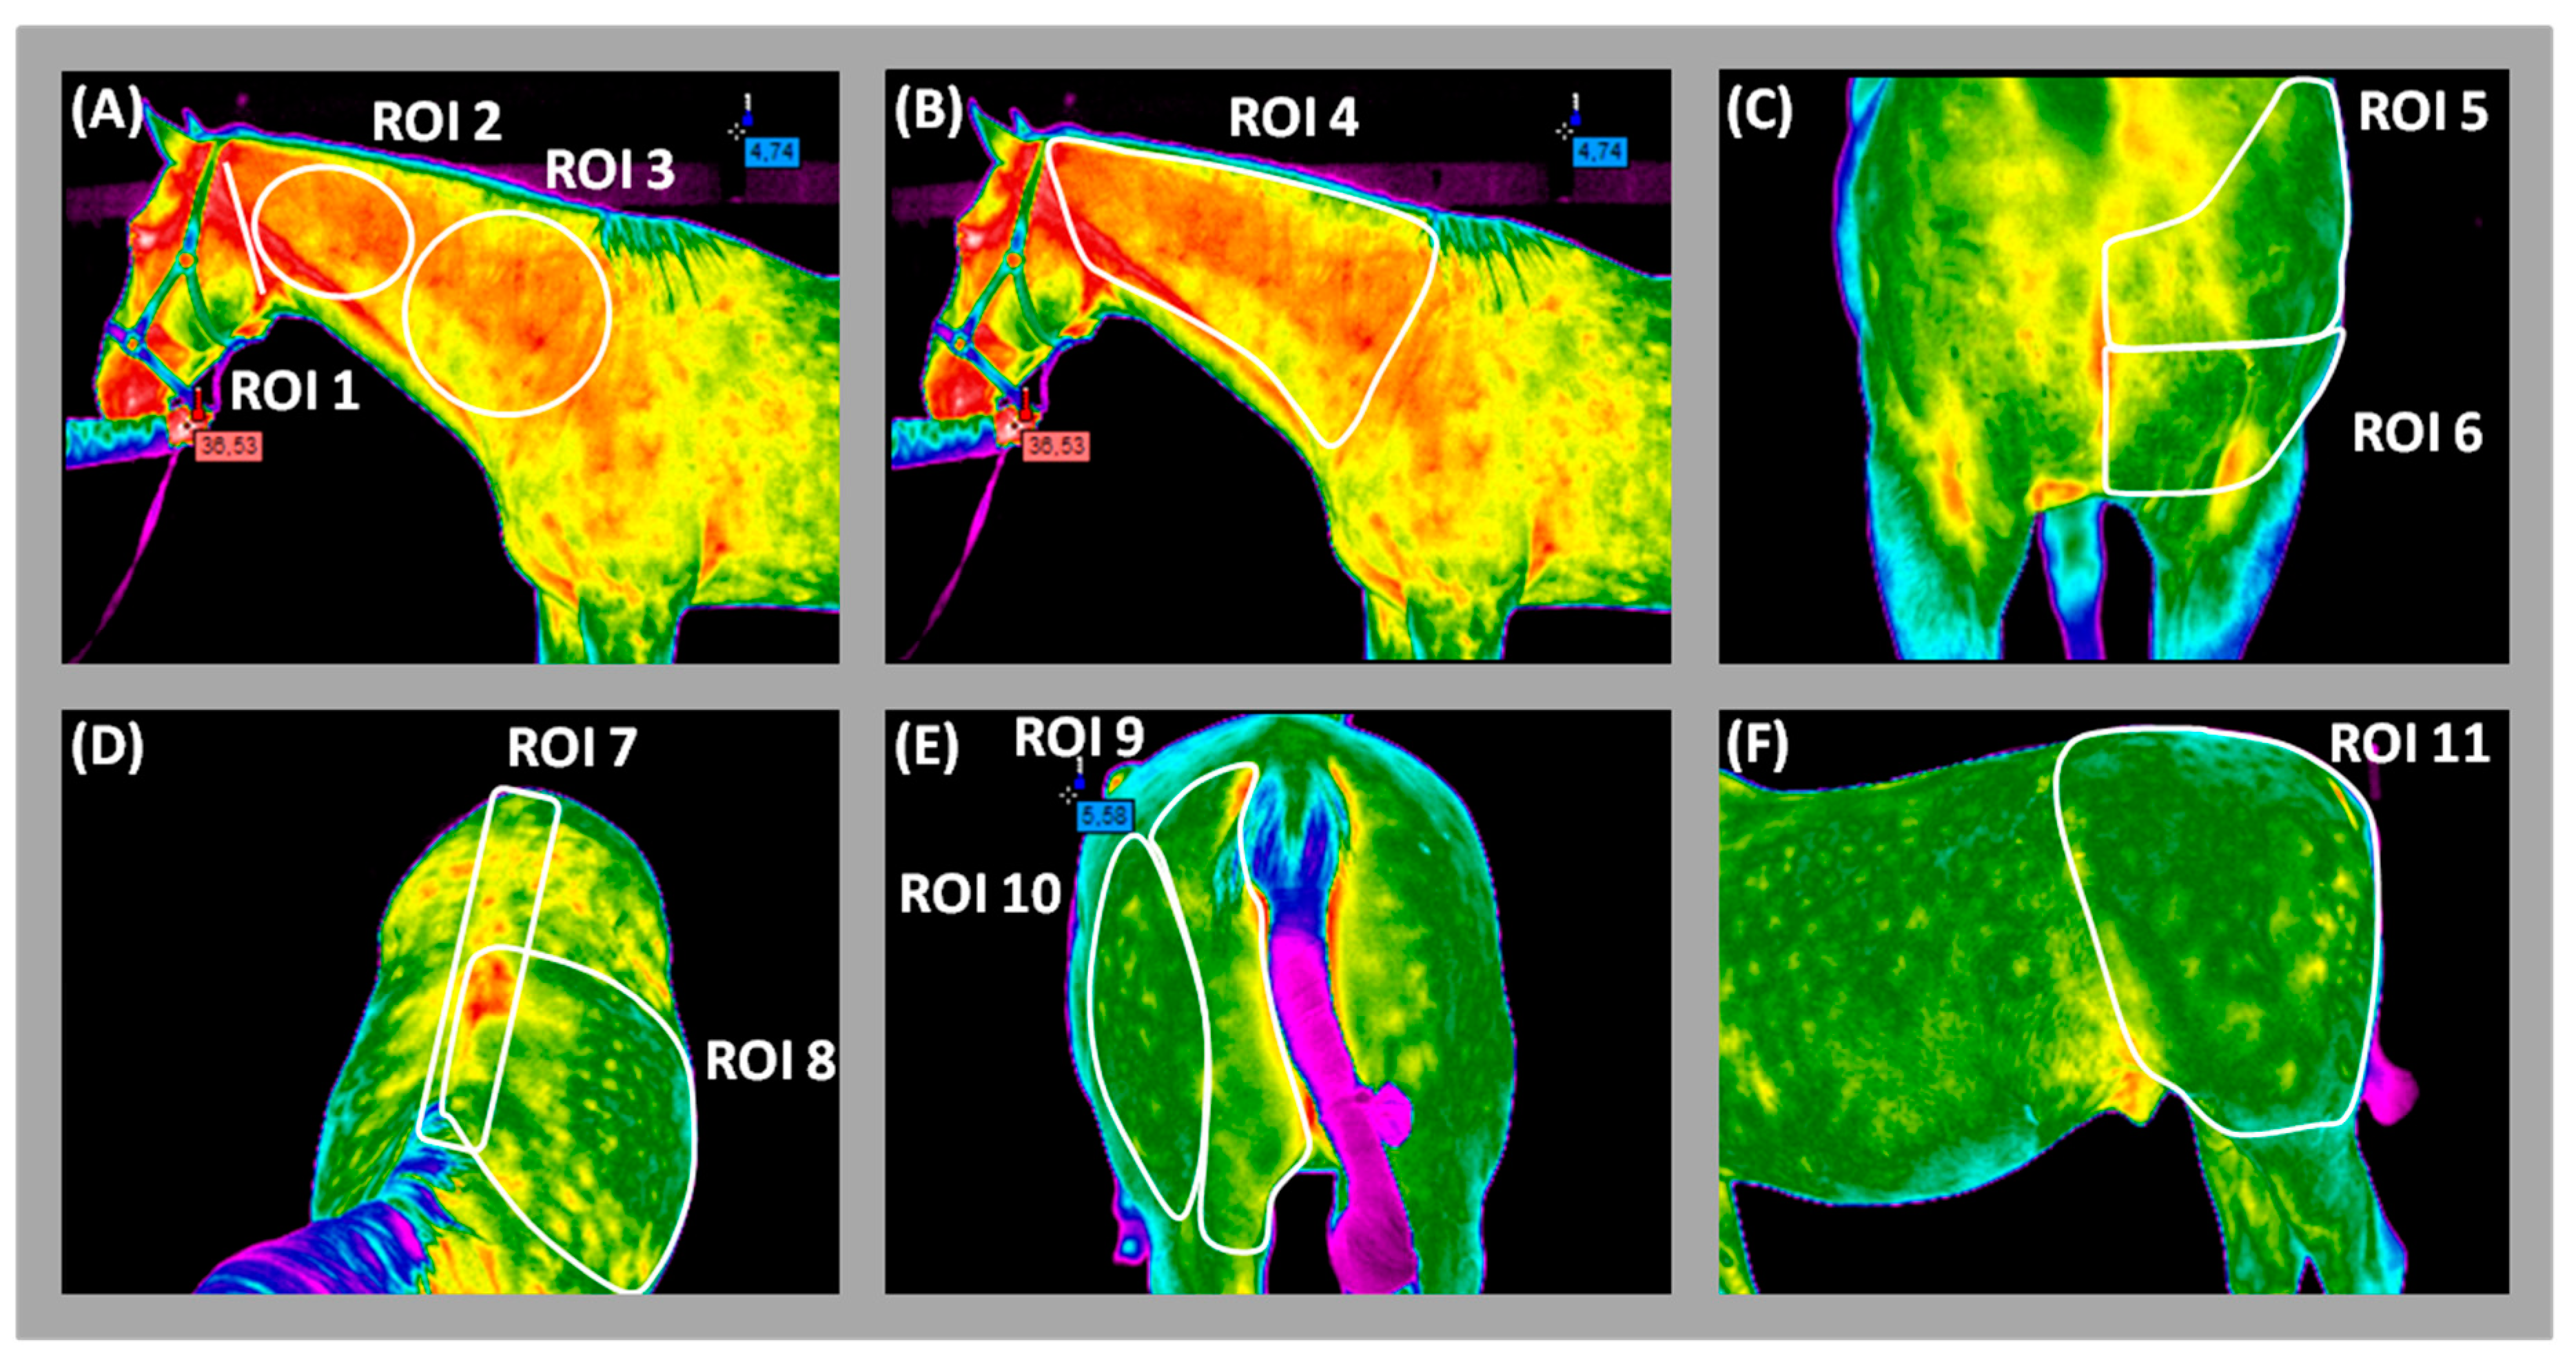
| No | Shape of ROI | Range of ROI |
|---|---|---|
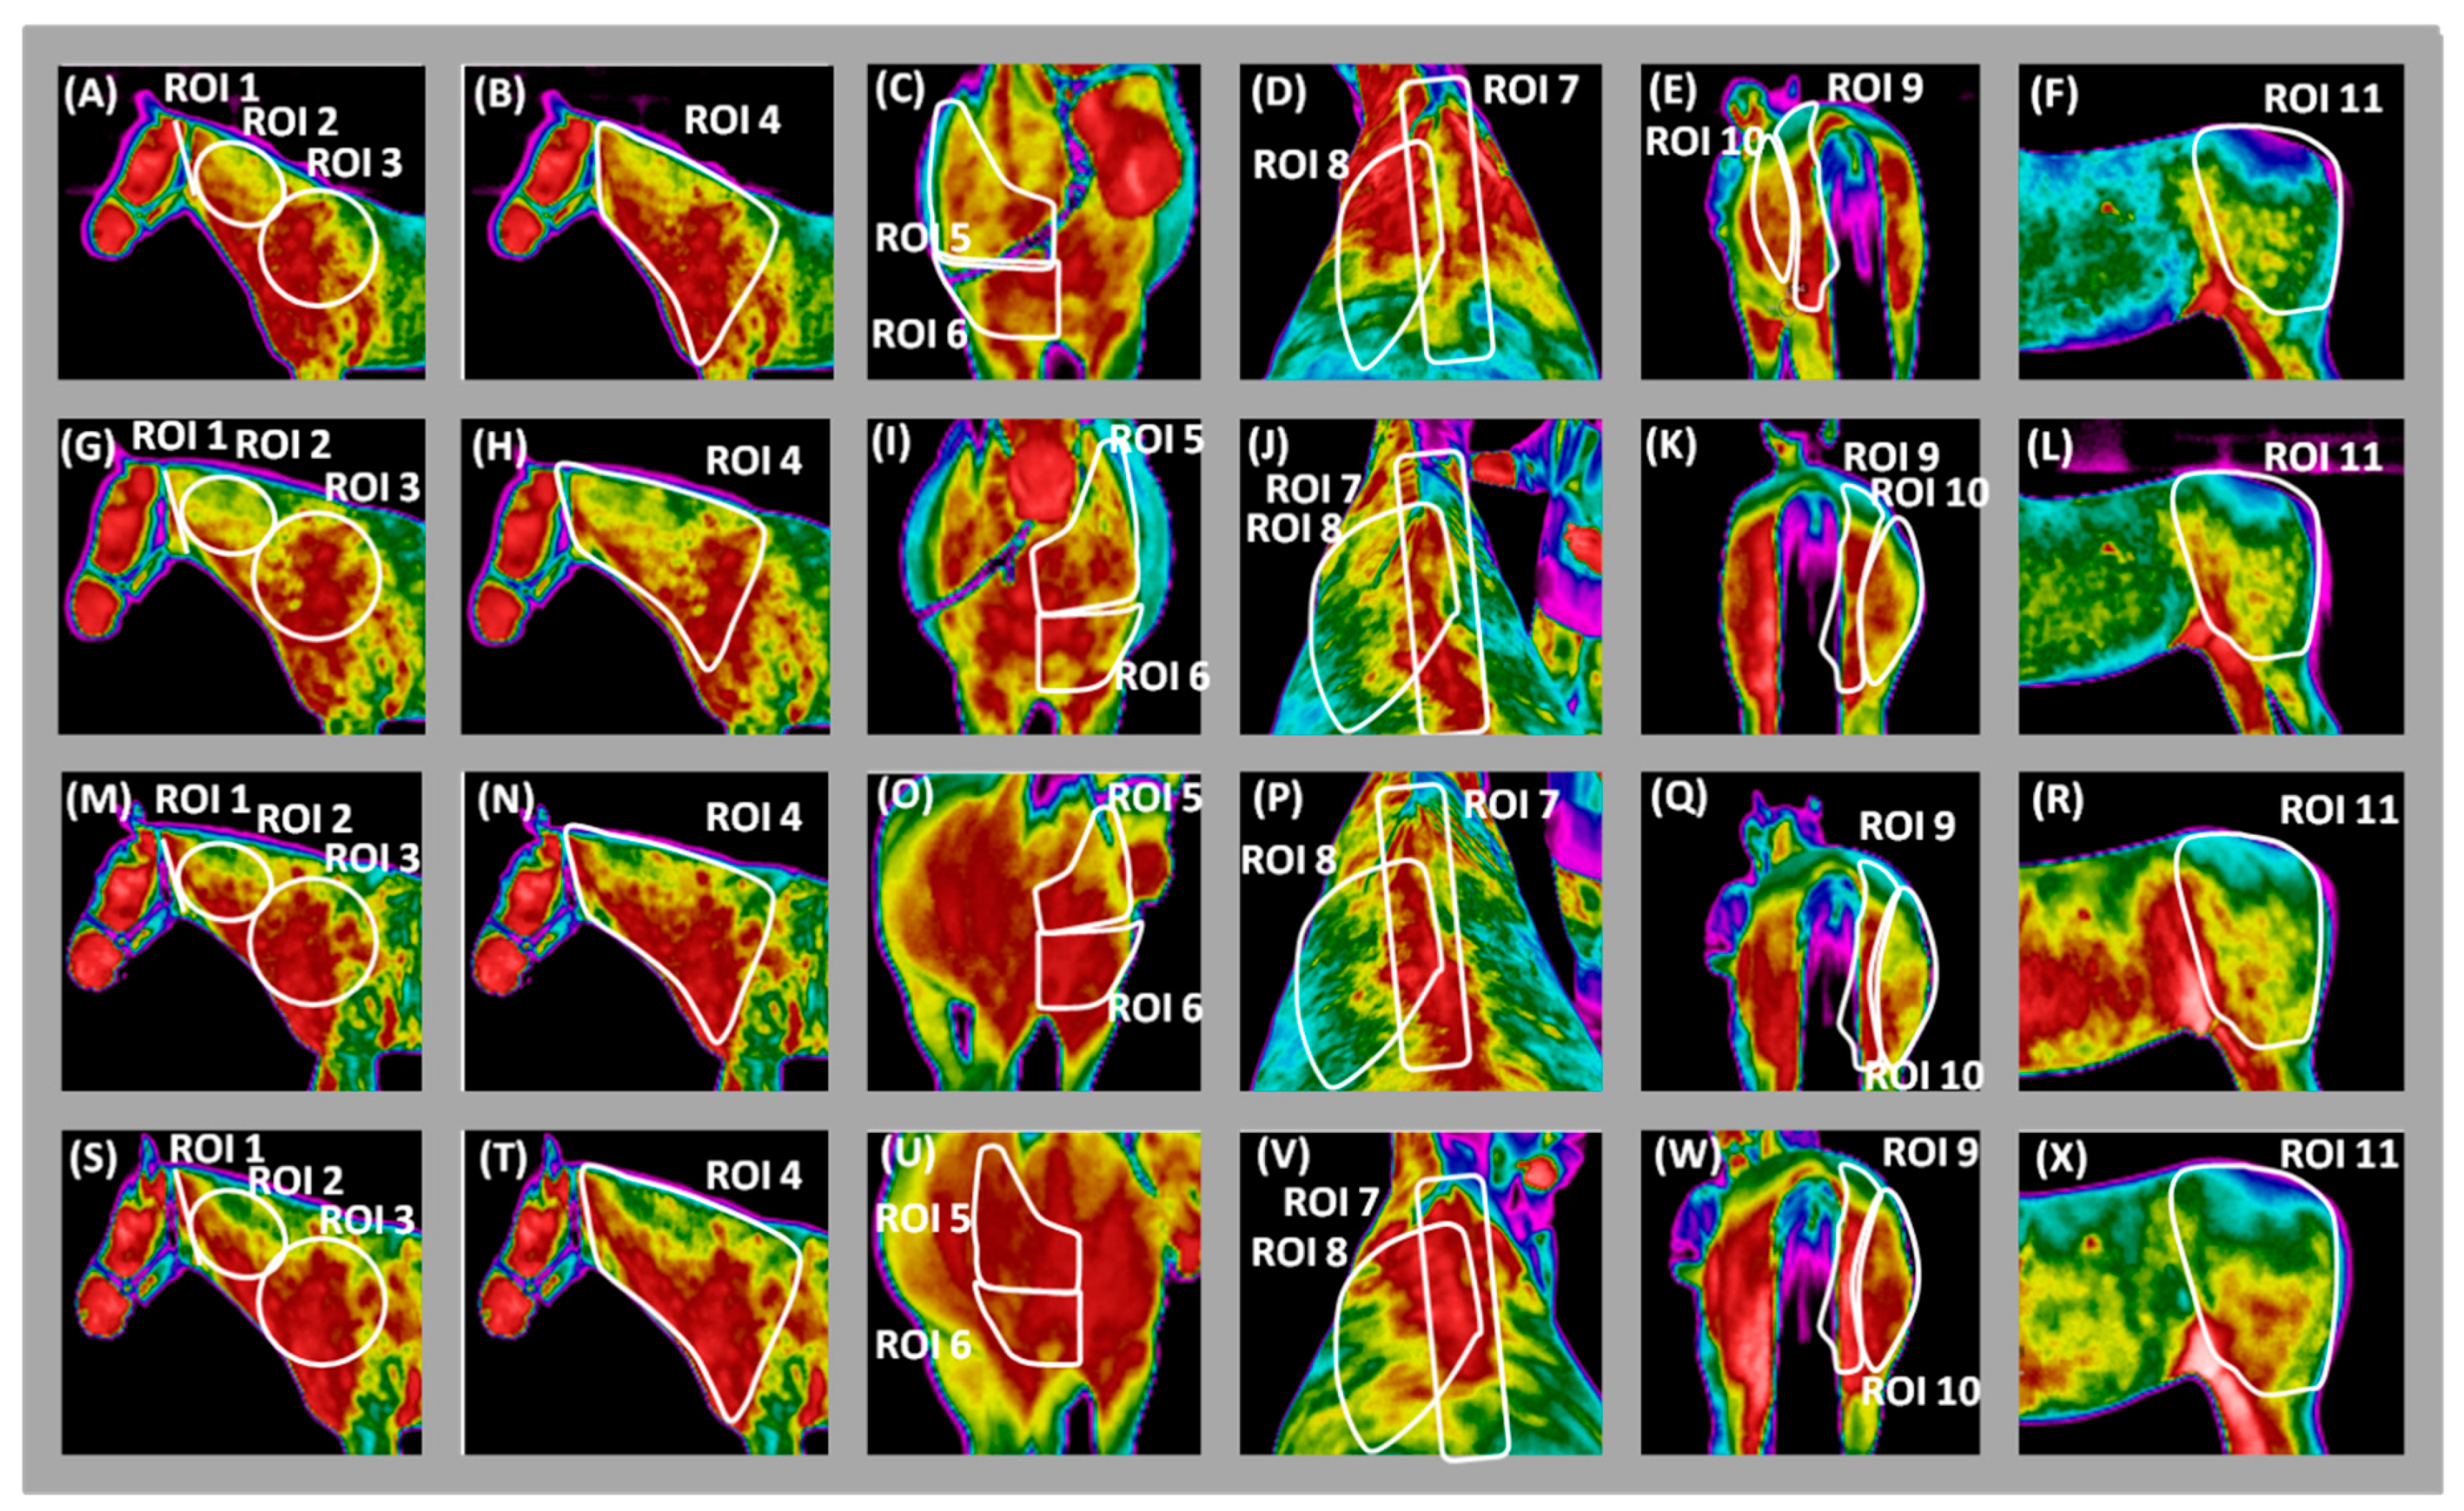
| ROI 1 | a line | from the highest point of the horses’ nape of the neck to the ventral guttural angle |
| ROI 2 | an ellipse | from the caudal aspect of the mandible to the ventral and dorsal lines of the neck |
| ROI 3 | a circle | from the cranial brim of the saddle flap onto the neck and from the height of the shoulder joint to the upper aspect of the mane |
| ROI 4 | an irregular, trapezoidal | from the line between the highest point of the neck and the ventral guttural angle to the line between the height of the shoulder joint and the highest spinous process of thoracic vertebrae, represents whole neck muscles work |
| ROI 5 | an irregular, L-shaped | from the upper half of the middle chest line, horizontally to and along the lateral, upper edge of the pectoral muscles up to the middle of the spine of scapula |
| ROI 6 | an irregular, trapezoidal | from the lower half of the middle chest line, horizontally to and along the lateral, lower edge of the pectoral muscles down to the manubrium of the sternum |
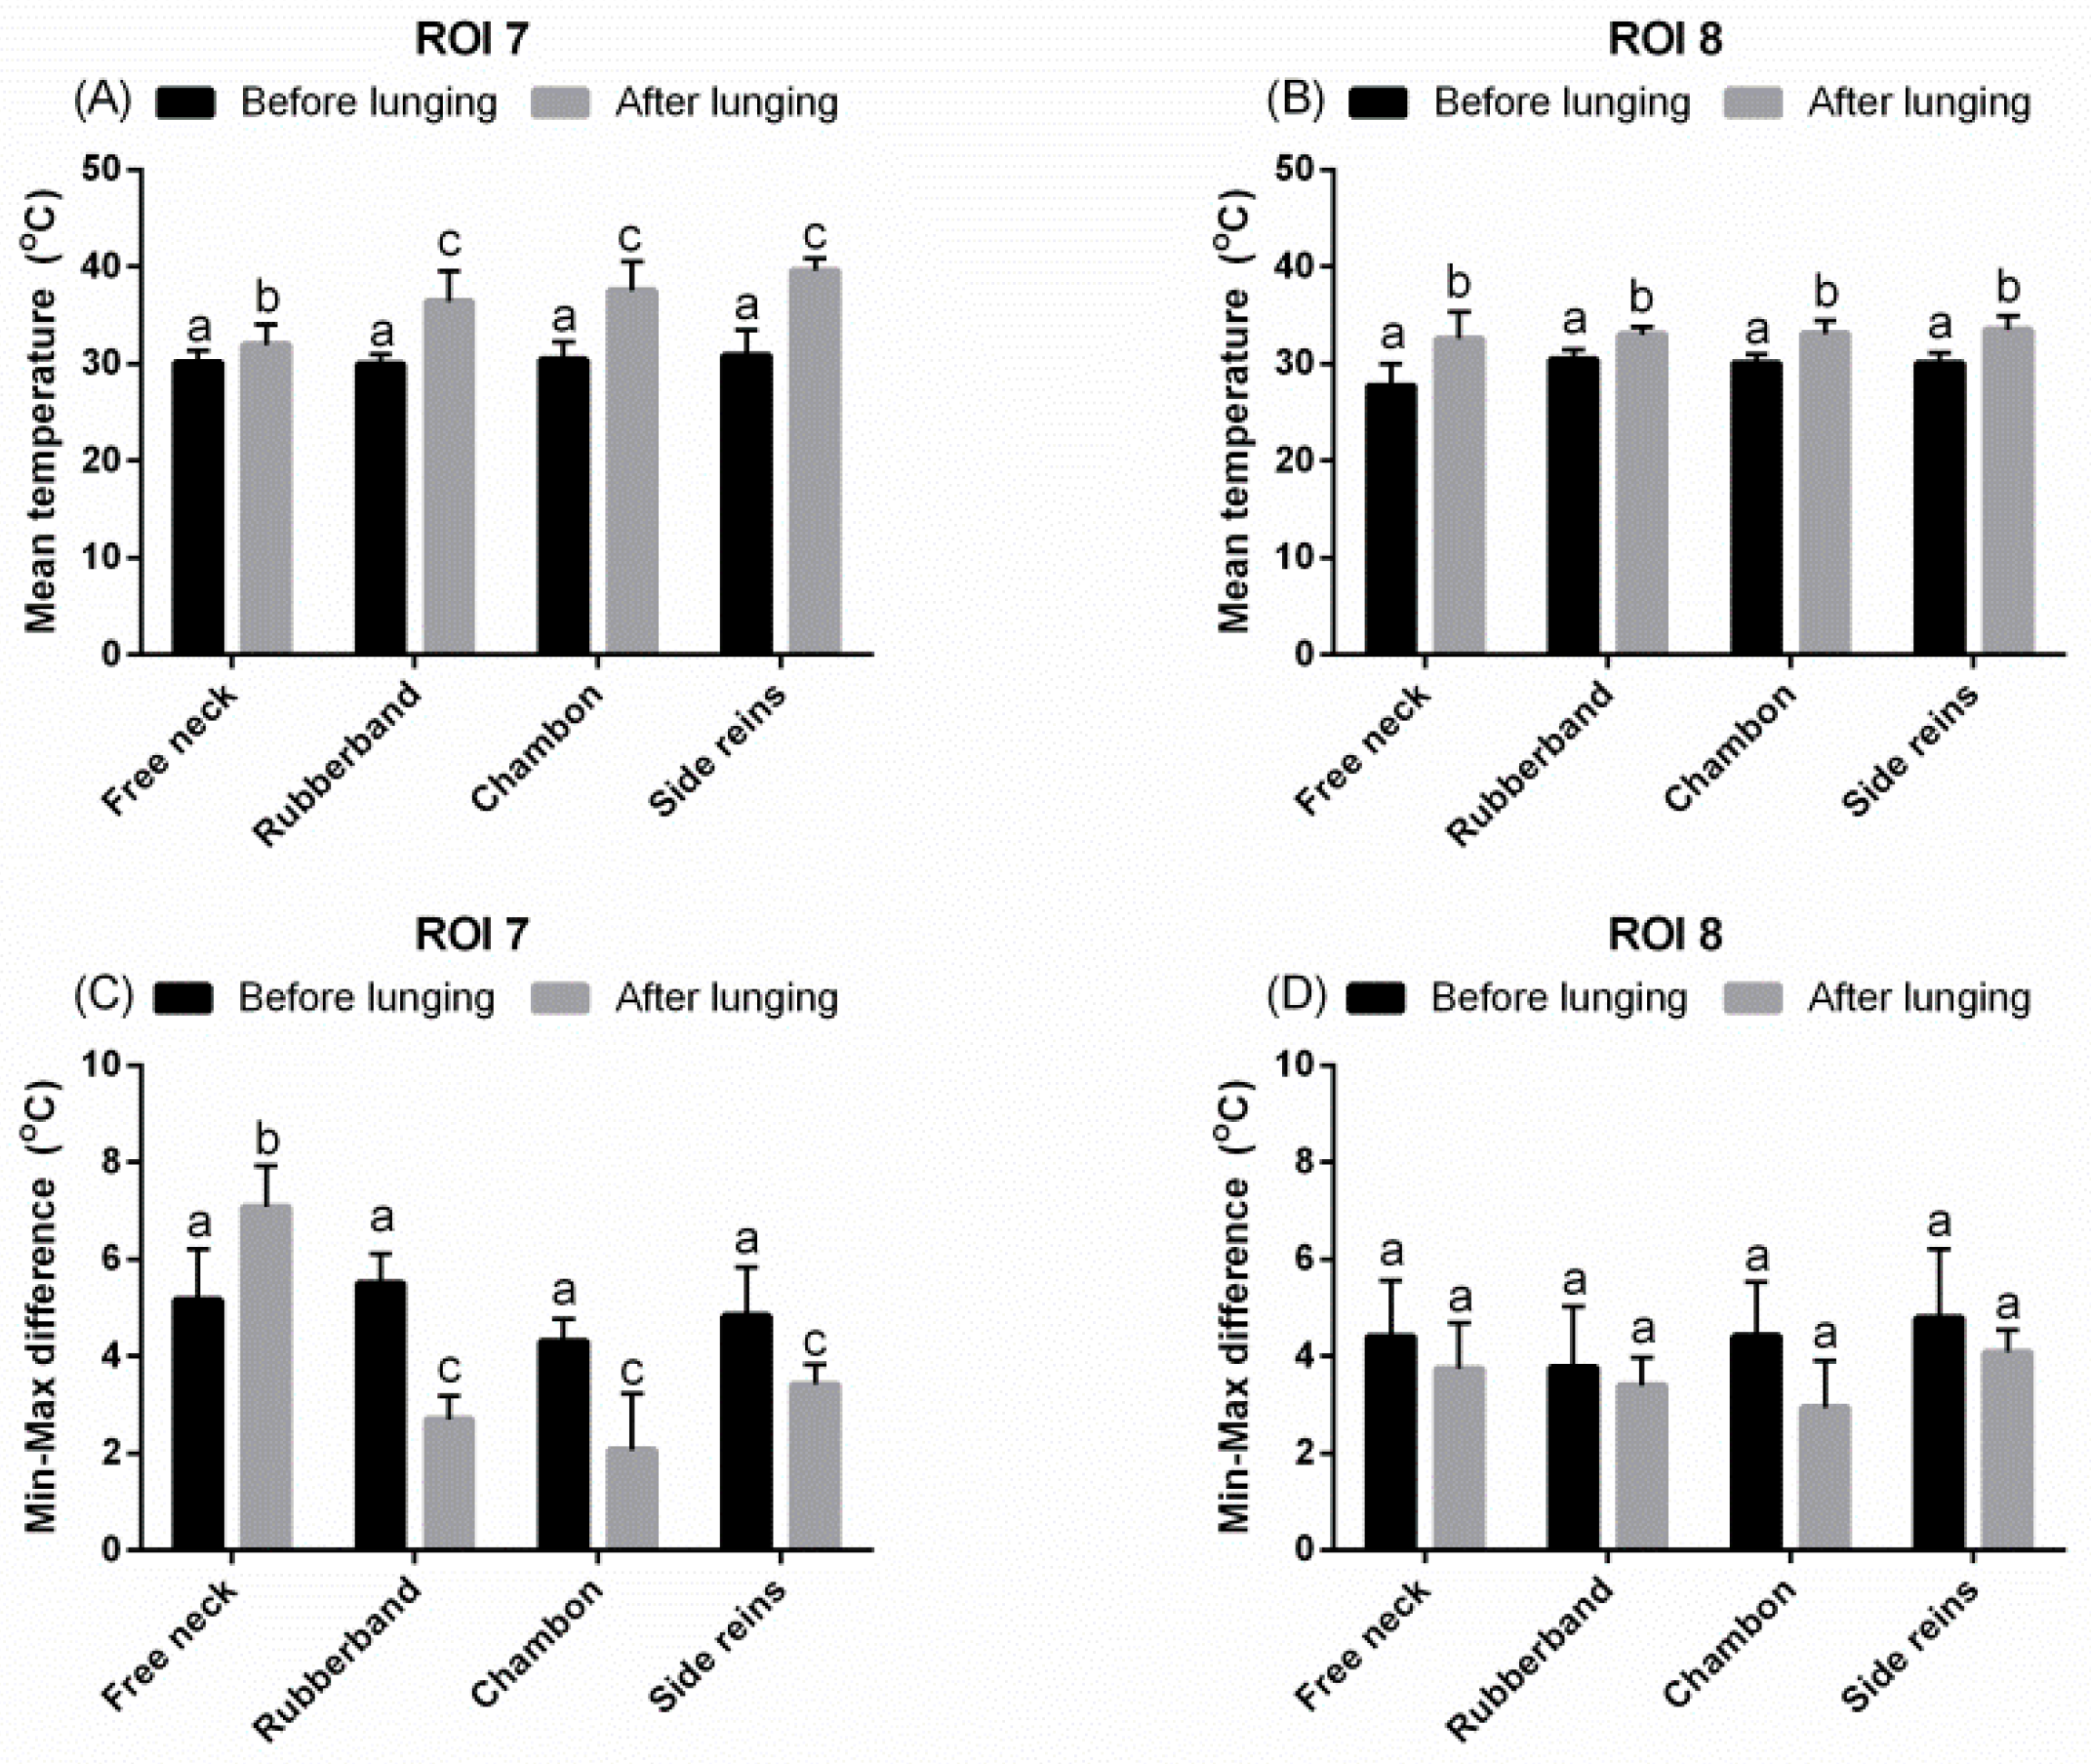
| ROI 7 | a rectangle | from the highest spinous process of thoracic vertebrae to the last sacral vertebrae |
| ROI 8 | an irregular, barrel-shaped | from the middle of thoracic vertebrae along the last rib to the widest line of the chest and up to the highest spinous process of thoracic vertebrae along the caudal edge of the scapula |
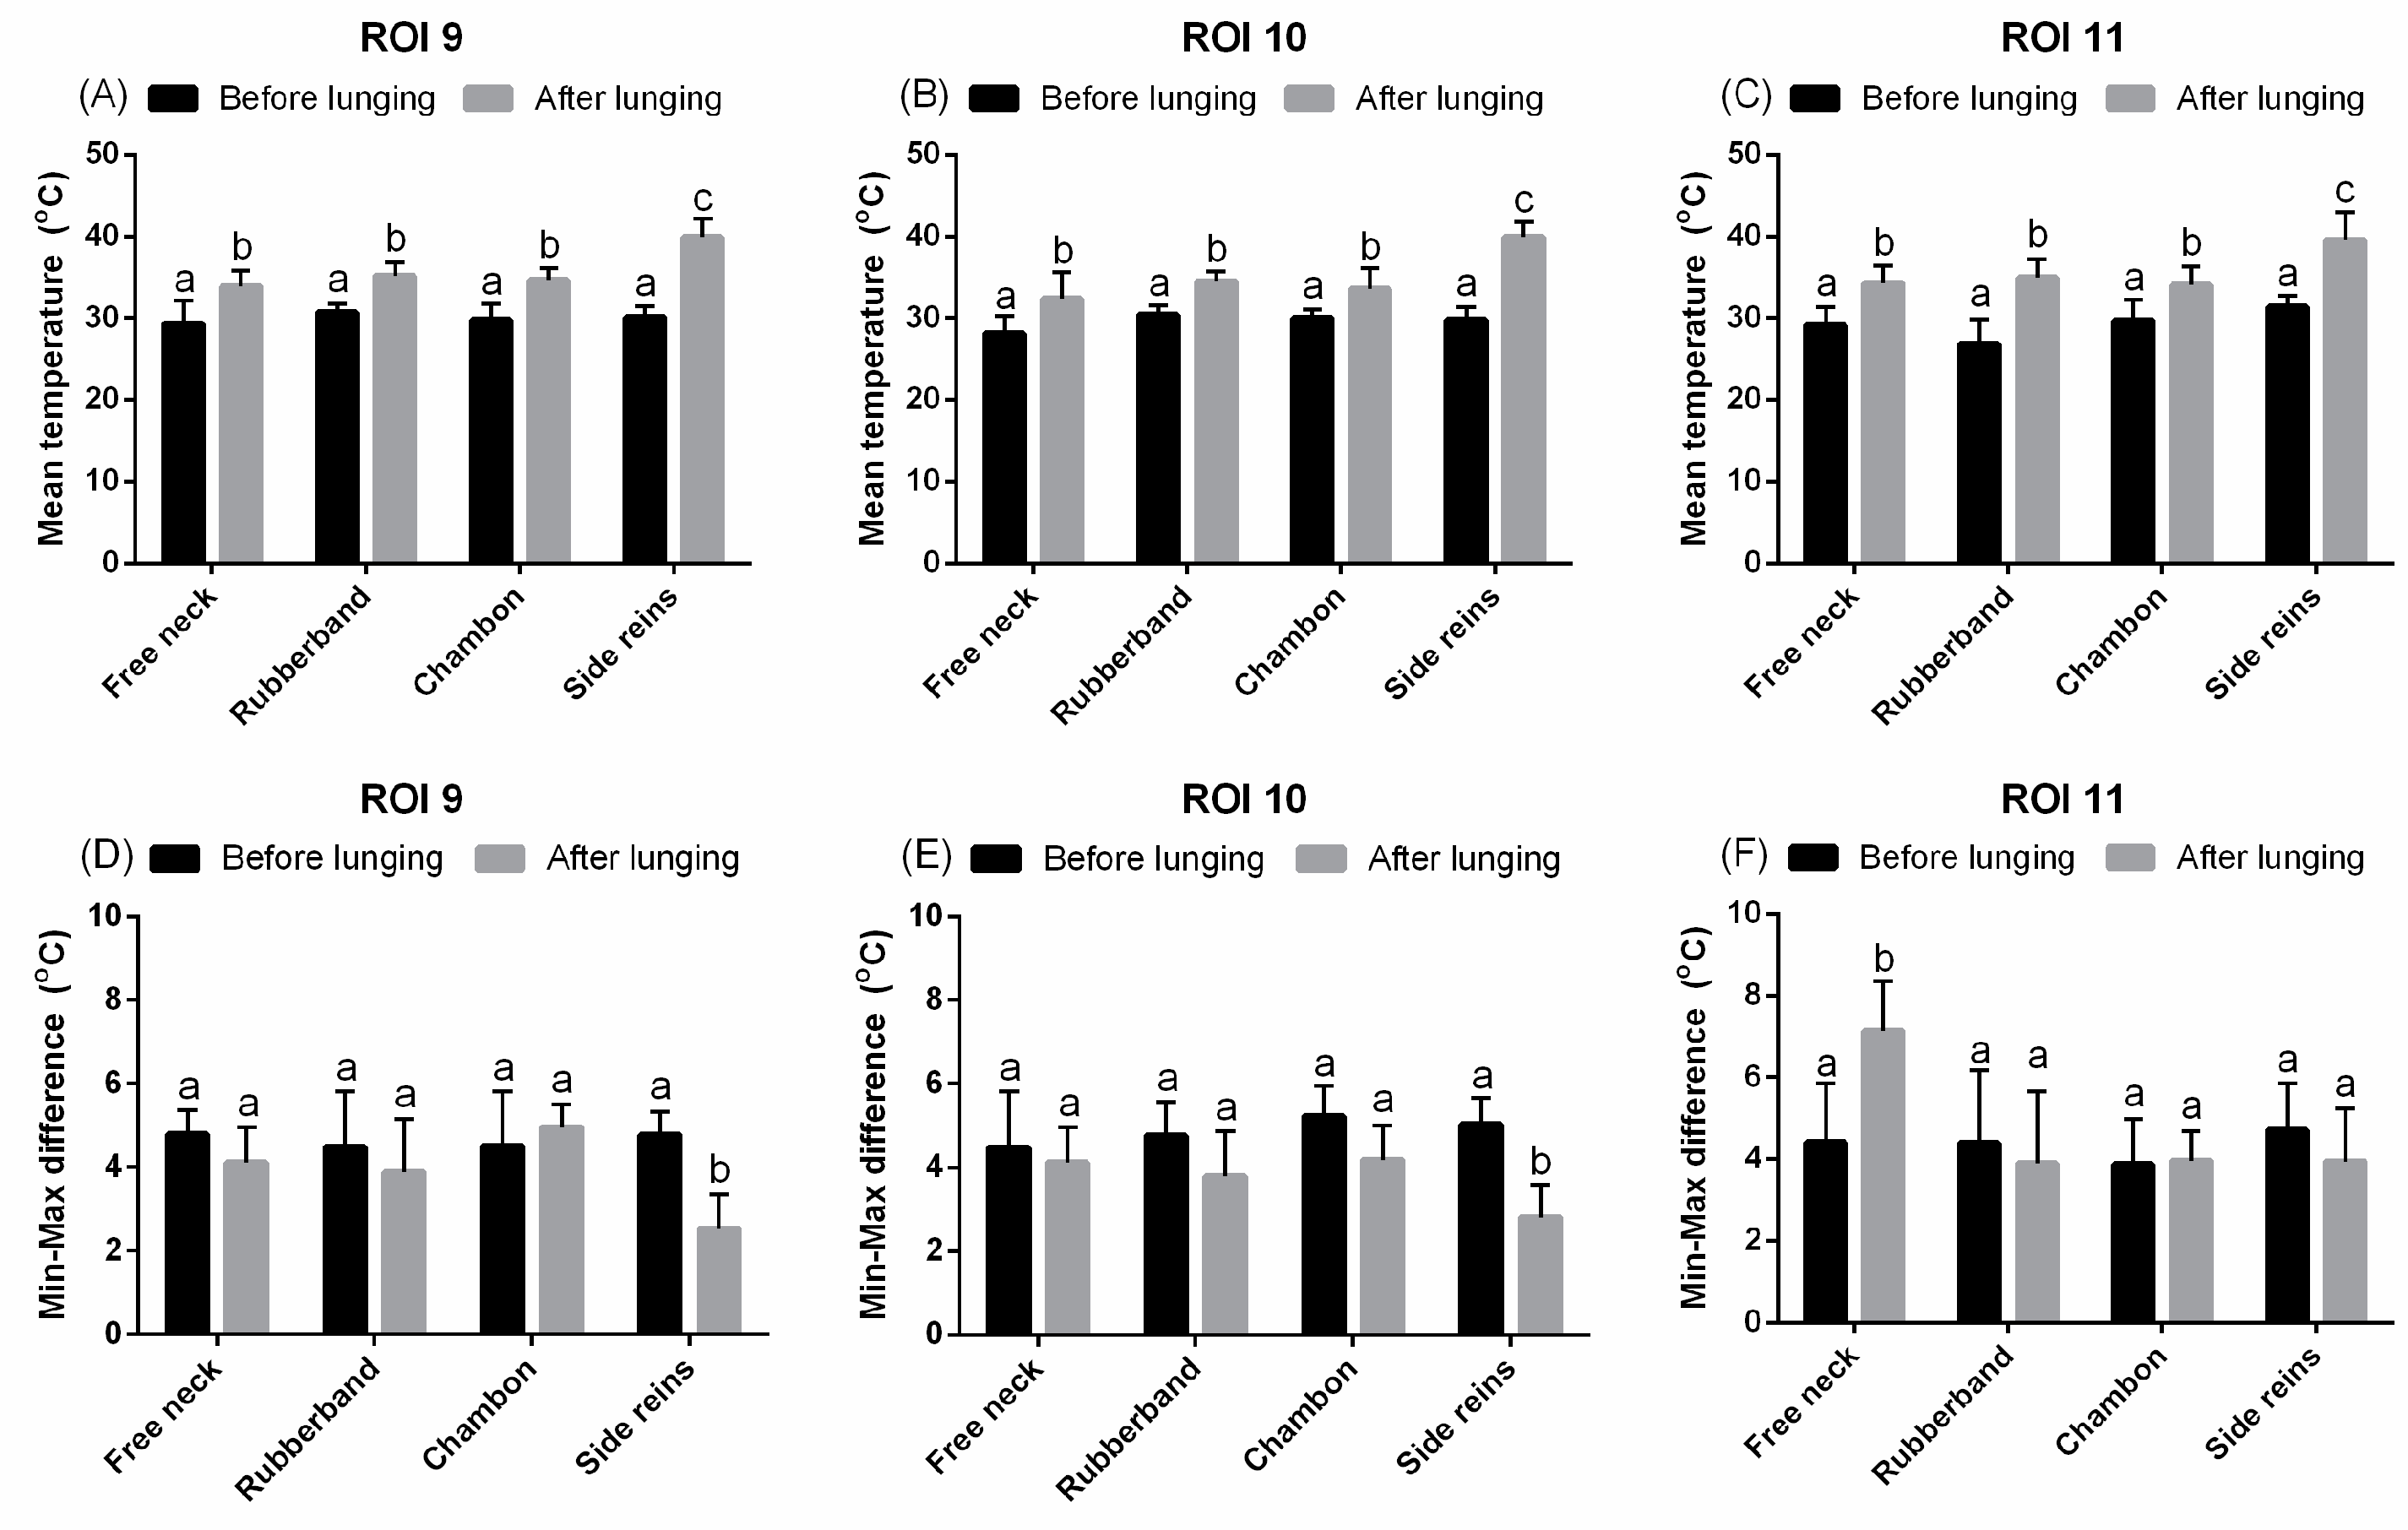
| ROI 9 | an irregular, hourglass-shaped | from the highest point of ilium down to the knee joint along the tail contour to the lateral edge of the semitendinosus muscle |
| ROI 10 | an irregular, fusiform | from anterior superior iliac spine to the knee joint, between the lateral edge of semitendinosus muscle and the lateral edge of the hindquarters |
| ROI 11 | an irregular, barrel-shaped | from sacral vertebrae down to the knee joint along the caudal edge of hindquarters and along patella up to the coxal tuber |
| Lunging | Freely Moving Head | Rubber Band | Chambon | Triangle Side Reins | ||||
|---|---|---|---|---|---|---|---|---|
| ROIs | Before Lunging | After Lunging | Before Lunging | After Lunging | Before Lunging | After Lunging | Before Lunging | After Lunging |
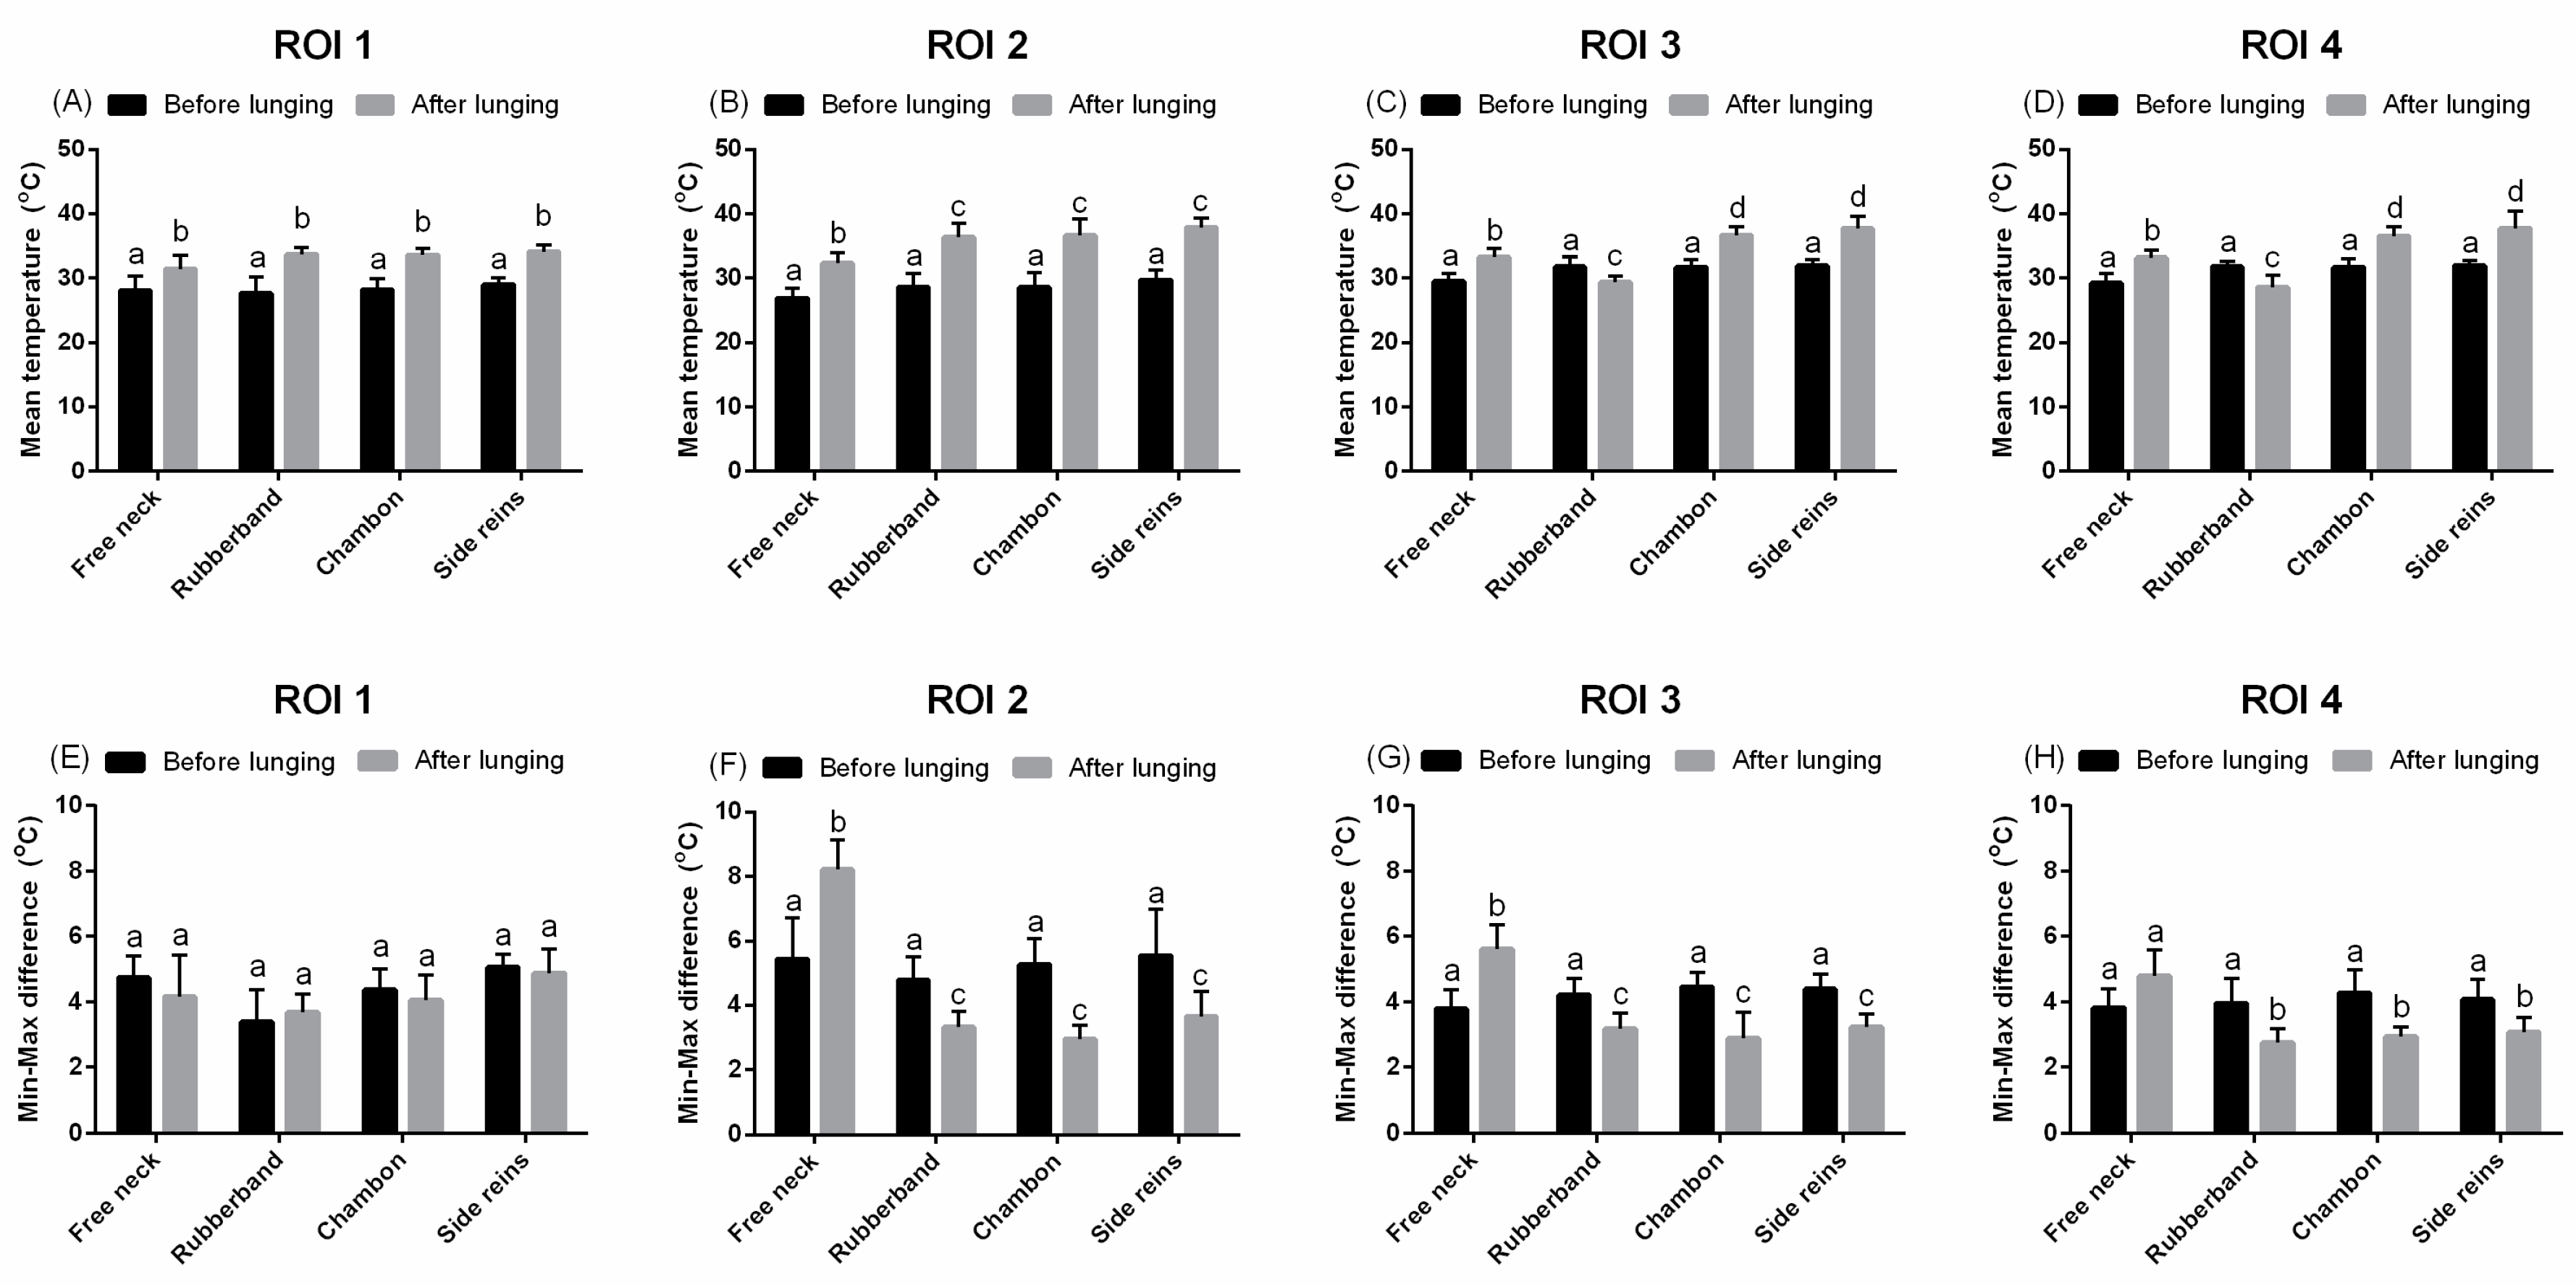
| ROI 1 | 28.05 ± 2.24 a,v | 31.36 ± 2.18 b,x | 27.67 ± 2.52 a,v | 33.67 ± 1.15 b,x | 28.17 ± 1.76 a,v | 33.60 ± 0.96 b,x | 29.00 ± 1.00 a,v | 34.11 ± 1.00 b,x |
| ROI 2 | 26.91 ± 1.53 a,v | 32.31 ± 1.67 b,x | 28.64 ± 2.03 a,v | 36.37 ± 2.15 b,y | 28.55 ± 2.36 a,v | 36.64 ± 2.60 b,y | 29.72 ± 1.60 a,v | 37.87 ± 1.42 b,y |
| ROI 3 | 29.51 ± 1.19 a,v | 33.29 ± 1.37 b,x | 31.77 ± 1.60 a,v | 29.38 ± 0.95 b,y | 31.68 ± 1.25 a,v | 36.74 ± 1.34 b,z | 31.96 ± 0.93 a,v | 37.68 ± 1.95 b,z |
| ROI 4 | 29.21 ± 1.59 a,v | 33.09 ± 1.36 b,x | 31.77 ± 0.88 a,v | 28.62 ± 1.83 b,y | 31.73 ± 1.30 a,v | 36.57 ± 1.42 b,z | 31.98 ± 0.83 a,v | 37.77 ± 2.26 b,z |
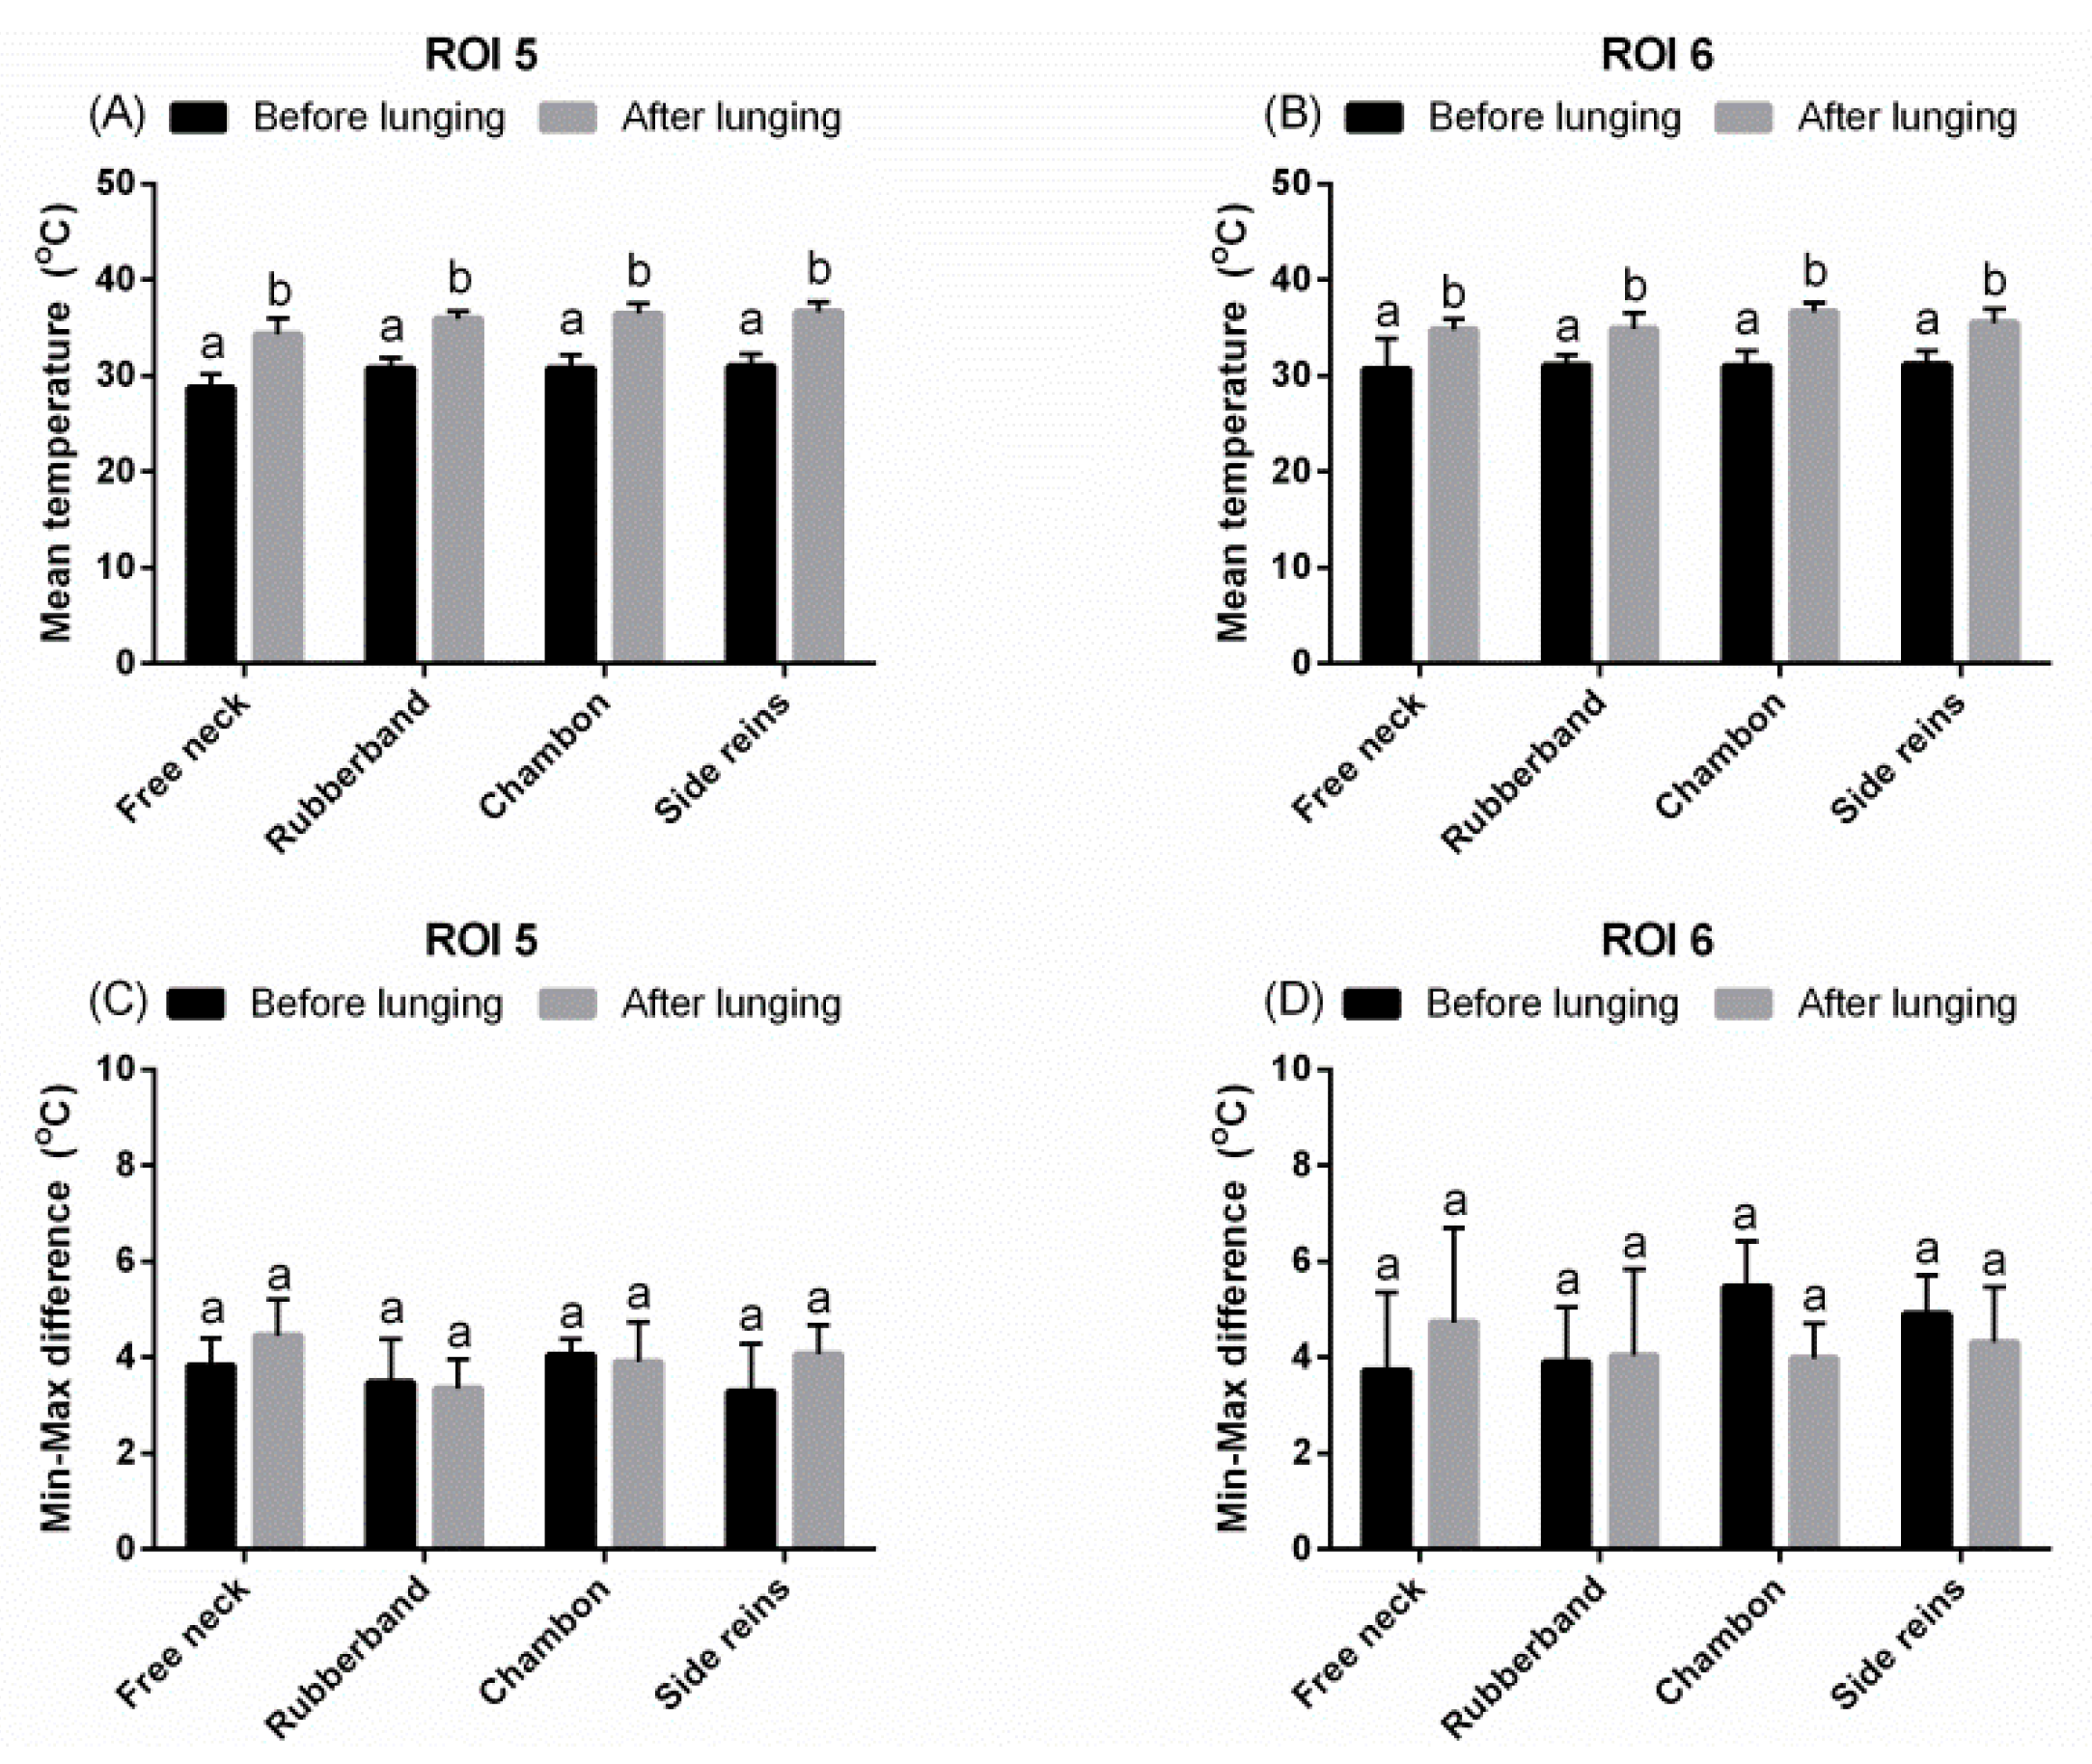
| ROI 5 | 28.73 ± 1.47 a,v | 34.33 ± 1.69 b,x | 30.77 ± 1.13 a,v | 35.92 ± 0.78 b,x | 30.78 ± 1.39 a,v | 36.43 ± 1.07 b,x | 30.98 ± 1.26 a,v | 36.66 ± 1.02 b,x |
| ROI 6 | 30.69 ± 3.17 a,v | 34.83 ± 1.09 b,x | 31.10 ± 1.04 a,v | 34.89 ± 1.68 b,x | 31.02 ± 1.54 a,v | 36.64 ± 1.02 b,x | 31.15 ± 1.44 a,v | 35.52 ± 1.41 b,x |
| ROI 7 | 30.15 ± 1.20 a,v | 32.00 ± 2.01 b,x | 29.99 ± 1.00 a,v | 36.44 ± 3.13 b,y | 30.45 ± 1.85 a,v | 37.57 ± 3.01 b,y | 30.85 ± 2.69 a,v | 39.61 ± 1.25 b,y |
| ROI 8 | 27.72 ± 2.27 a,v | 32.55 ± 2.77 b,x | 30.46 ± 0.96 a,v | 33.00 ± 0.75 b,x | 30.08 ± 0.89 a,v | 33.12 ± 1.38 b,x | 30.05 ± 1.11 a,v | 33.53 ± 1.39 b,x |
| ROI 9 | 29.36 ± 2.78 a,v | 33.90 ± 1.90 b,x | 30.69 ± 1.09 a,v | 35.16 ± 1.61 b,x | 29.77 ± 1.97 a,v | 34.66 ± 1.50 b,x | 30.14 ± 1.28 a,v | 39.89 ± 2.30 b,y |
| ROI 10 | 28.13 ± 2.13 a,v | 32.35 ± 3.29 b,x | 30.44 ± 1.11 a,v | 34.50 ± 1.20 b,x | 30.03 ± 1.08 a,v | 33.58 ± 2.53 b,x | 29.84 ± 1.53 a,v | 39.93 ± 1.84 b,y |
| ROI 11 | 29.12 ± 2.22 a,v | 34.27 ± 2.12 b,x | 26.83 ± 3.01 a,v | 34.94 ± 2.26 b,x | 29.72 ± 2.51 a,v | 34.06 ± 2.21 b,x | 31.36 ± 1.37 a,v | 39.56 ± 3.40 b,y |
| Lunging | Freely Moving Head | Chambon | Rubber Band | Triangle Side Reins | ||||
|---|---|---|---|---|---|---|---|---|
| ROIs | Before Lunging | After Lunging | Before Lunging | After Lunging | Before Lunging | After Lunging | Before Lunging | After lunging |
| ROI 1 | 4.74 ± 0.67 a,v | 4.17 ± 1.26 a,x | 3.40 ± 0.98 a,v | 3.69 ± 0.55 a,x | 4.36 ± 0.6 5 a,v | 4.05 ± 0.78 a,x | 5.05 ± 0.41 a,v | 4.89 ± 0.73 a,x |
| ROI 2 | 5.44 ± 1.29 a,v | 8.22 ± 0.93 b,x | 4.78 ± 0.72 a,v | 3.32 ± 0.50 b,y | 5.27 ± 0.79 a,v | 2.95 ± 0.43 b,y | 5.55 ± 1.43 a,v | 3.65 ± 0.78 b,y |
| ROI 3 | 3.79 ± 0.57 a,v | 5.61 ± 0.74 b,x | 4.20 ± 0.53 a,v | 3.17 ± 0.48 b,y | 4.46 ± 0.45 a,v | 2.90 ± 0.79 b,y | 4.39 ± 0.46 a,v | 3.24 ± 0.40 b,y |
| ROI 4 | 3.83 ± 0.57 a,v | 4.79 ± 0.81a,x | 3.95 ± 0.78 a,v | 2.76 ± 0.41 b,y | 4.27 ± 0.70 a,v | 2.93 ± 0.31 b,y | 4.07 ± 0.61 a,v | 3.08 ± 0.46 b,y |
| ROI 5 | 3.81 ± 0.56 a,v | 4.46 ± 0.75 a,x | 3.48 ± 0.91 a,v | 3.36 ± 0.61 a,x | 4.05 ± 0.33 a,v | 3.91 ± 0.82 a,x | 3.30 ± 0.98 a,v | 4.07 ± 0.61 a,x |
| ROI 6 | 3.73 ± 1.63 a,v | 4.73 ± 1.97 a,x | 3.90 ± 1.14 a,v | 4.04 ± 1.80 a,x | 5.48 ± 0.95 a,v | 3.98 ± 0.73 a,x | 4.90 ± 0.81 a,v | 4.32 ± 1.15 a,x |
| ROI 7 | 5.17 ± 1.04 a,v | 7.08 ± 0.84 b,x | 5.50 ± 0.61 a,v | 2.70 ± 0.49 b,y | 4.31 ± 0.46 a,v | 2.07 ± 1.16 b,y | 4.84 ± 1.01 a,v | 3.42 ± 0.41 b,y |
| ROI 8 | 4.40 ± 1.15 a,v | 3.74 ± 0.94 a,x | 3.77 ± 1.26 a,v | 3.40 ± 0.58 a,x | 4.42 ± 1.12 a,v | 2.93 ± 0.98 a,x | 4.79 ± 1.41 a,v | 4.08 ± 0.46 a,x |
| ROI 9 | 4.79 ± 0.57 a,v | 4.12 ± 0.84 a,x | 4.48 ± 1.33 a,v | 3.88 ± 1.27 a,x | 4.50 ± 1.32 a,v | 4.96 ± 0.54 a,x | 4.78 ± 0.56 a,v | 2.53 ± 0.82 b,y |
| ROI 10 | 4.48 ± 1.33 a,v | 4.12 ± 0.84 a,x | 4.76 ± 0.80 a,v | 3.78 ± 1.08 a,x | 5.22 ± 0.73 a,v | 4.91 ± 0.82 a,x | 5.04 ± 0.61 a,v | 2.81 ± 0.77 b,y |
| ROI 11 | 4.40 ± 1.44 a,v | 7.13 ± 1.23 b,x | 4.41 ± 1.78 a,v | 3.90 ± 1.75 a,y | 3.87 ± 1.10 a,v | 3.96 ± 0.76 a,y | 4.71 ± 1.14 a,v | 3.94 ± 1.30 a,y |
© 2019 by the authors. Licensee MDPI, Basel, Switzerland. This article is an open access article distributed under the terms and conditions of the Creative Commons Attribution (CC BY) license (http://creativecommons.org/licenses/by/4.0/).
Share and Cite
Maśko, M.; Zdrojkowski, L.; Domino, M.; Jasinski, T.; Gajewski, Z. The Pattern of Superficial Body Temperatures in Leisure Horses Lunged with Commonly Used Lunging Aids. Animals 2019, 9, 1095. https://doi.org/10.3390/ani9121095
Maśko M, Zdrojkowski L, Domino M, Jasinski T, Gajewski Z. The Pattern of Superficial Body Temperatures in Leisure Horses Lunged with Commonly Used Lunging Aids. Animals. 2019; 9(12):1095. https://doi.org/10.3390/ani9121095
Chicago/Turabian StyleMaśko, Malgorzata, Lukasz Zdrojkowski, Malgorzata Domino, Tomasz Jasinski, and Zdzislaw Gajewski. 2019. "The Pattern of Superficial Body Temperatures in Leisure Horses Lunged with Commonly Used Lunging Aids" Animals 9, no. 12: 1095. https://doi.org/10.3390/ani9121095
APA StyleMaśko, M., Zdrojkowski, L., Domino, M., Jasinski, T., & Gajewski, Z. (2019). The Pattern of Superficial Body Temperatures in Leisure Horses Lunged with Commonly Used Lunging Aids. Animals, 9(12), 1095. https://doi.org/10.3390/ani9121095