Associations of Blood Analysis with Feed Efficiency and Developmental Stage in Grass-Fed Beef Heifers

 ,
, 
Abstract
:Simple Summary
Abstract
1. Introduction
2. Materials and Methods
2.1. Animals and Experimental Design
2.2. Productive Performance and Biometrics
2.3. Blood Sampling
2.4. Complete Blood Cell Profile
2.5. Blood Plasma Metabolic Profile
2.6. Immune Response to Ovalbumin (OVA) Vaccination
2.7. Statistical Analyses
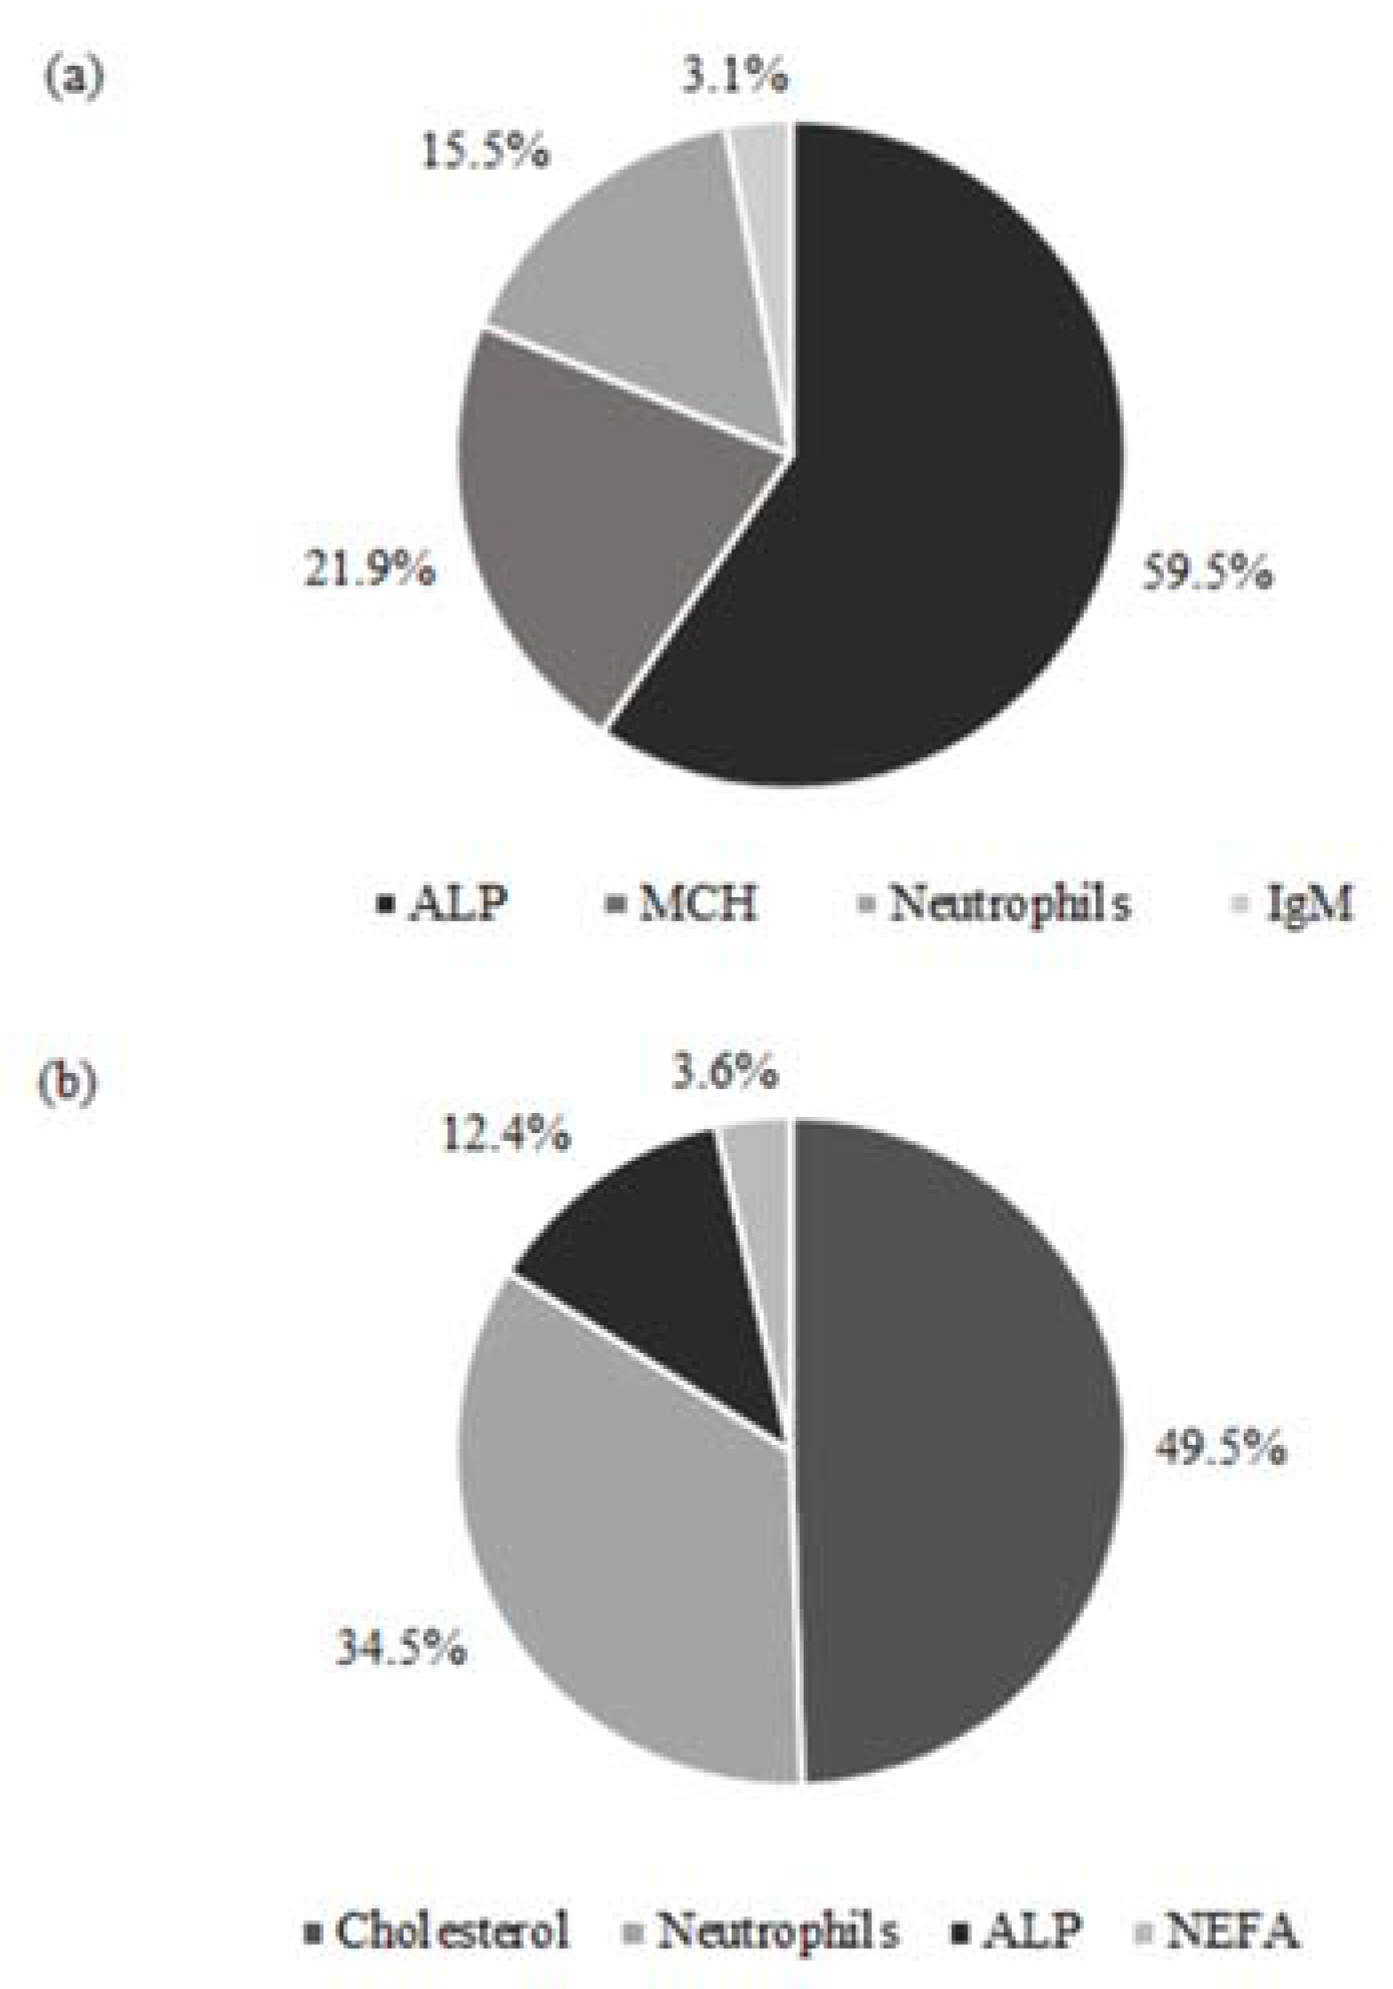
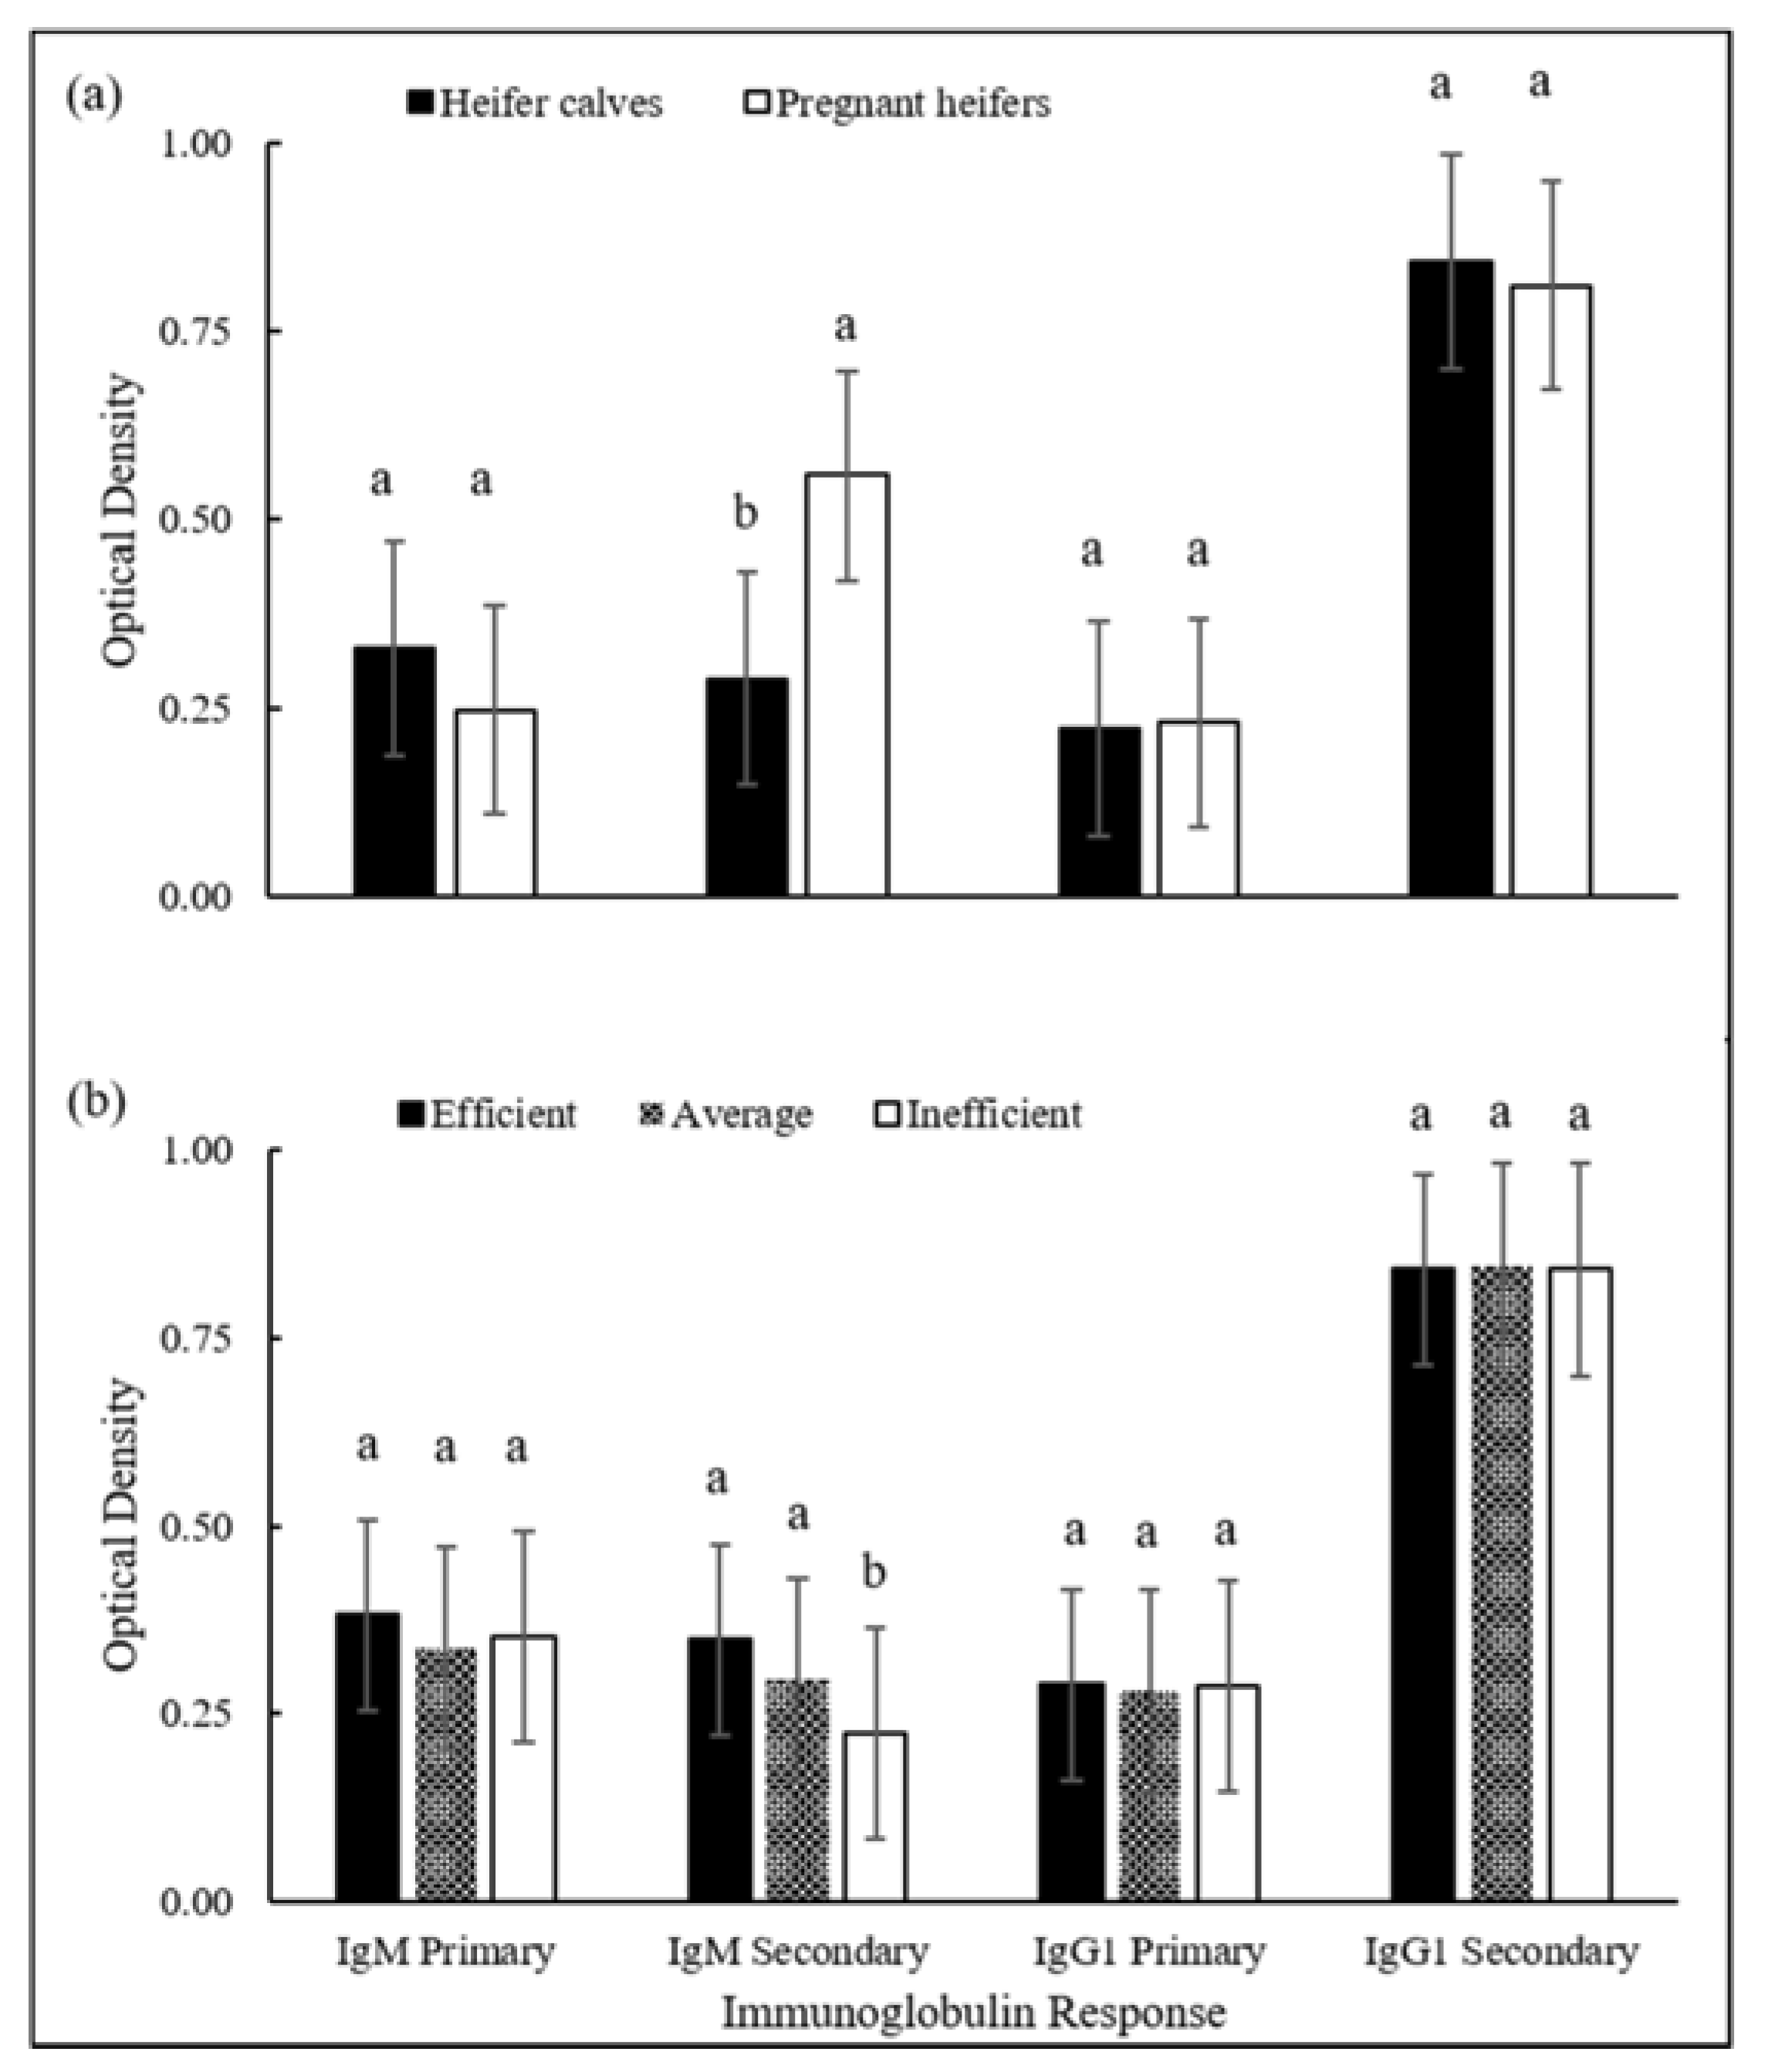
3. Results
4. Discussion
5. Conclusions
Author Contributions
Funding
Acknowledgments
Conflicts of Interest
References
- Brody, S. Bioenergetics and Growth with Special Reference to the Efficiency Complex in Domestic Animals, 1st ed.; Hafner Press: New York, NY, USA, 1945; ISBN 9780028419909. [Google Scholar]
- Rauw, W.M.; Johnson, A.K.; Gomez-Raya, L.; Dekkers, J.C.M. A hypothesis and review of the relationship between selection for improved production efficiency, coping behavior, and domestication. Front. Genet. 2017, 8, 134. [Google Scholar] [CrossRef] [PubMed]
- Montanholi, Y.R.; Swanson, K.C.; Schenkel, F.S.; McBride, B.W.; Caldwell, T.R.; Miller, S.P. On the determination of residual feed intake and associations of infrared thermography with efficiency and ultrasound traits in beef bulls. Livest. Sci. 2009, 125, 22–30. [Google Scholar] [CrossRef]
- Lancaster, P.A.; Carstens, G.E.; Michal, J.J.; Brennan, K.M.; Johnson, K.A.; Davis, M.E. Relationships between residual feed intake and hepatic mitochondrial function in growing beef cattle. J. Anim. Sci. 2014, 92, 3134–3141. [Google Scholar] [CrossRef] [PubMed]
- Wang, Y.J.; Ko, M.; Holligan, S.; McBride, B.W.; Fan, M.Z.; Swanson, K.C. Effect of dry matter intake on visceral organ mass, cellularity, and the protein expression of ATP synthase, Na/K-ATPase, proliferating cell nuclear antigen and ubiquitin in feedlot steers. Can. J. Anim. Sci. 2009, 89, 253–262. [Google Scholar] [CrossRef]
- Bourgon, S.L.; Diel de Amorim, M.; Miller, S.P.; Montanholi, Y.R. Associations of blood parameters with age, feed efficiency and sampling routine in young beef bulls. Livest. Sci. 2017, 195, 27–37. [Google Scholar] [CrossRef]
- Gonano, C.V.; Montanholi, Y.R.; Schenkel, F.S.; Smith, B.A.; Cant, J.P.; Miller, S.P. The relationship between feed efficiency and the circadian profile of blood plasma analytes measured in beef heifers at different physiological stages. Animal 2014, 10, 1–15. [Google Scholar] [CrossRef] [PubMed]
- Kelly, A.K.; McGee, M.M.; Crews, D.H.; Fahey, A.G.; Wylie, A.R.; Kenny, D.A. Effect of divergence in residual feed intake on feeding behavior, blood metabolic variables, and body composition traits in growing beef heifers. J. Anim. Sci. 2010, 88, 109–123. [Google Scholar] [CrossRef] [PubMed]
- Lawrence, P.; Kenny, D.A.; Earley, B.; Crews, D.H.; McGee, M. Grass silage intake, rumen and blood variables, ultrasonic and body measurements, feed behavior, and activity in pregnant beef heifers differing in phenotypic residual feed intake. J. Anim. Sci. 2011, 89, 3248–3261. [Google Scholar] [CrossRef] [PubMed]
- Richardson, E.C.; Herd, R.M.; Colditz, I.G.; Archer, J.A.; Arthur, P.F. Blood cell profiles of steer progeny from parents selected for and against residual feed intake. Aust. J. Exp. Agric. 2002, 42, 901–908. [Google Scholar] [CrossRef]
- Riedesel, D.H.; Engen, R.L. The heart and vasculature: Gross structure and basic properties. In Dukes’ Physiology of Domestic Animals, 12th ed.; Reece, W.O., Erickson, H.H., Goff, J.P., Uemura, E.E., Eds.; Wiley Blackwell: Hoboken, NJ, USA, 2015; pp. 287–463. ISBN 9780801442384. [Google Scholar]
- Lochmiller, R.L.; Deerenberg, C. Trade-offs in evolutionary immunology: What is the cost of immunity? Oikos 2000, 88, 87–98. [Google Scholar] [CrossRef]
- Rincon-Delgado, R.M.; Gutierrez-Banuelos, H.; Perez-Vazquez, E.D.; Muro-Reyes, A.; Diaz-Garcia, L.H.; Banuelos-Valenzuela, R.; Gutierrez-Pina, F.J.; Medina-Flores, C.A.; Escareno-Sanchez, L.M.; Aguilera-Soto, J.I.; et al. Relationship of residual feed intake on specific hematological and biochemical parameters in Rambouillet sheep. J. Anim. Vet. Adv. 2011, 10, 1112–1116. [Google Scholar]
- Sheldon, B.C.; Verhulst, S. Ecological immunology: Costly parasite defenses and trade-offs in evolutionary ecology. Trends Ecol. Evol. 1996, 11, 317–321. [Google Scholar] [CrossRef]
- Klassing, K.C. Nutritional aspects of leukocytic cytokines. J. Nutr. 1988, 118, 1436–1446. [Google Scholar] [CrossRef] [PubMed]
- Tizard, I.R. Veterinary Immunology, 9th ed.; Saunders: Philadelphia, PA, USA, 2013; ISBN 9781455703623. [Google Scholar]
- Cartwright, S.L.; Begley, N.; Schaeffer, L.R.; Burnside, E.B.; Mallard, B.A. Antibody and cell-mediated immune responses and survival between Holstein and Norwegian Red x Holstein Canadian calves. J. Dairy Sci. 2011, 94, 1576–1585. [Google Scholar] [CrossRef] [PubMed]
- Mallard, B.A.; Wagter, L.C.; Ireland, M.J.; Dekkers, J.C.M. Effects of growth hormone, insulin-like growth factor I, and cortisol on periparturient antibody response profiles of dairy cattle. Vet. Immunol. Immunopathol. 1997, 60, 61–76. [Google Scholar] [CrossRef]
- Rauw, W.M.; Portolés, O.; Corella, D.; Soler, J.; Reixach, J.; Tibau, J.; Prat, J.M.; Diaz, I.; Gómez-Raya, L. Behavior influences cholesterol plasma levels in a pig model. Animal 2007, 1, 865–871. [Google Scholar] [CrossRef] [PubMed]
- Fredeen, A.H.; DePeters, E.J.; Baldwin, R.L. Characterization of acid-base disturbances and effects on calcium and phosphorus balances of dietary fixed ions in pregnant or lactating does. J. Anim. Sci. 1988, 66, 159–173. [Google Scholar] [CrossRef] [PubMed]
- Ternouth, J.H. Phosphorous and beef production in northern Australia 3. Phosphorous in cattle—A review. Trop. Grassl. 1990, 24, 159–169. [Google Scholar]
- Martin, R.M.; Gentry, G.T.; Gentry, L.R. Impact of cow size on dry matter intake, residual feed intake, metabolic response, and cow performance. J. Anim. Sci. 2015, 93, 672–684. [Google Scholar]
- Sattar, A.; Mirza, R.H. Haematological parameters in exotic cows during gestation and lactation under subtropical conditions. Pak. Vet. J. 2009, 29, 129–132. [Google Scholar]
- Mackenzie, A.M. Effect of transportation and weaning on humoral immune responses of calves. Res. Vet. Sci. 1997, 63, 227–230. [Google Scholar] [CrossRef]
- Mallard, B.A.; Dekkers, J.C.M.; Ireland, M.J.; Leslie, K.E.; Sharif, S.; Vankampen, L.C.; Wagter, L.; Wilkie, B.N. Alteration in immune responsiveness during the peripartum period and its ramification on dairy cow and calf health. J. Dairy Sci. 1998, 81, 585–595. [Google Scholar] [CrossRef]
- Doornenbal, H.; Tong, A.K.W.; Murray, N.L. Reference values of blood parameters in beef cattle of different ages and stages of lactation. Can. J. Vet. Res. 1988, 52, 99–105. [Google Scholar] [PubMed]
- Yokus, B.; Cakir, U.D. Seasonal and physiological variations in serum chemistry and mineral concentrations in cattle. Biol. Trace Elem. Res. 2006, 109, 255–266. [Google Scholar] [CrossRef]
- Canadian Council on Animal Care. CCAC Guidelines on: The Care and Use of Farm Animals in Research, Teaching and Testing. 2009. Available online: http://www.ccac.ca/Documents/Standards/Guidelines/Farm_Animals.pdf (accessed on 15 June 2018).
- Brito, L.F.; Jafarikia, M.; Grossi, D.A.; Kijas, J.W.; Porto-Neto, L.R.; Ventura, R.V.; Salgorzaei, M.; Schenkel, F.S. Characterization of linkage disequilibrium, consistency of gametic phase and admixture in Australian and Canadian goats. BMC Genet. 2015, 16, 67–82. [Google Scholar] [CrossRef] [PubMed]
- Bhagat, C.I.; Garcia-Webb, P.; Fletcher, E.; Beilby, J.P. Calculated osmolality vs. measured plasma osmolalities revisited. Clin. Chem. 1984, 30, 1703–1705. [Google Scholar] [PubMed]
- You, Q.; Karrow, N.A.; Quinton, M.; Mallard, B.A.; Boermans, J. Enhanced cutaneous hypersensitivity reactions are associated with ovine high and low cortisol responsiveness to acute endotoxin challenge. Vet. Dermatol. 2008, 19, 174–183. [Google Scholar] [CrossRef] [PubMed]
- Heriazon, A.; Hamilton, K.; Huffman, J.; Wilkie, B.N.; Sears, W.; Quinton, M.; Mallard, B.A. Immunoglobulin isotypes of lactating Holstein cows classified as high, average, and low type-1 or -2 immune responders. Vet. Immunol. Immunopathol. 2011, 144, 259–269. [Google Scholar] [CrossRef] [PubMed]
- Pitchford, W.S. Genetic improvement of feed efficiency of beef cattle: What lessons can be learnt from other species? Aust. J. Exp. Agric. 2004, 44, 371–382. [Google Scholar] [CrossRef]
- Montanholi, Y.R.; Odongo, N.E.; Swanson, K.C.; Schenkel, F.S.; McBride, B.W.; Miller, S.P. Application of infrared thermography as an indicator of heat and methane production and its use in the study of skin temperature in response to physiological events in dairy cattle (Bos taurus). J. Therm. Biol. 2008, 33, 468–475. [Google Scholar] [CrossRef]
- Bauman, D.E.; Currie, B. Partitioning of nutrients during pregnancy and lactation: A review of mechanisms involving homeostasis and homeorhesis. J. Dairy Sci. 1980, 63, 1514–1529. [Google Scholar] [CrossRef]
- Kominsky, D.J.; Campbell, E.L.; Colgan, S.P. Metabolic shifts in immunity and inflammation. J. Immunol. 2010, 184, 4062–4068. [Google Scholar] [CrossRef] [PubMed]
- Colditz, I.G. Effects of the immune system on metabolism: Implications for production and disease resistance in livestock. Livest. Sci. 2002, 75, 257–268. [Google Scholar] [CrossRef]
- Mitlöhner, F.M.; Galyean, M.L.; McGlone, J.J. Shade effects on performance, carcass traits, physiology, and behavior of heat-stressed feedlot heifers. J. Anim. Sci. 2002, 80, 2043–2050. [Google Scholar] [CrossRef] [PubMed]
- McGee, M.; Drennan, M.J.; Caffrey, P.J. Effect of age and nutrient restriction pre-partum on beef suckler cow serum immunoglobulin concentrations, colostrum yield, composition and immunoglobulin concentration and immune status of their progeny. Ir. J. Agric. Food Res. 2006, 45, 157–171. [Google Scholar]
- Dhurandhar, N.V.; Israel, B.A.; Kolesar, J.M.; Mayhew, G.F.; Cook, M.E.; Atkinson, R.L. Increased adiposity in animals due to a human virus. Int. J. Obes. 2000, 24, 989–996. [Google Scholar] [CrossRef] [Green Version]
- Magnusson, U.; Wilkie, B.; Artusson, K.; Mallard, B. Interferon-alpha and haptoglobin in pigs selectively bred for high and low immune response and infected with Mycoplasma hyorhinis. Vet. Immunol. Immunopathol. 1999, 68, 131–137. [Google Scholar] [CrossRef]
- She, Q.B.; Mukherjee, J.J.; Huang, J.S.; Crilly, K.S.; Kiss, Z. Growth factor-like effects of placental alkaline phosphatase in human fetus and mouse embryo fibroblasts. FEBS Lett. 2000, 469, 163–167. [Google Scholar] [CrossRef] [Green Version]
- Richardson, E.C.; Herd, R.M.; Archer, J.A.; Arthur, P.F. Metabolic differences in Angus steers divergently selected for residual feed intake. Aust. J. Exp. Agric. 2004, 44, 441–452. [Google Scholar] [CrossRef]
- Walawski, K.; Majewski, A.; Lenzy, Z.; Dabrowska, M.J.; Ruszczynska, B. Relationship between the polymorphism and activity of alkaline phosphatase in the blood serum and the rate of growth in young black-and-white cattle. Genet. Pol. 1980, 21, 195–201. [Google Scholar]
- Kennedy, T.G.; Ross, H.E. Temporal- and hormone-dependent changes in uterine sensitization for the decidual cell reaction and decidualization in vitro of rat endometrial stromal cells. J. Reprod. Fertil. 1997, 109, 129–136. [Google Scholar] [CrossRef] [PubMed]
- Solomon, A.L.; Siddals, K.W.; Baker, P.N.; Gibson, J.M.; Aplin, J.D.; Westwood, M. Placental alkaline phosphatase de-phosphorylates insulin-like growth factor (IGF)-binding protein-1. Placenta 2014, 35, 520–522. [Google Scholar] [CrossRef] [PubMed]
- Petterson, J.A.; Dunshea, F.R.; Ehrhardt, R.A.; Bell, A.W. Pregnancy but not moderate undernutrition attenuates insulin suppression of fat mobilization in sheep. J. Nutr. 1994, 124, 2431–2436. [Google Scholar] [CrossRef] [PubMed]
- Bell, A.W. Regulation of organic nutrient metabolism during transition from late pregnancy to early lactation. J. Anim. Sci. 1995, 73, 2804–2819. [Google Scholar] [CrossRef] [PubMed]
- Montanholi, Y.R.; Haas, L.S.; Swanson, K.C.; Coomber, B.L.; Yamashiro, S.; Miller, S.P. Liver morphometrics and metabolic blood profile across divergent phenotypes for feed efficiency in the bovine. Acta Vet. Scand. 2017, 59, 24. [Google Scholar] [CrossRef] [PubMed]
- Van Soest, P.J. Nutritional Ecology of the Ruminant, 2nd ed.; Cornell University Press: New York, NY, USA, 1994; ISBN 9780801427725. [Google Scholar]
- Cozzi, G.; Ravarotto, L.; Gottardo, F.; Stefani, A.L.; Contiero, B.; Moro, L.; Brscic, M.; Dalvit, P. Short communication: Reference values for blood parameters in Holstein dairy cows: Effects of parity, stage of lactation, and season of production. J. Dairy Sci. 2011, 94, 3895–3901. [Google Scholar] [CrossRef] [PubMed]
- Grandin, T. Assessment of stress during handling and transport. J. Anim. Sci. 1997, 75, 249–257. [Google Scholar] [CrossRef] [PubMed]
- Koolhaas, K.M.; Korte, S.M.; De Boer, S.F.; Van Der Veqt, B.J.; Van Reenen, C.G.; Hopster, H.; De Jong, I.C.; Ruis, M.A.; Blokhuis, H.J. Coping styles in animals: Current status in behavior and stress-physiology. Neurosci. Biobehav. Rev. 1999, 2311, 925–935. [Google Scholar] [CrossRef]
- Lobley, G.E. Energy metabolism reactions in ruminant muscle: Responses to age, nutrition and hormonal status. Reprod. Nutr. Dev. 1990, 30, 13–34. [Google Scholar] [CrossRef] [PubMed]
- Dørup, I.; Clausen, T. Effects of potassium deficiency on growth and protein synthesis in skeletal muscle and the heart of rats. Br. J. Nutr. 1988, 62, 269–284. [Google Scholar] [CrossRef]
- Huber, K.; Breves, G. Influence of dietary phosphorus depletion on central pathways of intermediary metabolism in rats. Arch. Anim. Nutr. 1999, 52, 299–309. [Google Scholar] [CrossRef]
- Villanueva, I.; Alva-Sánchez, C.; Pacheco-Rosado, J. Review Article. The role of thyroid hormones as inductors of oxidative stress and neurodegeneration. Oxid. Med. Cell. Longev. 2013, 2013, 1–15. [Google Scholar] [CrossRef] [PubMed]
- Sato, K.; Han, D.C.; Fujii, Y.; Tsushima, T.; Shizume, K. Thyroid hormone stimulates alkaline phosphatase activity in cultured rat osteoblastic cells (ROS 17/2.8) through 3,5,3′-triiodo-l-thyronine nuclear receptors. Endocrinology 1987, 120, 1873–1881. [Google Scholar] [CrossRef] [PubMed]
- Cabello, G.; Wrutniak, C. Thyroid hormone and growth: Relationships with growth hormone effects and regulation. Reprod. Nutr. Dev. 1989, 29, 387–402. [Google Scholar] [CrossRef] [PubMed]


| Stage/Variable (Unit) | Mean ± SD | Efficient | Inefficient | p-Value |
|---|---|---|---|---|
| Heifer calves | (n = 54) | (n = 53) | ||
| Residual feed intake (kg DMI/day) | 0.00 ± 1.07 | −0.83 (−1.01, −0.66) | 0.85 (0.67, 1.03) | <0.01 |
| Average daily gain (kg/day) | 0.73 ± 0.16 | 0.71 (0.67, 0.76) | 0.74 (0.70, 0.79) | 0.35 |
| Dry matter intake (DMI; kg/day) | 6.22 ± 1.29 | 5.45 (5.17, 5.73) | 7.01 (6.73, 7.30) | <0.01 |
| Feed to gain ratio | 8.80 ± 2.18 | 7.92 (7.38, 8.46) | 9.70 (9.15, 10.2) | <0.01 |
| Average body weight (kg) | 303 ± 40.4 | 300 (289, 311) | 308 (297, 319) | 0.33 |
| Average rib eye area (cm2) | 40.7 ± 5.67 | 40.2 (38.7, 41.7) | 41.1 (39.6, 42.7) | 0.58 |
| Average back fat thickness (mm) | 1.41 ± 0.85 | 1.43 (1.20, 1.66) | 1.87 (1.30, 1.62) | 0.66 |
| Average rump fat thickness (mm) | 1.62 ± 1.25 | 1.52 (1.18, 1.35) | 1.72 (1.38, 1.52) | 0.71 |
| Average marbling score A (1–11) | 4.00 ± 0.31 | 4.00 (3.84, 4.12) | 4.09 (3.88, 4.14) | 0.80 |
| Pregnant heifers | (n = 16) | (n = 15) | ||
| Residual feed intake (kg DMI/day) | 0.00 ± 1.24 | −1.02 (−1.45, −0.59) | 1.06 (0.61, 1.50) | <0.01 |
| Average daily gain (kg/day) | 0.99 ± 0.17 | 1.01 (0.93, 1.10) | 1.02 (0.94, 1.11) | 0.86 |
| Dry matter intake (DMI; kg/day) | 9.68 ± 1.73 | 8.64 (7.89, 9.39) | 10.93 (10.2, 11.7) | <0.01 |
| Feed to gain ratio | 9.78 ± 2.02 | 8.57 (7.69, 9.45) | 10.56 (9.65, 11.47) | <0.01 |
| Average body weight (kg) | 480 ± 49.6 | 480 (455, 505) | 496 (470, 522) | 0.35 |
| Average rib eye area (cm2) | 51.1 ± 7.52 | 50.3 (46.3, 54.3) | 53.2 (49.1, 57.3) | 0.32 |
| Average back fat thickness (mm) | 1.98 ± 1.11 | 1.82 (1.23, 2.41) | 2.27 (1.67, 2.88) | 0.30 |
| Average rump fat thickness (mm) | 3.20 ± 2.12 | 3.04 (1.65, 3.67) | 3.36 (1.79, 4.03) | 0.71 |
| Average marbling score A (1–11) | 4.91 ± 0.58 | 4.96 (3.68, 4.24) | 4.90 (3.61, 4.19) | 0.79 |
| Stage/Analyte (Abbreviation; Unit) | Start of Performance Evaluation | End of Performance Evaluation | ||||
|---|---|---|---|---|---|---|
| Efficient | Inefficient | p-Value | Efficient | Inefficient | p-Value | |
| Heifer calves | (n = 54) | (n = 53) | (n = 54) | (n = 53) | ||
| Fibrinogen (g/dL) | 4.26 (4.00, 4.52) | 4.19 (3.93, 4.45) | 0.70 | 3.80 (3.50, 4.09) | 3.85 (3.55, 4.15) | 0.81 |
| Hematocrit (%) | 35.9 (34.9, 37.0) | 35.9 (34.8, 37.0) | 0.94 | 35.4 (34.4, 36.4) | 36.1 (35.1, 37.1) | 0.32 |
| Hemoglobin (mg/dL) | 120 (117, 124) | 120 (117, 124) | 0.90 | 122 (122, 129) | 125 (119, 126) | 0.20 |
| Lymphocytes (WBC %) | 67.1 (64.4, 69.8) | 63.3 (60.6, 66.0) | 0.05 | 62.2 (59.4, 65.1) | 60.2 (57.3, 63.1) | 0.31 |
| Mean cell hemoglobin (MCH; pg) | 14.5 (14.4, 14.7) | 14.7 (14.6, 14.9) | 0.08 | 16.0 (15.8, 16.2) | 16.4 (16.2, 16.7) | 0.01 |
| Mean corpuscular volume (MCV; Hfl) | 43.3 (42.8, 43.8) | 43.8 (43.3, 44.4) | 0.19 | 46.2 (45.6, 46.9) | 47.0 (46.4, 47.7) | 0.09 |
| Monocytes (WBC %) | 3.61 (3.07, 4.16) | 3.53 (3.00, 4.08) | 0.83 | 4.10 (3.44, 4.75) | 3.71 (3.04, 4.39) | 0.42 |
| Platelets (103 cells/µL) | 514 (473, 555) | 486 (444, 528) | 0.34 | 417 (385, 449) | 430 (398, 463) | 0.55 |
| Red blood cells (RBC; 106 cells/µL) | 8.29 (8.05, 8.54) | 8.19 (7.94, 8.44) | 0.56 | 7.65 (7.43, 7.87) | 7.67 (7.44, 7.89) | 0.92 |
| Segmented neutrophils (WBC %) | 27.1 (24.5, 29.7) | 30.9 (28.2, 33.5) | 0.05 | 26.9 (24.5, 29.3) | 27.0 (24. 6, 29.4) | 0.96 |
| White blood cells (WBC; 103 cells/µL) | 10.3 (9.74, 10.9) | 10.3 (9.70, 10.9) | 0.94 | 10.1 (9.50, 10.8) | 9.81 (9.17, 10.5) | 0.48 |
| Pregnant heifers | (n = 16) | (n = 15) | (n = 16) | (n = 15) | ||
| Fibrinogen (g/dL) | 4.94 (4.35, 5.54) | 4.38 (3.69, 5.08) | 0.22 | 3.78 (2.99, 4.57) | 4.23 (3.30, 5.16) | 0.45 |
| Hematocrit (%) | 32.4 (30.7, 34.1) | 31.7 (29.9, 33.4) | 0.49 | 35.9 (34.3, 37.4) | 36.3 (34.7 37.9) | 0.92 |
| Hemoglobin (mg/dL) | 116 (110, 122) | 113 (108, 120) | 0.56 | 121 (115, 127) | 122 (117, 128) | 0.72 |
| Lymphocytes (WBC %) | 62.3 (57.8, 66.8) | 62.1 (57.5, 66.8) | 0.96 | 68.4 (64.5, 72.4) | 62.5 (58.5, 66.6) | 0.04 |
| Mean cell hemoglobin (MCH; pg) | 15.3 (14.8, 15.8) | 16.0 (15.4, 16.6) | 0.09 | 16.7 (16.2, 17.2) | 17.4 (16.9, 18.0) | 0.06 |
| Mean corpuscular volume (MCV; Hfl) | 41.9 (40.3, 43.7) | 43.9 (42.1, 46.0) | 0.07 | 50.0 (48.4, 51.70) | 51.9 (49.9, 53.8) | 0.23 |
| Monocytes (WBC %) | 3.67 (2.30, 5.03) | 3.23 (1.63, 4.84) | 0.68 | 4.65 (3.34, 5.96) | 4.46 (2.96, 5.96) | 0.85 |
| Platelets (103 cells/µL) | 396 (332, 461) | 340 (272, 409) | 0.23 | 307 (253, 360) | 311 (255, 366) | 0.91 |
| Red blood cells (RBC; 106 cells/µL) | 7.72 (7.21, 8.23) | 7.1 (6.7, 7.7) | 0.17 | 7.23 (6.86, 7.59) | 7.03 (6.65, 7.41) | 0.45 |
| Segmented neutrophils (WBC %) | 30.5 (26.4, 34.6) | 31.1 (26.9, 35.4) | 0.83 | 20.0 (16.7, 23.3) | 26.6 (23.2, 30.0) | 0.01 |
| White blood cells (WBC; 103 cells/µL) | 8.94 (8.18, 9.78) | 7.96 (7.26, 8.73) | 0.07 | 8.24 (7.33, 9.26) | 8.1 (7.12, 9.10) | 0.80 |
| Traits (Abbreviation; Unit) | Heifer Calves | Pregnant Heifers | p-Value |
|---|---|---|---|
| Complete blood cell parameters * | |||
| Fibrinogen (g/dL) | 4.03 (3.87, 4.19) | 4.34 (4.04, 4.64) | 0.07 |
| Hematocrit (%) | 35.8 (35.2, 36.4) | 34.1 (33.0, 35.1) | 0.01 |
| Hemoglobin (mg/dL) | 122 (120, 125) | 119 (115, 123) | 0.15 |
| Lymphocytes (% WBC) | 63.3 (61.7, 64.9) | 63.9 (60.9, 66.9) | 0.72 |
| Mean cell hemoglobin (MCH; pg) | 15.4 (15.3, 15.6) | 16.2 (15.9, 16.4) | <0.01 |
| Mean corpuscular value (MCV; Hfl) | 45.1 (44.7, 45.4) | 46.1 (45.4, 46.8) | 0.01 |
| Monocytes (% WBC) | 3.75 (3.42, 4.09) | 4.10 (3.47, 4.72) | 0.34 |
| Platelets (103 cells/µL) | 462 (440, 484) | 336 (296, 377) | <0.01 |
| Red blood cells (RBC; 106 cells/µL) | 7.95 (7.81, 8.10) | 7.30 (7.03, 7.57) | <0.01 |
| Segmented neutrophils (% WBC) | 27.9 (26.5, 29.3) | 27.0 (24.4, 29.6) | 0.55 |
| White blood cells (WBC; 103 cells/µL) | 9.95 (9.60, 10.3) | 8.33 (7.79, 8.91) | <0.01 |
| Enzymes | |||
| Alkaline phosphatase (ALP; U/L) | 95.1 (88.9, 102) | 115 (99.3, 136) | 0.02 |
| Aspartate aminotransferase (AST; U/L) | 55.0 (53.7, 56.2) | 56.9 (54.5, 59.2) | 0.17 |
| Creatine kinase (CK; U/L) | 171 (164, 178) | 153 (142, 166) | 0.02 |
| Gamma glutamyl transferase (GGT; U/L) | 16.2 (15.8, 16.6) | 16.2 (15.4, 17.0) | 0.96 |
| Glutamate dehydrogenase (GLDH; U/L) | 18.1 (17.0, 19.4) | 16.1 (14.2, 18.1) | 0.09 |
| Compounds | |||
| Albumin (g/L) | 34.0 (33.7, 34.3) | 33.8 (33.3, 34.3) | 0.56 |
| Albumin: globulin ratio | 1.03 (1.01, 1.05) | 0.99 (0.96, 1.03) | 0.08 |
| Beta hydroxy butarate acid (BHBA; µmol/L) | 161 (154, 167) | 167 (156, 180) | 0.32 |
| Carbon dioxide (CO2; mmol/L) | 23.4 (23.1, 23.7) | 26.2 (25.6, 26.9) | <0.01 |
| Cholesterol (mmol/L) | 3.42 (3.31, 3.53) | 3.05 (2.85, 3.25) | <0.01 |
| Creatinine (µmol/L) | 115 (112, 117) | 126 (120, 131) | <0.01 |
| Globulin (g/L) | 33.5 (33.0, 34.0) | 34.5 (33.7, 35.4) | 0.04 |
| Glucose (mmol/L) | 4.36 (4.29, 4.43) | 3.96 (3.85, 4.08) | <0.01 |
| Non-esterified fatty acids (NEFA: mmol/L) | 0.26 (0.25, 0.28) | 0.28 (0.25, 0.32) | 0.34 |
| Urea (mmol/L) | 2.65 (2.58, 2.72) | 2.76 (2.63, 2.88) | 0.15 |
| Ions | |||
| Anion gap (mmol/L) | 27.4 (26.9, 27.8) | 27.8 (27.0, 28.7) | 0.33 |
| Calcium (mmol/L) | 2.40 (2.38, 2.41) | 2.39 (2.37, 2.42) | 0.84 |
| Chloride (mmol/L) | 94.6 (94.3, 94.9) | 96.6 (96.0, 97.1) | <0.01 |
| Magnesium (mmol/L) | 0.87 (0.86, 0.88) | 0.89 (0.87, 0.91) | 0.19 |
| Osmolality (mmol/L) | 277 (277, 278) | 277 (276, 278) | 0.39 |
| Potassium (mmol/L) | 4.30 (4.26, 4.34) | 4.21 (4.13, 4.28) | 0.03 |
| Phosphorus (mmol/L) | 2.19 (2.15, 2.23) | 2.00 (1.93, 2.07) | <0.01 |
| Sodium (mmol/L) | 141 (141, 141) | 141 (141, 141) | 0.94 |
| Hormone | |||
| Triiodothyronine (T3; nmol/L) | 1.86 (1.80, 1.91) | 1.77 (1.67, 1.87) | 0.15 |
| Traits (Abbreviation; Unit) | Efficient | Inefficient | p-Value |
|---|---|---|---|
| Enzymes | |||
| Alkaline phosphatase (ALP; U/L) | 86.4 (93.9, 121) | 98.6 (103, 131) | 0.03 |
| Aspartate aminotransferase (AST; U/L) | 56.1 (54.3, 57.9) | 55.2 (53.3, 57.0) | 0.24 |
| Creatine kinase (CK; U/L) | 160 (170, 196) | 155 (165, 192) | 0.22 |
| Gamma glutamyl transferase (GGT; U/L) | 16.5 (15.9, 17.1) | 16.4 (15.7, 17.0) | 0.76 |
| Glutamate dehydrogenase (GLDH; U/L) | 20.4 (17.9, 23.0) | 21.6 (19.0, 24.2) | 0.55 |
| Compounds | |||
| Albumin (g/L) | 34.0 (33.3, 34.2) | 33.8 (33.4, 34.2) | 0.87 |
| Albumin globulin ratio | 1.01 (0.99, 1.04) | 1.02 (1.00, 1.05) | 0.18 |
| Beta hydroxy butarate acid (BHBA; µmol/L) | 155 (153, 169) | 156 (153, 168) | 0.99 |
| Carbon dioxide (CO2; mmol/L) | 23.3 (22.9, 23.8) | 23.5 (23.0, 23.9) | 0.73 |
| Cholesterol (mmol/L) | 3.3 (3.3, 3.5) | 3.36 (3.31, 3.57) | 0.72 |
| Creatinine (µmol/L) | 115 (112, 119) | 113.2 (109, 116) | 0.32 |
| Globulin (g/L) | 34.1 (33.3, 34.8) | 33.7 (32.9, 34.5) | 0.50 |
| Glucose (mmol/L) | 4.43 (4.30, 4.57) | 4.47 (4.33, 4.61) | 0.32 |
| Non-esterified fatty acids (NEFA: mmol/L) | 0.35 (0.31, 0.38) | 0.31 (0.28, 0.35) | 0.15 |
| Urea (mmol/L) | 2.64 (2.57, 2.71) | 2.65 (2.58, 2.73) | 0.79 |
| Ions | |||
| Anion Gap (mmol/L) | 27.7 (27.1, 28.3) | 27.2 (26.6, 27.8) | 0.26 |
| Calcium (mmol/L) | 2.39 (2.38, 2.41) | 2.40 (2.38, 2.42) | 0.55 |
| Chloride (mmol/L) | 94.5 (94.2, 94.8) | 94.7 (94.4, 95.0) | 0.33 |
| Magnesium (mmol/L) | 0.87 (0.86, 0.88) | 0.88 (0.86, 0.89) | 0.44 |
| Osmolality (mmol/L) | 277 (277, 278) | 277 (277, 278) | 0.87 |
| Potassium (mmol/L) | 2.23 (2.18, 2.27) | 2.16 (2.11, 2.20) | 0.03 |
| Phosphorus (mmol/L) | 4.36 (4.31, 4.41) | 4.24 (4.19, 4.29) | <0.01 |
| Sodium (mmol/L) | 141 (141, 141) | 141 (141, 141) | 0.98 |
| Hormone | |||
| Triiodothyronine (T3; nmol/L) | 1.81 (1.75, 1.88) | 1.90 (1.83, 1.96) | 0.06 |
| Traits (Abbreviation; Unit) | Efficient | Inefficient | p-Value |
|---|---|---|---|
| Enzymes | |||
| Alkaline phosphatase (ALP; U/L) | 112 (97.9, 155) | 71.2 (62.6, 82.6) | <0.01 |
| Aspartate aminotransferase (AST; U/L) | 55.4 (52.6, 58.2) | 58.4 (55.5, 61.3) | 0.14 |
| Creatine kinase (CK; U/L) | 131 (122, 143) | 143 (132, 158) | 0.14 |
| Gamma glutamyl transferase (GGT; U/L) | 16.2 (15.1, 17.4) | 16.2 (15.0, 17.4) | 0.98 |
| Glutamate dehydrogenase (GLDH; U/L) | 14.3 (12.1, 17.0) | 16.3 (13.7, 19.3) | 0.30 |
| Compounds | |||
| Albumin (g/L) | 33.7 (33.2, 34.3) | 33.9 (33.3, 34.5) | 0.61 |
| Albumin globulin ratio | 1.02 (0.98, 1.06) | 0.97 (0.93, 1.01) | 0.07 |
| Beta hydroxy butarate acid (BHBA; µmol/L) | 161 (148, 176) | 166 (151, 181) | 0.67 |
| Carbon dioxide (CO2; mmol/L) | 22.9 (22.2, 23.6) | 22.3 (21.6, 23.0) | 0.22 |
| Cholesterol (mmol/L) | 2.68 (2.40, 2.97) | 3.42 (3.13, 3.72) | <0.01 |
| Creatinine (µmol/L) | 131 (123, 140) | 120 (111, 128) | 0.05 |
| Globulin (g/L) | 33.7 (32.5, 34.7) | 35.6 (34.4, 36.7) | 0.02 |
| Glucose (mmol/L) | 3.96 (3.87, 4.05) | 3.93 (3.84, 4.02) | 0.62 |
| Non-esterified fatty acids (NEFA: mmol/L) | 0.34 (0.30, 0.38) | 0.24 (0.21, 0.28) | <0.01 |
| Urea (mmol/L) | 2.74 (2.59, 2.89) | 2.57 (2.43, 2.72) | 0.10 |
| Ions | |||
| Anion Gap (mmol/L) | 26.5 (25.8, 27.3) | 26.6 (25.8, 27.3) | 0.99 |
| Calcium (mmol/L) | 2.37 (2.34, 2.40) | 2.42 (2.38, 2.45) | 0.06 |
| Chloride (mmol/L) | 96.6 (95.8, 97.3) | 96.5 (95.7, 97.3) | 0.95 |
| Magnesium (mmol/L) | 0.88 (0.85, 0.91) | 0.89 (0.87, 0.92) | 0.54 |
| Osmolality (mmol/L) | 278 (277, 279) | 277 (275, 278) | 0.20 |
| Potassium (mmol/L) | 4.15 (4.06, 4.24) | 4.24 (4.15, 4.34) | 0.15 |
| Phosphorus (mmol/L) | 2.02 (1.91, 2.14) | 1.97 (1.86, 2.09) | 0.52 |
| Sodium (mmol/L) | 141 (141, 141) | 141 (140, 142) | 0.20 |
| Hormone | |||
| Triiodothyronine (T3; nmol/L) | 1.83 (1.70, 1.95) | 1.71 (1.58, 1.84) | 0.20 |
© 2018 by the authors. Licensee MDPI, Basel, Switzerland. This article is an open access article distributed under the terms and conditions of the Creative Commons Attribution (CC BY) license (http://creativecommons.org/licenses/by/4.0/).
Share and Cite
Cônsolo, N.R.B.; Munro, J.C.; Bourgon, S.L.; Karrow, N.A.; Fredeen, A.H.; Martell, J.E.; Montanholi, Y.R. Associations of Blood Analysis with Feed Efficiency and Developmental Stage in Grass-Fed Beef Heifers. Animals 2018, 8, 133. https://doi.org/10.3390/ani8080133
Cônsolo NRB, Munro JC, Bourgon SL, Karrow NA, Fredeen AH, Martell JE, Montanholi YR. Associations of Blood Analysis with Feed Efficiency and Developmental Stage in Grass-Fed Beef Heifers. Animals. 2018; 8(8):133. https://doi.org/10.3390/ani8080133
Chicago/Turabian StyleCônsolo, Nara R. B., Jasper C. Munro, Stéphanie L. Bourgon, Niel A. Karrow, Alan H. Fredeen, Janel E. Martell, and Yuri R. Montanholi. 2018. "Associations of Blood Analysis with Feed Efficiency and Developmental Stage in Grass-Fed Beef Heifers" Animals 8, no. 8: 133. https://doi.org/10.3390/ani8080133
APA StyleCônsolo, N. R. B., Munro, J. C., Bourgon, S. L., Karrow, N. A., Fredeen, A. H., Martell, J. E., & Montanholi, Y. R. (2018). Associations of Blood Analysis with Feed Efficiency and Developmental Stage in Grass-Fed Beef Heifers. Animals, 8(8), 133. https://doi.org/10.3390/ani8080133