Changes Associated with Improved Outcomes for Cats Entering RSPCA Queensland Shelters from 2011 to 2016

 ,
,
Simple Summary
Abstract
1. Introduction
2. Experimental Section
2.1. Study Design and Data Collection
2.2. Statistical Analyses
3. Results
3.1. Number and Source of Admissions
3.1.1. Incoming Regions of Admissions
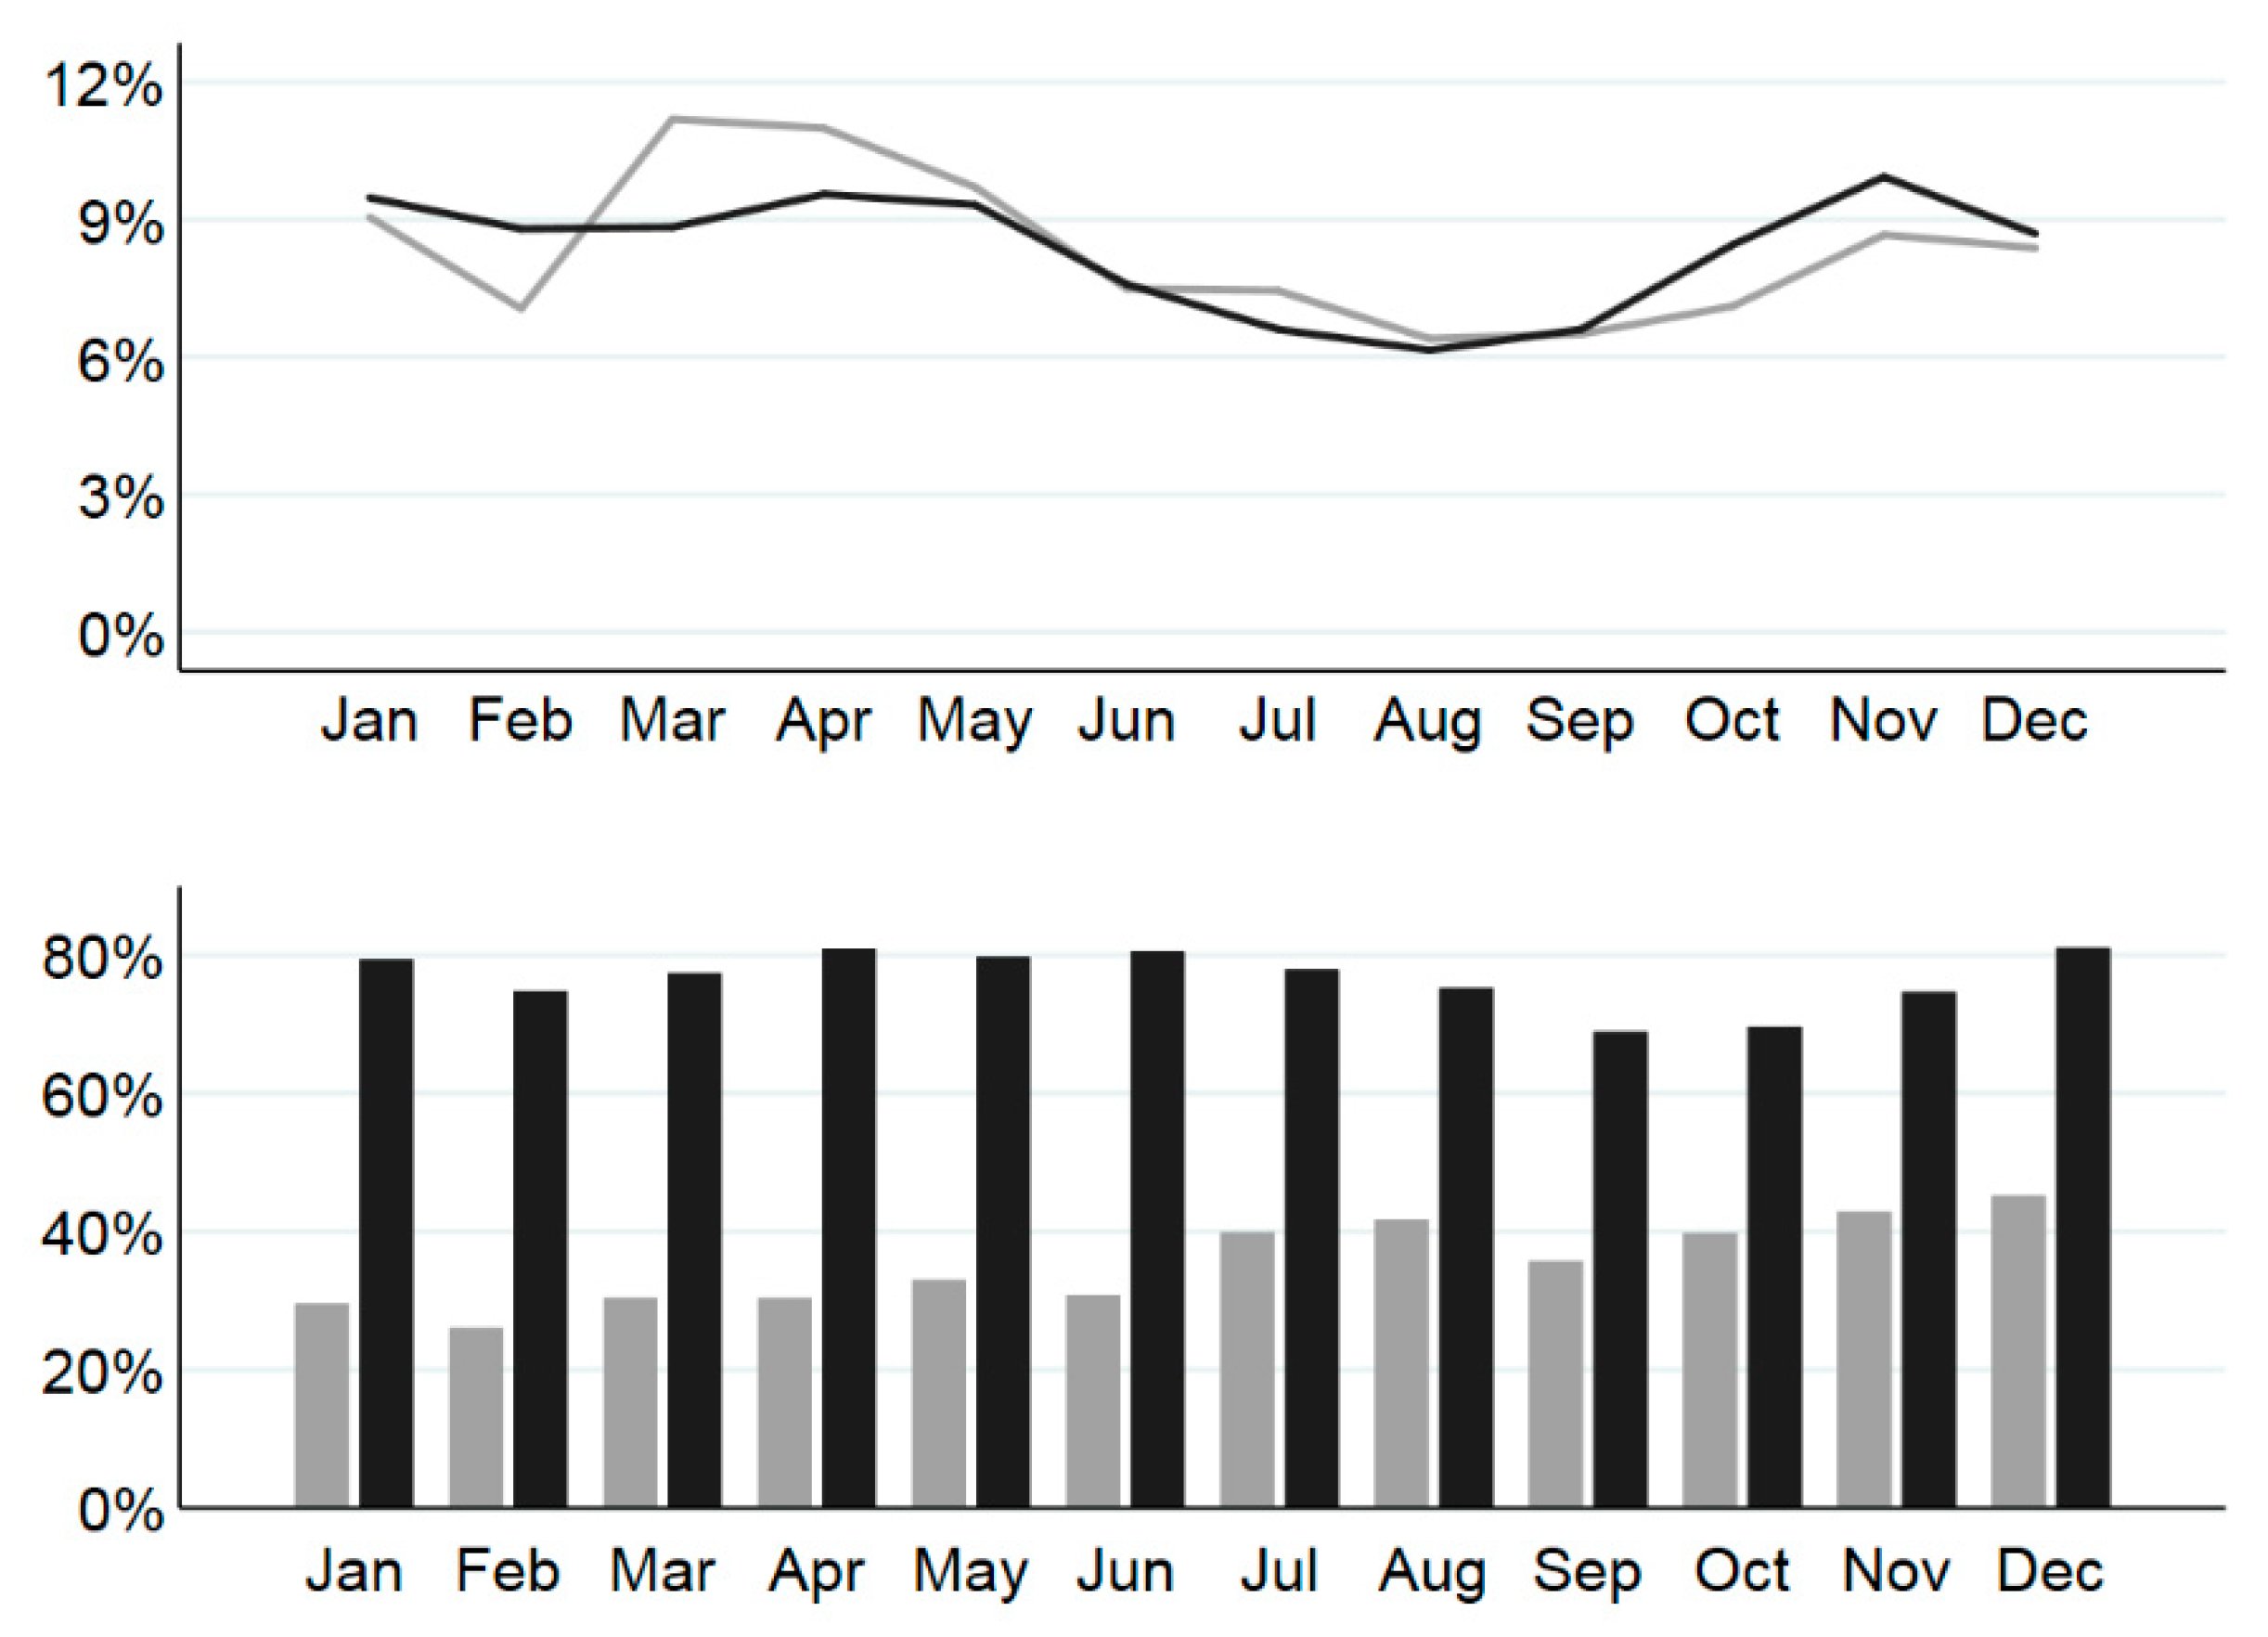
3.1.2. Admissions by Time of Year
3.1.3. Admissions by Desex Status, Feral Status, and Age
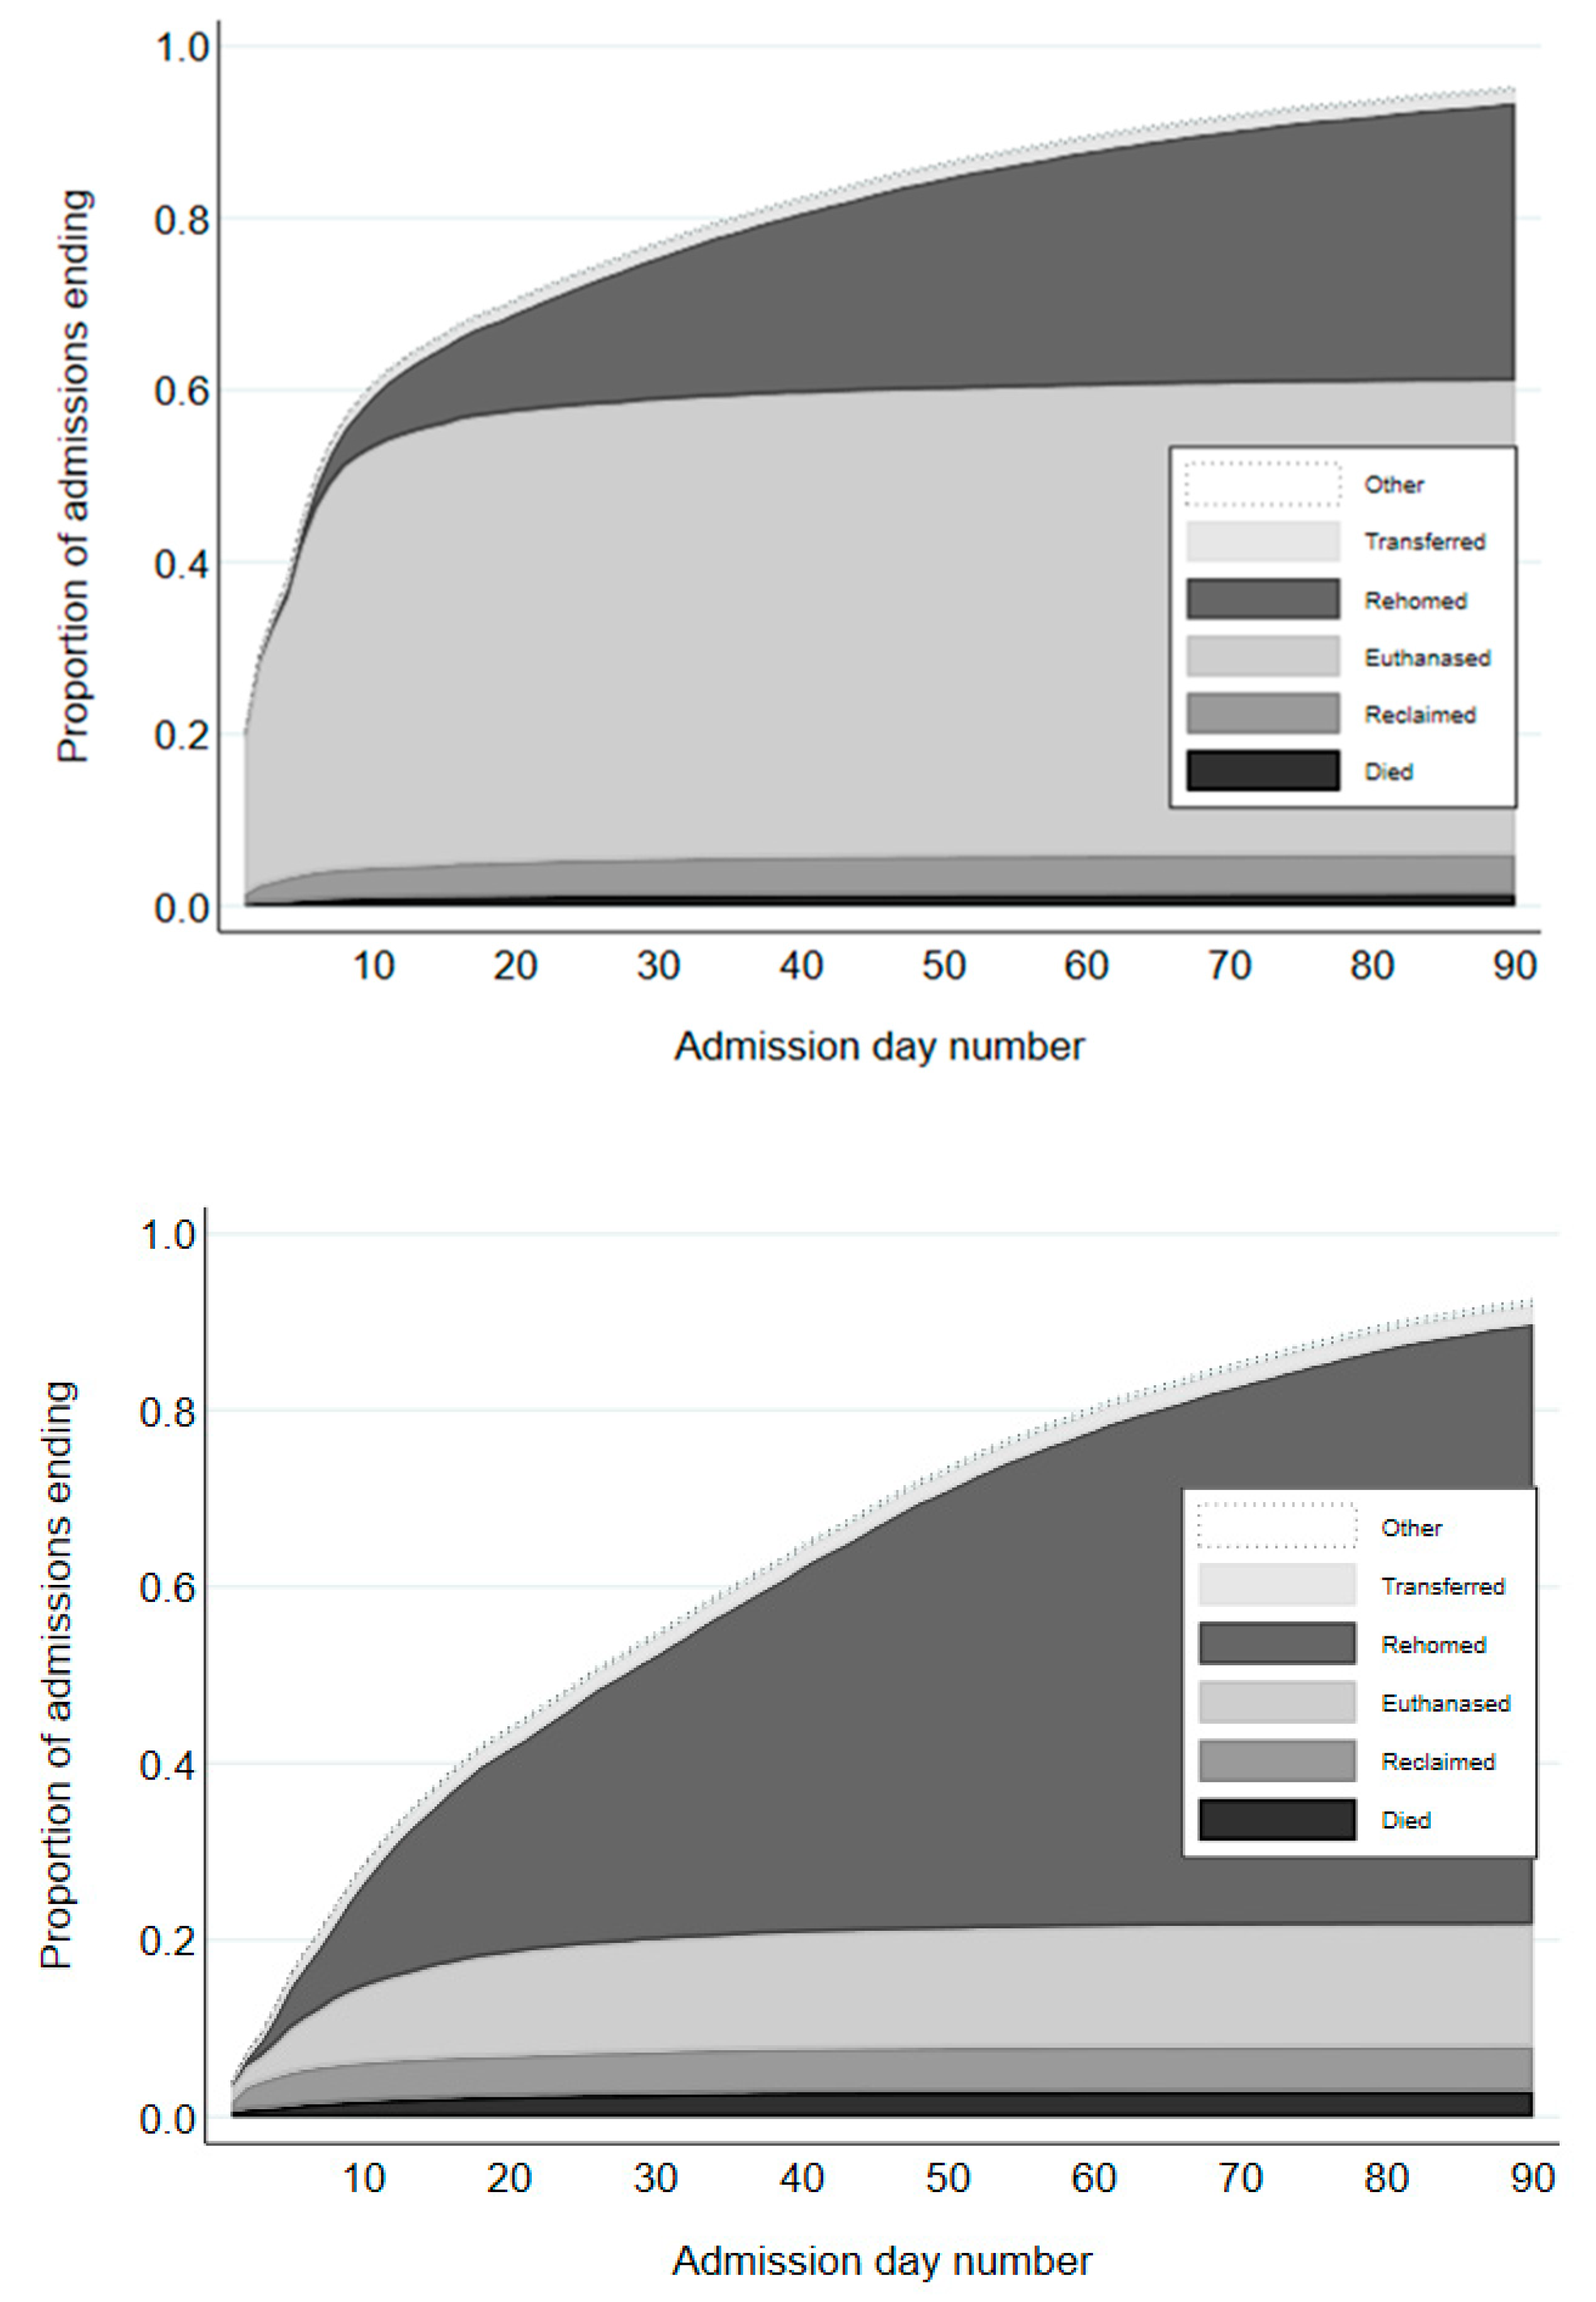
3.2. Outcomes
3.2.1. General
3.2.2. Reclaim
3.2.3. Rehomed
3.2.4. Foster
3.2.5. Transferred to Rescue Groups
3.2.6. Euthanized
3.2.7. Live Release
3.2.8. Movements between RSPCA Sites
4. Discussion
4.1. Cat Admissions
4.1.1. Sources of Admission
4.1.2. Admissions by Time of Year
4.1.3. Admissions by Desex, Feral Status, and Age
4.2. Outcomes
4.2.1. Rehomed
4.2.2. Reclaim
4.2.3. Foster
4.2.4. Transferred to Rescue Groups
4.2.5. Euthanasia
4.2.6. Live Release Percentage
4.3. Limitations
5. Conclusions
Author Contributions
Acknowledgments
Conflicts of Interest
Appendix A

| Site | 2011 | 2016 | ||||||
|---|---|---|---|---|---|---|---|---|
| No. Human Residents | Number Admitted | % of All Admissions | No. Admissions per 1000 Residents ^ | No. Human Residents | Number Admitted | % of All Admissions | No. Admissions per 1000 Residents ^ | |
| RSPCA Sites | ||||||||
| Fairfield # (Brisbane) | 1,089,879 | 3653 | 26.3% | 3 | 1,184,215 | 0 a | ||
| Wacol # (Brisbane) | 1,089,879 | 245 | 1.8% | 0 | 1,184,215 | 3333 | 25.2% | 3 |
| Dakabin ** | 389,684 | 2295 | 16.5% | 6 | 425,302 | 2201 | 16.6% | 5 |
| Townsville ** | 174,462 | 1674 | 12.0% | 10 | 173,815 | 2005 | 15.2% | 12 |
| Bundaberg #,+ | 8,9810 | 1631 | 11.7% | 18 | 92,897 | 464 | 3.5% | 5 |
| Toowoomba # | 17,4462 | 985 | 7.1% | 6 | 173,815 | 1376 | 10.4% | 8 |
| Gympie ** | 19,510 | 995 | 7.2% | 51 | 20,966 | 750 | 5.7% | 36 |
| Cairns # | 156,169 | 622 | 4.5% | 4 | 156,901 | 378 | 2.9% | 2 |
| Noosa ** | 306,909 | 602 | 4.3% | 2 | 307,545 | 384 | 2.9% | 1 |
| Kingaroy ** | 31,028 | 597 | 4.3% | 19 | 32,186 | 616 | 4.7% | 19 |
| Gladstone # | 32,073 | 202 | 1.5% | 6 | 33,418 | 435 | 3.3% | 13 |
| Mackay # | 77,293 | 6 | 0.0% | 0 | 78,685 | 373 | 2.8% | 5 |
| Ipswich * | 30,827 | 0 | 0.0% | 31,711 | 527 | 4.0% | 17 | |
| Rockhampton #,^ | 73,681 | 162 | 1.2% | 2 | 76,985 | 263 | 2.0% | 3 |
| Gold Coast | 515,202 | 196 | 1.4% | 0.4 | 576,918 | 93 | 0.7% | 0.2 |
| Non-RSPCA Sites ^^ | 46 | 0.3% | 22 | 0.2% | ||||
| Total | 3,735,666 ## | 13,911 | 100.0% | 4 | 3,972,656 ## | 13,220 | 100.0% | 3 |
| Admission Site * | Number of Admissions | Number (%) of Admissions Resolved by Day 90 | Number (%) of Admissions Resolved by Day 90 Where the Cat Had Been Moved to Another RSPCA Site ^ | |||
|---|---|---|---|---|---|---|
| 2011 | 2016 | 2011 | 2016 | 2011 | 2016 | |
| Fairfield | 3653 | 0 a | 3517 (96.3%) | 315 (9.0%) | ||
| Wacol | 245 | 3333 | 237 (96.7%) | 3143 (94.3%) | 7 (3.0%) | 36 (1.1%) |
| Dakabin | 2295 | 2201 | 2254 (98.2%) | 2073 (94.2%) | 158 (7.0%) | 253 (12.2%) |
| Townsville | 1674 | 2005 | 1576 (94.1%) | 1876 (93.6%) | 22 (1.4%) | 247 (13.2%) |
| Bundaberg # | 1631 | 464 | 1610 (98.7%) | 428 (92.2%) | 25 (1.6%) | 2 (0.5%) |
| Toowoomba | 985 | 1376 | 921 (93.5%) | 1274 (92.6%) | 11 (1.2%) | 118 (9.3%) |
| Gympie | 995 | 750 | 950 (95.5%) | 698 (93.1%) | 107 (11.3%) | 190 (27.2%) |
| Cairns | 622 | 378 | 596 (95.8%) | 323 (85.4%) | 10 (1.7%) | 3 (0.9%) |
| Noosa | 602 | 384 | 569 (94.5%) | 351 (91.4%) | 16 (2.8%) | 26 (7.4%) |
| Kingaroy | 597 | 616 | 578 (96.8%) | 557 (90.4%) | 62 (10.7%) | 113 (20.3%) |
| Gladstone | 202 | 435 | 111 (55%) | 363 (83.4%) | 0 (0%) | 83 (22.9%) |
| Mackay | 6 | 373 | 4 (66.7%) | 329 (88.2%) | 0 (0%) | 2 (0.6%) |
| Ipswich | 0a | 527 | 511 (97%) | 234 (45.8%) | ||
| Rockhampton ** | 162 | 263 | 132 (81.5%) | 190 (72.2%) | 2 (1.5%) | 20 (10.5%) |
| Gold Coast | 196 | 93 | 157 (80.1%) | 91 (97.8%) | 24 (15.3%) | 24 (26.7%) |
| Total | 13,865 | 13,198 | 13,212 (95.3%) | 12,207 (92.5%) | 759 (5.7%) | 1351 (11.1%) |
| Admission Site * | Rehomed | Euthanized | ||||||
|---|---|---|---|---|---|---|---|---|
| 2011 | 2016 | 2011 | 2016 | |||||
| Number Rehomed | % of Admissions | Number Rehomed | % of Admissions | Number Euthanized | % of Admissions | Number Euthanized | % of Admissions | |
| Fairfield | 1394 | 39.6% | a | 1754 | 49.9% | |||
| Wacol | 122 | 51.5% | 1826 | 58.1% | 98 | 41.4% | 769 | 24.5% |
| Dakabin | 552 | 24.5% | 1446 | 69.8% | 1524 | 67.6% | 340 | 16.4% |
| Townsville | 460 | 29.2% | 1533 | 81.7% | 989 | 62.8% | 183 | 9.8% |
| Bundaberg # | 231 | 14.3% | 370 | 86.4% | 1336 | 83.0% | 43 | 10.0% |
| Toowoomba | 435 | 47.2% | 1021 | 80.1% | 386 | 41.9% | 90 | 7.1% |
| Gympie | 295 | 31.1% | 583 | 83.5% | 611 | 64.3% | 65 | 9.3% |
| Cairns | 307 | 51.5% | 300 | 92.9% | 242 | 40.6% | 11 | 3.4% |
| Noosa | 283 | 49.7% | 296 | 84.3% | 255 | 44.8% | 32 | 9.1% |
| Kingaroy | 170 | 29.4% | 398 | 71.5% | 384 | 66.4% | 124 | 22.3% |
| Gladstone | 99 | 89.2% | 335 | 92.3% | 4 | 3.6% | 26 | 7.2% |
| Mackay | 0 | 0.0% | 289 | 87.8% | 0 | 0.0% | 27 | 8.2% |
| Ipswich | a | 383 | 75.0% | 22 | 16.7% | 11 | 5.8% | |
| Rockhampton ** | 39 | 29.5% | 142 | 74.7% | 36 | 22.9% | 16 | 17.6% |
| Gold Coast | 102 | 65.0% | 53 | 58.2% | ||||
| Total | 4489 | 34.0% | 8975 | 73.5% | 7641 | 57.8% | 1826 | 15.0% |
| Admission Site * | Reclaimed | Transferred | ||||||
|---|---|---|---|---|---|---|---|---|
| 2011 | 2016 | 2011 | 2016 | |||||
| Number Reclaimed | % of Admissions | Number Reclaimed | % of Admissions | Number Transferred | % of Admissions | Number Transferred | % of Admissions | |
| Fairfield | 180 | 5.1% | a | 65 | 1.8% | a | ||
| Wacol | 8 | 3.4% | 216 | 6.9% | 4 | 1.7% | 120 | 3.8% |
| Dakabin | 142 | 6.3% | 231 | 11.1% | 20 | 0.9% | 20 | 1.0% |
| Townsville | 90 | 5.7% | 65 | 3.5% | 0 | 0.0% | 2 | 0.1% |
| Bundaberg # | 29 | 1.8% | 6 | 1.4% | 11 | 0.7% | 0 | 0.0% |
| Toowoomba | 23 | 2.5% | 23 | 1.8% | 65 | 7.1% | 102 | 8.0% |
| Gympie | 25 | 2.6% | 23 | 3.3% | 0 | 0.0% | 3 | 0.4% |
| Cairns | 18 | 3.0% | 7 | 2.2% | 23 | 3.9% | 0 | 0.0% |
| Noosa | 30 | 5.3% | 21 | 6.0% | 1 | 0.2% | 0 | 0.0% |
| Kingaroy | 20 | 3.5% | 26 | 4.7% | 0 | 0.0% | 0 | 0.0% |
| Gladstone | 6 | 5.4% | 0 | 0.0% | 0 | 0.0% | 0 | 0.0% |
| Mackay | 3 | 75.0% | 6 | 1.8% | 0 | 0.0% | 0 | 0.0% |
| Ipswich | a | 25 | 4.9% | a | 7 | 1.3% | ||
| Rockhampton ** | 62 | 47.0% | 4 | 2.1% | 7 | 5.3% | 15 | 7.9% |
| Gold Coast | 8 | 5.1% | 10 | 11.0% | 10 | 6.4% | 10 | 11.0% |
| Total | 644 | 4.9% | 663 | 5.4% | 206 | 1.6% | 279 | 2.3% |
| Rehoming Site | 2011 | 2016 | ||
|---|---|---|---|---|
| RSPCA: shelter/adoption center sites | 4272 | 94.7% | 6999 | 77.8% |
| Non-shelter/adoption center sites—total | 238 | 5.2% | 1997 | 22.2% |
| Pet supply stores | ||||
| World For Pets—Springwood | 107 | 2.4% | 35 | 0.4% |
| Pet Barn stores | 86 | 1.9% | 1503 | 16.7% |
| Pet Crazy Robina | 8 | 0.2% | 0 | |
| RSPCA Adoption events | ||||
| ‘Big Adopt Out’ | 0 | 62 | 0.7% | |
| ‘Pop Up’ Adoption Event | 0 | 325 | 3.6% | |
| ‘Sit, Drop, Shop’—Jindalee DFO | 0 | 72 | 0.8% | |
| Miscellaneous | ||||
| Northside Vet Care Outreach Adoption Centre | 37 | 0.8% | 0 | |
| Total | 4510 | 100% | 8996 | 100% |
References
- Alberthsen, C.; Rand, J.; Morton, J.; Bennett, P.; Paterson, M.; Vankan, D. Characteristics of cats admitted to Royal Society for the Prevention of Cruelty to Animals (RSPCA) shelters in australia and reasons for surrender. Animals 2016, 6, 23. [Google Scholar] [CrossRef] [PubMed]
- Marsh, P. Getting to Zero: A Roadmap to Ending Aniaml Shelter Overpopulation in the United States; Town and Country Reprographics Inc.: Concord, NH, USA, 2012; pp. 1–7. [Google Scholar]
- RSPCA Australia. RSPCA National Statistics. Available online: https://www.rspca.org.au/facts/annual-statistics-2015-16/published-statistics (accessed on 10 October 2017).
- Alberthsen, C.; Rand, J.; Bennett, P.; Paterson, M.; Lawrie, M.; Morton, J. Cat admissions to RSPCA shelters in Queensland, Australia: Description of cats and risk factors for euthanasia after entry. Aust. Vet. J. 2013, 91, 35–42. [Google Scholar] [CrossRef] [PubMed]
- Bartlett, P.C.; Bartlett, A.; Walshaw, S.; Halstead, S. Rates of euthanasia and adoption for dogs and cats in Michigan animal shelters. J. Appl. Anim. Welf. Sci. 2005, 8, 97–104. [Google Scholar] [CrossRef] [PubMed]
- Rowan, A.N. Shelters and pet overpopulation: A statistical black hole. Anthrozoos 1992, 5, 140–143. [Google Scholar] [CrossRef]
- Rogelberg, S.G.; Reeve, C.L.; Spitzmuller, C.; DiGiacomo, N.; Clark, O.L.; Teeter, L.; Walker, A.G.; Starling, P.G.; Carter, N.T. Impact of euthanasia rates, euthanasia practices, and human resource practices on employee turnover in animal shelters. J. Am. Vet. Med. Assoc. 2007, 230, 713–719. [Google Scholar] [CrossRef] [PubMed]
- Shelter Animals Count. Shelter Animal Count 2016 Data. 2016. Available online: https://shelteranimalscount.org/data/Explore-the-Data (accessed on 18 November 2017).
- Looney, A.L.; Bohling, M.W.; Bushby, P.A.; Howe, L.M.; Griffin, B.; Levy, J.K.; Eddlestone, S.M.; Weedon, J.R.; Appel, L.D.; Rigdon-Brestle, Y.K.; et al. The Association of Shelter Veterinarians veterinary medical care guidelines for spay-neuter programs. J. Am. Vet. Med. Assoc. 2008, 233, 74–86. [Google Scholar] [CrossRef] [PubMed]
- Griffin, B. Prolific cats: The impact of their fertility on the welfare of the species. Compend. Cont. Educ. Pract. Vet. 2001, 23, 1058–1065. [Google Scholar]
- Al-Abd, N.M.; Nor, Z.M.; Kassim, M.; Mansor, M.; Al-Adhroey, A.H.; Ngui, R.; Sivanandam, S. Prevalence of filarial parasites in domestic and stray cats in Selangor state, Malaysia. Asian Pac. J. Trop. Med. 2015, 8, 705–709. [Google Scholar] [CrossRef] [PubMed]
- Marsh, A.E.; Babcock, S. Legal implications of zoonotic disease transmission for veterinary practices. Vet. Clin. N. Am. Small Anim. Pract. 2015, 45, 393–408. [Google Scholar] [CrossRef] [PubMed]
- Johnson, J.; Calver, M.C. Prevalence of desexed cats in relation to age in a convenience sample of Western Australian cats. Aust. Vet. J. 2014, 92, 226–227. [Google Scholar] [CrossRef] [PubMed]
- The American Society for the Prevention of Cruelty of Animals [US]. Annual Report 2015. 2015. Available online: https://www.aspca.org/about-us/annual-report (accessed on 17 November 2017).
- Lord, L.K.; Griffin, B.; Slater, M.R.; Levy, J.K. Evaluation of collars and microchips for visual and permanent identification of pet cats. JAVMA J. Am. Vet. Med. A 2010, 237, 387–394. [Google Scholar] [CrossRef] [PubMed]
- Lord, L.K.; Ingwersen, W.; Gray, J.L.; Wintz, D.J. Characterization of animals with microchips entering animal shelters. J. Am. Vet. Med. Assoc. 2009, 235, 160–167. [Google Scholar] [CrossRef] [PubMed]
- Pet Ownership in Australia, 2016; Animal Medicines Australia: Barton, Australia, 2016.
- Kass, P.H.; Johnson, K.L.; Weng, H.Y. Evaluation of animal control measures on pet demographics in Santa Clara County, California, 1993–2006. PeerJ 2013, 1, e18. [Google Scholar] [CrossRef] [PubMed]
- Dybdall, K.; Strasser, R. Is there a bias against stray cats in shelters? People’s perception of shelter cats and how it influences adoption time. Anthrozoos 2014, 27, 603–614. [Google Scholar] [CrossRef]
- Sinn, L. Factors affecting the selection of cats by adopters. J. Vet. Behav. Clin. Appl. Res. 2016, 14, 5–9. [Google Scholar] [CrossRef]
- Delgado, M.M.; Munera, J.D.; Reevy, G.M. Human perceptions of coat color as an indicator of domestic cat personality. Anthrozoos 2012, 25, 427–440. [Google Scholar] [CrossRef]
- Fantuzzi, J.M.; Miller, K.A.; Weiss, E. Factors relevant to adoption of cats in an animal shelter. J. Appl. Anim. Welf. Sci. 2010, 13, 174–179. [Google Scholar] [CrossRef] [PubMed]
- RSPCA Australia National Statistics 2015–2016; RSPCA Australia: Canberra, Australia, 2016.
- RSPCA Qld. Sheltermate. Available online: https://sheltermate.rspcaqld.org.au/login.aspx?aspInitiated=1.1 (accessed on 12 January 2018).
- RSPCA Qld. Pet Legacy. Available online: https://www.rspcaqld.org.au/how-you-can-help/leave-a-gift-in-your-will/pet-legacy (accessed on 23 October 2017).
- Australia Beaurea of Statistics—Australian Semographic Statistics. June 2017. Available online: http://www.abs.gov.au/websitedbs/D3310114.nsf/home/Home (accessed on 15 December 2017).
- Chua, D. The magnitude of the unwanted pet problem in Australia: An estimation of dog and cat admissions into shelters and pounds and their respective outcomes. In Getting 2 Zero; G2Z: Surfer’s Paradise, Australia, 2013; p. iii. [Google Scholar]
- Marsh, P. Replacing Myth with Math: Using Evidence-Based Programs to Eradicate Shelter over Population; Town and Country Reprographics Inc.: Concord, NH, USA, 2012. [Google Scholar]
- Marston, L.C.; Bennett, P.C. Admissions of cats to animal welfare shelters in Melbourne, Australia. J. Appl. Anim. Welf. Sci. 2009, 12, 189–213. [Google Scholar] [CrossRef] [PubMed]
- Levy, J.K.; Woods, J.E.; Turick, S.L.; Etheridge, D.L. Number of unowned free-roaming cats in a college community in the southern United States and characteristics of community residents who feed them. J. Am. Vet. Med. Assoc. 2003, 223, 202–205. [Google Scholar] [CrossRef] [PubMed]
- Neighbourhood Cats. Impact of TNR on Intake & Euthanasia: Case Studies. Available online: https://www.neighborhoodcats.org/resources/case-studies (accessed on 14 November 2017).
- Toukhsati, S.R.; Bennett, P.C.; Coleman, G.J. Behaviors and attitudes towards semi-owned cats. Anthrozoos 2007, 20, 131–142. [Google Scholar] [CrossRef]
- Zito, S.; Vankan, D.; Bennett, P.; Paterson, M.; Phillips, C.J.C. Cat ownership perception and caretaking explored in an internet survey of people associated with cats. PLoS ONE 2015, 10, e0133293. [Google Scholar] [CrossRef] [PubMed]
- Lord, L.K. Attitudes toward and perceptions of free-roaming cats among individuals living in Ohio. JAVMA J. Am. Vet. Med. A 2008, 232, 1159–1167. [Google Scholar] [CrossRef] [PubMed]
- Zito, S.; Morton, J.; Paterson, M.; Vankan, D.; Bennett, P.C.; Rand, J.; Phillips, C.J.C. Cross-sectional study of characteristics of owners and nonowners surrendering cats to four Australian animal shelters. J. Appl. Anim. Welf. Sci. 2016, 19, 126–143. [Google Scholar] [CrossRef] [PubMed]
- Tan, K.; Rand, J.; Morton, J. Trap-neuter-return activities in urban stray cat colonies in Australia. Animals 2017, 7, 46. [Google Scholar] [CrossRef] [PubMed]
- Levy, J.K.; Isaza, N.M.; Scott, K.C. Effect of high-impact targeted trap-neuter-return and adoption of community cats on cat intake to a shelter. Vet. J. 2014, 201, 269–274. [Google Scholar] [CrossRef] [PubMed]
- Johnson, K.L.; Cicirelli, J. Study of the effect on shelter cat intakes and euthanasia from a shelter neuter return project of 10,080 cats from March 2010 to June 2014. PeerJ 2014, 2, 17. [Google Scholar] [CrossRef] [PubMed]
- Huang, L.; Coradini, M.; Rand, J.; Morton, J.; Albrecht, K.; Wasson, B.; Robertson, D. Search methods used to locate missing cats and locations where missing cats are found. Animals 2018, 8, 5. [Google Scholar] [CrossRef] [PubMed]
- Lord, L.K.; Witturn, T.E.; Ferketich, A.K.; Funk, J.A.; Rajala-Schultz, P.J. Search methods that people use to find owners of lost pets. JAVMA J. Am. Vet. Med. A 2007, 230, 1835–1840. [Google Scholar] [CrossRef] [PubMed]
- Pets for Life Program. Available online: http://www.humanesociety.org/assets/pdfs/pets/pets-for-life/pfl-report-0214.pdf (accessed on 17 November 2017).
- Sephar, D.D.; Wolf, P.J. The impact of an integrated program of return-to-field and targeted trap-neuter-return on feline intake and euthanasia at a municipal animal shelter. Animals 2018, 8, 55. [Google Scholar]
- RSPCA Queensland. Surrender Your Pet. Available online: https://www.rspcaqld.org.au/surrender (accessed on 10 December 2017).
- Maddies Fund. How to Start a Program to Keep Pets out of Shelters. Available online: http://chewonthis.maddiesfund.org/2015/09/how-to-start-a-program-to-keep-pets-out-of-shelters/ (accessed on 14 November 2017).
- Down Town Shelter Intervention Program (SIP). Available online: http://downtowndogrescue.org/programs/shelter-intervention-program/ (accessed on 29 March 2018).
- Weiss, E.; Garrison, L.; Drain, N.; Dolan, E.; Scarlett, J.M.; Zawistowski, S.L. Large dog relinquishment to two municipal facilities in New York City and Washington, D.C.: Identifying targets for intervention. Animals 2014, 4, 409–433. [Google Scholar] [CrossRef] [PubMed]
- Animal Welfare League of Australia, South Australia. Why Is There a Cost for Adoptions? Available online: https://awl.org.au/about-awl/about-us/faqs (accessed on 11 November 2017).
- Griffin, B. Prolific cats: The estrous cycle. Compend. Cont. Educ. Pract. Vet. 2001, 23, 1049–1053. [Google Scholar]
- Frank, J.M.; Carlisle-Frank, P.L. Analysis of programs to reduce overpopulation of companion animals: Do adoption and low-cost spay/neuter programs merely cause substitution of sources? Ecol. Econ. 2007, 62, 740–746. [Google Scholar] [CrossRef]
- White, S.C.; Jefferson, E.; Levy, J.K. Impact of publicly sponsored neutering programs on animal population dynamics at animal shelters: The New Hampshire and Austin experiences. J. Appl. Anim. Welf. Sci. 2010, 13, 191–212. [Google Scholar] [CrossRef] [PubMed]
- Serrano, S. Paediatric emergency and critical care 1. General principles. Practice 2014, 36, 58–62. [Google Scholar] [CrossRef]
- Knowx, H. Geek Chic Campaign Report; RSPCA Queensland: Deakin, Australia, 2016. [Google Scholar]
- Queensland Government. Microchipping Laws for the Sale of Cats and Dogs. Available online: https://www.business.qld.gov.au/industries/service-industries-professionals/service-industries/veterinary-surgeons/microchipping (accessed on 18 October 2017).
- Lancaster, E.; Rand, J.; Collecott, S.; Paterson, M. Problems associated with the microchip data of stray dogs and cats entering RSPCA queensland shelters. Animals 2015, 5, 332–348. [Google Scholar] [CrossRef] [PubMed]
- Rand, J.; Lancaster, E.; Marston, L.; Cluderay, C. A survey of Victorian municipalities to identify factors associated with reclaim, rehoming and euthanasia of dogs and cats. 2017; Unpublished work. [Google Scholar]
- Barnette, B. Foster Carers Save Lives. Available online: http://www.maddiesfund.org/foster-care-volunteers-are-lifesavers.htm?p=topic91 (accessed on 27 Feburary 2018).
- PetRescue. Petrescue Directory. Available online: https://www.petrescue.com.au/rescue-and-shelter-support (accessed on 17 October 2017).
- Animal Welfare League. Available online: http://www.awlqld.com.au/awlq-animals/pet-fostering/animal-foster (accessed on 17 October 2017).
- Ellis, J.J.; Stryhn, H.; Spears, J.; Cockram, M.S. Environmental enrichment choices of shelter cats. Behav. Process. 2017, 141, 291–296. [Google Scholar] [CrossRef] [PubMed]
- Stella, J.L.; Croney, C.C.; Buffington, C.T. Behavior and welfare of domestic cats housed in cages larger than us norm. J. Appl. Anim. Welf. Sci. 2017, 20, 296–312. [Google Scholar] [CrossRef] [PubMed]
- Patronek, G.J.; Crowo, A. Factors associated with high live release for dogs at a large, open-admission, municipal shelter. Animals 2018, 8, 45. [Google Scholar] [CrossRef] [PubMed]
- Hawes, S.; Kerrigan, J.; Morris, K. Factors informing outcomes for older cats and dogs in animal shelters. Animals 2018, 8, 36. [Google Scholar] [CrossRef] [PubMed]
- RSPCA Qld. Why Foster An Animal? Available online: https://www.rspcaqld.org.au/volunteer/foster (accessed on 10 October 2017).
- Victoria State Government. Animal Rescue. Available online: http://agriculture.vic.gov.au/pets/domestic-animal-businesses/shelters-and-pounds/animal-rescue (accessed on 10 October 2017).
- Gosling, L.; Stavisky, J.; Dean, R. What is a feral cat? Variation in definitions may be associated with different management strategies. J. Feline Med. Surg. 2013, 15, 759–764. [Google Scholar] [CrossRef] [PubMed]
- Department of Agriculture and Fisheries Biosecurity Queensland. Available online: https://www.daf.qld.gov.au/__data/assets/pdf_file/0004/61987/IPA-Feral-Cat-Ecology-PA26.pdf (accessed on 24 May 2018).
- Slater, M.; Garrison, L.; Miller, K.; Weiss, E.; Makolinski, K.; Drain, N.; Mirontshuk, A. Practical physical and behavioral measures to assess the socialization spectrum of cats in a shelter-like setting during a three day period. Animals 2013, 3, 1162–1193. [Google Scholar] [CrossRef] [PubMed]
- Slater, M.; Garrison, L.; Miller, K.; Weiss, E.; Drain, N.; Makolinski, K. Physical and behavioral measures that predict cats’ socialization in an animal shelter environment during a three day period. Animals 2013, 3, 1215–1228. [Google Scholar] [CrossRef] [PubMed]
- Slater, M.R.; Miller, A.K.; Weiss, E.; Makolinski, K.V.; Weisbrot, L.A.M. A survey of the methods used in shelter and rescue programs to identify feral and frightened pet cats. J. Feline Med. Surg. 2010, 12, 592–600. [Google Scholar] [CrossRef] [PubMed]
- Westman, M.E.; Paul, A.; Malik, R.; McDonagh, P.; Ward, M.P.; Hall, E.; Norris, J.M. Seroprevalence of feline immunodeficiency virus and feline leukaemia virus in Australia: Risk factors for infection and geographical influences (2011–2013). JFMS Open Rep. 2016, 2. [Google Scholar] [CrossRef] [PubMed]
- Malik, R.; Kendall, K.; Cridland, J.; Coulston, S.; Stuart, A.J.; Snow, D.; Love, D.N. Prevalences of feline leukaemia virus and feline immunodeficiency virus infections in cats in Sydney. Aust. Vet. J. 1997, 75, 323–327. [Google Scholar] [CrossRef] [PubMed]
- Burling, A.N.; Levy, J.K.; Scott, H.M.; Crandall, M.M.; Tucker, S.J.; Wood, E.G.; Foster, J.D. Seroprevalences of feline leukemia virus and feline immunodeficiency virus infection in cats in the United States and Canada and risk factors for seropositivity. JAVMA J. Am. Vet. Med. A 2017, 251, 187–194. [Google Scholar] [CrossRef] [PubMed]
- Westman, M.E.; Malik, R.; Hall, E.; Sheehy, P.A.; Norris, J.M. Determining the feline immunodeficiency virus (FIV) status of FIV-vaccinated cats using point-of-care antibody kits. Comp. Immunol. Microbiol. Infect. Dis. 2015, 42, 43–52. [Google Scholar] [CrossRef] [PubMed]
- Levy, J.; Crawford, C.; Hartmann, K.; Hofmann-Lehmann, R.; Little, S.; Sundahl, E.; Thayer, V. 2008 American association of feline practitioners feline retrovirus management guidelines. J. Feline Med. Surg. 2008, 10, 300–316. [Google Scholar] [CrossRef] [PubMed]
- Sephar, D.D.; Wolf, P.J. An examination of an iconic trap-neuter-return program: The Newburyport, Massachusetts case study. Animals 2017, 7, 81. [Google Scholar]


| Source | Distribution of Admissions | % Rehomed by Day 90 | ||||||
|---|---|---|---|---|---|---|---|---|
| 2011 (n = 13,911) | 2016 (n = 13,220) | Percentage Change a | 2011 (n = 12,372) | 2016 (n = 10,954) | Risk Ratio b | 95% CI | p | |
| Stray | 31% (4295) | 31% (4144) | −4% | 31% (1246/3957) | 76% (2721/3601) | 0.83 | 0.81 to 0.85 | <0.001 |
| Owner surrender | 30% (4221) | 16% (2075) | −51% | 44% (1774/3993) | 89% (1641/1845) | Reference group | ||
| Council contracts | 20% (2715) | 19% (2492) | −8% | 29% (707/2404) | 82% (1766/2155) | 0.88 | 0.86 to 0.90 | <0.001 |
| Transfer in | 5% (679) | 12% (1553) | 129% | 58% (317/550) | 92% (1216/1328) | 1.02 | 1.00 to 1.05 | 0.024 |
| Ambulance | 5% (682) | 9% (1209) | 77% | 16% (96/598) | 43% (460/1059) | 0.47 | 0.44 to 0.50 | <0.001 |
| Humane officer | 3% (436) | 4% (521) | 19% | 35% (131/371) | 75% (349/463) | 0.84 | 0.80 to 0.88 | <0.001 |
| Euthanasia request ^ | 3% (413) | 2% (226) | −45% | 0% (0/395) | 31% (61/199) | 0.19 | 0.15 to 0.24 | <0.001 |
| Return | 1% (179) | 4% (517) | 189% | 62% (64/104) | 70% (213/304) | 0.82 | 0.77 to 0.87 | <0.001 |
| Shelter offspring | 1% (110) | 4% (278) | 153% | |||||
| Dead on arrival | 0% (61) | 1% (100) | 64% | |||||
| Emergency boarding | 0% (50) | 1% (80) | 60% | |||||
| Bequest in shelter | 0% (25) | 0% (20) | −20% | |||||
| Evacuation | 0% (70) | 0% (0) | −100% | |||||
| Total | 100% (13,911) | 100% (13,220) | −5% | |||||
| Factors | Distribution of Admissions | % Rehomed by Day 90 | ||
|---|---|---|---|---|
| 2011 (n = 13,911) | 2016 (n = 13,220) | 2011 (n = 12,372) | 2016 (n = 10,954) | |
| Sex | ||||
| Female | 53% (6619) | 50% (6414) | 39% (2252/5840) | 82% (4338/5271) |
| Male | 47% (5868) | 50% (6362) | 40% (2082/5143) | 77% (4082)/5271 |
| Not recorded | (1424) | (444) | 0% (1/1389) | 2% (7/412) |
| Desexed status at admission | ||||
| Entire | 77% (9165) | 73% (9116) | 42% (3543/8523) | 82% (6727/8158) |
| Desexed | 23% (2807) | 27% (3417) | 38% (789/2052) | 78% (1698/2173) |
| Not recorded | (1939) | (687) | 0% (3/1797) | 0% (2/623) |
| Feral status at admission | ||||
| Not feral * | 92% (12,757) | 99% (13,048) | 38% (4306/11,228) | 78% (8374/10,801) |
| Feral | 8% (1154) | 1% (172) | 3% (29 #/1144) # | 35% (53 #/153) # |
| Distribution of Admissions | |||||||
|---|---|---|---|---|---|---|---|
| Age | 2011 (n = 13,911) | 2016 (n = 13,220) | 2011 (n = 12,372) | 2016 (n = 10,954) | Risk Ratio # | 95% CI | p |
| <4 weeks | 10% (860) | 10% (1190) | 42% (335/790) | 66% (682/1036) | Reference group | ||
| 4 to <7 weeks | 23% (1947) | 15% (1720) | 60% (1114/1860) | 91% (1447/1595) | 1.39 | 1.34 to 1.45 | <0.001 |
| 7 to <17 weeks | 23% (1945) | 21% (2493) | 75% (1302/1735) | 95% (2156/2263) | 1.49 | 1.43 to 1.55 | <0.001 |
| 17 weeks to <1 year | 18% (1531) | 22% (2596) | 62% (764/1227) | 91% (1897/2081) | 1.41 | 1.35 to 1.47 | <0.001 |
| 1 to <2 years | 7% (604) | 10% (1224) | 66% (301/454) | 91% (851/936) | 1.41 | 1.35 to 1.48 | <0.001 |
| 2 to <7 years | 13% (1106) | 16% (1874) | 45% (360/804) | 80% (1063/1325) | 1.20 | 1.15 to 1.26 | <0.001 |
| 7 years or older | 4% (311) | 5% (627) | 17% (38/229) | 44% (189/425) | 0.61 | 0.55 to 0.68 | <0.001 |
| Not recorded | (5607) | (1496) | 2% (121/5273) | 11% (142/1293) | |||
| Total | 100% (13,911) | 100% (13,220) | 35% (4335/12,372) | 77% (8427/10,594) | |||
| Outcome | 2011 | 2016 | ||
|---|---|---|---|---|
| Number of Admissions | % of Admissions 1 | Number of Admissions | % of Admissions 1 | |
| Reclaimed | 644 | 4.9% | 663 | 5.4% |
| Rehomed | 4510 | 34.0% | 8996 | 73.6% |
| Euthanized | 7656 | 57.8% | 1826 | 14.9% |
| Transferred to rescue group | 206 | 1.6% | 279 | 2.3% |
| Died before released | 193 | 1.5% | 386 | 3.2% |
| Other (escaped or stolen) | 43 | 0.3% | 78 | 0.6% |
| In care (admission not resolved by day 90) | 659 | 992 | ||
| Total | 13,911 | 100.0% | 13,220 | 100.0% |
| Outcome | 2011 | 2016 | ||
|---|---|---|---|---|
| Number of Admissions | % of Admissions 1 | Number of Admissions | % of Admissions 1 | |
| Reclaimed | 32 | 1.4% | 29 | 0.7% |
| Rehomed | 1941 | 87.2% | 3472 | 88.5% |
| Euthanized | 192 | 8.6% | 261 | 6.6% |
| Transferred to rescue group | 14 | 0.5% | 23 | 0.6% |
| Died before released | 34 | 1.5% | 121 | 3.1% |
| Other | 12 | 0.5% | 19 | 0.5% |
| In care (admission not resolved by day 90) | 354 | 536 | ||
| Total | 2579 | 100.0% | 4461 | 100.0% |
| Reason for Euthanasia | 2011 | 2016 | ||
|---|---|---|---|---|
| Number Euthanized | % of All Euthanized | Number Euthanized | % of All Euthanized | |
| Medical/Surgical | 2454 | 32.1% | 1252 | 68.5% |
| Cat flu | 920 | 12.0% | 128 | 7.0% |
| Humane grounds ^ | 434 | 5.6% | 971 | 34.3% |
| Ringworm | 328 | 4.3% | 4 | 0.2% |
| Injured | 195 | 2.5% | 35 | 1.9% |
| Cat flu exposure | 160 | 2.1% | 1 | 0.1% |
| FIV-positive | 87 | 1.1% | 316 | 17.3% |
| Idiopathic alopecia | 84 | 1.1% | 2 | 0.1% |
| Tick paralysis | 67 | 0.9% | 2 | 0.1% |
| Dental disease | 30 | 0.4% | 2 | 0.1% |
| Malignant neoplasia | 28 | 0.4% | 32 | 1.8% |
| Neuropathy | 14 | 0.2% | 44 | 2.4% |
| Orthopedic disease | 14 | 0.2% | 18 | 1.0% |
| Obese | 11 | 0.1% | 0 | 0.0% |
| Cardiac disease | 10 | 0.1% | 18 | 1.0% |
| Ocular disorder/disease/blind | 9 | 0.1% | 4 | 0.2% |
| Failed treatment | 9 | 0.1% | 0 | 0.0% |
| Deaf | 8 | 0.1% | 0 | 0.0% |
| Paralysis | 8 | 0.1% | 5 | 0.3% |
| Demodex | 7 | 0.1% | 0 | 0.0% |
| Flea bite allergy | 7 | 0.1% | 0 | 0.0% |
| Incontinence | 6 | 0.1% | 1 | 0.1% |
| Lack of pigmentation | 4 | 0.1% | 0 | 0.0% |
| Spinal trauma | 3 | 0.0% | 9 | 0.5% |
| Chronic ear infection | 3 | 0.0% | 0 | 0.0% |
| Excessive scarring | 3 | 0.0% | 1 | 0.1% |
| Ear mites | 2 | 0.0% | 0 | 0.0% |
| Head trauma | 2 | 0.0% | 0 | 0.0% |
| Heartworm positive | 1 | 0.0% | 0 | 0.0% |
| Hyper reactivity to stimuli | 0 | 0.0% | 4 | 0.2% |
| Age/Shelter Number Related | 2308 | 30.1% | 32 | 1.8% |
| Shelter was full | 765 | 10.0% | 0 | 0.0% |
| Too young (i.e., <6 weeks) or under 500 g | 723 | 9.5% | 7 | 0.4% |
| Unweaned kittens | 393 | 5.1% | 15 | 0.8% |
| Geriatric | 234 | 3.1% | 10 | 0.5% |
| Too many kittens 6–8 weeks | 121 | 1.6% | 0 | 0.0% |
| Too many kittens 8–12 weeks | 72 | 0.9% | 0 | 0.0% |
| Behavioral & Feral | 2771 | 36.2% | 393 | 21.6% |
| Feral | 1178 # | 15.4% | 132 # | 7.2% |
| Under-socialized—not Coping | 426 | 5.6% | 89 | 4.9% |
| Timid/fearful/anxious | 347 | 4.6% | 43 | 2.3% |
| Aggression towards humans | 316 | 4.1% | 112 | 6.1% |
| Inter-cat aggression | 200 | 2.6% | 0 | 0.0% |
| Inappropriate toileting | 193 | 2.5% | 0 | 0.0% |
| Untrustworthy | 39 | 0.5% | 10 | 0.5% |
| Behavioral: general | 33 | 0.4% | 0 | 0.0% |
| Redirected aggression | 13 | 0.2% | 6 | 0.3% |
| Over grooming | 10 | 0.1% | 0 | 0.0% |
| Escape behavior | 8 | 0.1% | 0 | 0.0% |
| Compulsive, obsessive, stereotypic | 3 | 0.0% | 0 | 0.0% |
| Excessive vocalization | 3 | 0.0% | 0 | 0.0% |
| Aggression towards dogs | 2 | 0.0% | 0 | 0.0% |
| Idiopathic aggression | 0 | 0.0% | 1 | 0.1% |
| Miscellaneous | 123 | 1.6% | 150 | 8.3% |
| Other | 97 | 1.3% | 0 | 0.0% |
| Owner -requested euthanasia | 26 | 0.3% | 149 | 8.2% |
| Council admission | 0 | 0.0% | 1 | 0.1% |
| Total | 7656 | 100.0% | 1826 | 100.0% |
© 2018 by the authors. Licensee MDPI, Basel, Switzerland. This article is an open access article distributed under the terms and conditions of the Creative Commons Attribution (CC BY) license (http://creativecommons.org/licenses/by/4.0/).
Share and Cite
Kerr, C.A.; Rand, J.; Morton, J.M.; Reid, R.; Paterson, M. Changes Associated with Improved Outcomes for Cats Entering RSPCA Queensland Shelters from 2011 to 2016. Animals 2018, 8, 95. https://doi.org/10.3390/ani8060095
Kerr CA, Rand J, Morton JM, Reid R, Paterson M. Changes Associated with Improved Outcomes for Cats Entering RSPCA Queensland Shelters from 2011 to 2016. Animals. 2018; 8(6):95. https://doi.org/10.3390/ani8060095
Chicago/Turabian StyleKerr, Caroline Audrey, Jacquie Rand, John Murray Morton, Ronelle Reid, and Mandy Paterson. 2018. "Changes Associated with Improved Outcomes for Cats Entering RSPCA Queensland Shelters from 2011 to 2016" Animals 8, no. 6: 95. https://doi.org/10.3390/ani8060095
APA StyleKerr, C. A., Rand, J., Morton, J. M., Reid, R., & Paterson, M. (2018). Changes Associated with Improved Outcomes for Cats Entering RSPCA Queensland Shelters from 2011 to 2016. Animals, 8(6), 95. https://doi.org/10.3390/ani8060095