
Application of Infrared Thermography in the Detection of Hoof Disease and Lameness in Cattle

 , , , , , and
Simple Summary
Abstract
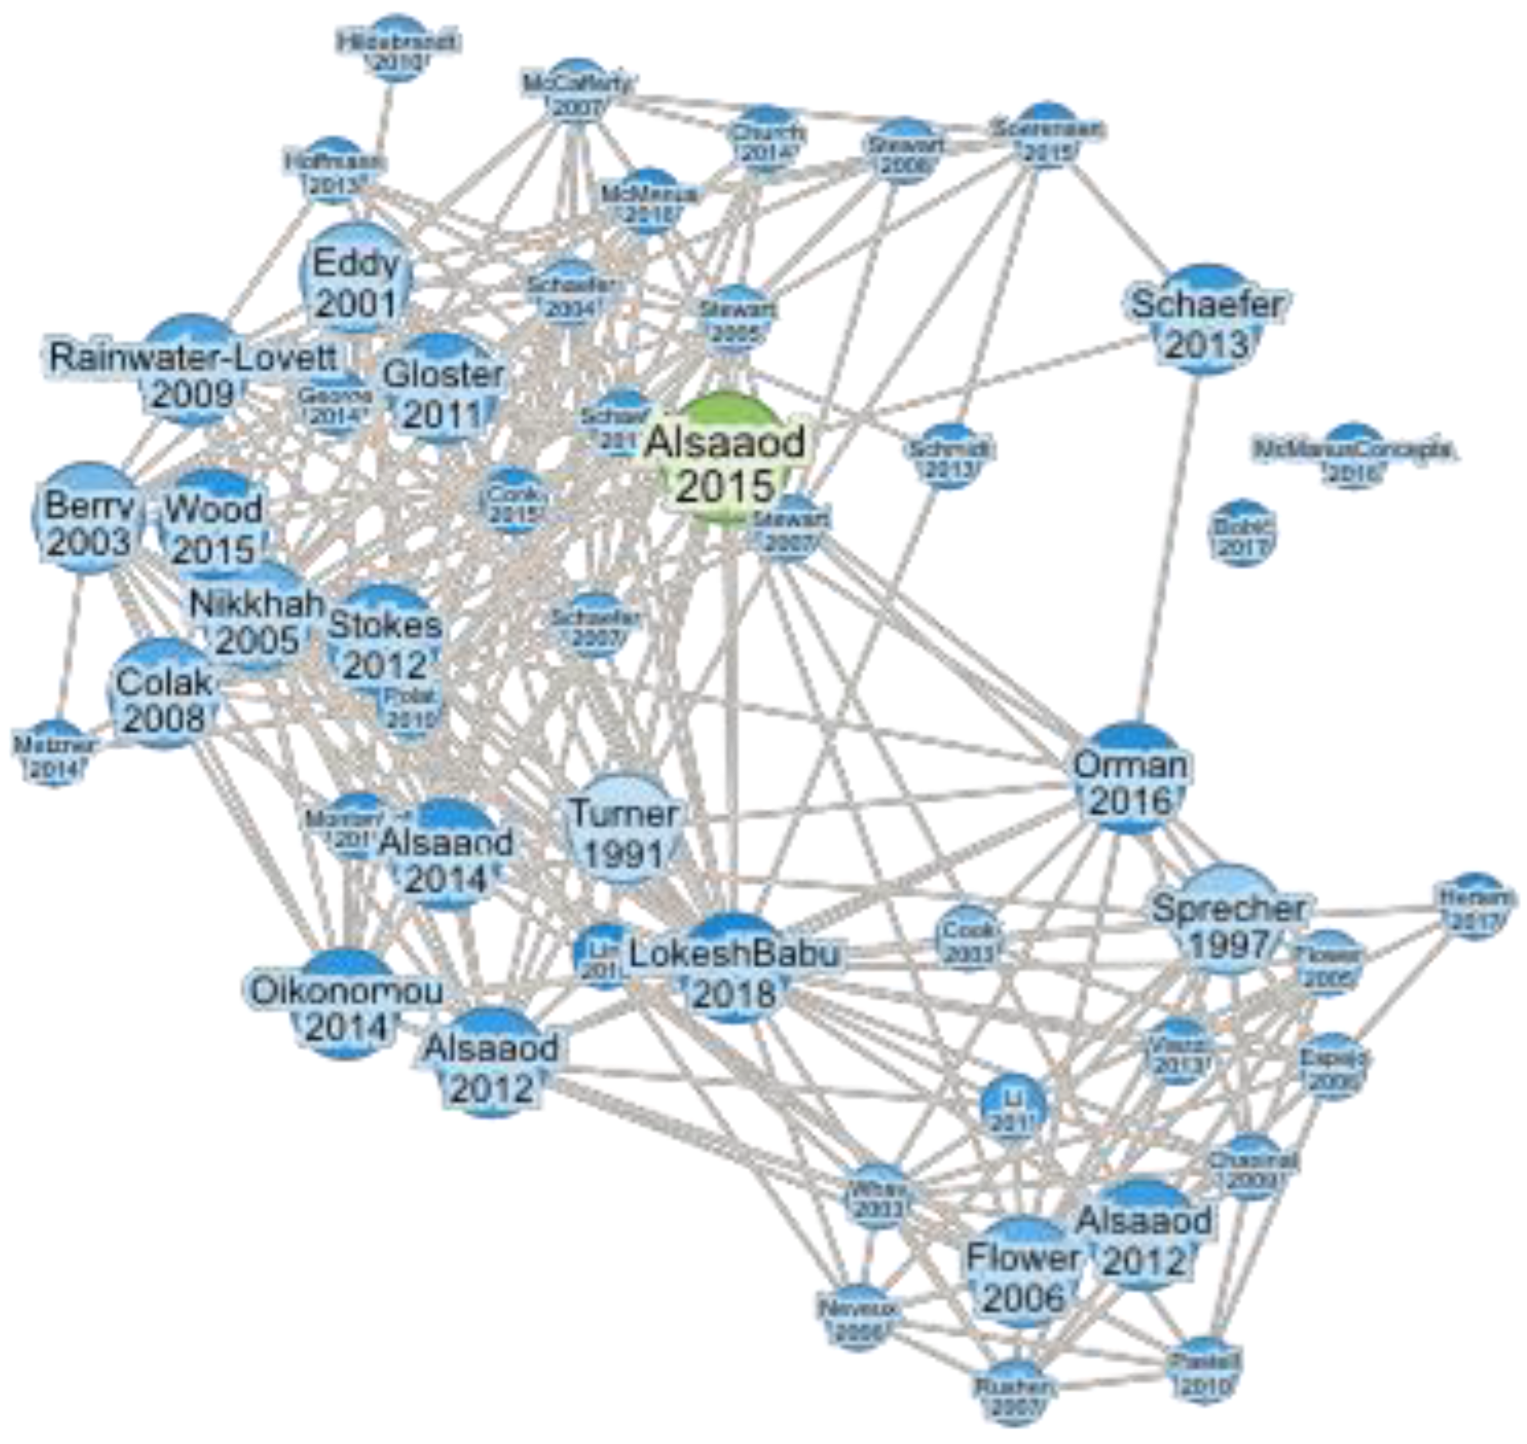
1. Introduction
2. Material and Methods
- -
- The main research results regarding what was measured, how it was measured, which equipment was used, and what type of data was presented;
- -
- The main influences on the IRT readings;
- -
- The special considerations for infrared thermography and future research.
3. Potential Applications and the Justification for Using Infrared Thermography
4. Results of Current Applications of Infrared Thermography
4.1. Infrared Equipment
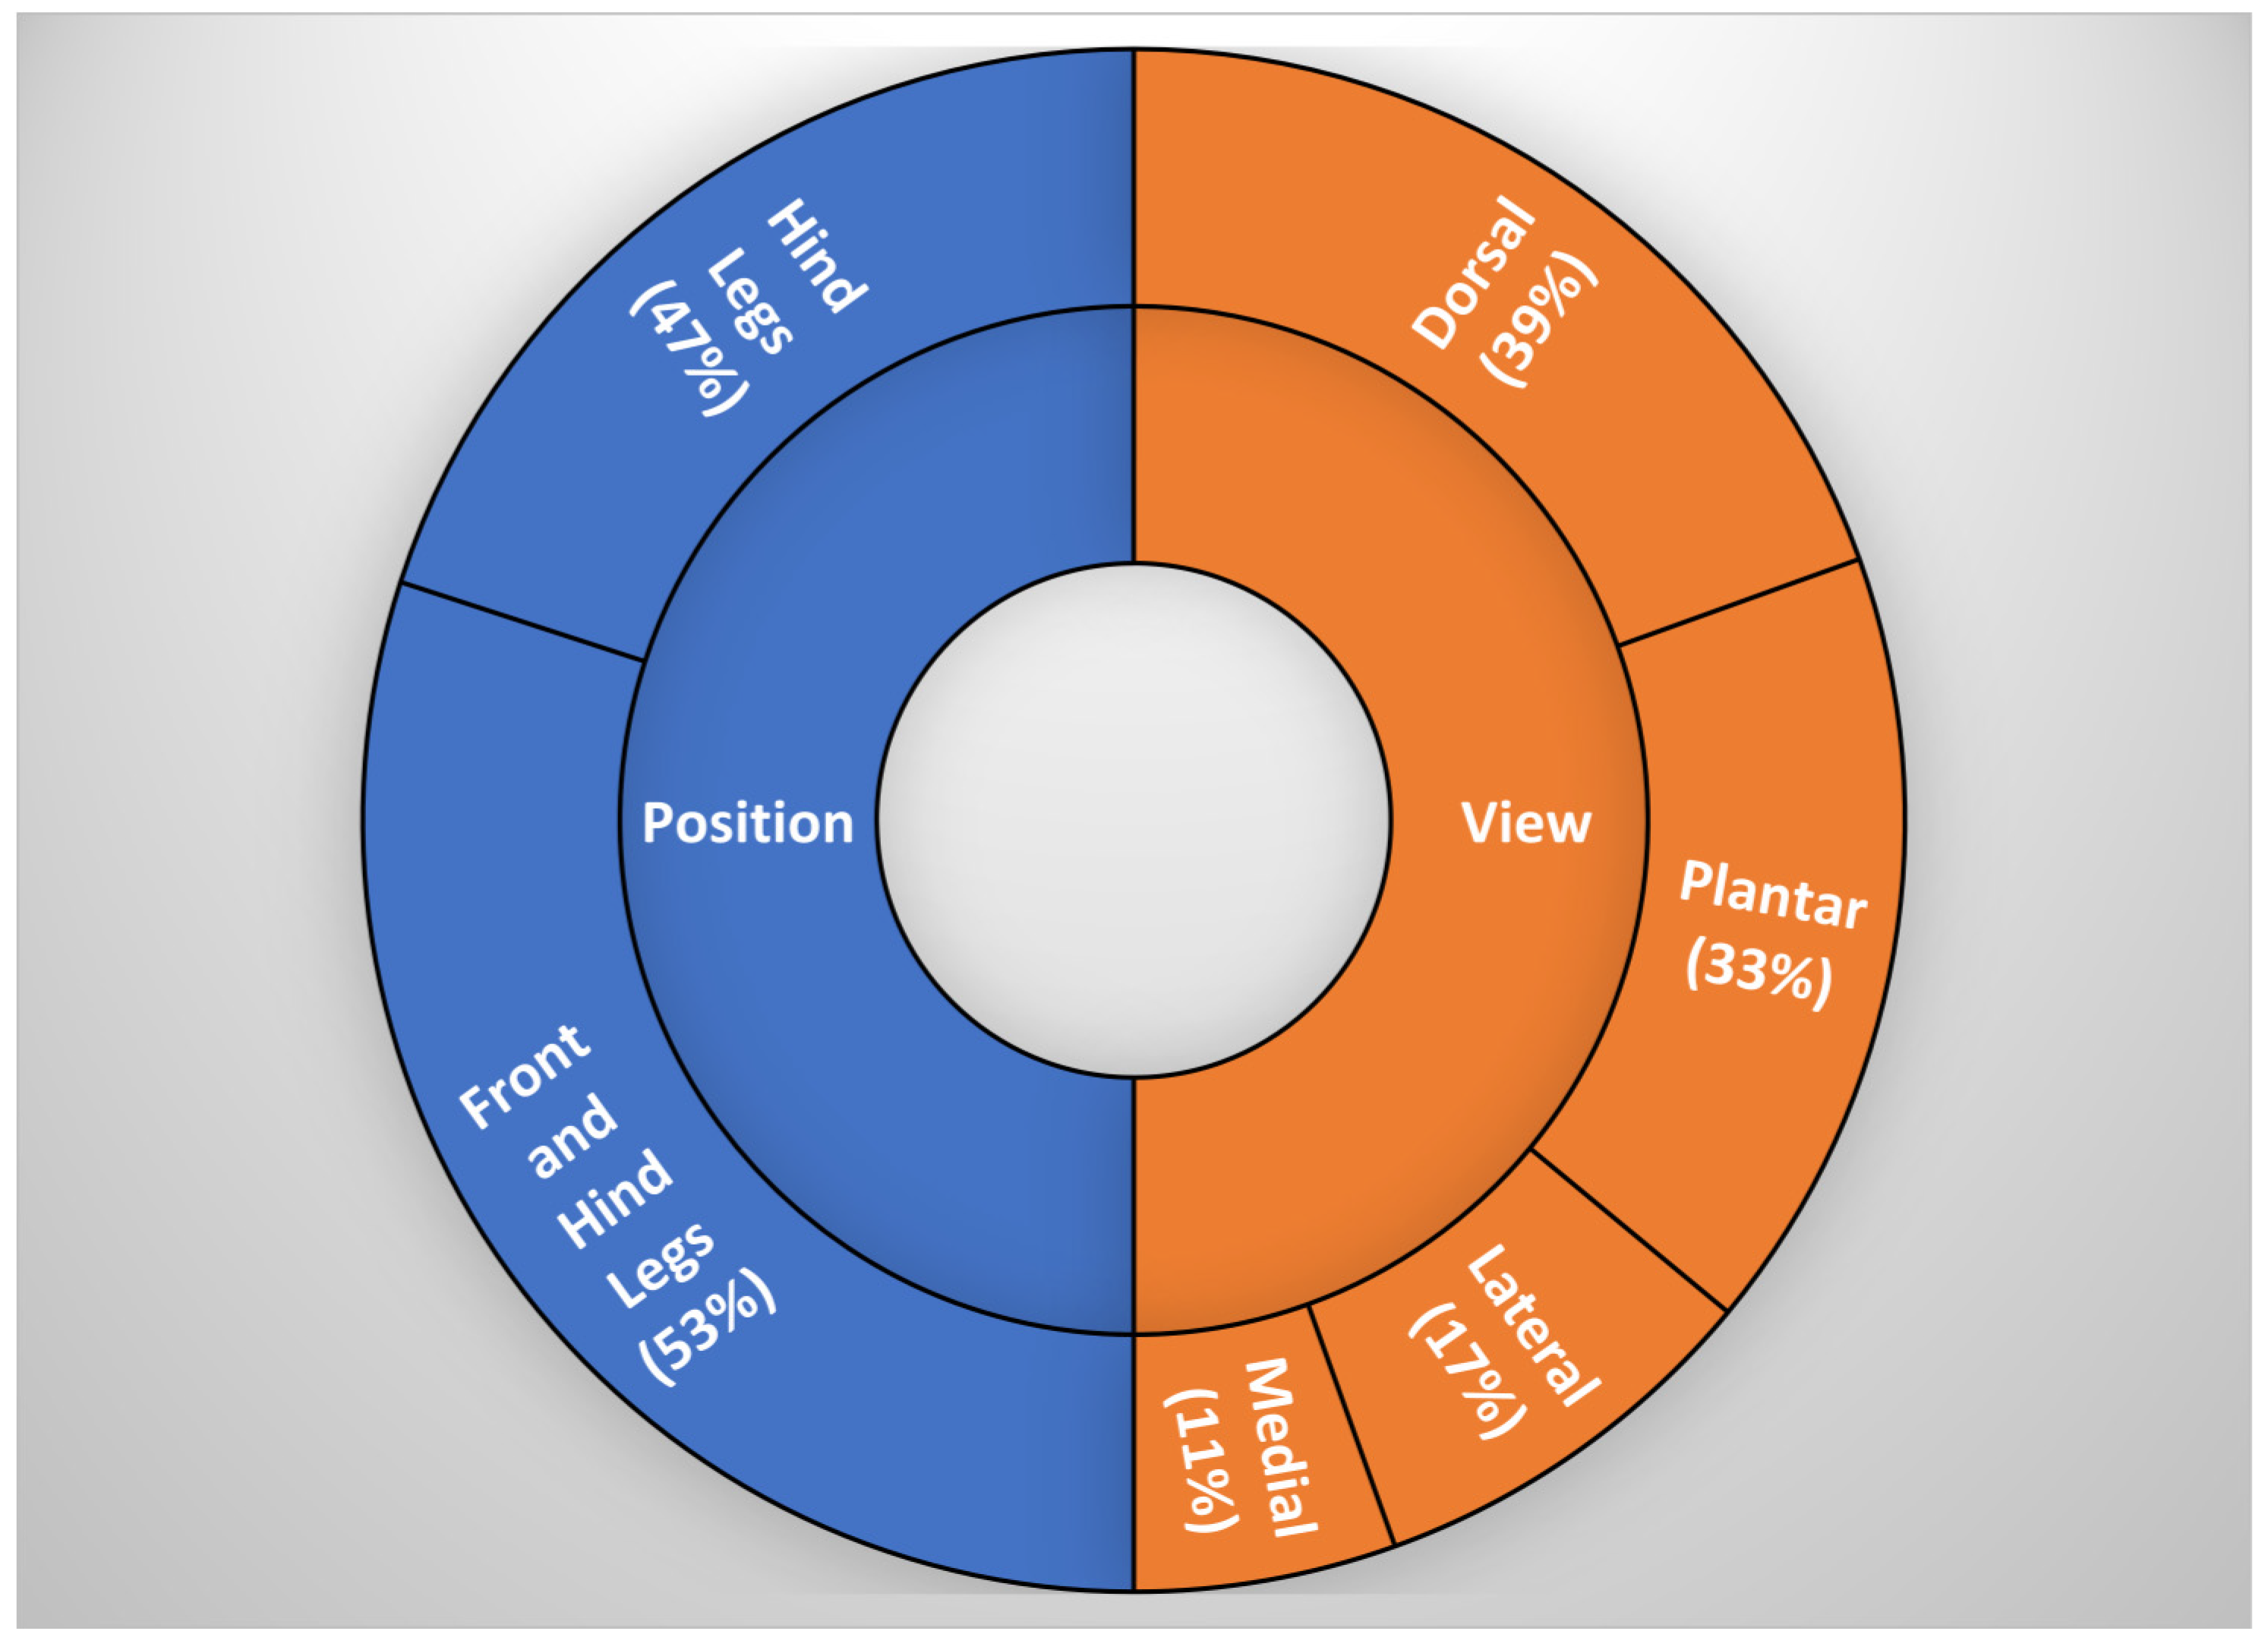
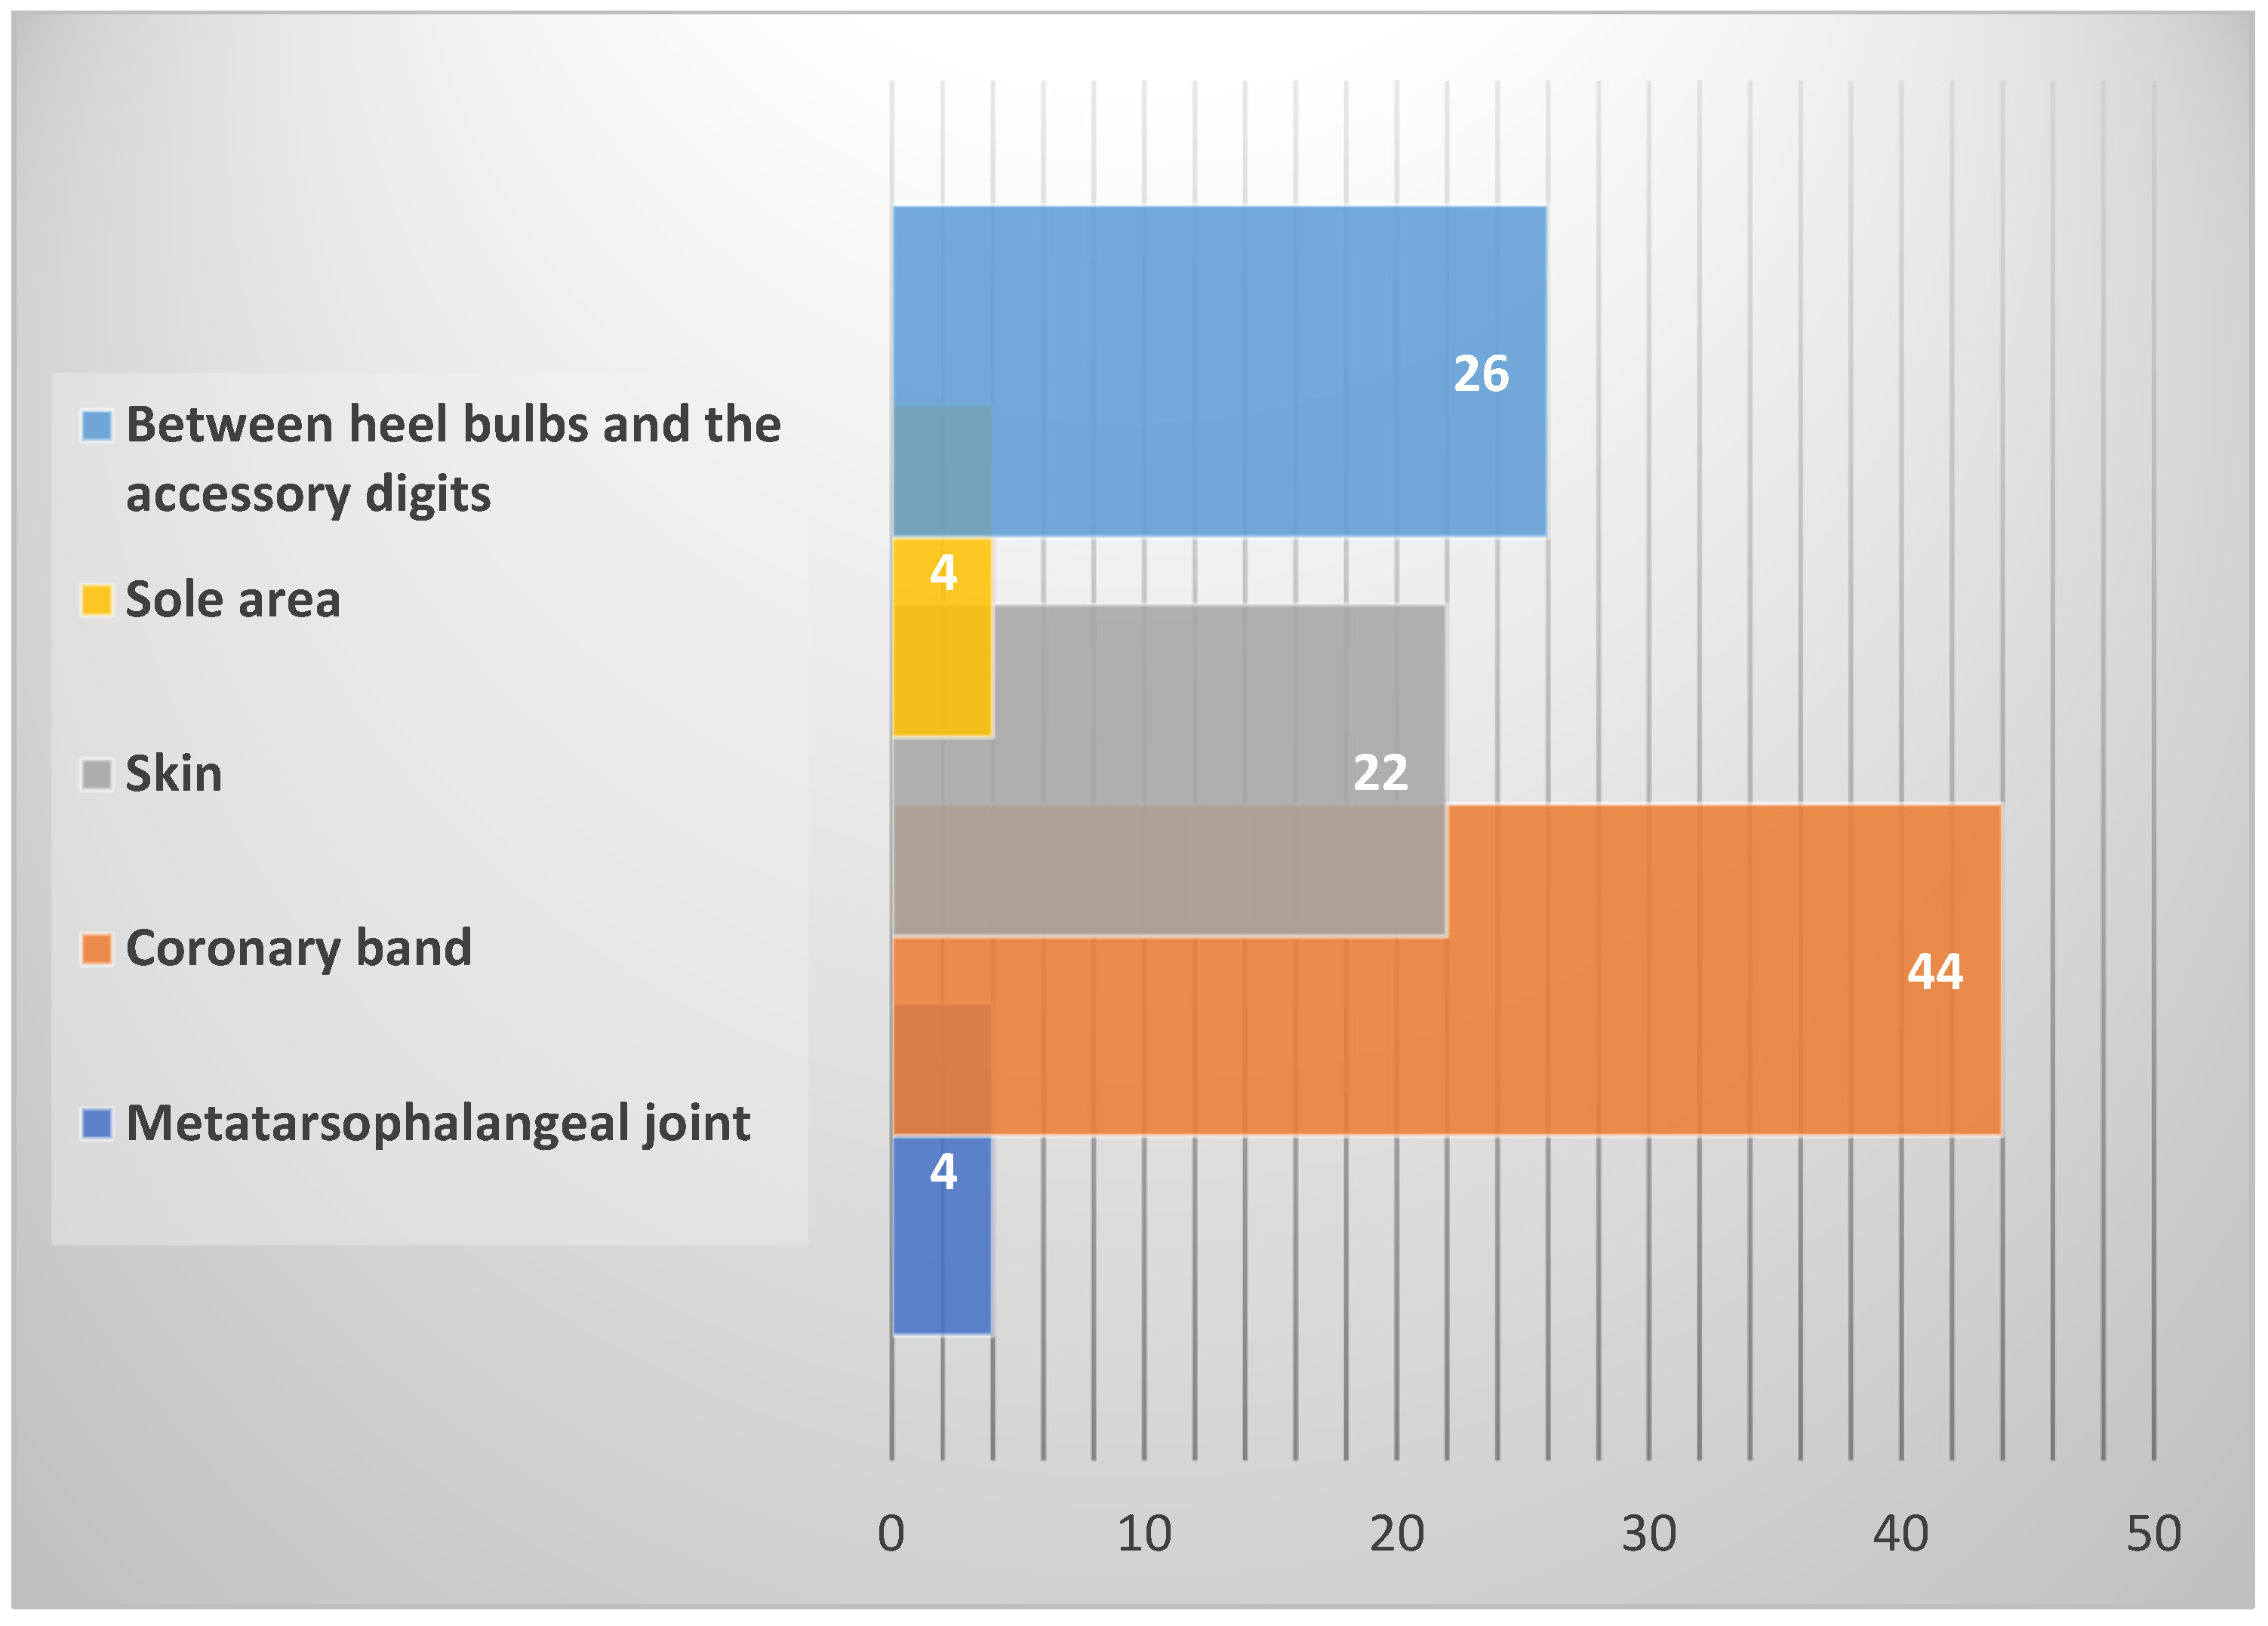
4.2. Leg Position, Measuring Point and View
4.3. Measuring Values

| References | Infrared Equipment | Measurement Point | Leg Position | Measurement View | Distance (m) |
|---|---|---|---|---|---|
| Cockcroft et al. (2000) [26] | IR Camera | Metatarsophalangeal joint | front and hind legs | Lateral, medial, plantar, dorsal | - |
| Nikkhah et al. (2005) [27] | IR Camera | Coronary band and skin | front and hind legs | Dorsal | 1.50–2.00 |
| Rainwater-Lovett et al. (2009) [29] | IR Camera × 2 | Coronary band | front and hind legs | Dorsal | 1.50–2.00 |
| Gloster et al. (2011) [30] | IR Camera | Coronary band | front and hind legs | Lateral, medial, plantar, dorsal | 1.00–2.00 |
| Alsaaod and Büscher (2012) [31] | IR Camera | Coronary band and skin | hind legs | Dorsal | 0.50 |
| Wilhelm et al. (2015) [33] | IR Camera | Sole area for lateral and medial claws | front and hind legs | - | 0.30 |
| Alsaaod et al. (2015) [19] | IR Camera | Coronary band and skin | front and hind legs | Lateral, medial | 0.50 |
| Bobić et al. (2017) [38] | IR Camera | Coronary band | front and hind legs | Dorsal | 1.00 |
| Bobić et al. (2018) [28] | IR Camera | Coronary band | front and hind legs | Dorsal | 1.00 |
| Werema et al. (2021) [41] | IR Camera | Coronary band, skin, interdigital | hind legs | Dorsal | 1.00 |
| Coe and Blackie (2022) [35] | IR Camera × 2 | Between the heel bulbs and the accessory digits | hind legs | Plantar | 0.50 |
| Chiu and Hsu (2022) [40] | IR Camera | Coronary band and between the heel bulbs | front and hind legs | Lateral, dorsal | 1.00 |
| Werema et al. (2023) [42] | IR Camera | Coronary band, skin, interdigital | hind legs | Dorsal | 1.00 |
| Vanhoudt et al. (2023) [36] | IR Camera | Cleft between the heel bulbs | hind legs | Plantar | 0.50 |
| Bobić et al. (2024) [48] | IR Camera | Coronary band and skin | front and hind legs | Dorsal | 1.00 |
| Feighelstein et al. (2024) [49] | IR Camera | Coronary band between the heel bulbs and the accessory digits | hind legs | Dorsal | 0.35 |
| Main et al. (2012) [43] | IR Thermometer | Between the heel bulbs and the accessory digits | hind legs | Plantar | 0.15 |
| Wood et al. (2015) [32] | IR Thermometer | Between the heel bulbs and the accessory digits | hind legs | Plantar | 0.15 |
| Lin et al. (2018) [34] | IR Thermometer | Between the heel bulbs and the accessory digits | hind legs | Plantar | 0.15 |
| References | Measurement Point | Mean Range in Temperature (C°) | ΔT | Cut-Off Value (C°) | SE (%) | SP (%) |
|---|---|---|---|---|---|---|
| Cockcroft et al. (2000) [26] | Metatarsophalangeal joint | 21.70–31.60 | - | - | - | - |
| Nikkhah et al. (2005) [27] | Coronary band and skin | 21.00–25.40 | 3.3–6.10 | - | - | - |
| Rainwater-Lovett et al. (2009) [29] | Coronary band | 23.10–42.30 | - | 34.40 | 61.1 | 87.7 |
| Gloster et al. (2011) [30] | Coronary band | 10.00–36.00 | - | 30.50 (75th percentile) | 70.0 30.0 | 79.0 94.0 |
| 34.90 (90th percentile) | ||||||
| 37.60 (95th percentile) | ||||||
| Alsaaod and Büscher (2012) [31] | Coronary band and skin | - | - | CB: 0.64 *(before trimming) CB: 1.09 (after trimming) | 85.7 80.0 | 55.9 82.9 |
| S:1.90 *(before trimming) S:2.91 (after trimming) | 100.0 40.0 | 29.4 100.0 | ||||
| ΔT: 0.63 (before trimming) ΔT: 0.73 (after trimming) | 85.7 93.3 | 35.3 68.2 | ||||
| Wilhelm et al. (2015) [33] | Sole area of lateral and medial claws | 19.52–19.95 hind feet (1st week postpartum) 17.84–17.90 front feet (1st week postpartum) 19.45–20.25 hind feet (8th week postpartum) 17.12–17.46 front feet (8th week postpartum) | - | - | - | - |
| Alsaaod et al. (2015) [50] | Coronary band and skin | - | ≥0.25 hind feet ≤0.13 front feet | - | - | - |
| Bobić et al. (2017) [38] | Coronary band | 16.00–21.35 (non-lesioned feet) 18.12–27.28 (lesioned feet) | - | - | - | - |
| Werema et al. (2021) [41] | Coronary band, skin, interdigital | 34.88–35.48 | - | 34.50 (for all meas. points) 35.10 (CB) 35.10 (skin above the CB) 35.10 (skin below the CB) | 92.40 85.40 95.70 82.20 | 80.00 76.70 60.00 83.30 |
| Coe and Blackie (2022) [35] | Between the heel bulbs and the accessory digits | 18.26–26.31 (low-cost IR camera) 21.82–26.72 (high-cost IR camera | - | 2.40 1.85 | 64.41 66.95 69.49 70.34 | 64.53 61.08 66.01 70.94 |
| Chiu and Hsu (2022) [40] | Coronary band and between the heel bulbs | 31.4–31.70 (non-lesioned feet, farm A) 33.8–34.10 (lesioned feet, farm A) 30.0–30.10 (non-lesioned feet, farm B) 33.5–33.70 (lesioned feet, farm B) | - | >32.05 (95th anterior, farm A) >31.45 (95th posterior, farm A) >31.25 (95th lateral, farm A) >32.05 (95th anterior, farm B) >31.45 (95th posterior, farm B) >31.25 (95th lateral, farm B) | 95.45 93.18 96.02 96.41 92.31 94.87 | 24.00 22.67 21.33 14.29 30.36 21.43 |
| Werema et al. (2023) [42] | Coronary band, skin, interdigital | 37.02–38.29 | - | 38.00 (for all meas. points) 38.90 (interdigital) 38.60 (CB) 38.10 (skin above the CB) 38.70 (skin below the CB) | 86.00 79.80 82.50 96.80 93.90 | 73.20 71.40 75.00 69.60 64.30 |
| Vanhoudt et al. (2023) [36] | Cleft between the heel bulbs | 29.7–32.1 (unwashed feet) 29.9–32.1 (washed feet) | - | ≥31.0 | - | - |
| Bobić et al. (2024) [48] | Coronary band and skin | 24.5–26.6 (coronary band) 24.2–26.6 (skin) | - | - | - | - |
| Main et al. (2012) [43] * | Between the heel bulbs and the accessory digits | 17.2–28.7 (non-lesioned feet) 21.2–37.3 (lesioned feet) | - | 25.25 | 78 | 78 |
| Wood et al. (2015) [32] * | Between the heel bulbs and the accessory digits | 24.0–26.1 | - | - | - | - |
| Lin et al. (2018) [34] * | Between the heel bulbs and the accessory digits | 21.5–25.9 (non-lesioned feet) 22.2–26.9 (lesioned feet) | - | 23.30 | 78.5 | 39.2 |
5. Main Influences on the Infrared Thermography Readings
5.1. Infrared Maximum Temperatures
5.2. Presence of Foot Lesions and Lameness Score
5.3. Environmental Condition and Metabolic Status
5.4. Spot Size, Distance and Emissivity Errors
6. Special Considerations for Infrared Thermography and Future Research
- ➢
- The measuring view is important and significantly affects the temperature values of the cow’s feet. Images taken from the lateral, medial, or rear views have a temperature lower by around 1 °C than those taken from a front view.
- ➢
- The leg position also significantly affects foot temperature; the rear legs have higher temperature values than the front legs. Additionally, temperature differences exist between the front and hind legs’ lateral and medial sides.
- ➢
- The parity does not have a significant impact on the temperature of the coronary band for cows with lesions, but the stage of lactation has a strong influence on the tissue changes on cow’s feet.
- ➢
- The presence of disease or some inflammation on the feet also has an impact on the temperature values of the cow’s feet. However, the determination of specific lesions cannot be identified by temperature difference.
- ➢
- The lameness and lameness score show a positive correlation with the surface temperature of the feet.
- ➢
- The ambient temperature positively correlates with the surface temperature of the feet.
7. Conclusions
Author Contributions
Funding
Informed Consent Statement
Data Availability Statement
Acknowledgments
Conflicts of Interest
Abbreviations
| EFSA | Panel on Animal Health and Animal Welfare of the European Food Safety Authority |
| IRT | Infrared thermography |
| CB | Coronary band |
| S | Skin above the coronary band |
| ΔT | Difference in temperature between the coronary band and skin |
| IRTmax | Infrared maximum temperatures |
References
- Robcis, R.; Ferchiou, A.; Berrada, M.; Ndiaye, Y.; Herman, N.; Lhermie, G.; Raboisson, D. Cost of Lameness in Dairy Herds: An Integrated Bioeconomic Modeling Approach. J. Dairy Sci. 2023, 106, 2519–2534. [Google Scholar] [CrossRef]
- Thomsen, P.T.; Shearer, J.K.; Houe, H. Prevalence of Lameness in Dairy Cows: A Literature Review. Vet. J. 2023, 295, 105975. [Google Scholar] [CrossRef]
- Schlageter Tello, A. Performance of Raters to Assess Locomotion in Dairy Cattle. Ph.D. Thesis, Wageningen University, Wageningen, The Netherlands, 2015. ISBN 978-94-6257-275-1. [Google Scholar]
- Van Nuffel, A.; Zwertvaegher, I.; Van Weyenberg, S.; Pastell, M.; Thorup, V.; Bahr, C.; Sonck, B.; Saeys, W. Lameness Detection in Dairy Cows: Part 2. Use of Sensors to Automatically Register Changes in Locomotion or Behavior. Animals 2015, 5, 861–885. [Google Scholar] [CrossRef]
- Sprecher, D.J.; Hostetler, D.E.; Kaneene, J.B. A Lameness Scoring System That Uses Posture and Gait to Predict Dairy Cattle Reproductive Performance. Theriogenology 1997, 47, 1179–1187. [Google Scholar] [CrossRef]
- Džermeikaitė, K.; Bačėninaitė, D.; Antanaitis, R. Innovations in Cattle Farming: Application of Innovative Technologies and Sensors in the Diagnosis of Diseases. Animals 2023, 13, 780. [Google Scholar] [CrossRef]
- Myint, B.B.; Onizuka, T.; Tin, P.; Aikawa, M.; Kobayashi, I.; Zin, T.T. Development of a Real-Time Cattle Lameness Detection System Using a Single Side-View Camera. Sci. Rep. 2024, 14, 13734. [Google Scholar] [CrossRef] [PubMed]
- Viazzi, S.; Bahr, C.; Schlageter-Tello, A.; Van Hertem, T.; Romanini, C.E.B.; Pluk, A.; Halachmi, I.; Lokhorst, C.; Berckmans, D. Analysis of Individual Classification of Lameness Using Automatic Measurement of Back Posture in Dairy Cattle. J. Dairy Sci. 2013, 96, 257–266. [Google Scholar] [CrossRef]
- Bradtmueller, A.; Nejati, A.; Shepley, E.; Vasseur, E. Applications of Technology to Record Locomotion Measurements in Dairy Cows: A Systematic Review. Animals 2023, 13, 1121. [Google Scholar] [CrossRef]
- Mandel, R.; Harazy, H.; Gygax, L.; Nicol, C.J.; Ben-David, A.; Whay, H.R.; Klement, E. Short Communication: Detection of Lameness in Dairy Cows Using a Grooming Device. J. Dairy Sci. 2018, 101, 1511–1517. [Google Scholar] [CrossRef]
- Silva, S.; Araujo, J.; Guedes, C.; Silva, F.; Almeida, M.; Cerqueira, J. Precision Technologies to Address Dairy Cattle Welfare: Focus on Lameness, Mastitis and Body Condition. Animals 2021, 11, 2253. [Google Scholar] [CrossRef]
- Chapinal, N.; De Passillé, A.M.; Pastell, M.; Hänninen, L.; Munksgaard, L.; Rushen, J. Measurement of Acceleration While Walking as an Automated Method for Gait Assessment in Dairy Cattle. J. Dairy Sci. 2011, 94, 2895–2901. [Google Scholar] [CrossRef]
- Thorup, V.M.; Munksgaard, L.; Robert, P.-E.; Erhard, H.W.; Thomsen, P.T.; Friggens, N.C. Lameness Detection via Leg-Mounted Accelerometers on Dairy Cows on Four Commercial Farms. Animal 2015, 9, 1704–1712. [Google Scholar] [CrossRef]
- O’Leary, N.W.; Byrne, D.T.; O’Connor, A.H.; Shalloo, L. Invited Review: Cattle Lameness Detection with Accelerometers. J. Dairy Sci. 2020, 103, 3895–3911. [Google Scholar] [CrossRef]
- Flower, F.C.; Sanderson, D.J.; Weary, D.M. Hoof Pathologies Influence Kinematic Measures of Dairy Cow Gait. J. Dairy Sci. 2005, 88, 3166–3173. [Google Scholar] [CrossRef] [PubMed]
- Mccafferty, D.J. The Value of Infrared Thermography for Research on Mammals: Previous Applications and Future Directions. Mammal Rev. 2007, 37, 207–223. [Google Scholar] [CrossRef]
- McManus, R.; Boden, L.A.; Weir, W.; Viora, L.; Barker, R.; Kim, Y.; McBride, P.; Yang, S. Thermography for Disease Detection in Livestock: A Scoping Review. Front. Vet. Sci. 2022, 9, 965622. [Google Scholar] [CrossRef]
- Cook, N.J. Review on the Use of Infrared Thermography to Monitor the Health of Intensively Housed Livestock. J. Anim. Sci. Livest. Prod. 2021, 5, 1–4. [Google Scholar]
- Alsaaod, M.; Schaefer, A.; Büscher, W.; Steiner, A. The Role of Infrared Thermography as a Non-Invasive Tool for the Detection of Lameness in Cattle. Sensors 2015, 15, 14513–14525. [Google Scholar] [CrossRef]
- Hurnik, J.F.; Webster, A.B.; DeBoer, S. An Investigation of Skin Temperature Differentials in Relation to Estrus in Dairy Cattle Using a Thermal Infrared Scanning Technique. J. Anim. Sci. 1985, 61, 1095–1102. [Google Scholar] [CrossRef]
- Schwartzkopf-Genswein, K.S.; Stookey, J.M. The Use of Infrared Thermography to Assess Inflammation Associated with Hot-Iron and Freeze Branding in Cattle. Can. J. Anim. Sci. 1997, 77, 577–583. [Google Scholar] [CrossRef]
- Spire, M.F.; Drouillard, J.S.; Galland, J.C.; Sargeant, J.M. Use of Infrared Thermography to Detect Inflammation Caused by Contaminated Growth Promotant Ear Implants in Cattle. J. Am. Vet. Med. Assoc. 1999, 215, 1320–1324. [Google Scholar] [CrossRef] [PubMed]
- Kastelic, J.P.; Cook, R.B.; Coulter, G.H.; Wallins, G.L.; Entz, T. Environmental Factors Affecting Measurement of Bovine Scrotal Surface Temperature with Infrared Thermography. Anim. Reprod. Sci. 1996, 41, 153–159. [Google Scholar] [CrossRef]
- Knížková, I.; Kunc, P.; Koubková, M.; Flusser, J.; Dolezal, O. Evaluation of Naturally Ventilated Dairy Barn Management by a Thermographic Method. Livest. Prod. Sci. 2002, 77, 349–353. [Google Scholar] [CrossRef]
- Besler, B.C.; Mojabi, P.; Lasemiimeni, Z.; Murphy, J.E.; Wang, Z.; Baker, R.; Pearson, J.M.; Fear, E.C. Scoping Review of Precision Technologies for Cattle Monitoring. Smart Agric. Technol. 2024, 9, 100596. [Google Scholar] [CrossRef]
- Cockcroft, P.D.; Henson, F.M.D.; Parker, C. Thermography of a Septic Metatarsophalangeal Joint in a Heifer. Vet. Rec. 2000, 146, 258–260. [Google Scholar] [CrossRef]
- Nikkhah, A.; Plaizier, J.C.; Einarson, M.S.; Berry, R.J.; Scott, S.L.; Kennedy, A.D. Short Communication: Infrared Thermography and Visual Examination of Hooves of Dairy Cows in Two Stages of Lactation. J. Dairy Sci. 2005, 88, 2749–2753. [Google Scholar] [CrossRef]
- Bobić, T.; Mijić, P.; Gantner, V.; Glavaš, H.; Gregić, M. The Effects of Parity and Stage of Lactation on Hoof Temperature of Dairy Cows Using a Thermovision Camera. J. Cent. Eur. Agric. 2018, 19, 777–783. [Google Scholar] [CrossRef]
- Rainwater-Lovett, K.; Pacheco, J.M.; Packer, C.; Rodriguez, L.L. Detection of Foot-and-Mouth Disease Virus Infected Cattle Using Infrared Thermography. Vet. J. 2009, 180, 317–324. [Google Scholar] [CrossRef]
- Gloster, J.; Ebert, K.; Gubbins, S.; Bashiruddin, J.; Paton, D.J. Normal Variation in Thermal Radiated Temperature in Cattle: Implications for Foot-and-Mouth Disease Detection. BMC Vet. Res. 2011, 7, 73. [Google Scholar] [CrossRef]
- Alsaaod, M.; Büscher, W. Detection of Hoof Lesions Using Digital Infrared Thermography in Dairy Cows. J. Dairy Sci. 2012, 95, 735–742. [Google Scholar] [CrossRef]
- Wood, S.; Lin, Y.; Knowles, T.G.; Main, D.C.J. Infrared Thermometry for Lesion Monitoring in Cattle Lameness. Vet. Rec. 2015, 176, 308. [Google Scholar] [CrossRef] [PubMed]
- Wilhelm, K.; Wilhelm, J.; Fürll, M. Use of Thermography to Monitor Sole Haemorrhages and Temperature Distribution over the Claws of Dairy Cattle. Vet. Rec. 2015, 176, 146. [Google Scholar] [CrossRef] [PubMed]
- Lin, Y.; Mullan, S.; Main, D.C.J. Optimising Lameness Detection in Dairy Cattle by Using Handheld Infrared Thermometers. Vet. Med. Sci. 2018, 4, 218–226. [Google Scholar] [CrossRef]
- Coe, A.; Blackie, N. Comparison of Low- and High-Cost Infrared Thermal Imaging Devices for the Detection of Lameness in Dairy Cattle. Vet. Sci. 2022, 9, 414. [Google Scholar] [CrossRef]
- Vanhoudt, A.; Jacobs, C.; Caron, M.; Barkema, H.W.; Nielen, M.; Van Werven, T.; Orsel, K. Broad-Spectrum Infrared Thermography for Detection of M2 Digital Dermatitis Lesions on Hind Feet of Standing Dairy Cattle. PLoS ONE 2023, 18, e0280098. [Google Scholar] [CrossRef] [PubMed]
- Playà-Montmany, N.; Tattersall, G.J. Spot Size, Distance and Emissivity Errors in Field Applications of Infrared Thermography. Methods Ecol. Evol. 2021, 12, 828–840. [Google Scholar] [CrossRef]
- Bobić, T.; Mijić, P.; Gregić, M.; Bagarić, A.; Gantner, V. Early Detection of the Hoof Diseases in Holstein Cows Using Thermovision Camera. Agric. Conspec. Sci. 2017, 2, 197–200. [Google Scholar]
- Harris-Bridge, G.; Young, L.; Handel, I.; Farish, M.; Mason, C.; Mitchell, M.A.; Haskell, M.J. The Use of Infrared Thermography for Detecting Digital Dermatitis in Dairy Cattle: What Is the Best Measure of Temperature and Foot Location to Use? Vet. J. 2018, 237, 26–33. [Google Scholar] [CrossRef]
- Chiu, Y.-J.; Hsu, J.-T. Integrated Infrared Thermography and Accelerometer-Based Behavior Logger as a Hoof Lesion Identification Tool in Dairy Cows with Various Foot Diseases under Subtropical Climates. J. Anim. Sci. 2022, 100, 1–13. [Google Scholar] [CrossRef]
- Werema, C.W.; Laven, L.; Mueller, K.; Laven, R. Evaluating Alternatives to Locomotion Scoring for Lameness Detection in Pasture-Based Dairy Cows in New Zealand: Infra-Red Thermography. Animals 2021, 11, 3473. [Google Scholar] [CrossRef]
- Werema, C.W.; Laven, L.J.; Mueller, K.R.; Laven, R.A. Assessing Alternatives to Locomotion Scoring for Detecting Lameness in Dairy Cattle in Tanzania: Infrared Thermography. Animals 2023, 13, 1372. [Google Scholar] [CrossRef] [PubMed]
- Main, D.C.J.; Stokes, J.E.; Reader, J.D.; Whay, H.R. Detecting Hoof Lesions in Dairy Cattle Using a Hand-held Thermometer. Vet. Rec. 2012, 171, 504. [Google Scholar] [CrossRef]
- Stokes, J.E.; Leach, K.A.; Main, D.C.J.; Whay, H.R. An Investigation into the Use of Infrared Thermography (IRT) as a Rapid Diagnostic Tool for Foot Lesions in Dairy Cattle. Vet. J. 2012, 193, 674–678. [Google Scholar] [CrossRef]
- Renn, N.; Onyango, J.; McCormick, W. Digital Infrared Thermal Imaging and Manual Lameness Scoring as a Means for Lameness Detection in Cattle. Vet. Clin. Sci. 2014, 2, 16–23. [Google Scholar]
- Orman, A.; Endres, M.I. Use of Thermal Imaging for Identification of Foot Lesions in Dairy Cattle. Acta Agric. Scand. Sect. A—Anim. Sci. 2016, 66, 1–7. [Google Scholar] [CrossRef]
- Coşkun, G.; Şahin, Ö.; Delialioğlu, R.A.; Altay, Y.; Aytekin, İ. Diagnosis of Lameness via Data Mining Algorithm by Using Thermal Camera and Image Processing Method in Brown Swiss Cows. Trop. Anim. Health Prod. 2023, 55, 50. [Google Scholar] [CrossRef] [PubMed]
- Bobic, T.; Mijic, P.; Gregic, M.; Gantner, V. Evaluation of the Hoof’s Temperature Variations Depending on Lesion Presence, Measurement Points and Leg Position. Vet. Med. 2024, 69, 185–190. [Google Scholar] [CrossRef] [PubMed]
- Feighelstein, M.; Mishael, A.; Malka, T.; Magana, J.; Gavojdian, D.; Zamansky, A.; Adams-Progar, A. AI-Based Prediction and Detection of Early-Onset of Digital Dermatitis in Dairy Cows Using Infrared Thermography. Sci. Rep. 2024, 14, 29849. [Google Scholar] [CrossRef]
- Alsaaod, M.; Syring, C.; Luternauer, M.; Doherr, M.G.; Steiner, A. Effect of Routine Claw Trimming on Claw Temperature in Dairy Cows Measured by Infrared Thermography. J. Dairy Sci. 2015, 98, 2381–2388. [Google Scholar] [CrossRef]
- Döpfer, D.; Koopmans, A.; Meijer, F.A.; Szakáll, I.; Schukken, Y.H.; Klee, W.; Bosma, R.B.; Cornelisse, J.L.; van Asten, A.J.; ter Huurne, A.A. Histological and Bacteriological Evaluation of Digital Dermatitis in Cattle, with Special Reference to Spirochaetes and Campylobacter Faecalis. Vet. Rec. 1997, 140, 620–623. [Google Scholar] [CrossRef]
- Church, J.S.; Hegadoren, P.R.; Paetkau, M.J.; Miller, C.C.; Regev-Shoshani, G.; Schaefer, A.L.; Schwartzkopf-Genswein, K.S. Influence of Environmental Factors on Infrared Eye Temperature Measurements in Cattle. Res. Vet. Sci. 2014, 96, 220–226. [Google Scholar] [CrossRef]
- De Lima, V.; Piles, M.; Rafel, O.; López-Béjar, M.; Ramón, J.; Velarde, A.; Dalmau, A. Use of Infrared Thermography to Assess the Influence of High Environmental Temperature on Rabbits. Res. Vet. Sci. 2013, 95, 802–810. [Google Scholar] [CrossRef]
- Mota-Rojas, D.; Pereira, A.M.F.; Wang, D.; Martínez-Burnes, J.; Ghezzi, M.; Hernández-Avalos, I.; Lendez, P.; Mora-Medina, P.; Casas, A.; Olmos-Hernández, A.; et al. Clinical Applications and Factors Involved in Validating Thermal Windows Used in Infrared Thermography in Cattle and River Buffalo to Assess Health and Productivity. Animals 2021, 11, 2247. [Google Scholar] [CrossRef] [PubMed]
- Montanholi, Y.R.; Odongo, N.E.; Swanson, K.C.; Schenkel, F.S.; McBride, B.W.; Miller, S.P. Application of Infrared Thermography as an Indicator of Heat and Methane Production and Its Use in the Study of Skin Temperature in Response to Physiological Events in Dairy Cattle (Bos taurus). J. Therm. Biol. 2008, 33, 468–475. [Google Scholar] [CrossRef]
- Nkrumah, J.D.; Okine, E.K.; Mathison, G.W.; Schmid, K.; Li, C.; Basarab, J.A.; Price, M.A.; Wang, Z.; Moore, S.S. Relationships of Feedlot Feed Efficiency, Performance, and Feeding Behavior with Metabolic Rate, Methane Production, and Energy Partitioning in Beef Cattle. J. Anim. Sci. 2006, 84, 145–153. [Google Scholar] [CrossRef] [PubMed]
- Hegarty, R.S.; Goopy, J.P.; Herd, R.M.; McCorkell, B. Cattle Selected for Lower Residual Feed Intake Have Reduced Daily Methane Production. J. Anim. Sci. 2007, 85, 1479–1486. [Google Scholar] [CrossRef]
- Okada, K.; Takemura, K.; Sato, S. Investigation of Various Essential Factors for Optimum Infrared Thermography. J. Vet. Med. Sci. 2013, 75, 1349–1353. [Google Scholar] [CrossRef]
- Glavaš, H.; Bobić, T.; Dorić, D.; Božić Lenard, D. Infrared Thermography Camera Protection in Dairy Farming Management. Comput. Electron. Agric. 2019, 157, 604–615. [Google Scholar] [CrossRef]
- Thomas, A.D.; Orsel, K.; Cortés, J.A.; Pajor, E.A. Objective Determination and Quantification of Pain and Inflammation Associated with Digital Dermatitis in Feedlot Cattle. Appl. Anim. Behav. Sci. 2022, 253, 105684. [Google Scholar] [CrossRef]
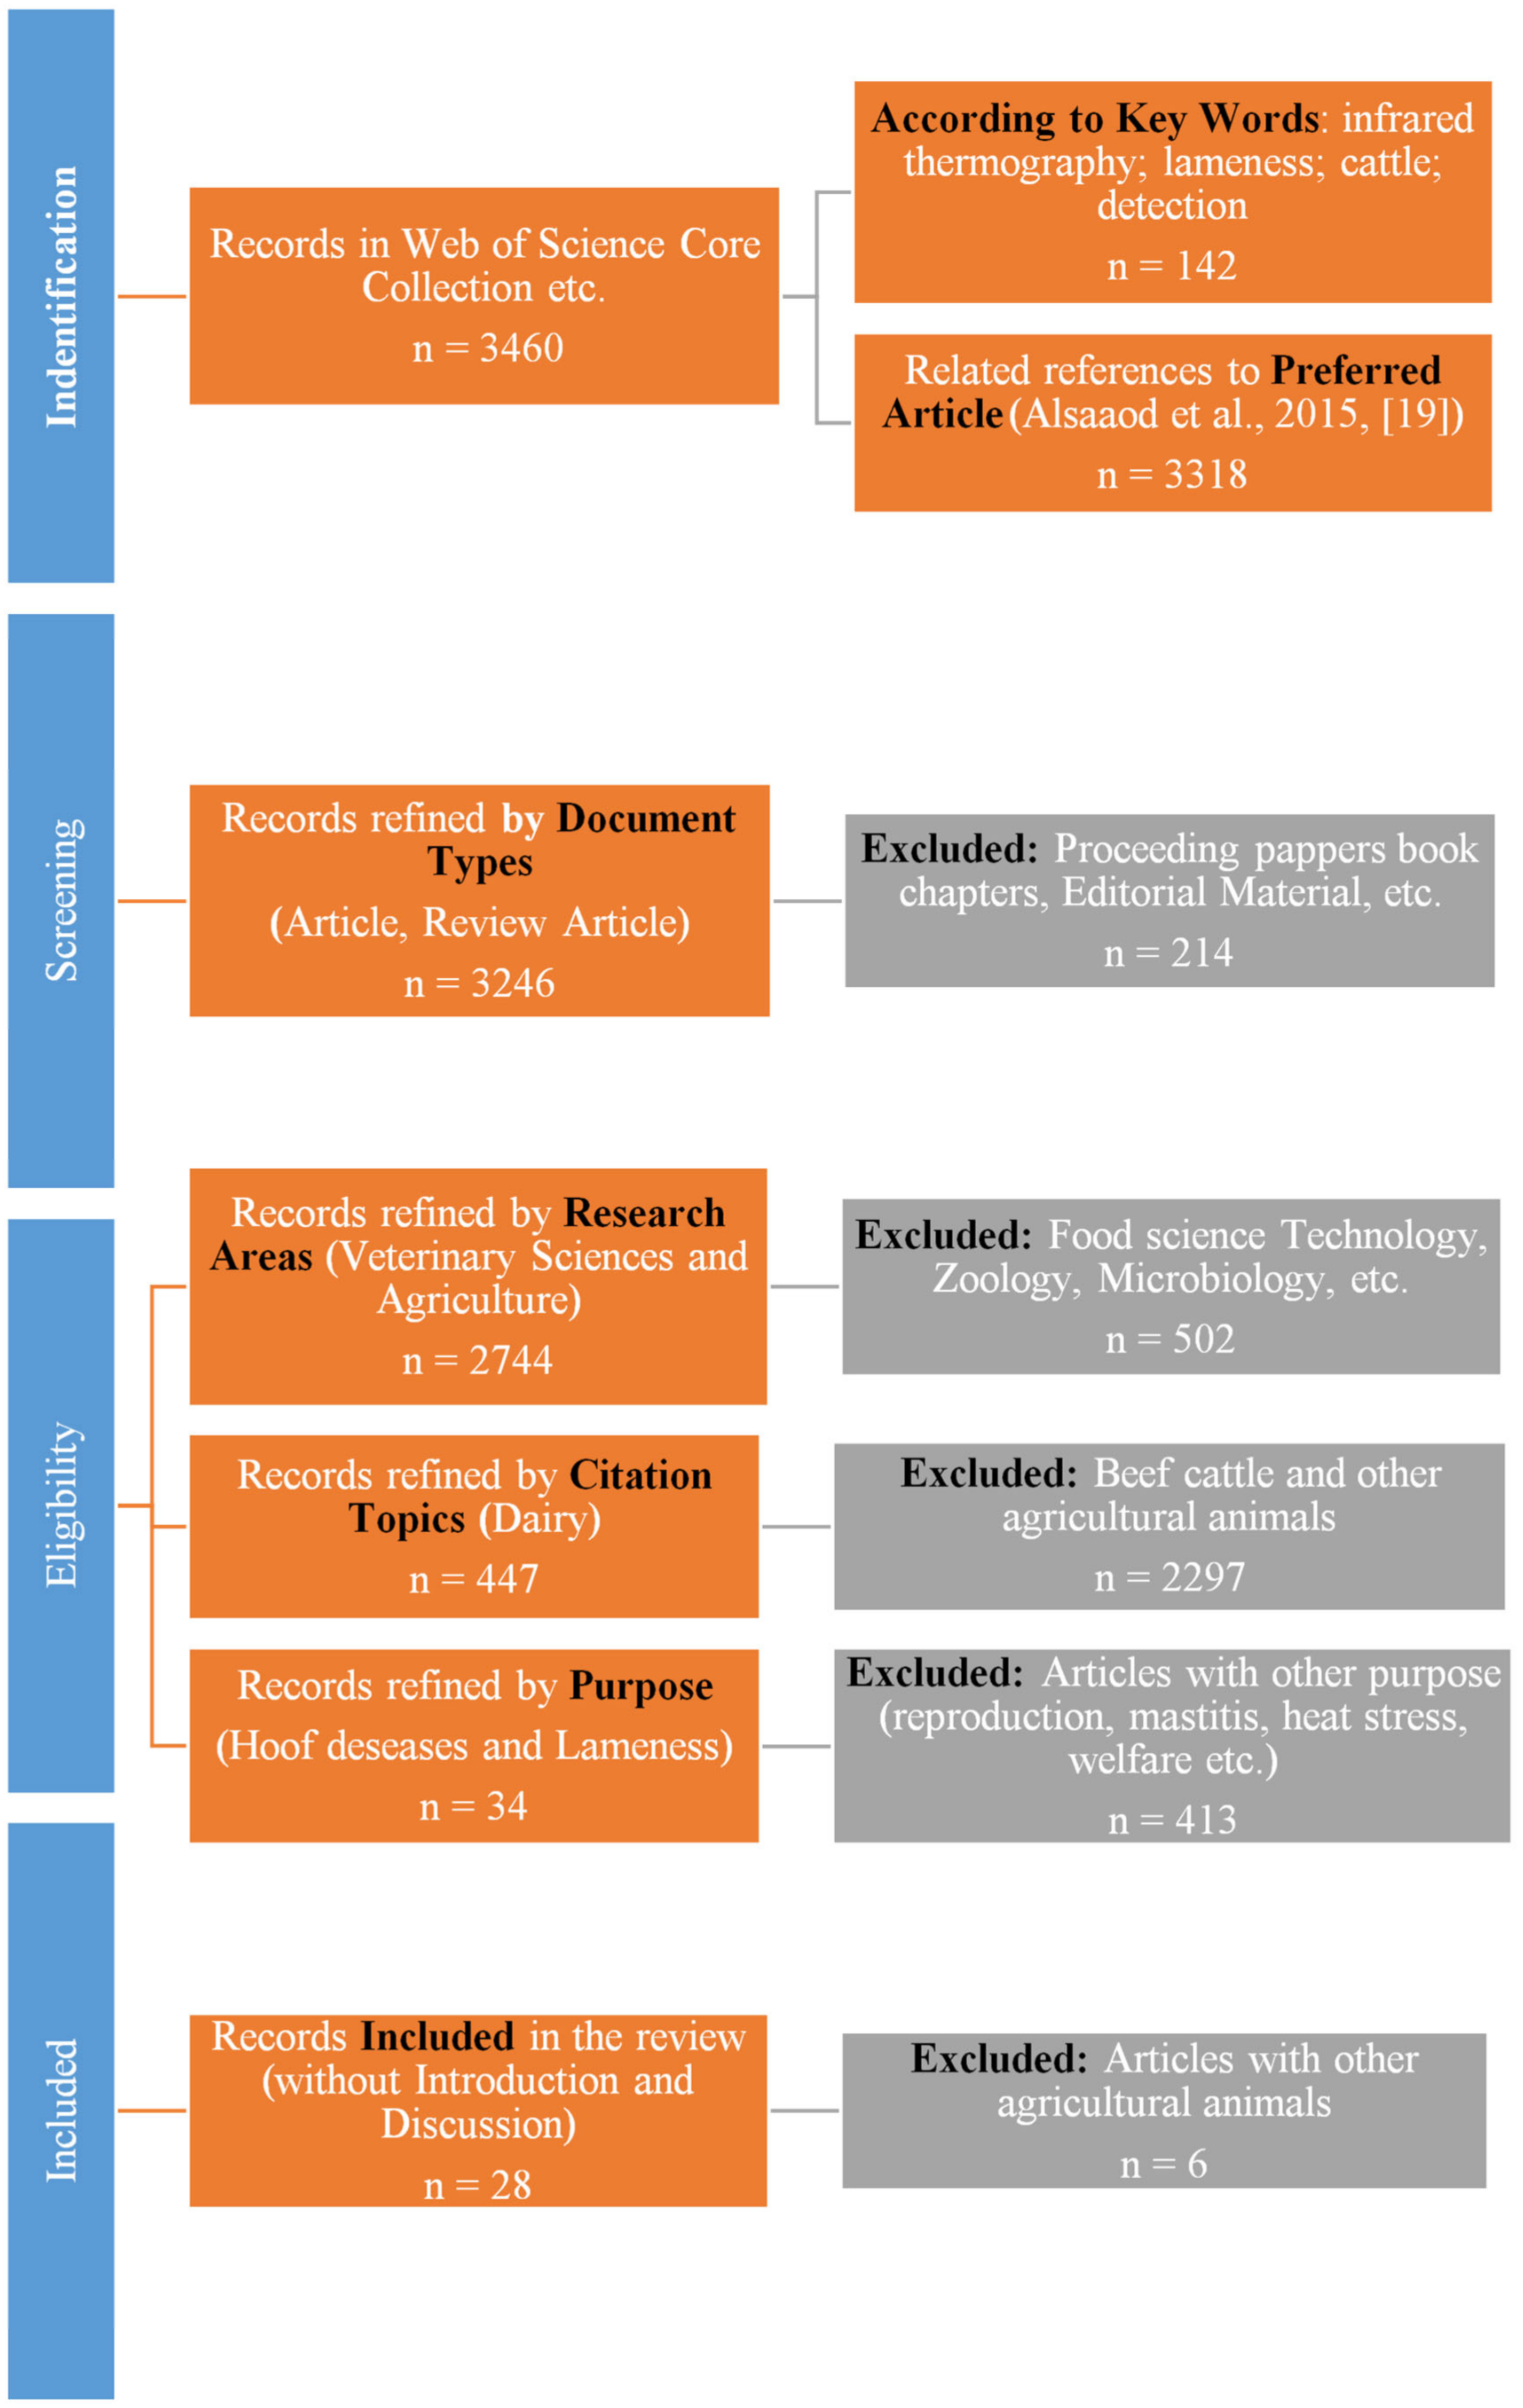
| Criteria | Notes | |
|---|---|---|
| Main objective | Studies on using infrared thermography in detection of hoof diseases, lameness, or lameness prevention | Studies that used other methods of detecting disease or lameness were excluded. |
| Type | Article and review article | Abstracts, conference papers, and preliminary studies were excluded. |
| Research area | Veterinary sciences, agriculture | Zoology, biology, physiology, endocrinology, environmental sciences, ecology, and similar areas were excluded. |
| Topics | Dairy farming | Beef cattle and other agricultural animals were excluded (pigs, sheep, goats, horses). |
| Purpose | Detection of hoof disease and lameness | Articles with other purposes were excluded (reproduction, mastitis, heat stress, welfare, etc.). |
Disclaimer/Publisher’s Note: The statements, opinions and data contained in all publications are solely those of the individual author(s) and contributor(s) and not of MDPI and/or the editor(s). MDPI and/or the editor(s) disclaim responsibility for any injury to people or property resulting from any ideas, methods, instructions or products referred to in the content. |
© 2025 by the authors. Licensee MDPI, Basel, Switzerland. This article is an open access article distributed under the terms and conditions of the Creative Commons Attribution (CC BY) license (https://creativecommons.org/licenses/by/4.0/).
Share and Cite
Bobić, T.; Raguž, N.; Oroz, M.; Oroz, M.; Gregić, M.; Mijić, P.; Kranjac, D.; Lukić, B. Application of Infrared Thermography in the Detection of Hoof Disease and Lameness in Cattle. Animals 2025, 15, 1086. https://doi.org/10.3390/ani15081086
Bobić T, Raguž N, Oroz M, Oroz M, Gregić M, Mijić P, Kranjac D, Lukić B. Application of Infrared Thermography in the Detection of Hoof Disease and Lameness in Cattle. Animals. 2025; 15(8):1086. https://doi.org/10.3390/ani15081086
Chicago/Turabian StyleBobić, Tina, Nikola Raguž, Mihaela Oroz, Marko Oroz, Maja Gregić, Pero Mijić, David Kranjac, and Boris Lukić. 2025. "Application of Infrared Thermography in the Detection of Hoof Disease and Lameness in Cattle" Animals 15, no. 8: 1086. https://doi.org/10.3390/ani15081086
APA StyleBobić, T., Raguž, N., Oroz, M., Oroz, M., Gregić, M., Mijić, P., Kranjac, D., & Lukić, B. (2025). Application of Infrared Thermography in the Detection of Hoof Disease and Lameness in Cattle. Animals, 15(8), 1086. https://doi.org/10.3390/ani15081086