
A Systematic Literature Review of Mitochondrial DNA Analysis for Horse Genetic Diversity

 , , , , and
Simple Summary
Abstract
1. Introduction
2. Materials and Methods
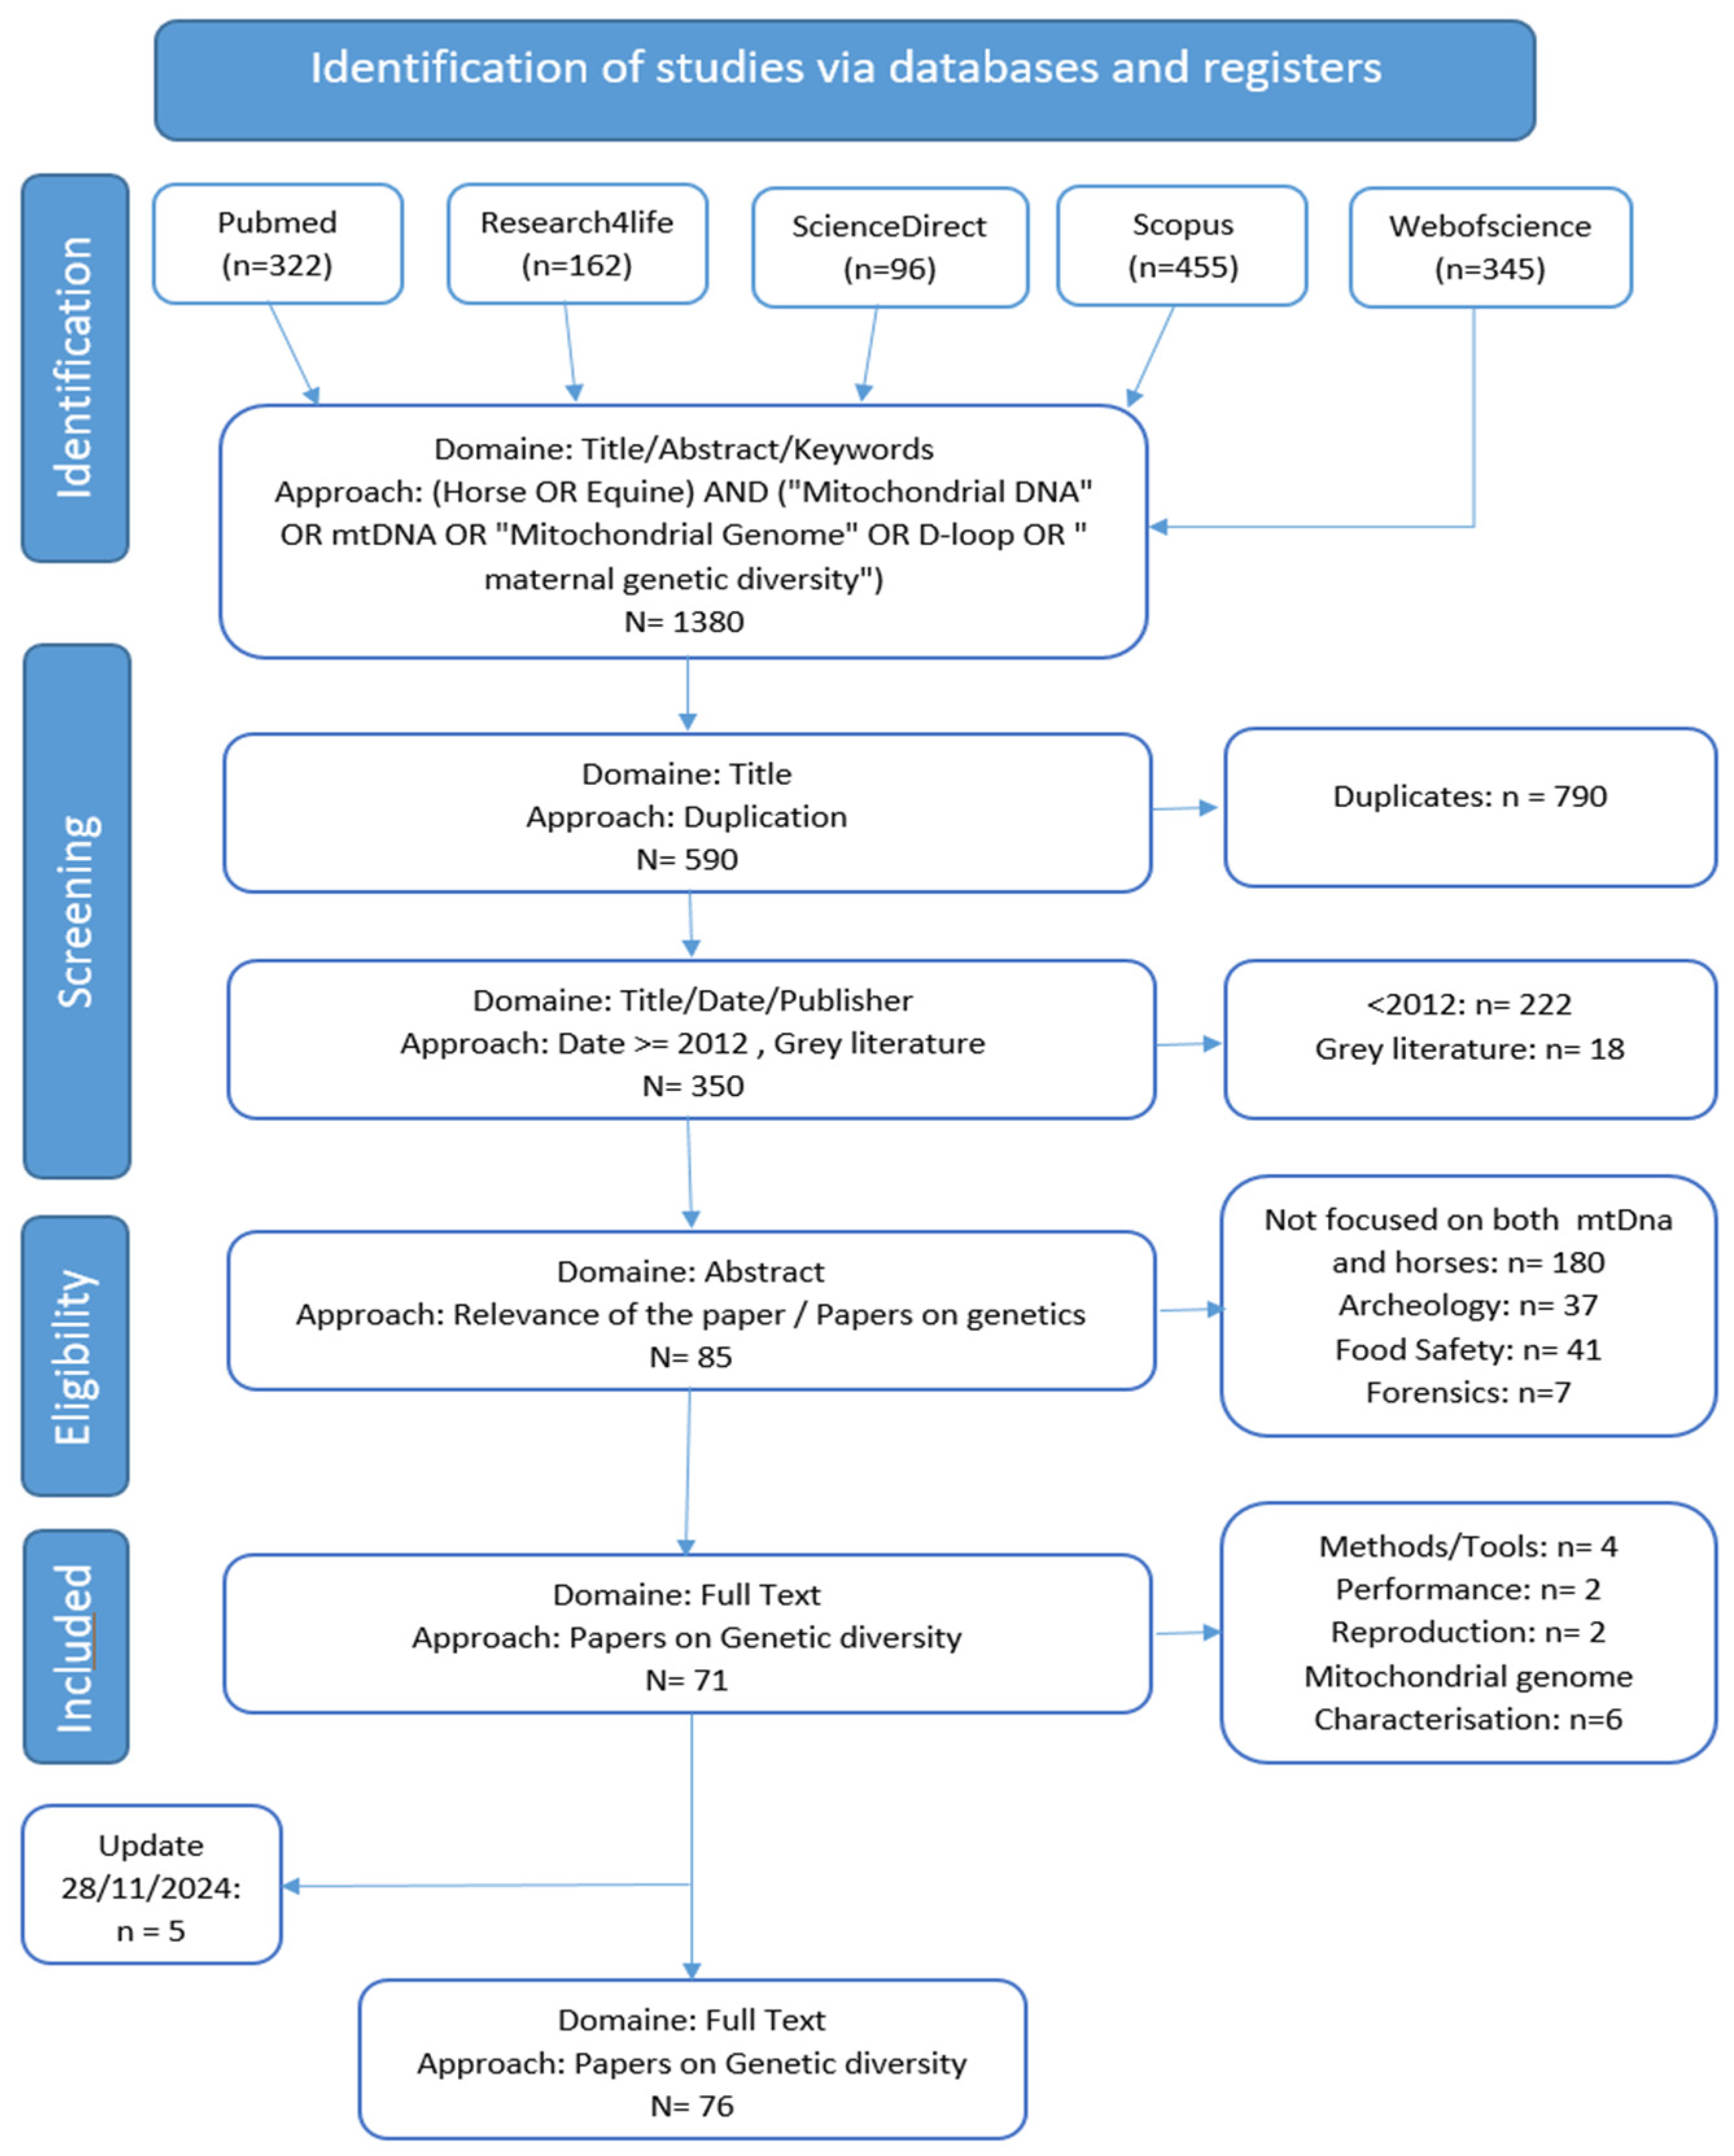
2.1. Methodology
2.2. Inclusion and Exclusion Criteria
2.3. Eligibility and Screening
2.4. Update
2.5. Data Extraction Process
2.6. Data Synthesis
- Date of publication;
- Breed studied;
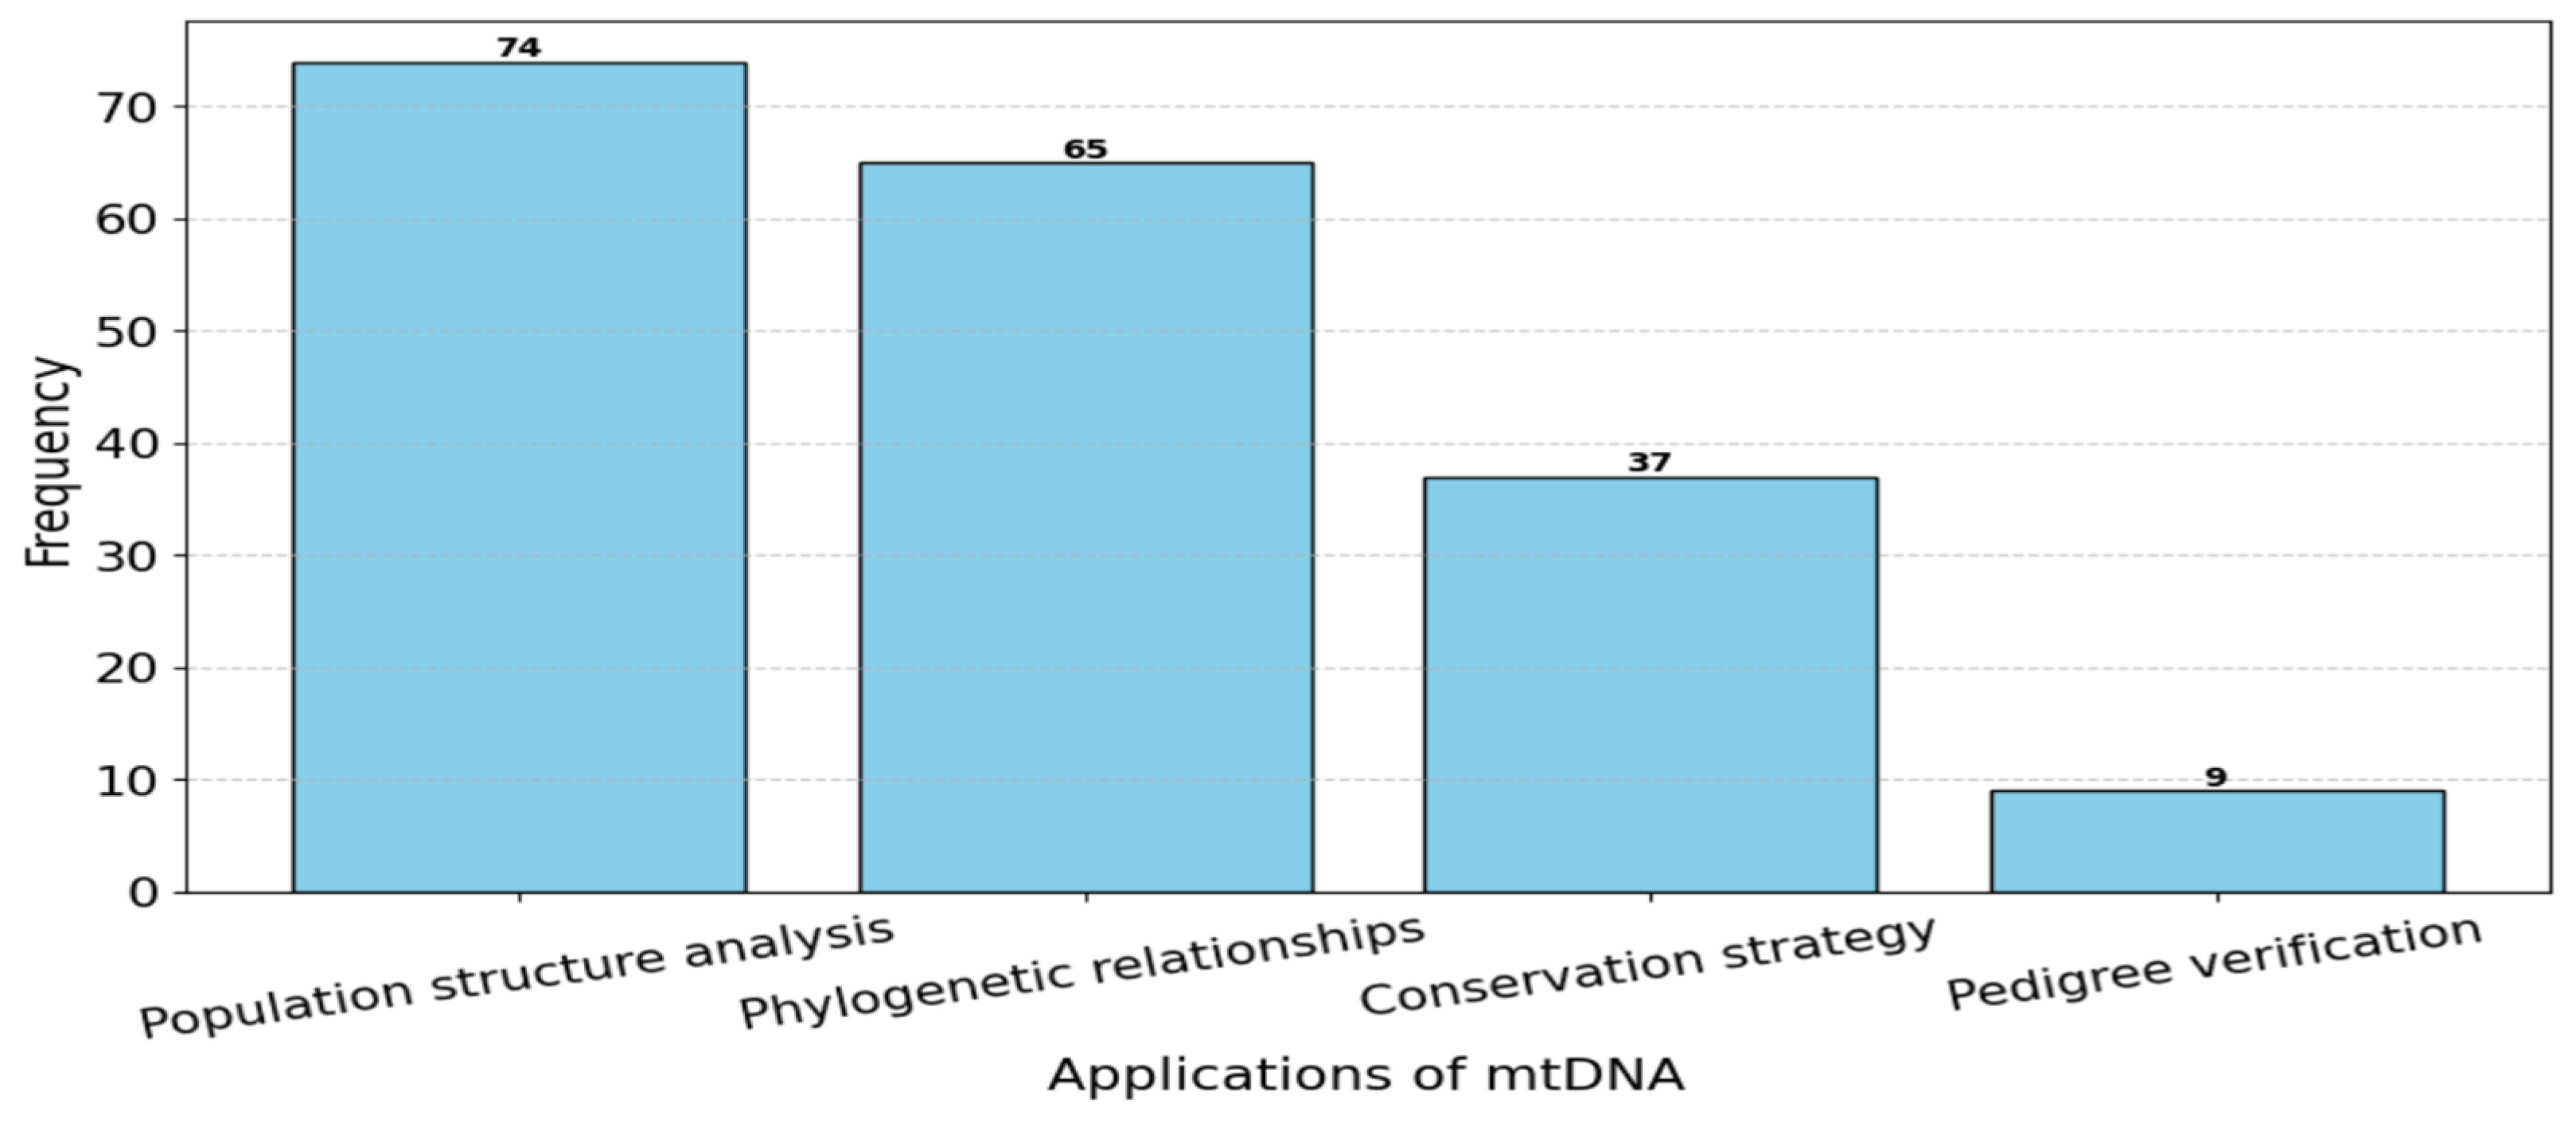
- mtDNA applications;
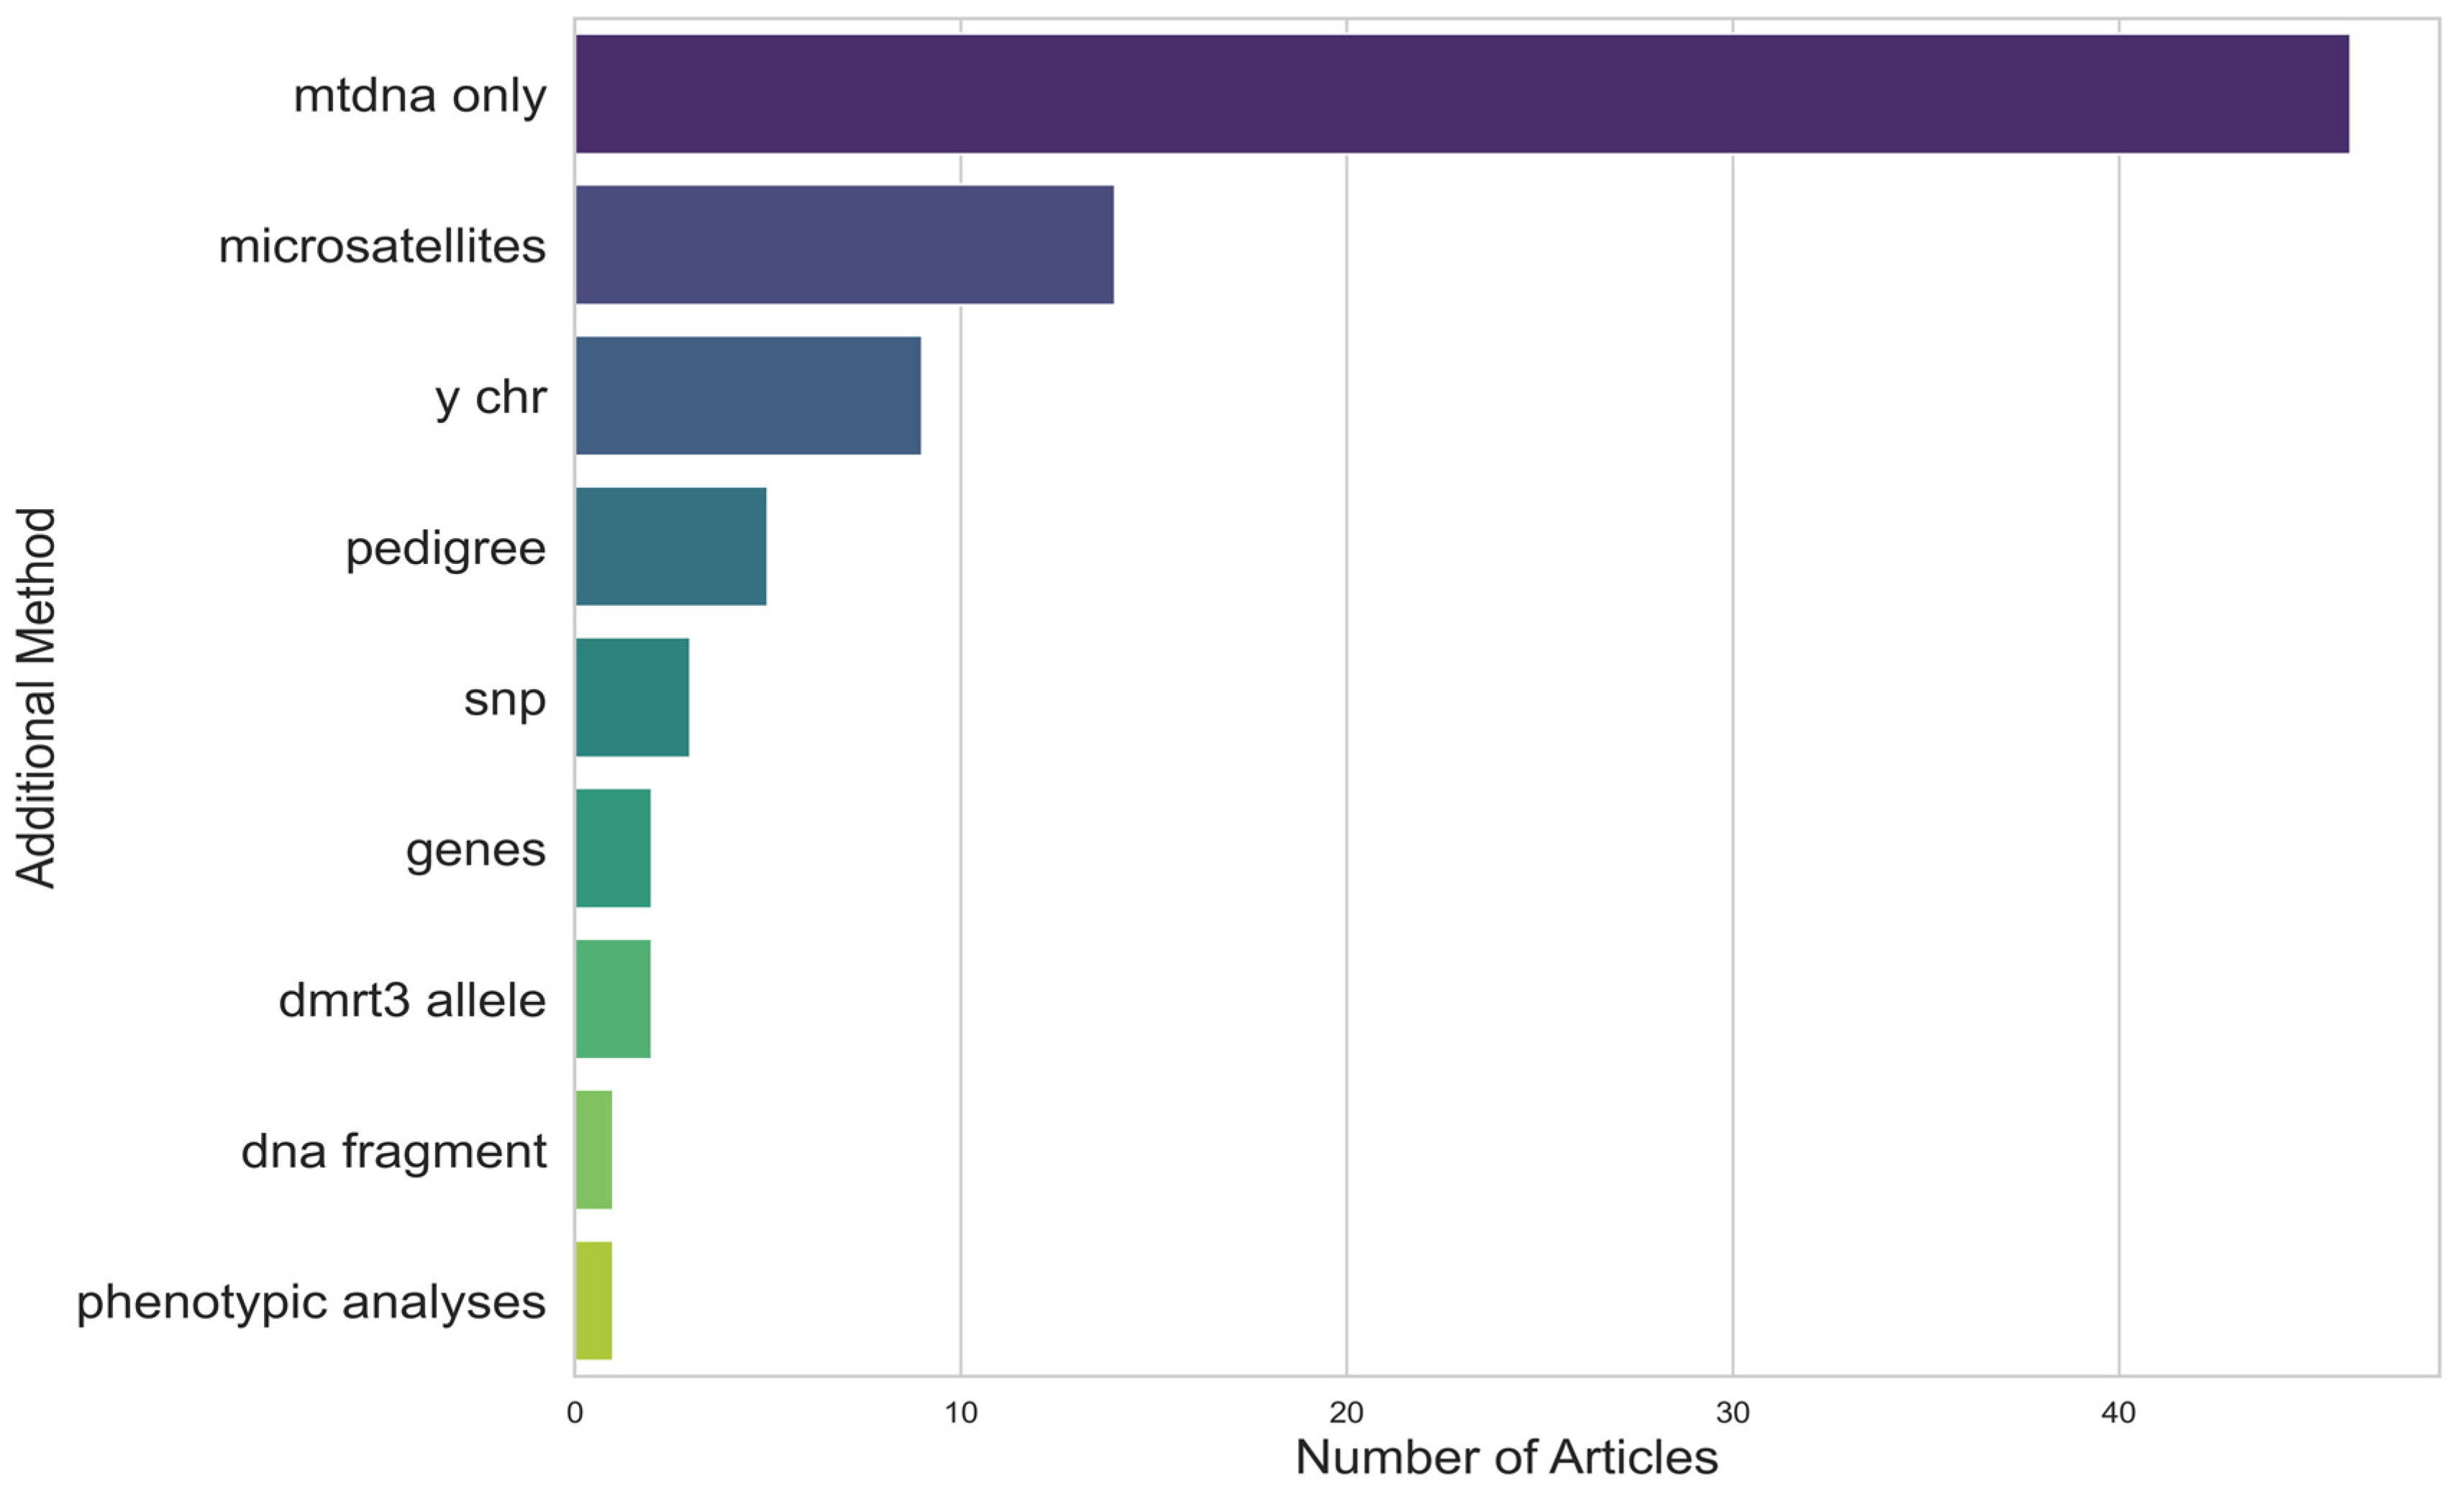
- Additional methods used in addition to mtDNA sequencing;
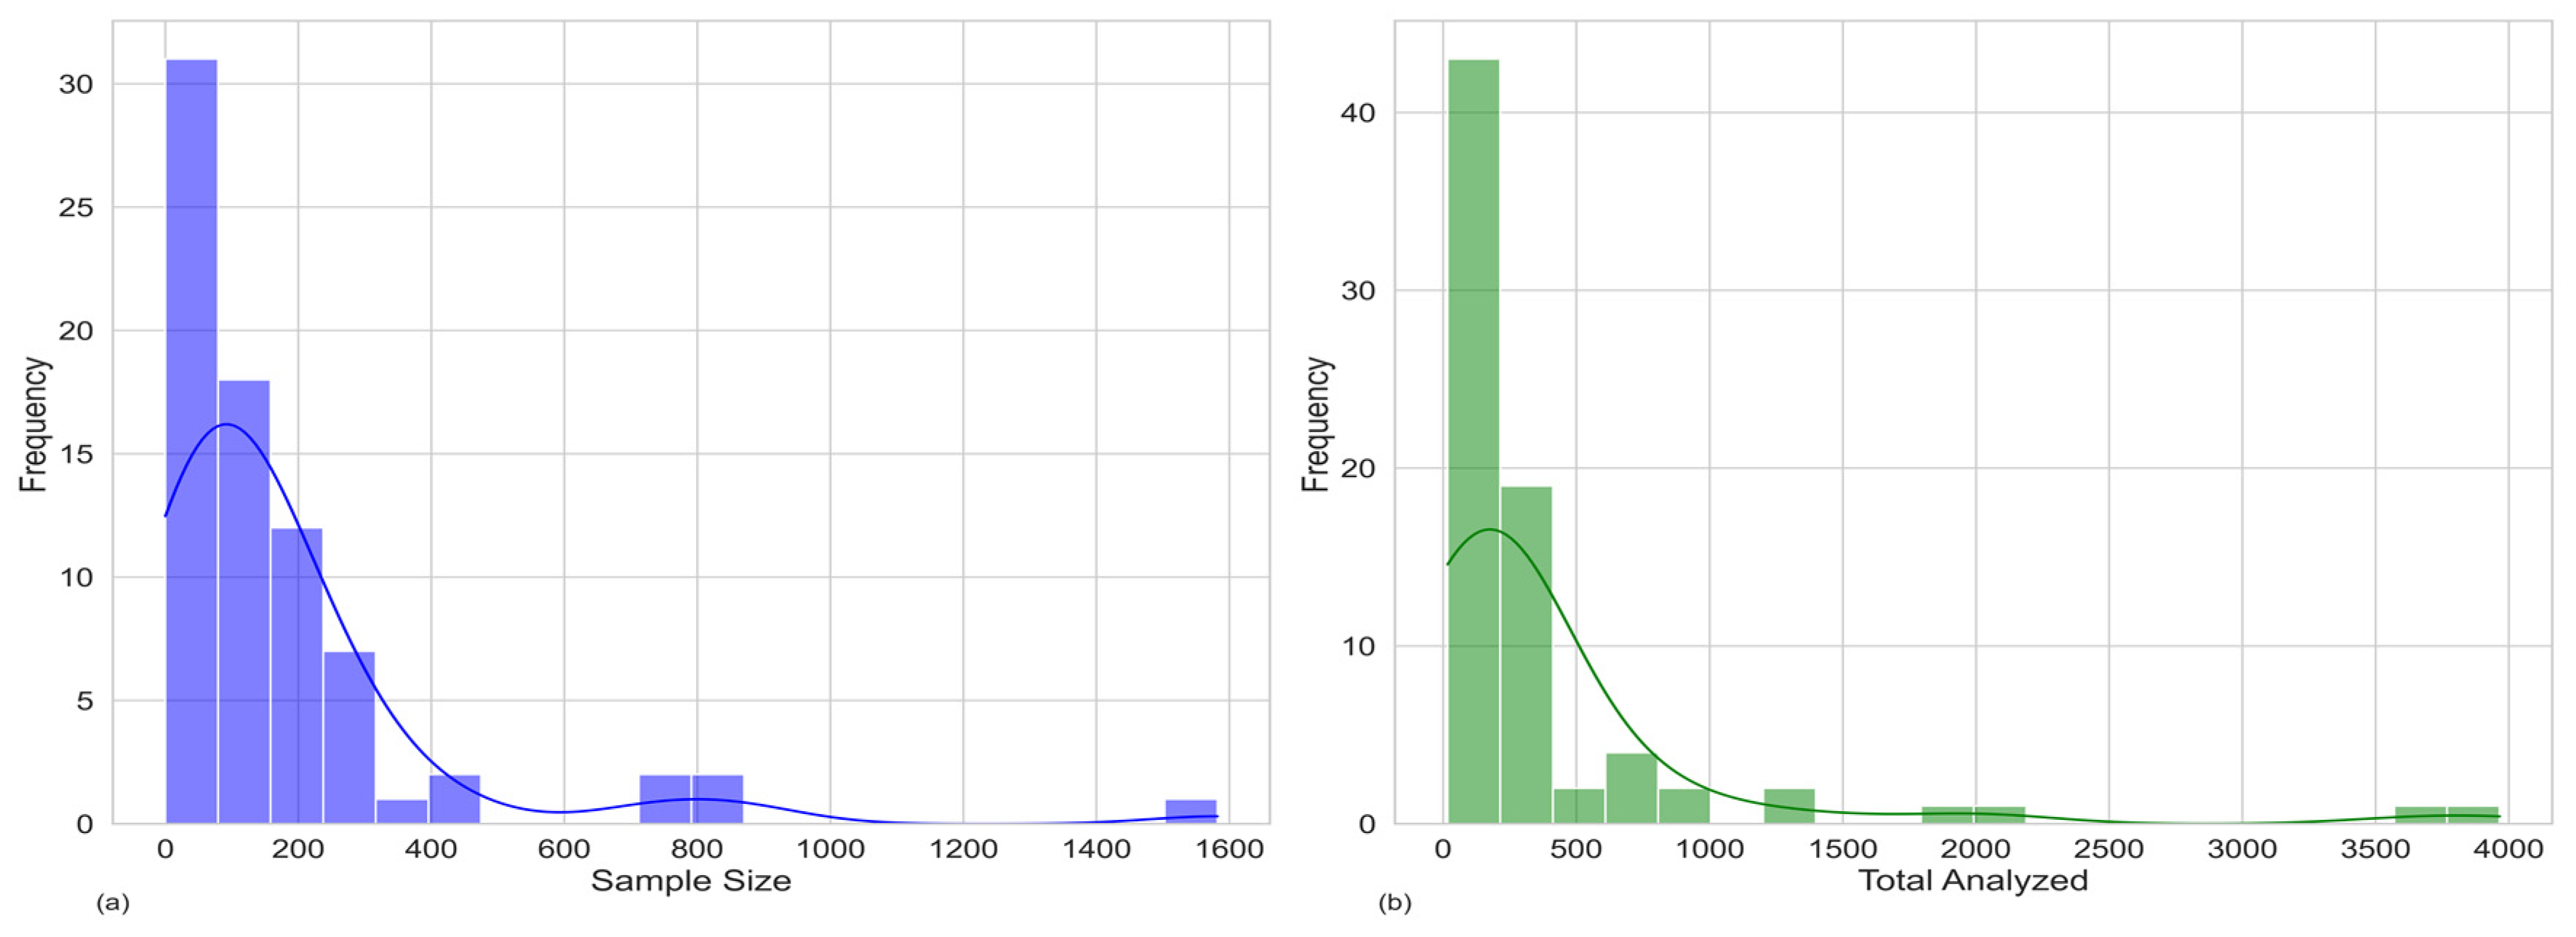
- Sample type and size;
- Number of GenBank sequences;
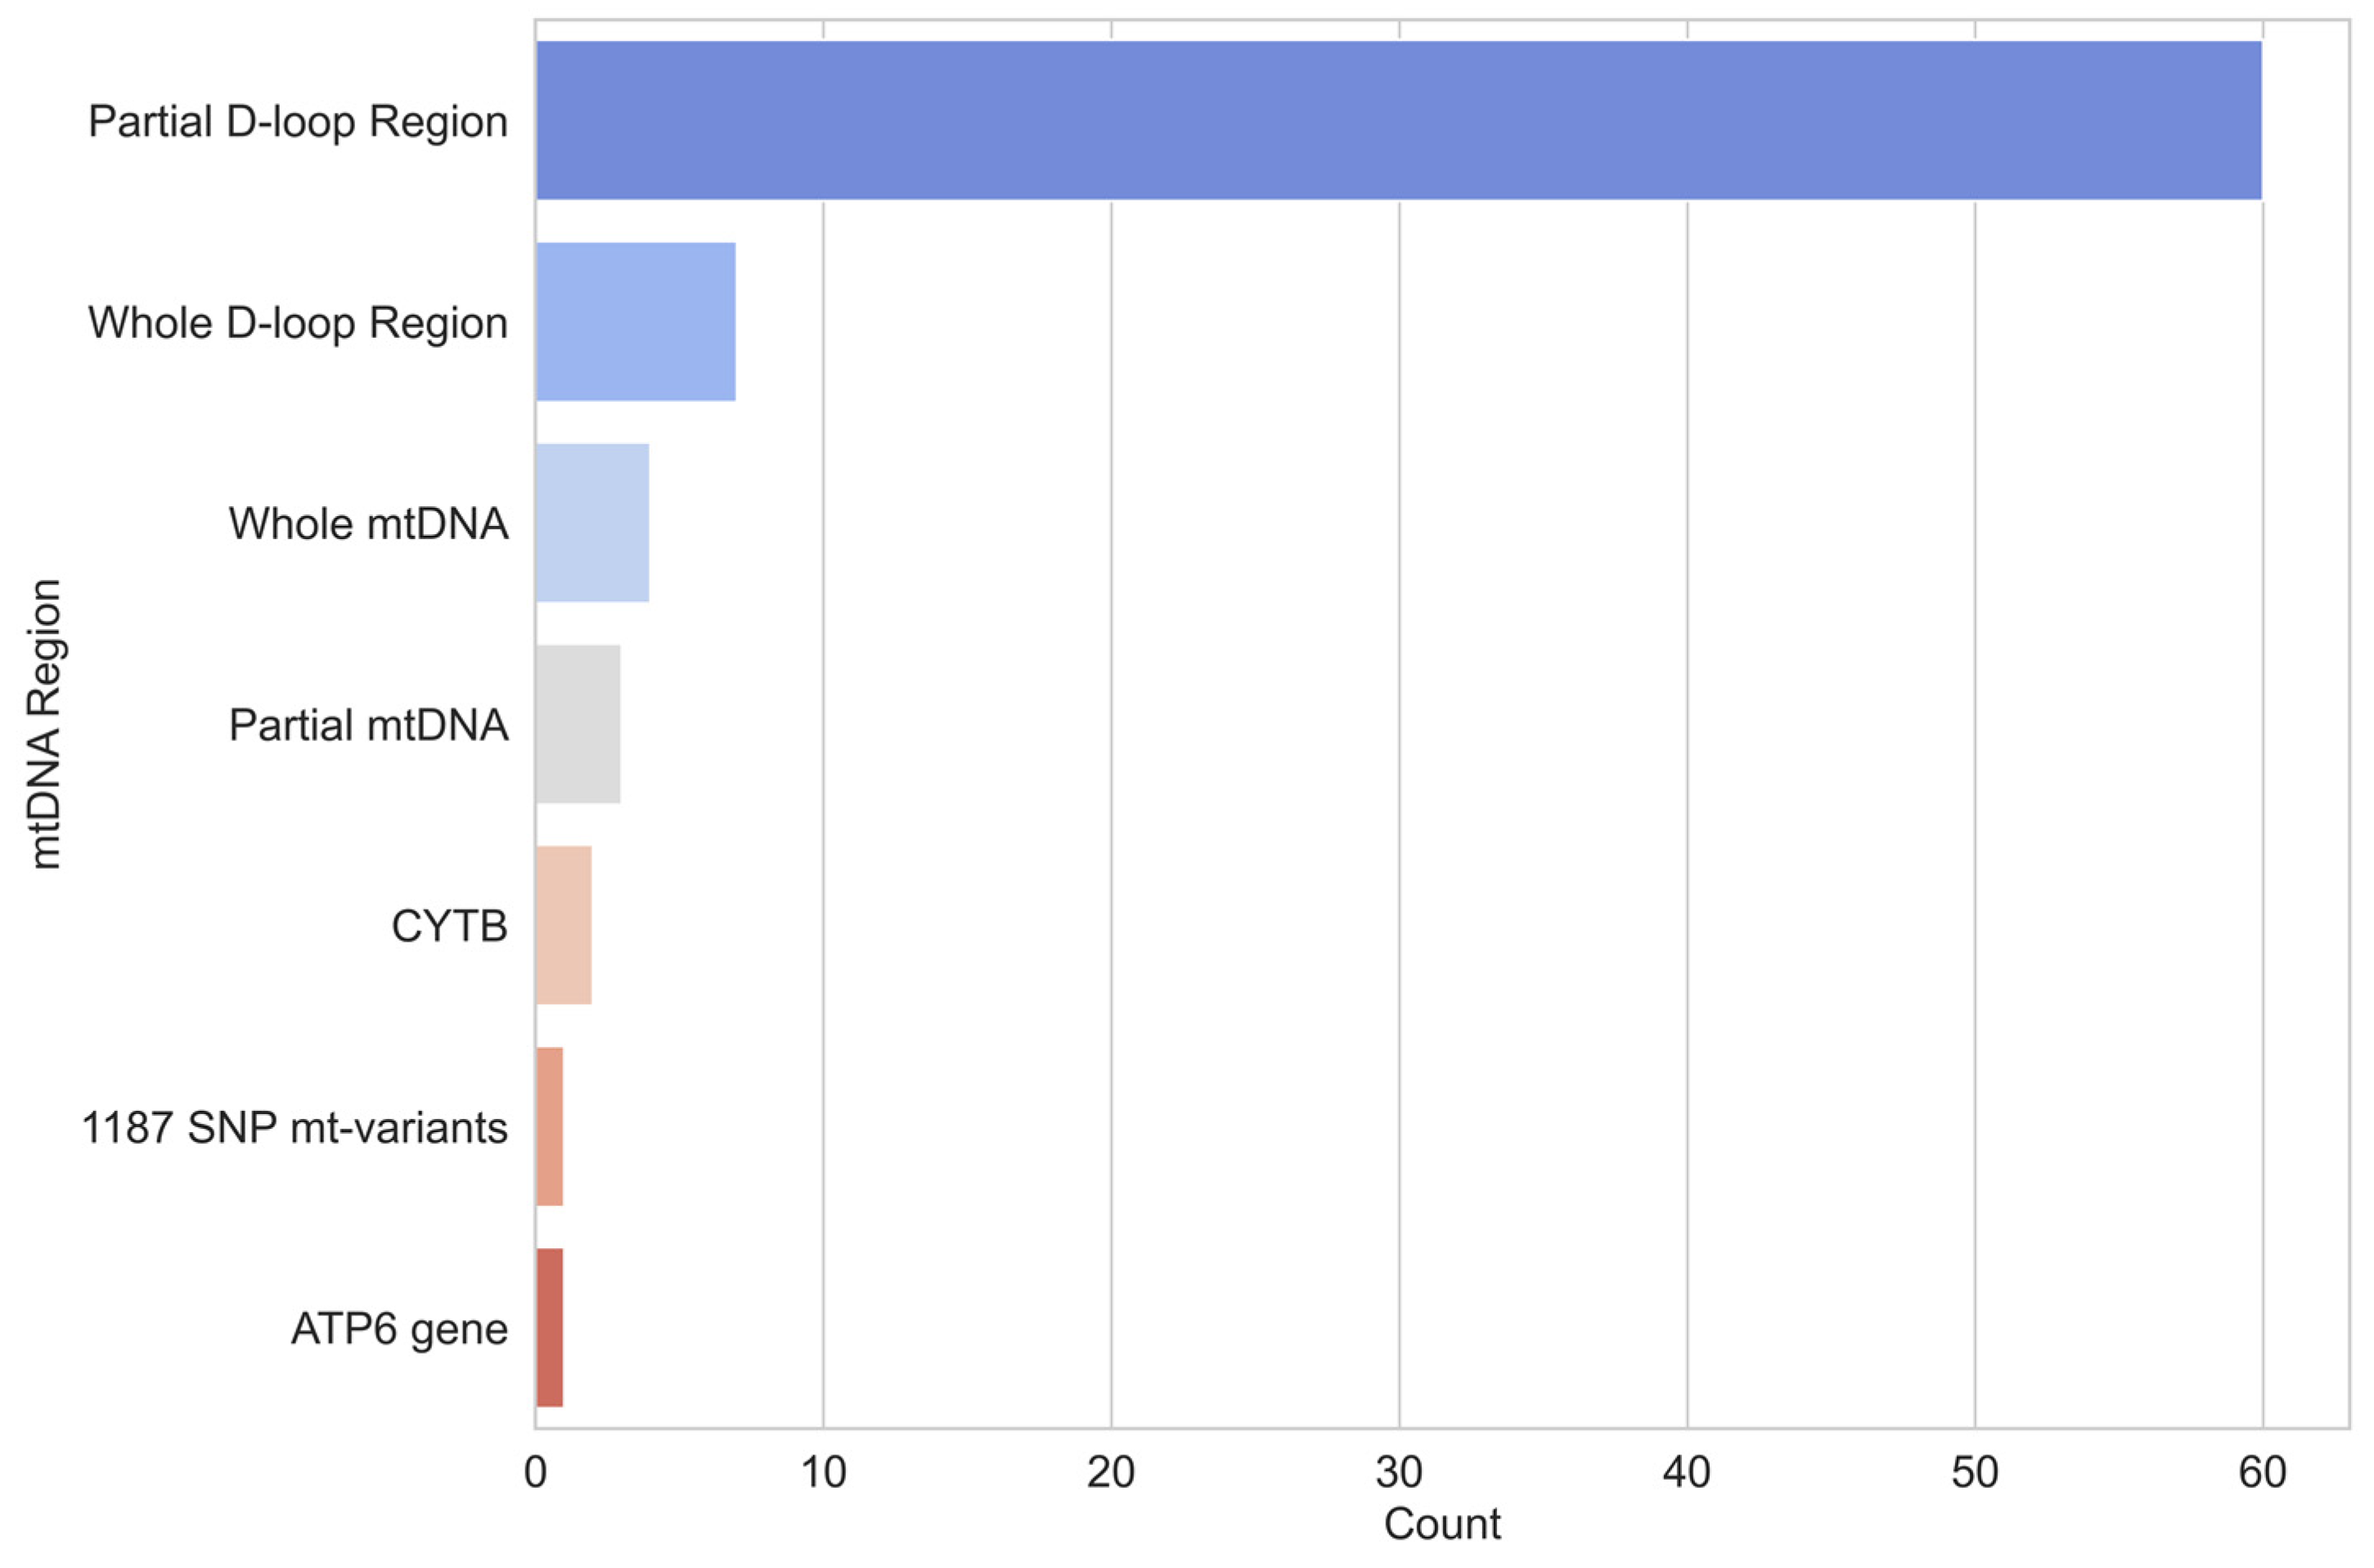
- mtDNA region studied;
- Number of base pairs (bp);
- Position of nucleotides in the mtDNA genome;
- Whether the study was trimmed or not;
- Sequencing technique;
- Tools used for the analysis;
- Metrics and methods for evaluation;
- Country of the study;
- Haplogroups found.
3. Results
3.1. Sampling
3.2. DNA Extraction
3.3. PCR Amplification
3.4. Sequencing Techniques
3.5. Analysis Tools
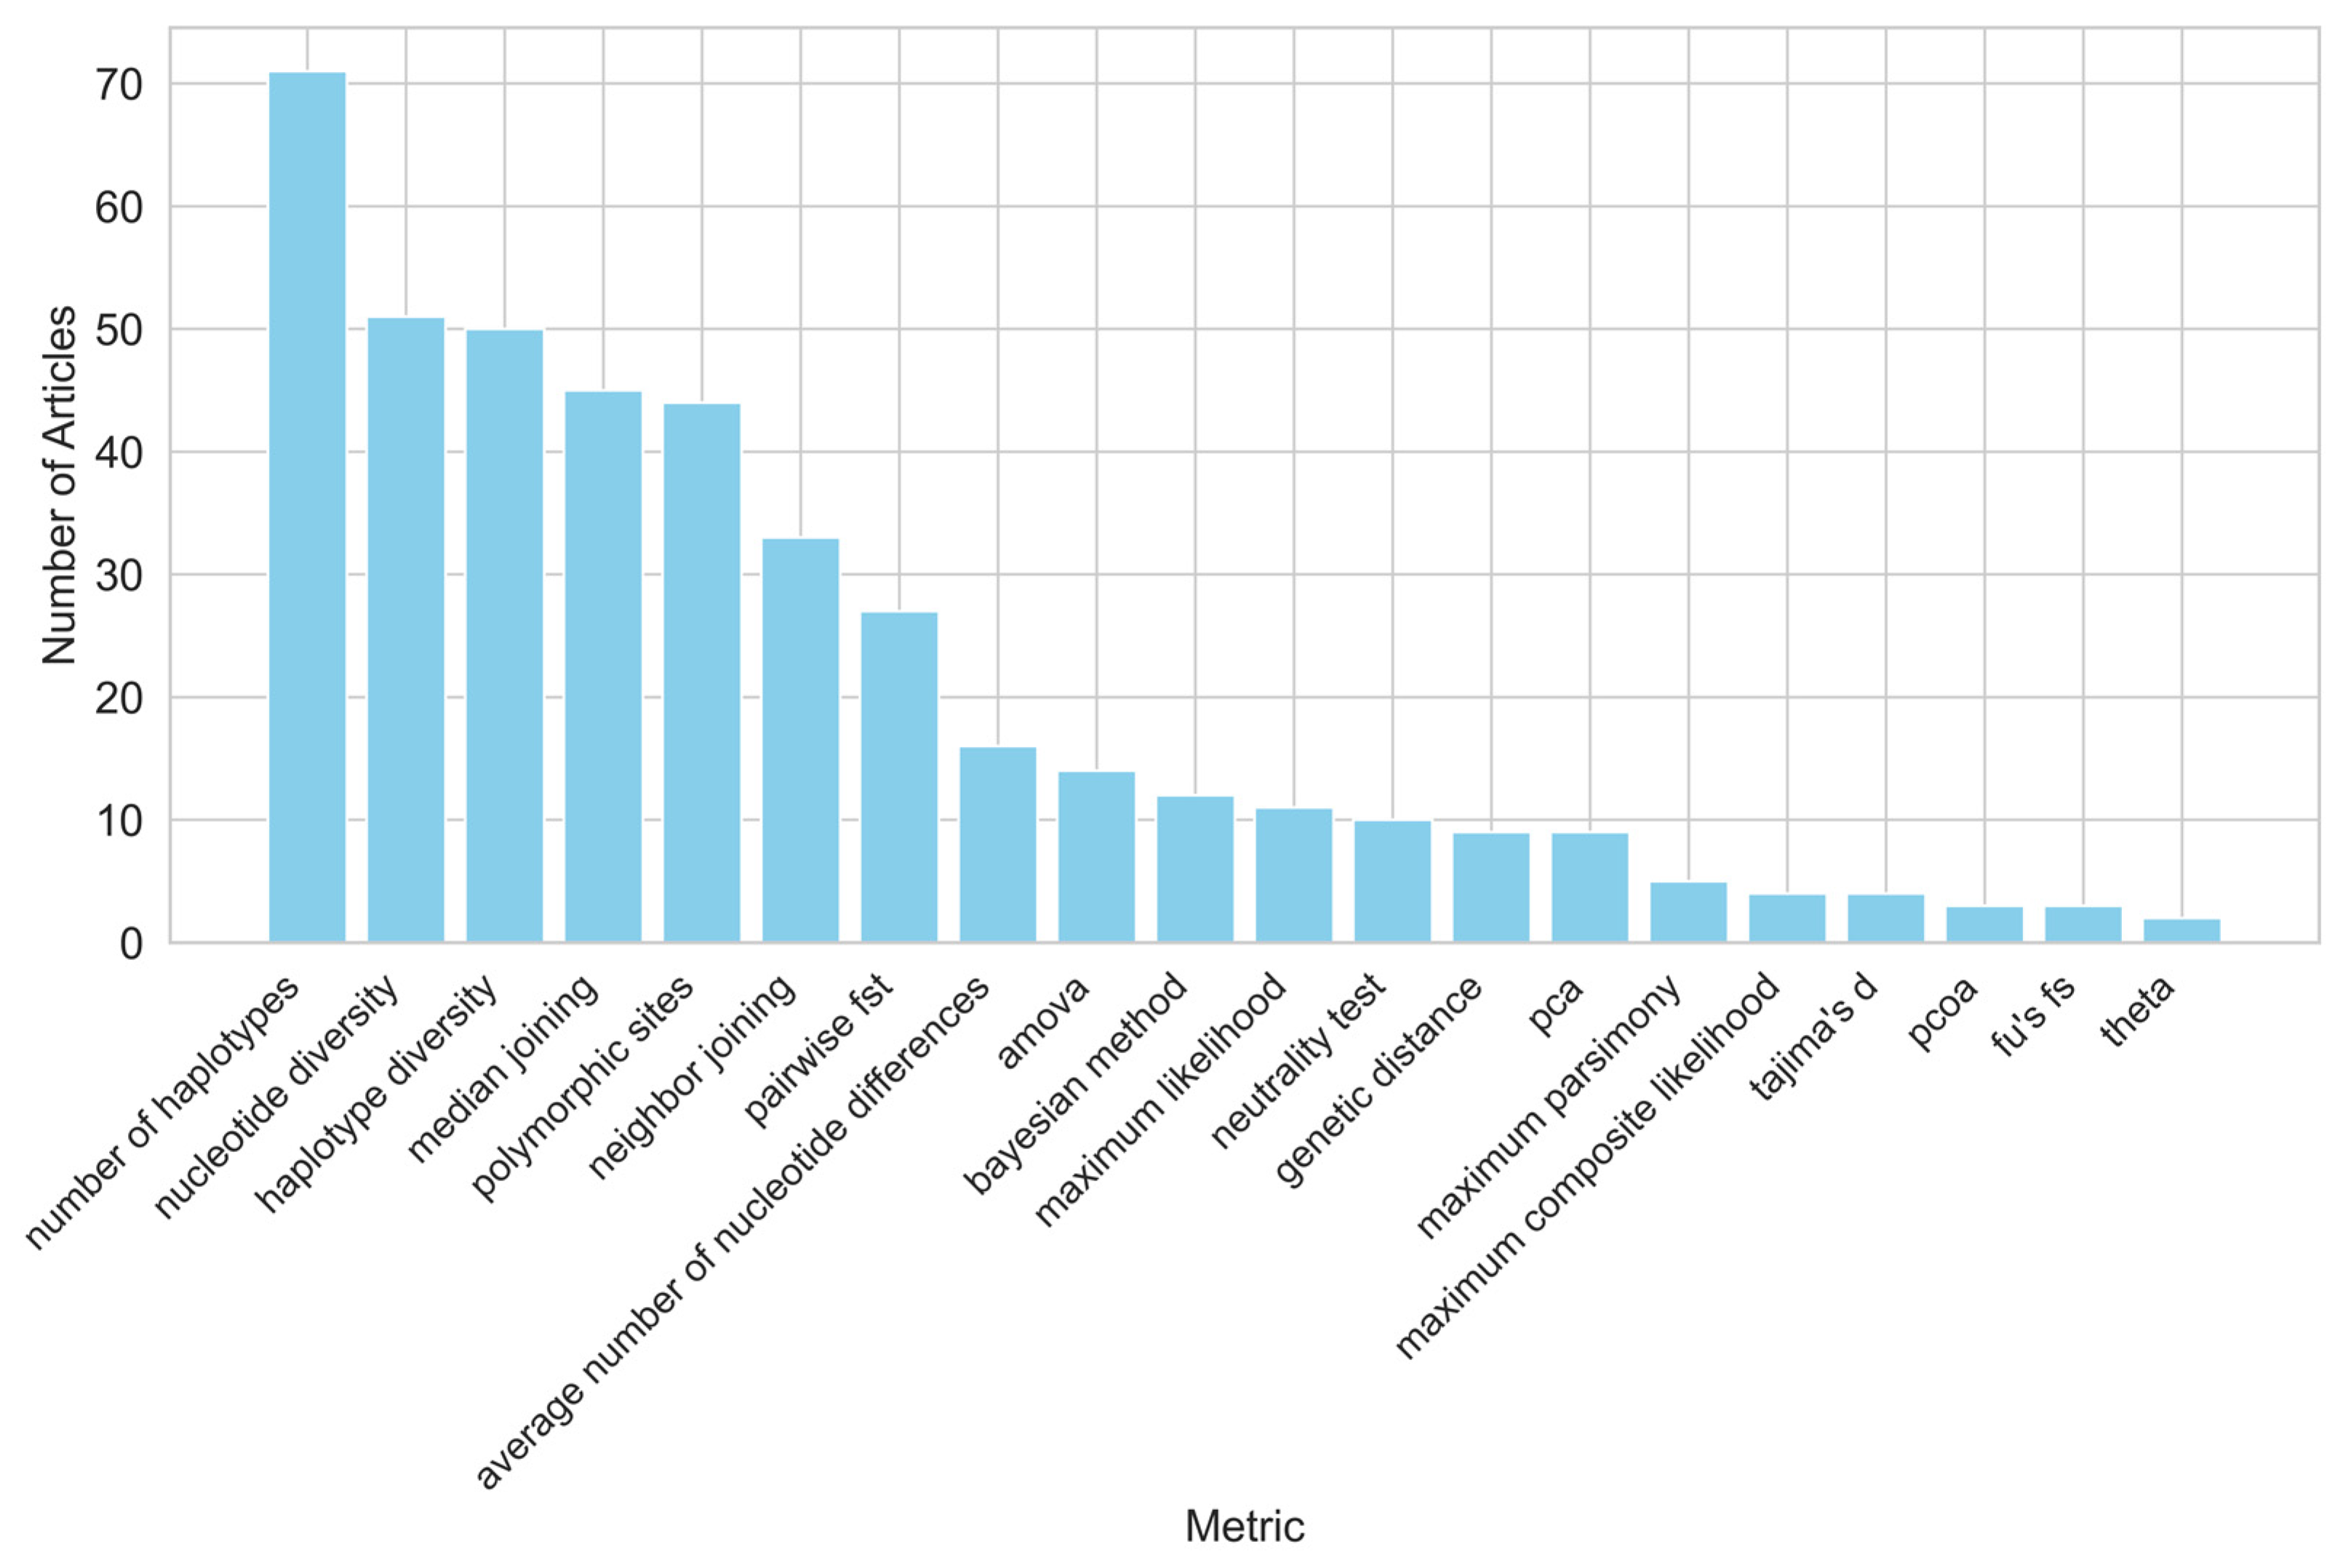
3.6. Metrics
3.7. Haplogroups
3.8. Global Distribution of Studies
3.9. Breeds Studied
4. Discussion
5. Limitations and Perspectives
5.1. Limitations
5.2. Perspectives
6. Conclusions
Supplementary Materials
Author Contributions
Funding
Institutional Review Board Statement
Informed Consent Statement
Data Availability Statement
Acknowledgments
Conflicts of Interest
References
- Outram, A.K.; Stear, N.A.; Bendrey, R.; Olsen, S.; Kasparov, A.; Zaibert, V.; Thorpe, N.; Evershed, R.P. The Earliest Horse Harnessing and Milking. Science 2009, 323, 1332–1335. [Google Scholar] [CrossRef] [PubMed]
- Polak, G.; Gurgul, A.; Jasielczuk, I.; Szmatoła, T.; Krupiński, J.; Bugno-Poniewierska, M. Suitability of Pedigree Information and Genomic Methods for Analyzing Inbreeding of Polish Cold-Blooded Horses Covered by Conservation Programs. Genes 2021, 12, 429. [Google Scholar] [CrossRef] [PubMed]
- Myćka, G.; Klecel, W.; Stefaniuk-Szmukier, M.; Jaworska, J.; Musiał, A.D.; Ropka-Molik, K. Mitochondrial Whole D-Loop Variability in Polish Draft Horses of Sztumski Subtype. Animals 2022, 12, 1870. [Google Scholar] [CrossRef] [PubMed]
- McGahern, A.; Bower, M.a.M.; Edwards, C.J.; Brophy, P.O.; Sulimova, G.; Zakharov, I.; Vizuete-Forster, M.; Levine, M.; Li, S.; MacHugh, D.E.; et al. Evidence for Biogeographic Patterning of Mitochondrial DNA Sequences in Eastern Horse Populations. Anim. Genet. 2006, 37, 494–497. [Google Scholar] [CrossRef]
- Khanshour, A.M.; Cothran, E.G. Maternal Phylogenetic Relationships and Genetic Variation among Arabian Horse Populations Using Whole Mitochondrial DNA D-Loop Sequencing. BMC Genet. 2013, 14, 83. [Google Scholar] [CrossRef]
- Moridi, M.; Masoudi, A.A.; Vaez Torshizi, R.; Hill, E.W. Mitochondrial DNA D-Loop Sequence Variation in Maternal Lineages of Iranian Native Horses. Anim. Genet. 2013, 44, 209–213. [Google Scholar] [CrossRef]
- Bowling, A.T.; Del Valle, A.; Bowling, M. A Pedigree-Based Study of Mitochondrial D-Loop DNA Sequence Variation among Arabian Horses. Anim. Genet. 2000, 31, 1–7. [Google Scholar] [CrossRef]
- Lippold, S.; Matzke, N.J.; Reissmann, M.; Hofreiter, M. Whole Mitochondrial Genome Sequencing of Domestic Horses Reveals Incorporation of Extensive Wild Horse Diversity during Domestication. BMC Evol. Biol. 2011, 11, 328. [Google Scholar] [CrossRef]
- Achilli, A.; Olivieri, A.; Soares, P.; Lancioni, H.; Kashani, B.H.; Perego, U.A.; Nergadze, S.G.; Carossa, V.; Santagostino, M.; Capomaccio, S.; et al. Mitochondrial Genomes from Modern Horses Reveal the Major Haplogroups That Underwent Domestication. Proc. Natl. Acad. Sci. USA 2012, 109, 2449–2454. [Google Scholar] [CrossRef]
- Cieslak, M.; Pruvost, M.; Benecke, N.; Hofreiter, M.; Morales, A.; Reissmann, M.; Ludwig, A. Origin and History of Mitochondrial DNA Lineages in Domestic Horses. PLoS ONE 2010, 5, e15311. [Google Scholar] [CrossRef]
- Jansen, T.; Forster, P.; Levine, M.A.; Oelke, H.; Hurles, M.; Renfrew, C.; Weber, J.; Olek, K. Mitochondrial DNA and the Origins of the Domestic Horse. Proc. Natl. Acad. Sci. USA 2002, 99, 10905–10910. [Google Scholar] [CrossRef] [PubMed]
- Page, M.J.; McKenzie, J.E.; Bossuyt, P.M.; Boutron, I.; Hoffmann, T.C.; Mulrow, C.D.; Shamseer, L.; Tetzlaff, J.M.; Akl, E.A.; Brennan, S.E.; et al. The PRISMA 2020 Statement: An Updated Guideline for Reporting Systematic Reviews. BMJ 2021, 372, n71. [Google Scholar] [CrossRef] [PubMed]
- Kumar, S. MEGA12: Molecular Evolutionary Genetic Analysis Version 12 for Adaptive and Green Computing. Mol. Biol. Evol. 2024, 41, msae263. [Google Scholar] [CrossRef]
- Criscione, A.; Moltisanti, V.; Chies, L.; Marletta, D.; Bordonaro, S. A Genetic Analysis of the Italian Salernitano Horse. Animal 2015, 9, 1610–1616. [Google Scholar] [CrossRef] [PubMed]
- Giontella, A.; Cardinali, I.; Pieramati, C.; Cherchi, R.; Biggio, G.P.; Achilli, A.; Silvestrelli, M.; Lancioni, H. A Genetic Window on Sardinian Native Horse Breeds through Uniparental Molecular Systems. Animals 2020, 10, 1544. [Google Scholar] [CrossRef]
- Lu, H.; Bai, H.; Wang, L.; Zhang, T. Abundant Genetic Diversity and Maternal Origins of Modern Horses. Can. J. Anim. Sci. 2019, 99, 929. [Google Scholar] [CrossRef]
- Cardinali, I.; Lancioni, H.; Giontella, A.; Capodiferro, M.R.; Capomaccio, S.; Buttazzoni, L.; Biggio, G.P.; Cherchi, R.; Albertini, E.; Olivieri, A.; et al. An Overview of Ten Italian Horse Breeds through Mitochondrial DNA. PLoS ONE 2016, 11, e0153004. [Google Scholar] [CrossRef]
- Voronkova, V.; Nikolaeva, E.; Piskunov, A.; Babayan, O.; Takasu, M.; Tozaki, T.; Svishcheva, G.; Stolpovsky, Y. Assessment of Genetic Diversity and Structure of Russian and Mongolian Autochthonous Horse Breeds Using Nuclear and Mitochondrial DNA Markers. Russ. J. Genet. 2022, 58, 927–943. [Google Scholar] [CrossRef]
- Musiał, A.D.; Ropka-Molik, K.; Stefaniuk-Szmukier, M.; Myćka, G.; Bieniek, A.; Yasynetska, N. Characteristic of Przewalski Horses Population from Askania-Nova Reserve Based on Genetic Markers. Mol. Biol. Rep. 2023, 50, 7121–7126. [Google Scholar] [CrossRef]
- Cieslak, J.; Wodas, L.; Borowska, A.; Cothran, E.G.; Khanshour, A.M.; Mackowski, M. Characterization of the Polish Primitive Horse (Konik) Maternal Lines Using Mitochondrial D-Loop Sequence Variation. PeerJ 2017, 5, e3714. [Google Scholar] [CrossRef]
- Jimenez, L.M.; Mendez, S.; Dunner, S.; Cañón, J.; Cortés, Ó. Colombian Creole Horse Breeds: Same Origin but Different Diversity. Genet. Mol. Biol. 2012, 35, 790–796. [Google Scholar] [CrossRef] [PubMed]
- Ahmed, M.; Sheikh, A.; Mutwakil, M.; Saini, K.; Alsulaimany, F.; El Hanafy, A.; Sabir, J. Comparative Analysis of Atp6 Mitochondrial Gene Diversity in Arabian and Non-Arabian Horse Breeds. J. Anim. Plant Sci. 2016, 26, 437–444. [Google Scholar]
- Winton, C.L.; Plante, Y.; Hind, P.; McMahon, R.; Hegarty, M.J.; McEwan, N.R.; Davies-Morel, M.C.G.; Morgan, C.M.; Powell, W.; Nash, D.M. Comparative Genetic Diversity in a Sample of Pony Breeds from the U.K. and North America: A Case Study in the Conservation of Global Genetic Resources. Ecol. Evol. 2015, 5, 3507–3522. [Google Scholar] [CrossRef] [PubMed]
- Liu, S.; Fu, C.; Yang, Y.; Zhang, Y.; Ma, H.; Xiong, Z.; Ling, Y.; Zhao, C. Current Genetic Conservation of Chinese Indigenous Horses Revealed with Y-Chromosomal and Mitochondrial DNA Polymorphisms. G3 2021, 11, jkab008. [Google Scholar] [CrossRef]
- Glazewska, I.; Gralak, B.; Naczk, A. Differences and Changes: An Evaluation of the Genetic Diversity of Arabian Mares from Polish State Studs Born between 1996 and 2013. Ann. Anim. Sci. 2022, 22, 1225–1233. [Google Scholar] [CrossRef]
- Almarzook, S.; Reissmann, M.; Brockmann, G.A. Diversity of Mitochondrial DNA in Three Arabian Horse Strains. J. Appl. Genet. 2017, 58, 273–276. [Google Scholar] [CrossRef]
- Ianella, P.; Albuquerque, M.d.S.M.; Paiva, S.R.; Egito, A.A.d.; Almeida, L.D.; Sereno, F.T.P.S.; Carvalho, L.F.R.; Mariante, A. da S.; McManus, C.M. D-Loop Haplotype Diversity in Brazilian Horse Breeds. Genet. Mol. Biol. 2017, 40, 604–609. [Google Scholar] [CrossRef]
- Khrabrova, L.A.; Blohina, N.V.; Belousova, N.F.; Cothran, E.G. Estimation of the Genealogical Structure of Vyatka Horse Breed (Equus Ferus Caballus) Using DNA Analysis. Russ. J. Genet. 2022, 58, 462–466. [Google Scholar] [CrossRef]
- Engel, L.; Becker, D.; Nissen, T.; Russ, I.; Thaller, G.; Krattenmacher, N. Exploring the Origin and Relatedness of Maternal Lineages Through Analysis of Mitochondrial DNA in the Holstein Horse. Front. Genet. 2021, 12, 632500. [Google Scholar] [CrossRef]
- Álvarez, I.; Fernández, I.; Lorenzo, L.; Payeras, L.; Cuervo, M.; Goyache, F. Founder and Present Maternal Diversity in Two Endangered Spanish Horse Breeds Assessed via Pedigree and Mitochondrial DNA Information. J. Anim. Breed Genet. 2012, 129, 271–279. [Google Scholar] [CrossRef]
- Khaudov, A.D.; Duduev, A.S.; Kokov, Z.A.; Amshokov, K.K.; Zhekamukhov, M.K.; Zaitsev, A.M.; Reissmann, M. Genetic Analysis of Maternal and Paternal Lineages in Kabardian Horses by Uniparental Molecular Markers. Open Vet. J. 2018, 8, 40–46. [Google Scholar] [CrossRef] [PubMed]
- Bigi, D.; Perrotta, G.; Zambonelli, P. Genetic Analysis of Seven Italian Horse Breeds Based on Mitochondrial DNA D-Loop Variation. Anim. Genet. 2014, 45, 593–595. [Google Scholar] [CrossRef] [PubMed]
- Csizmár, N.; Mihók, S.; Jávor, A.; Kusza, S. Genetic Analysis of the Hungarian Draft Horse Population Using Partial Mitochondrial DNA D-Loop Sequencing. PeerJ 2018, 6, e4198. [Google Scholar] [CrossRef] [PubMed]
- Kobayashi, I.; Akita, M.; Takasu, M.; Tozaki, T.; Kakoi, H.; Nakamura, K.; Senju, N.; Matsuyama, R.; Horii, Y. Genetic Characteristics of Feral Misaki Horses Based on Polymorphisms of Microsatellites and Mitochondrial DNA. J. Vet. Med. Sci. 2019, 81, 707–711. [Google Scholar] [CrossRef]
- Kusza, S.; Priskin, K.; Ivankovic, A.; Jedrzejewska, B. Genetic Characterization and Population Bottleneck in the Hucul Horse Based on Microsatellite and Mitochondrial Data. Biol. J. Linn. Soc. 2013, 109, 54–65. [Google Scholar] [CrossRef]
- Nguyen, T.B.; Paul, R.C.; Okuda, Y.; Le, T.N.A.; Pham, P.T.K.; Kaissar, K.J.; Kazhmurat, A.; Bibigul, S.; Bakhtin, M.; Kazymbet, P.; et al. Genetic Characterization of Kushum Horses in Kazakhstan Based on Haplotypes of Mtdna and y Chromosome, and Genes Associated with Important Traits of the Horses. J. Equine Sci. 2020, 31, 35–43. [Google Scholar] [CrossRef]
- Senju, N.; Tozaki, T.; Kakoi, H.; Almunia, J.; Maeda, M.; Matsuyama, R.; Takasu, M. Genetic Characterization of the Miyako Horse Based on Polymorphisms of Microsatellites and Mitochondrial DNA. J. Vet. Med. Sci. 2017, 79, 218–223. [Google Scholar] [CrossRef]
- Effa, K.; Rosenbom, S.; Han, J.; Dessie, T.; Beja-Pereira, A. Genetic Diversities and Historical Dynamics of Native Ethiopian Horse Populations (Equus caballus) Inferred from Mitochondrial DNA Polymorphisms. Genes 2021, 12, 155. [Google Scholar] [CrossRef]
- Machmoum, M.; Badaoui, B.; Petit, D.; Germot, A.; El Alaoui, M.A.; Boujenane, I.; Piro, M. Genetic Diversity and Maternal Phylogenetic Relationships among Populations and Strains of Arabian Show Horses. Animals 2023, 13, 2021. [Google Scholar] [CrossRef]
- Ovchinnikov, I.V.; Dahms, T.; Herauf, B.; McCann, B.; Juras, R.; Castaneda, C.; Cothran, E.G. Genetic Diversity and Origin of the Feral Horses in Theodore Roosevelt National Park. PLoS ONE 2018, 13, e0200795. [Google Scholar] [CrossRef]
- Gemingguli, M.; Iskhan, K.R.; Li, Y.; Qi, A.; Wunirifu, W.; Ding, L.Y.; Wumaierjiang, A. Genetic Diversity and Population Structure of Kazakh Horses (Equus caballus) Inferred from mtDNA Sequences. Genet. Mol. Res. 2016, 15, gmr.15048618. [Google Scholar] [CrossRef] [PubMed]
- Wolfsberger, W.; Ayala, N.; Castro-Marquez, S.; Irizarry-Negron, V.; Potapchuk, A.; Shchubelka, K.; Potish, L.; Majeske, A.; Oliver, L.; Lameiro, A.; et al. Genetic Diversity and Selection in Puerto Rican Horses. Sci. Rep. 2022, 12, 515. [Google Scholar] [CrossRef] [PubMed]
- Evrigh, N.; Omri, M.; Boustan, A.; Seyedsharifi, R.; Vahedi, V. Genetic Diversity and Structure of Iranian Horses’ Population Based on Mitochondrial Markers. J. Equine Vet. Sci. 2018, 64, 107–111. [Google Scholar] [CrossRef] [PubMed]
- Takasu, M.; Ishihara, N.; Tozaki, T.; Kakoi, H.; Maeda, M.; Mukoyama, H. Genetic Diversity of Maternal Lineage in the Endangered Kiso Horse Based on Polymorphism of the Mitochondrial DNA D-Loop Region. J. Vet. Med. Sci. 2014, 76, 1451–1456. [Google Scholar] [CrossRef]
- Khrabrova, L.A.; Nikolaeva, A.A.; Blohina, N.V.; Sorokin, S.I. Genetic Diversity of Mitochondrial DNA Haplogroups in the Don Horse Breed. Sib. J. Life Sci. Agric. 2023, 15, 278–290. [Google Scholar] [CrossRef]
- Zhang, T.; Lu, H.; Chen, C.; Jiang, H.; Wu, S. Genetic Diversity of mtDNA D-Loop and Maternal Origin of Three Chinese Native Horse Breeds. Asian-Australas. J. Anim. Sci. 2012, 25, 921–926. [Google Scholar] [CrossRef]
- Sziszkosz, N.; Mihók, S.; Jávor, A.; Kusza, S. Genetic Diversity of the Hungarian Gidran Horse in Two Mitochondrial DNA Markers. PEERJ 2016, 4, e1894. [Google Scholar] [CrossRef]
- Senju, N.; Tozaki, T.; Kakoi, H.; Shinjo, A.; Matsuyama, R.; Almunia, J.; Takasu, M. Genetic Diversity of the Yonaguni Horse Based on Polymorphisms in Microsatellites and Mitochondria DNA. J. Vet. Med. Sci. 2017, 79, 425–431. [Google Scholar] [CrossRef]
- Deshpande, K.; Perez, E.; Leyva, N.; Suarez, M.; Mills, D.K. Genetic Structure of the Big Summit Herd and Neighboring Wild Horse Populations Inhabiting Herd Management Areas of Oregon. West. N. Am. Nat. 2019, 79, 85–98. [Google Scholar] [CrossRef]
- Kvist, L.; Niskanen, M.; Mannermaa, K.; Wutke, S.; Aspi, J. Genetic Variability and History of a Native Finnish Horse Breed. Genet. Sel. Evol. 2019, 51, 35. [Google Scholar] [CrossRef]
- Giontella, A.; Sarti, F.; Cardinali, I.; Giovannini, S.; Cherchi, R.; Lancioni, H.; Silvestrelli, M.; Pieramati, C. Genetic Variability and Population Structure in the Sardinian Anglo-Arab Horse. Animals 2020, 10, 1018. [Google Scholar] [CrossRef] [PubMed]
- Cozzi, M.C.; Strillacci, M.G.; Valiati, P.; Rogliano, E.; Bagnato, A.; Longeri, M. Genetic Variability of Akhal-Teke Horses Bred in Italy. PeerJ 2018, 2018, e4889. [Google Scholar] [CrossRef] [PubMed]
- Kang, Z.; Shi, J.; Liu, T.; Zhang, Y.; Zhang, Q.; Liu, Z.; Wang, J.; Cheng, S. Genome-Wide Single-Nucleotide Polymorphism Data and Mitochondrial Hypervariable Region 1 Nucleotide Sequence Reveal the Origin of the Akhal-Teke Horse. Anim. Biosci. 2023, 36, 1499–1507. [Google Scholar] [CrossRef] [PubMed]
- Yang, L.; Kong, X.; Yang, S.; Dong, X.; Yang, J.; Gou, X.; Zhang, H. Haplotype Diversity in Mitochondrial DNA Reveals the Multiple Origins of Tibetan Horse. PLoS ONE 2018, 13, e0201564. [Google Scholar] [CrossRef]
- Ropka-Molik, K.; Ayad, A.; Musiał, A.D.; Besseboua, O.; Aissanou, S.; Stefaniuk-Szmukier, M.; Piórkowska, K. Insight into the Genetic Diversity of Selle Français Horse Populations Based on Whole D-Loop Sequencing of Mitochondrial DNA. Folia Biol. 2024, 72, 65–73. [Google Scholar] [CrossRef]
- KOSEMAN, A.; OZSENSOY, Y.; ERDOGAN, M.; YARALI, C.; TOPRAK, B.; ZENGIN, K.; SEKER, İ. Investigation of Genetic Structures of Coloured Horses by Mtdna D-Loop Sequence Analysis in Turkey. Vet. Fak. Derg. 2019, 25, 769–778. [Google Scholar] [CrossRef]
- Ning, T.; Ling, Y.; Hu, S.; Ardalan, A.; Li, J.; Mitra, B.; Chaudhuri, T.; Guan, W.; Zhao, Q.; Ma, Y.; et al. Local Origin or External Input: Modern Horse Origin in East Asia. BMC Evol. Biol. 2019, 19, 217. [Google Scholar] [CrossRef]
- Sild, E.; Värv, S.; Kaart, T.; Kantanen, J.; Popov, R.; Viinalass, H. Maternal and Paternal Genetic Variation in Estonian Local Horse Breeds in the Context of Geographically Adjacent and Distant Eurasian Breeds. Anim. Genet. 2019, 50, 757–760. [Google Scholar] [CrossRef]
- Prystupa, J.M.; Hind, P.; Cothran, E.G.; Plante, Y. Maternal Lineages in Native Canadian Equine Populations and Their Relationship to the Nordic and Mountain and Moorland Pony Breeds. J. Hered. 2012, 103, 380–390. [Google Scholar] [CrossRef]
- Novoa-Bravo, M.; Bernal-Pinilla, E.; García, L.F. Microevolution Operating in Domestic Animals: Evidence from the Colombian Paso Horses. Mamm. Biol. 2021, 101, 181–192. [Google Scholar] [CrossRef]
- Liu, G.; Xu, C.-Q.; Cao, Q.; Zimmermann, W.; Songer, M.; Zhao, S.-S.; Li, K.; Hu, D.-F. Mitochondrial and Pedigree Analysis in Przewalski’s Horse Populations: Implications for Genetic Management and Reintroductions. Mitochondrial DNA 2014, 25, 313–318. [Google Scholar] [CrossRef] [PubMed]
- Yordanov, G.; Hristov, P.; Ivanova, A.; Mitkov, I.; Sirakova, D.; Mehandzyiski, I.; Radoslavov, G. Mitochondrial Diversity in Mountain Horse Population from the South-Eastern Europe. Mitochondrial DNA Part A DNA Mapp. Seq. Anal. 2017, 28, 787–792. [Google Scholar] [CrossRef]
- Czernekova, V.; Kott, T.; Majzlik, I. Mitochondrial D-Loop Sequence Variation among Hucul Horse. Czech J. Anim. Sci. 2013, 58, 437–442. [Google Scholar] [CrossRef]
- Dell, A.C.; Curry, M.C.; Yarnell, K.M.; Starbuck, G.R.; Wilson, P.B. Mitochondrial D-Loop Sequence Variation and Maternal Lineage in the Endangered Cleveland Bay Horse. PLoS ONE 2020, 15, e0243247. [Google Scholar] [CrossRef]
- Musiał, A.D.; Radović, L.; Stefaniuk-Szmukier, M.; Bieniek, A.; Wallner, B.; Ropka-Molik, K. Mitochondrial DNA and Y Chromosome Reveal the Genetic Structure of the Native Polish Konik Horse Population. PeerJ 2024, 12, e17549. [Google Scholar] [CrossRef]
- Nikbakhsh, M.; Varkoohi, S.; Seyedabadi, H.R. Mitochondrial DNA D-Loop Hyper-Variable Region 1 Variability in Kurdish Horse Breed. Vet. Med. Sci. 2023, 9, 721–728. [Google Scholar] [CrossRef]
- Yang, S.-L.; Li, A.-P.; Xu, L.-X.; Yang, H. Short Communication: Mitochondrial DNA D-Loop Sequence Diversity and Origin of Chinese Pony Breeds (Equus caballus). Can. J. Anim. Sci. 2013, 93, 313–319. [Google Scholar] [CrossRef]
- Othman, O.E.; Mahrous, K.F.; Shafey, H.I. Mitochondrial DNA Genetic Variations among Four Horse Populations in Egypt. J. Genet. Eng. Biotechnol. 2017, 15, 469–474. [Google Scholar] [CrossRef]
- Morelli, L.; Useli, A.; Sanna, D.; Barbato, M.; Contu, D.; Pala, M.; Cancedda, M.; Francalacci, P. Mitochondrial DNA Lineages of Italian Giara and Sarcidano Horses. Genet. Mol. Res. 2014, 13, 8241–8257. [Google Scholar] [CrossRef]
- Yordanov, G.; Palova, N.; Mehandjyiski, I.; Hristov, P. Mitochondrial DNA Sequencing Illuminates Genetic Diversity and Origin of Hunagrian Nonius Horse Breed and His Relatives–Danubian Horse and Serbian Nonius. Anim. Biotechnol. 2023, 34, 3897–3907. [Google Scholar] [CrossRef]
- Sheikh, A. Mitochondrial DNA Sequencing of Kehilan and Hamdani Horses from Saudi Arabia. Saudi J. Biol. Sci. 2023, 30, 103741. [Google Scholar] [CrossRef] [PubMed]
- Giontella, A.; Cardinali, I.; Lancioni, H.; Giovannini, S.; Pieramati, C.; Silvestrelli, M.; Sarti, F.M. Mitochondrial DNA Survey Reveals the Lack of Accuracy in Maremmano Horse Studbook Records. Animals 2020, 10, 839. [Google Scholar] [CrossRef] [PubMed]
- Lancioni, H.; Cardinali, I.; Giontella, A.; Antognoni, M.T.; Miglio, A. Mitochondrial DNA Variation in the Italian Heavy Draught Horse. PeerJ 2020, 2020, e8996. [Google Scholar] [CrossRef] [PubMed]
- Hristov, P.; Yordanov, G.; Vladov, V.; Neov, B.; Palova, N.; Radoslavov, G. Mitochondrial Profiles of the East Bulgarian and the Pleven Horse Breeds. J. Equine Vet. Sci. 2020, 88, 102933. [Google Scholar] [CrossRef]
- Kvist, L.; Niskanen, M. Modern Northern Domestic Horses Carry Mitochondrial DNA Similar to Przewalski’s Horse. J. Mamm. Evol. 2021, 28, 371–376. [Google Scholar] [CrossRef]
- Devi, K.M.; Ghosh, S.K. Molecular Phylogeny of Indian Horse Breeds with Special Reference to Manipuri Pony Based on Mitochondrial D-Loop. Mol. Biol. Rep. 2013, 40, 5861–5867. [Google Scholar] [CrossRef]
- Castaneda, C.; Juras, R.; Khanshour, A.; Randlaht, I.; Wallner, B.; Rigler, D.; Lindgren, G.; Raudsepp, T.; Cothran, E. Population Genetic Analysis of the Estonian Native Horse Suggests Diverse and Distinct Genetics, Ancient Origin and Contribution from Unique Patrilines. Genes 2019, 10, 629. [Google Scholar] [CrossRef]
- Sharif, M.B.; Fitak, R.R.; Wallner, B.; Orozco-terWengel, P.; Frewin, S.; Fremaux, M.; Mohandesan, E. Reconstruction of the Major Maternal and Paternal Lineages in the Feral New Zealand Kaimanawa Horses. Animals 2022, 12, 3508. [Google Scholar] [CrossRef]
- Alvarez, I.; Fernandez, I.; Cuervo, M.; Martin, D.; Lorenzo, L.; Goyache, F. Short Communication. Mitochondrial DNA Diversity of the Founder Populations of the Asturcón Pony. Span. J. Agric. Res. 2013, 11, 702–707. [Google Scholar] [CrossRef]
- Ma, H.; Wu, Y.; Xiang, H.; Yang, Y.; Wang, M.; Zhao, C.; Wu, C. Some Maternal Lineages of Domestic Horses May Have Origins in East Asia Revealed with Further Evidence of Mitochondrial Genomes and HVR-1 Sequences. PeerJ 2018, 6, e4896. [Google Scholar] [CrossRef]
- Yang, Y.; Zhu, Q.; Liu, S.; Zhao, C.; Wu, C. The Origin of Chinese Domestic Horses Revealed with Novel mtDNA Variants. Anim. Sci. J. 2017, 88, 19–26. [Google Scholar] [CrossRef] [PubMed]
- Bower, M.A.; Whitten, M.; Nisbet, R.E.R.; Spencer, M.; Dominy, K.M.; Murphy, A.M.; Cassidy, R.; Barrett, E.; Hill, E.W.; Binns, M. Thoroughbred Racehorse Mitochondrial DNA Demonstrates Closer than Expected Links between Maternal Genetic History and Pedigree Records. J. Anim. Breed. Genet. 2013, 130, 227–235. [Google Scholar] [CrossRef] [PubMed]
- Alves, J.; Anjos, M.; Bastos, M.; de Oliveira, L.; Oliveira, I.; Pinto, L.; de Oliveira, C.; Costa, R.; de Camargo, G. Variability Analyses of the Maternal Lineage of Horses and Donkeys. Gene 2021, 769, 145231. [Google Scholar] [CrossRef] [PubMed]
- Khrabrova, L.A.; Blohina, N.V.; Bazaron, B.Z.; Khamiruev, T.N. Variability of Mitochondrial DNA D-Loop Sequences in Zabaikalskaya Horse Breed. Vavilovskii Zhurnal Genet. I Sel. 2021, 25, 486–491. [Google Scholar] [CrossRef]
- Hudson, W. Whole-Loop Mitochondrial DNA D-Loop Sequence Variability in Egyptian Arabian Equine Matrilines. PLoS ONE 2017, 12, e0184309. [Google Scholar] [CrossRef]
- Miller, S. A Simple Salting-out Proceddure Tissue for Extracting DNA from Human Nucleated Cells. Nucleic Acids Res. 1988, 16, 221. [Google Scholar] [CrossRef]
- Yoon, S.H.; Kim, J.; Shin, D.; Cho, S.; Kwak, W.; Lee, H.-K.; Park, K.-D.; Kim, H. Complete Mitochondrial Genome Sequences of Korean Native Horse from Jeju Island: Uncovering the Spatio-Temporal Dynamics. Mol. Biol. Rep. 2017, 44, 233–242. [Google Scholar] [CrossRef]
- Rozas, J.; Ferrer-Mata, A.; Sánchez-DelBarrio, J.C.; Guirao-Rico, S.; Librado, P.; Ramos-Onsins, S.E.; Sánchez-Gracia, A. DnaSP 6: DNA Sequence Polymorphism Analysis of Large Data Sets. Mol. Biol. Evol. 2017, 34, 3299–3302. [Google Scholar] [CrossRef]
- Tamura, K.; Stecher, G.; Kumar, S. MEGA11: Molecular Evolutionary Genetics Analysis Version 11. Mol. Biol. Evol. 2021, 38, 3022–3027. [Google Scholar] [CrossRef]
- Fluxus-Engineering.Com. Available online: https://www.fluxus-engineering.com/index.htm (accessed on 6 January 2025).
- Excoffier, L.; Lischer, H.E.L. Arlequin Suite Ver 3.5: A New Series of Programs to Perform Population Genetics Analyses under Linux and Windows. Mol. Ecol. Resour. 2010, 10, 564–567. [Google Scholar] [CrossRef]
- Thompson, J.D.; Higgins, D.G.; Gibson, T.J. CLUSTAL W: Improving the Sensitivity of Progressive Multiple Sequence Alignment through Sequence Weighting, Position-Specific Gap Penalties and Weight Matrix Choice. Nucleic Acids Res. 1994, 22, 4673–4680. [Google Scholar] [CrossRef] [PubMed]
- Hall, T. BioEdit: A User-Friendly Biological Sequence Alignment Editor and Analysis Program for Windows 95/98/NT. Available online: https://www.semanticscholar.org/paper/BIOEDIT%3A-A-USER-FRIENDLY-BIOLOGICAL-SEQUENCE-EDITOR-Hall/0ae262d9cf78536754bc064e07113ab5e978f208 (accessed on 6 January 2025).
- Altschul, S.F.; Gish, W.; Miller, W.; Myers, E.W.; Lipman, D.J. Basic Local Alignment Search Tool. J. Mol. Biol. 1990, 215, 403–410. [Google Scholar] [CrossRef] [PubMed]
- Kong, S.; Sánchez-Pacheco, S.J.; Murphy, R.W. On the Use of Median-Joining Networks in Evolutionary Biology. Cladistics 2016, 32, 691–699. [Google Scholar] [CrossRef] [PubMed]
- Vilà, C.; Leonard, J.A.; Götherström, A.; Marklund, S.; Sandberg, K.; Lidén, K.; Wayne, R.K.; Ellegren, H. Widespread Origins of Domestic Horse Lineages. Sci. (Am. Assoc. Adv. Sci.) 2001, 291, 474–477. [Google Scholar] [CrossRef]
- Zemanova, M.A. Noninvasive Genetic Assessment Is an Effective Wildlife Research Tool When Compared with Other Approaches. Genes 2021, 12, 1672. [Google Scholar] [CrossRef]
- Gurău, M.R.; Crețu, D.M.; Negru, E.; Ionescu, T.; Udriste, A.A.; Cornea, P.; Bărăităreanu, S. Comparative Analysis of Total DNA Isolation Procedure from Blood and Hair Follicule Samples in Goats. Rev. Româna Med. Vet. 2021, 31, 82–86. [Google Scholar]
- Muko, R.; Ojima, Y.; Matsuda, H.; Toishi, Y.; Oikawa, M.; Shin, T.; Sato, H.; Tanaka, A. Comparison of DNA Extraction Methods for Genotyping Equine Histidine-Rich Glycoprotein Insertion/Deletion Polymorphisms Using Oral Mucosa Swabs and Feces. Vet. Anim. Sci. 2024, 25, 100361. [Google Scholar] [CrossRef]
- Ishida, N.; Hasegawa, T.; Takeda, K.; Sakagami, M.; Onishi, A.; Inumaru, S.; Komatsu, M.; Mukoyama, H. Polymorphic Sequence in the D-Loop Region of Equine Mitochondrial DNA. Anim. Genet. 1994, 25, 215–221. [Google Scholar] [CrossRef]
- Xiufeng, X.; Árnason, Ú. The Complete Mitochondrial DNA Sequence of the Horse, Equus caballus: Extensive Heteroplasmy of the Control Region. Gene 1994, 148, 357–362. [Google Scholar] [CrossRef]
- Ronquist, F.; Teslenko, M.; van der Mark, P.; Ayres, D.L.; Darling, A.; Höhna, S.; Larget, B.; Liu, L.; Suchard, M.A.; Huelsenbeck, J.P. MrBayes 3.2: Efficient Bayesian Phylogenetic Inference and Model Choice Across a Large Model Space. Syst. Biol. 2012, 61, 539–542. [Google Scholar] [CrossRef]
- Williams, T.L.; Moret, B.M.E. An Investigation of Phylogenetic Likelihood Methods. In Proceedings of the Third IEEE Symposium on Bioinformatics and Bioengineering, Bethesda, MD, USA, 12 March 2003; Proceedings; pp. 79–86. [Google Scholar]
- Beerli, P. Comparison of Bayesian and Maximum-Likelihood Inference of Population Genetic Parameters. Bioinformatics 2006, 22, 341–345. [Google Scholar] [CrossRef]
- Suzuki, Y.; Glazko, G.V.; Nei, M. Overcredibility of Molecular Phylogenies Obtained by Bayesian Phylogenetics. Proc. Natl. Acad. Sci. USA 2002, 99, 16138–16143. [Google Scholar] [CrossRef] [PubMed]
- Castañeda-Rico, S.; León-Paniagua, L.; Edwards, C.W.; Maldonado, J.E. Ancient DNA from Museum Specimens and Next Generation Sequencing Help Resolve the Controversial Evolutionary History of the Critically Endangered Puebla Deer Mouse. Front. Ecol. Evol. 2020, 8, 94. [Google Scholar] [CrossRef]
- Engel, L.; Becker, D.; Nissen, T.; Russ, I.; Thaller, G.; Krattenmacher, N. Mitochondrial DNA Variation Contributes to the Aptitude for Dressage and Show Jumping Ability in the Holstein Horse Breed. Animals 2022, 12, 704. [Google Scholar] [CrossRef]
- Lin, X.; Zheng, H.-X.; Davie, A.; Zhou, S.; Wen, L.; Meng, J.; Zhang, Y.; Aladaer, Q.; Liu, B.; Liu, W.-J.; et al. Association of Low Race Performance with mtDNA Haplogroup L3b of Australian Thoroughbred Horses. Mitochondrial DNA Part A 2018, 29, 323–330. [Google Scholar] [CrossRef] [PubMed]


| Study | Base Pairs Sequenced | Number of Sequences | Number of Breeds | Haplogroups/Clusters |
|---|---|---|---|---|
| Vilà et al. (2001) [96] | 355 bp | 191 (+38 from GenBank) | 10 | 6 clades (A to F) |
| Jansen et al. (2002) [11] | 469 bp truncated to 247 bp | 652 (318 new, 334 published) | 25 | 17 clusters |
| Cieslak et al. (2010) [10] | 722 bp truncated to 247 bp (HVR1) | 1961 (207 ancient, 1754 modern) | 46 | 19 haplogroups (A to K, X1 to X7) |
| Achilli et al. (2012) [9] | 16,500 bp (whole mitochondrial genome) | 83 complete mitochondrial genomes | Broad geographic representation | 18 haplogroups (A to R) |
| Achilli | Cieslak_ME | Jansen_ME | Cieslak_ML | Jansen_ML |
|---|---|---|---|---|
| A | D2; D2b | D2; D2b; G2 | ||
| B | D; D3; D3a; | A3; A6 | D; D3; D3a; | A3; A6 |
| C | J | A6; B2 | J | A6; B2 |
| D | G; G3; Gx4 | C2 | G; G3; Gx4 | C2 |
| E | X3; X3d | X3; X3d | ||
| F | A2 | A2 | ||
| G | ||||
| H | X4; X6; X6c; X12; X14 | A6 | B3; X4; X4a; X12 | A6 |
| I | A; I | B2 | I | B2 |
| J | H1; Kg2 | H1; Kg2 | ||
| K | X5 | A6 | X5 | A6 |
| L | X1; X2; X2b | D1; D2; D3 | X1; X2; X2b | D1; D2; D3 |
| M | B; X8a; B1 | C1 | B; B1 | C1 |
| N | F; G2 | C2 | F | C2 |
| O | K3 | F1 | K3; K3b | F1 |
| P | K3b | F1 | ||
| Q | K2; K2b | F2 | K2; K2b | F2 |
| R | X7; X7a2; X7a; X7a1 | G | X7; X7a2; X7a; X7a1 | G |
Disclaimer/Publisher’s Note: The statements, opinions and data contained in all publications are solely those of the individual author(s) and contributor(s) and not of MDPI and/or the editor(s). MDPI and/or the editor(s) disclaim responsibility for any injury to people or property resulting from any ideas, methods, instructions or products referred to in the content. |
© 2025 by the authors. Licensee MDPI, Basel, Switzerland. This article is an open access article distributed under the terms and conditions of the Creative Commons Attribution (CC BY) license (https://creativecommons.org/licenses/by/4.0/).
Share and Cite
Agbani, A.; Aminou, O.; Machmoum, M.; Germot, A.; Badaoui, B.; Petit, D.; Piro, M. A Systematic Literature Review of Mitochondrial DNA Analysis for Horse Genetic Diversity. Animals 2025, 15, 885. https://doi.org/10.3390/ani15060885
Agbani A, Aminou O, Machmoum M, Germot A, Badaoui B, Petit D, Piro M. A Systematic Literature Review of Mitochondrial DNA Analysis for Horse Genetic Diversity. Animals. 2025; 15(6):885. https://doi.org/10.3390/ani15060885
Chicago/Turabian StyleAgbani, Ayman, Oumaima Aminou, Mohamed Machmoum, Agnes Germot, Bouabid Badaoui, Daniel Petit, and Mohammed Piro. 2025. "A Systematic Literature Review of Mitochondrial DNA Analysis for Horse Genetic Diversity" Animals 15, no. 6: 885. https://doi.org/10.3390/ani15060885
APA StyleAgbani, A., Aminou, O., Machmoum, M., Germot, A., Badaoui, B., Petit, D., & Piro, M. (2025). A Systematic Literature Review of Mitochondrial DNA Analysis for Horse Genetic Diversity. Animals, 15(6), 885. https://doi.org/10.3390/ani15060885