
Bioavailability of Tryptophan Biomass for Laying Hens
 , , , , , , , , , and
Simple Summary
Abstract
1. Introduction
2. Materials and Methods
2.1. Ethical and Study Approvals
2.2. Assay 1: Direct Comparison Method
2.2.1. Housing, Management and Experimental Design
2.2.2. Treatments
2.3. Assay 2: Slope Ratio Method
2.3.1. Animals, Experimental Conditions, and Environment
2.3.2. Treatments and Diets
2.4. Performance
2.5. Egg Assessment
2.6. Body Composition
2.7. Chemical Analysis
2.8. Statistical Analysis
3. Results
3.1. Assay 1: Direct Comparison Between L-Tryptophan Biomass 60% and L-Tryptophan 98%
3.2. Assay 2: Slope Ratio Method to Determine the RBV of L-Tryptophan Biomass 60%
- (a)
- Whether sources of L-tryptophan have separate regression curves;
- (b)
- Whether there is a difference in regression slopes for L-tryptophan sources.
4. Discussion
5. Conclusions
Supplementary Materials
Author Contributions
Funding
Institutional Review Board Statement
Informed Consent Statement
Data Availability Statement
Acknowledgments
Conflicts of Interest
References
- Willcock, E.G.; Hopkins, F.G. The importance of individual amino-acids in metabolism. J. Physiol. 1906, 35, 88–102. [Google Scholar] [CrossRef]
- Osborne, T.B.; Mendel, L.B.; Ferry, E.L.; Wakeman, A.J. The amino-acid minimum for maintenance and growth, as exemplified by further experiments with lysine and tryptophane. J. Biol. Chem. 1916, 25, 1–12. [Google Scholar] [CrossRef]
- Berg, C.P.; Rose, W.C. Tryptophane and growth. I. Growth upon a tryptophane-deficient basal diet supplemented at varying intervals by the separate feeding of tryptophane. J. Biol. Chem. 1929, 82, 479–484. [Google Scholar] [CrossRef]
- Berg, C.P.; Rose, W.C.; Marvel, C.S. Tryptophane and growth. II. Growth upon a tryptophane-deficient basal diet supplemented with tryptophane derivatives. J. Biol. Chem. 1929, 85, 207–218. [Google Scholar] [CrossRef]
- Berg, C.P.; Bauguess, L.C. Tryptophane metabolism: III. The rate of absorption of l- and dl-tryptophane and tryptophane derivatives from the gastrointestinal tract of the rat. J. Biol. Chem. 1932, 98, 171–180. [Google Scholar] [CrossRef]
- Grau, C.R.; Almquist, H.J. Requirement of Tryptophane by the Chick: One Figure. J. Nutr. 1944, 28, 263–267. [Google Scholar] [CrossRef]
- Ingram, G.R.; Cravens, W.W.; Elvehjem, C.A.; Halpin, J.G. Studies on the Lysine and Tryptophan Requirements of the Laying and Breeding Hen. Poult. Sci. 1951, 30, 426–430. [Google Scholar] [CrossRef]
- Bray, D.J. Studies with corn-soya laying diets: 8. Requirements for limiting amino acids—The basal diet and the requirements for isoleucine, lysine and tryptophan. Poult. Sci. 1969, 48, 674–684. [Google Scholar] [CrossRef] [PubMed]
- Jensen, L.S.; Calderon, V.M.; Mendonca, C.X. Response to Tryptophan of Laying Hens Fed Practical Diets Varying in Protein Concentration1. Poult. Sci. 1990, 69, 1956–1965. [Google Scholar] [CrossRef]
- Russell, G.B.; Harms, R.H. Tryptophan requirement of the commercial hen. Poult. Sci. 1999, 78, 1283–1285. [Google Scholar] [CrossRef]
- Harms, R.H.; Russell, G.B. Evaluation of tryptophan requirement of the commercial layer by using a corn-soybean meal basal diet1. Poult. Sci. 2000, 79, 740–742. [Google Scholar] [CrossRef]
- Peganova, S.; Hirche, F.; Eder, K. Requirement of tryptophan in relation to the supply of large neutral amino acids in laying hens. Poult. Sci. 2003, 82, 815–822. [Google Scholar] [CrossRef]
- Bregendahl, K.; Roberts, S.A.; Kerr, B.; Hoehler, D. Ideal Ratios of Isoleucine, Methionine, Methionine Plus Cystine, Threonine, Tryptophan, and Valine Relative to Lysine for White Leghorn-Type Laying Hens of Twenty-Eight to Thirty-Four Weeks of Age. Poult. Sci. 2008, 87, 744–758. [Google Scholar] [CrossRef] [PubMed]
- Khattak, F.; Helmbrecht, A. Effect of different levels of tryptophan on productive performance, egg quality, blood biochemistry, and caecal microbiota of hens housed in enriched colony cages under commercial stocking density. Poult. Sci. 2019, 98, 2094–2104. [Google Scholar] [CrossRef] [PubMed]
- Wen, J.; Helmbrecht, A.; Elliot, M.A.; Thomson, J.; Persia, M.E. Evaluation of the tryptophan requirement of small-framed first cycle laying hens. Poult. Sci. 2019, 98, 1263–1271. [Google Scholar] [CrossRef] [PubMed]
- Sarsour, A.H.; Lee, J.T.; Haydon, K.; Persia, M.E. Tryptophan requirement of first-cycle commercial laying hens in peak egg production. Poult. Sci. 2021, 100, 100896. [Google Scholar] [CrossRef]
- Wensley, M.R.; Woodworth, J.C.; Derouchey, J.M.; Dritz, S.S.; Tokach, M.D.; Goodband, R.D.; Walters, H.G.; Leopold, B.A.; Coufal, C.D.; Haydon, K.D.; et al. Effects of amino acid biomass or feed-grade amino acids on growth performance of growing swine and poultry. Transl. Anim. Sci. 2020, 4, 49–58. [Google Scholar] [CrossRef]
- Lee, J.H.; Kwon, C.H.; Won, S.Y.; Kim, H.W.; Kil, D.Y. Evaluation of tryptophan biomass as an alternative to conventional crystalline tryptophan in broiler diets. J. Appl. Poult. Re. 2023, 32, 100302. [Google Scholar] [CrossRef]
- Hirakawa, D.A.; Baker, D.H. Assessment of lysine bioavailability in an intact protein mixture: Comparison of chick growth and precision-fed rooster assays. Nutr. Res. 1986, 6, 815–826. [Google Scholar] [CrossRef]
- Ammerman, C.; Baker, D.; Lewis, A. Bioavailability of Nutrients for Animals: Amino Acids, Minerals, Vitamins, 1st ed.; Academic Press: San Diego, CA, USA, 1995; p. 457. [Google Scholar]
- Littell, R.C.; Henry, P.R.; Lewis, A.J.; Ammerman, C.B. Estimation of relative bioavailability of nutrients using SAS procedures. J. Anim. Sci. 1997, 75, 2672–2683. [Google Scholar] [CrossRef]
- Hou, M.; Gao, S.; Wu, J.; Chen, S.; Zhang, K. Metabolic engineering of Escherichia coli to enhance L-tryptophan biosynthesis. Syst. Microbiol. Biomanuf. 2025, 5, 1–13. [Google Scholar] [CrossRef]
- Rostagno, H.S.; Albino, L.F.T.; Hannas, M.I.; Donzele, J.L.; Sakomura, N.K.; Perazzo, F.G.; Saraiva, A.; Abreu, M.L.T.; Rodrigues, P.B.; Oliveira, R.F.; et al. Brazilian Tables for Poultry and Swine: Composition of Feedstuffs and Nutritional Requirements, 4th ed.; Rostagno, H.S., Ed.; UFV: Viçosa, Brazil, 2017; p. 482. [Google Scholar]
- Haugh, R.R. The Haugh Unit for Measuring Egg Quality. U.S. Egg Poult. Mag. 1937, 43, 552–555. [Google Scholar]
- Alves, W.J.; Malheiros, E.B.; Sakomura, N.K.; da Silva, E.P.; da Silva Viana, G.; de Paula Reis, M.; Gonçalves, C.A.; Suzuki, R.M. In vivo description of body growth and chemical components of egg-laying pullets. Livest. Sci. 2019, 220, 221–229. [Google Scholar] [CrossRef]
- Yeh, Y.-Y.; Leveille, G.A. Effect of Dietary Protein on Hepatic Lipogenesis in the Growing Chick. J. Nutr. 1969, 98, 356–366. [Google Scholar] [CrossRef] [PubMed]
- Rosebrough, R.W.; Steele, N.C.; Frobish, L.T. Effect of Protein and Amino Acid Status on Lipogenesis by Turkey Poults. Poult. Sci. 1982, 61, 731–738. [Google Scholar] [CrossRef]
- Silva, E.P.; Rabello, C.B.V.; Lima, M.B.; Ludke, J.V.; Arruda, E.M.F.; Albino, L.F.T. Poultry offal meal in broiler chicken feed. Sci. Agric. 2014, 71, 188–194. [Google Scholar] [CrossRef]
- Gonçalves, C.A.; Sakomura, N.K.; Pereira da Silva, E.; Artoni, S.M.B.; Suzuki, R.M.; Gous, R.M. Dual energy X-ray absorptiometry is a valid tool for assessing in vivo body composition of broilers. Anim. Prod. Sci. 2019, 59, 993–1000. [Google Scholar] [CrossRef]
- Morris, T.R.; Gous, R.M. Partitioning of the response to protein between egg number and egg weight. Br. Poult. Sci. 1988, 29, 93–99. [Google Scholar] [CrossRef]
- Silva, E.P.; Malheiros, E.B.; Sakomura, N.K.; Venturini, K.S.; Hauschild, L.; Dorigam, J.C.P.; Fernandes, J.B.K. Lysine requirements of laying hens. Livest. Sci. 2015, 173, 69–77. [Google Scholar] [CrossRef]
- Silva, E.P.; Sakomura, N.K.; Oliveira, C.F.S.; Costa, F.G.P.; Dorigam, J.C.P.; Malheiros, E.B. The optimal lysine and threonine intake for Cobb broiler breeder hens using Reading model. Livest. Sci. 2015, 174, 59–65. [Google Scholar] [CrossRef]
- Silva, E.P.; Sakomura, N.K.; Sarcinelli, M.F.; Dorigam, J.C.d.P.; Venturini, K.S.; Lima, M.B.d. Modeling the response of Japanese quail hens to lysine intake. Livest. Sci. 2019, 224, 69–74. [Google Scholar] [CrossRef]
- Lima, M.B.; Sakomura, N.K.; Silva, E.P.; Dorigam, J.C.P.; Ferreira, N.T.; Malheiros, E.B.; Fernandes, J.B.K. The optimal digestible valine, isoleucine and tryptophan intakes of broiler breeder hens for rate of lay. Anim. Feed. Sci. Technol. 2018, 238, 29–38. [Google Scholar] [CrossRef]
- Nonis, M.K.; Gous, R.M. Utilisation of synthetic amino acids by broiler breeder hens. S. Afr. J. Anim. Sci. 2006, 36, 126–134. [Google Scholar] [CrossRef]
- Silva, E.P.; Lima, M.B.; Sakomura, N.K.; Moraes, L.E.; Peruzzi, N.J. Weight gain responses of laying-type pullets to methionine plus cystine intake. Animal 2020, 14, s294–s302. [Google Scholar] [CrossRef] [PubMed]
- Liu, Z.; Bateman, A.; Bryant, M.; Abebe, A.; Roland, D. Estimation of bioavailability of DL-methionine hydroxy analogue relative to DL-methionine in layers with exponential and slope-ratio models. Poult. Sci. 2004, 83, 1580–1586. [Google Scholar] [CrossRef]
- Liu, Z.; Bryant, M.M.; Roland, D.A. Bioavailability Estimation of DL-Methionine Hydroxy Analogue Relative to DL-Methionine in Layers Fed Milo-Soybean Diets Using Different Regression Models. J. Appl. Poult. Res. 2004, 13, 461–467. [Google Scholar] [CrossRef]
 ) and nonlinear models (
 ).
).  , basal diet;
  , L-tryptophan 98%;
  , L-tryptophan biomass 60%.
) and nonlinear models (). , basal diet; , L-tryptophan 98%; , L-tryptophan biomass 60%.
, L-tryptophan biomass 60%.
) and nonlinear models (). , basal diet; , L-tryptophan 98%; , L-tryptophan biomass 60%.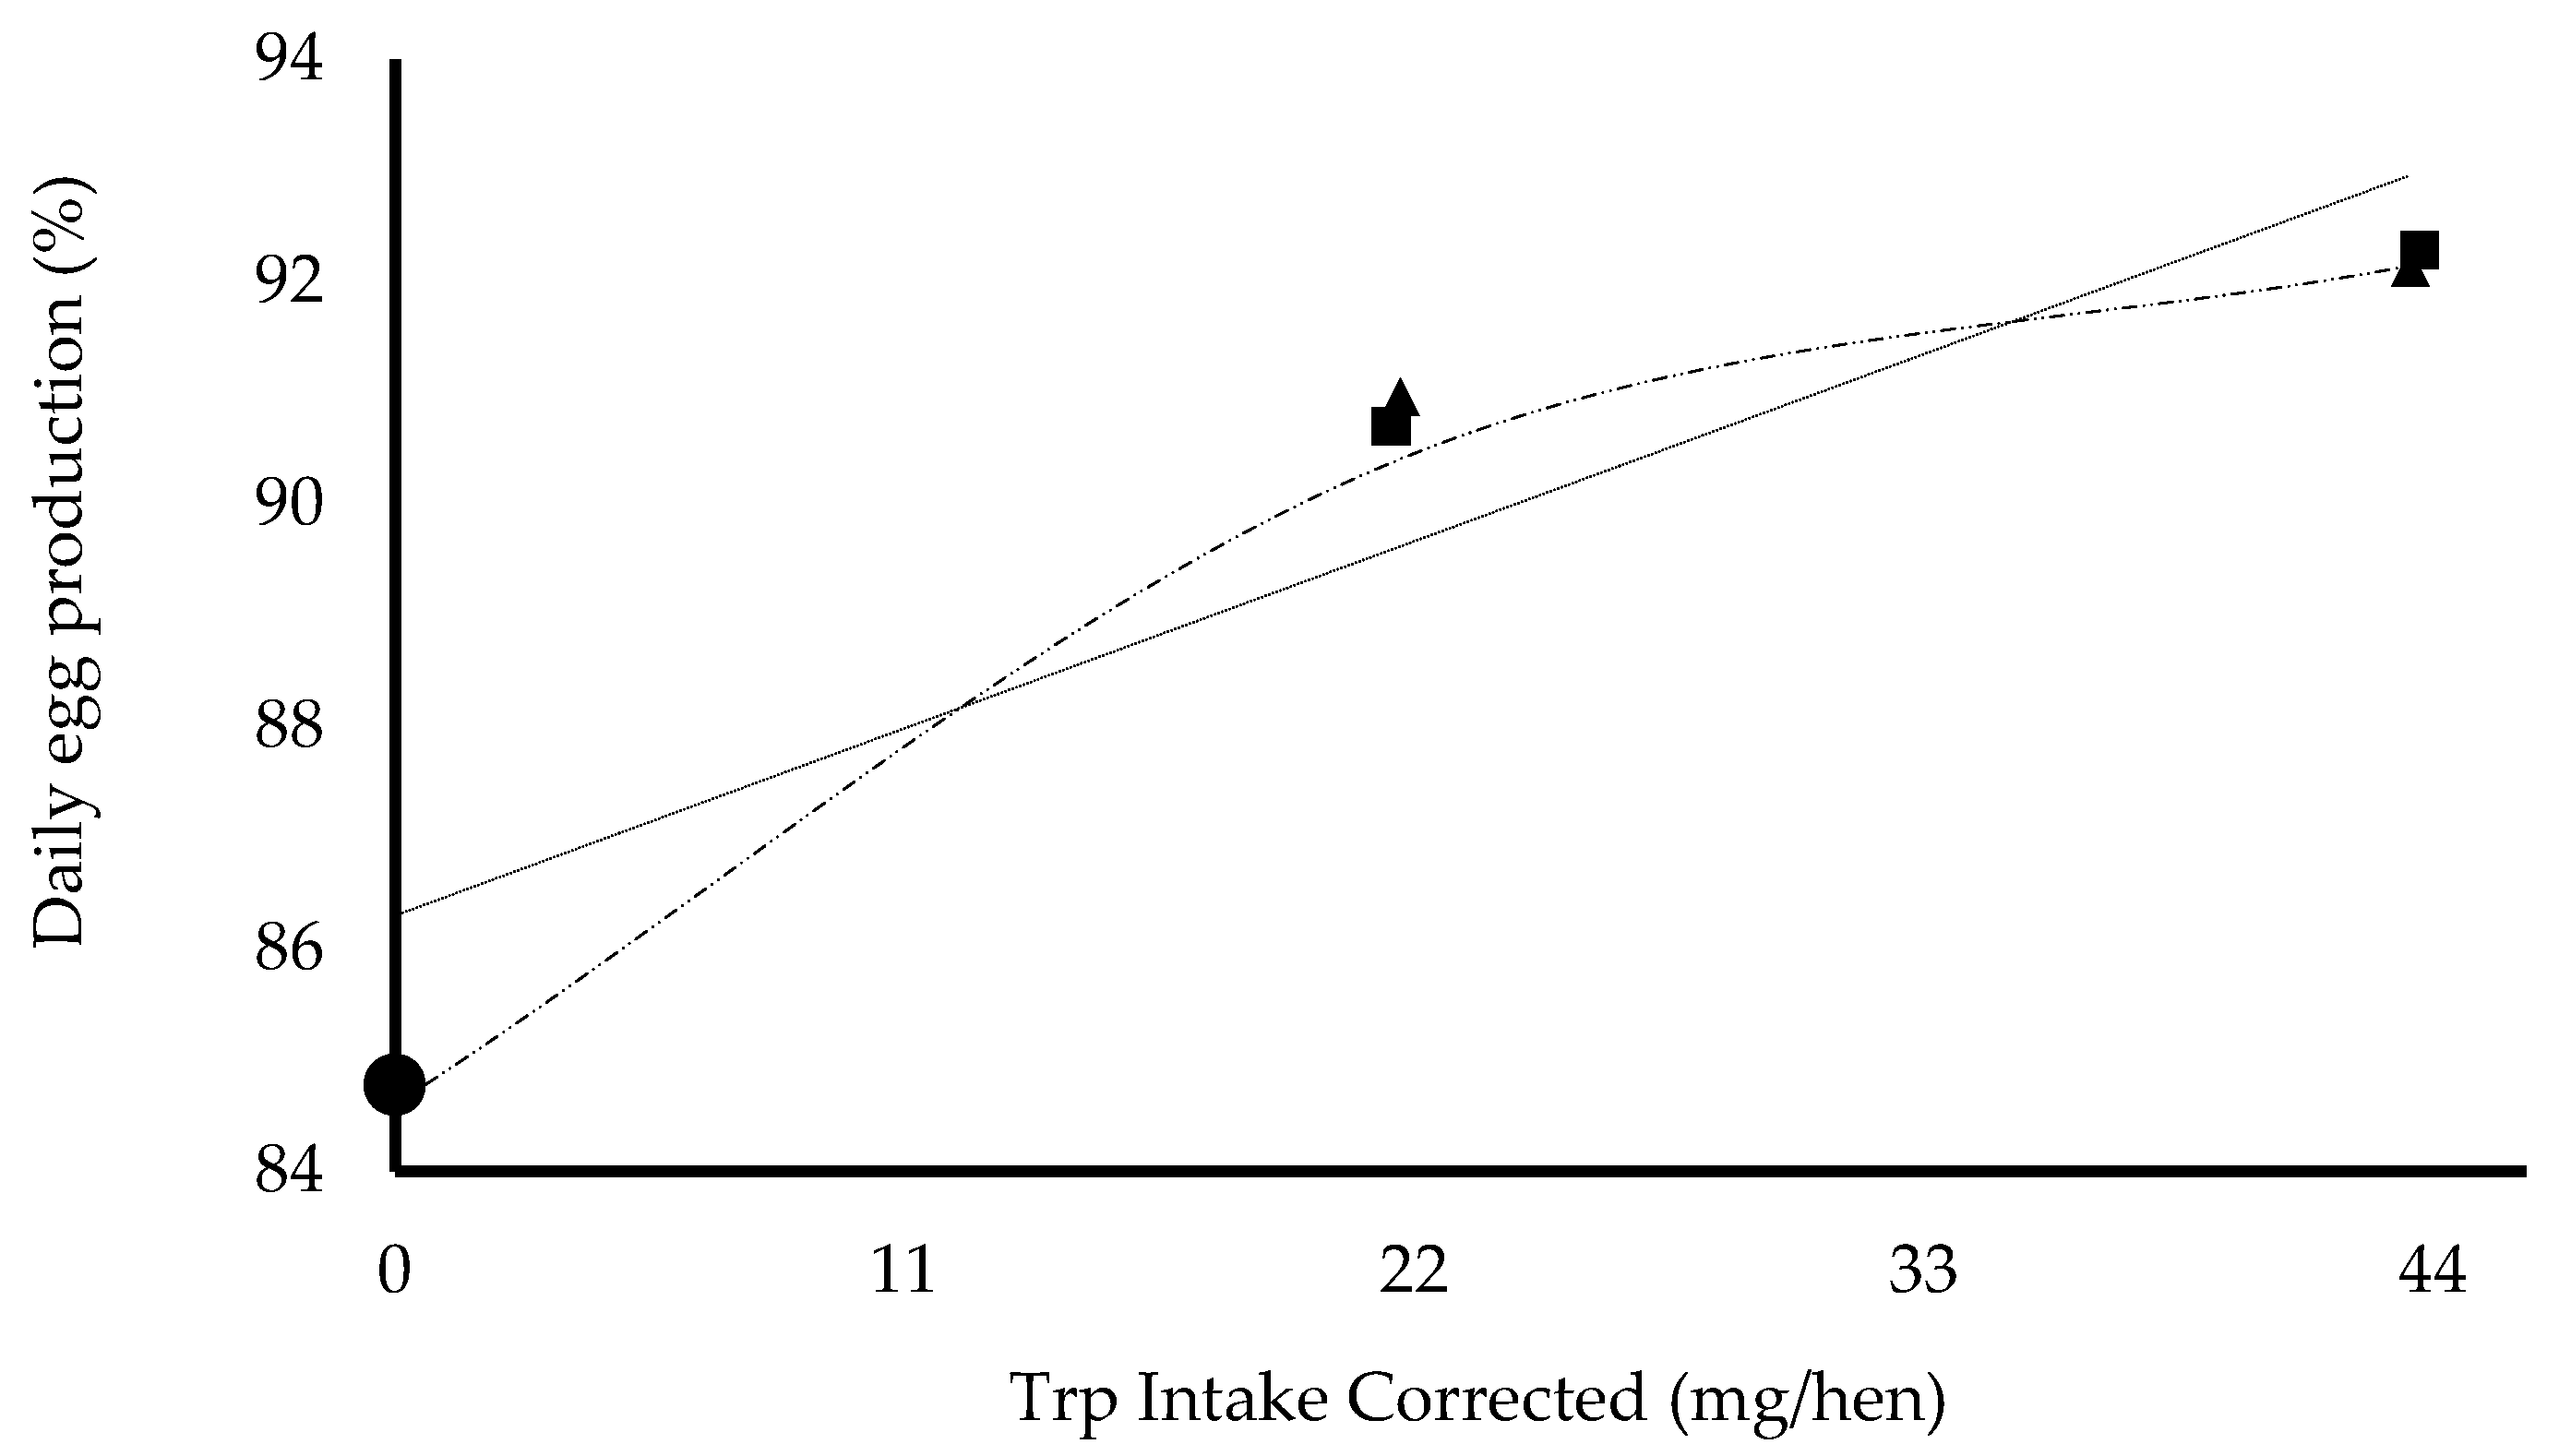

| Ingredients | Basal Diet |
|---|---|
| Grain corn | 699.701 |
| Soybean meal 46 of CP% 1 | 146.225 |
| Meat and bone meal 42 of CP% 1 | 49.222 |
| Coarse limestone | 15.193 |
| NaCl | 75.393 |
| Sodium bicarbonate | 3.086 |
| L-Met 100 | 2.371 |
| L-Lysine | 1.753 |
| L-Threonine | 0.648 |
| L-Valine | 0.376 |
| L-Isoleucine | 0.781 |
| Choline chloride 60% of ChoCl 2 | 0.750 |
| Inert (Kaolin) | 2.501 |
| Premix 3 | 2.000 |
| Total | 1000 |
| Items | T1 | T2 | T3 | T4 | T5 |
|---|---|---|---|---|---|
| BD 1 | L-TRP 98% 2 | L-TRP 98% 2 | L-TRP 60% 3 | L-TRP 60% 3 | |
| Basal | 997.499 | 997.499 | 997.499 | 997.499 | 997.499 |
| Inert (Kaolin) | 2.501 | 2.297 | 2.093 | 2.193 | 1.886 |
| L-Tryptophan 98% | - | 0.204 | 0.408 | - | - |
| L-Tryptophan biomass 60% | - | - | - | 0.308 | 0.615 |
| Total | 1000.000 | 1000.000 | 1000.000 | 1000.000 | 1000.000 |
| Items | T1 | T2 | T3 | T4 | T5 |
|---|---|---|---|---|---|
| BD 1 | L-TRP 98% 2 | L-TRP 98% 2 | L-TRP 60% 3 | L-TRP 60 3 | |
| Calculated | |||||
| crude protein, % | 15.2 | 15.2 | 15.2 | 15.2 | 15.2 |
| Metabolizable energy, kcal/kg | 2800 | 2801 | 2803 | 2801 | 2803 |
| Lysine, % | 0.730 | 0.730 | 0.730 | 0.730 | 0.730 |
| Methionine + cysteine, % | 0.660 | 0.660 | 0.660 | 0.660 | 0.660 |
| Threonine, % | 0.510 | 0.510 | 0.510 | 0.510 | 0.510 |
| Tryptophan, % | 0.125 | 0.145 | 0.165 | 0.145 | 0.165 |
| Arginine, % | 0.805 | 0.805 | 0.805 | 0.806 | 0.806 |
| Valine, % | 0.640 | 0.640 | 0.640 | 0.640 | 0.640 |
| Isoleucine, % | 0.580 | 0.580 | 0.580 | 0.580 | 0.580 |
| Potassium, % | 0.519 | 0.519 | 0.519 | 0.519 | 0.519 |
| Sodium, % | 0.160 | 0.160 | 0.160 | 0.160 | 0.160 |
| Calcium, % | 4.180 | 4.180 | 4.180 | 4.180 | 4.180 |
| Available phosphorus, % | 0.360 | 0.360 | 0.360 | 0.360 | 0.360 |
| Total choline, mg/kg | 1260 | 1260 | 1260 | 1260 | 1260 |
| Linoleic acid, % | 1463 | 1464 | 1464 | 1464 | 1464 |
| Analyzed | |||||
| crude protein, % | 15.88 | 15.94 | 15.95 | 16.06 | 16.07 |
| Tryptophan 4, % | 0.126 | 0.146 | 0.166 | 0.146 | 0.166 |
| Variables | TRP 60% 1 | TRP 98% 2 | Average | Stderr 3 | p-Value | CV, % 4 |
|---|---|---|---|---|---|---|
| Feed intake, g/day hen | 108.7 | 109.2 | 109.0 | 0.2 | 0.125 | 0.7 |
| Tryptophan intake mg/day hen | 186.9 | 187.9 | 187.4 | 0.3 | 0.125 | 0.7 |
| Egg production, % | 94.1 | 92.5 | 93.3 | 0.5 | 0.128 | 2.7 |
| Egg weight, g | 59.8 | 59.4 | 59.6 | 0.3 | 0.447 | 2.5 |
| Egg mass, g/day hen | 56.3 | 54.9 | 55.6 | 0.5 | 0.115 | 3.8 |
| Feed conversion ratio g/g | 1.932 | 1.990 | 1.961 | 0.017 | 0.085 | 4.1 |
| Feed efficiency, g/kg | 518.5 | 502.9 | 510.7 | 4.5 | 0.083 | 4.1 |
| Change body weight, g/day hen | 1.3 | 1.0 | 1.2 | 0.1 | 0.181 | 55.8 |
| Body weight, kg | 1.9 | 1.9 | 1.9 | 0.0 | 0.531 | 4.8 |
| Body water, g | 917.3 | 938.6 | 928.0 | 6.6 | 0.105 | 3.2 |
| Body protein, g | 272.5 | 278.8 | 275.6 | 1.9 | 0.106 | 3.2 |
| Body lipid, g | 186.7 | 171.9 | 179.3 | 2.1 | <0.0001 | 5.2 |
| Body ash, g | 56.7 | 58.1 | 57.4 | 0.4 | 0.098 | 3.2 |
| Yolk weight, g | 15.5 | 15.1 | 15.3 | 0.1 | 0.198 | 3.7 |
| Eggshell weigh, g | 5.9 | 6.0 | 6.0 | 0.1 | 0.650 | 4.6 |
| Albumen weight, g | 38.4 | 38.2 | 38.3 | 0.3 | 0.767 | 3.3 |
| Eggshell thickness, µm | 398.9 | 405.3 | 402.1 | 3.0 | 0.290 | 3.4 |
| Haugh unit, % | 95.2 | 95.8 | 95.5 | 0.7 | 0.677 | 3.6 |
| Yolk percentage, % | 25.9 | 25.5 | 25.7 | 0.2 | 0.300 | 3.2 |
| Shell percentage, % | 9.9 | 10.1 | 10.0 | 0.1 | 0.420 | 4.4 |
| Albumen percentage, % | 64.2 | 64.4 | 64.3 | 0.2 | 0.706 | 1.6 |
| Treatments | L-Trp 4 | FI | EW | EM | FCR | FE |
|---|---|---|---|---|---|---|
| T1—BD 1 | 0.125 | 107.2 | 60.0 | 53.0 | 2.04 | 493.0 |
| T2—TRP 98% 2 | 0.145 | 107.7 | 60.7 | 55.0 | 1.96 | 511.0 |
| T3—TRP 98% 2 | 0.165 | 109.2 | 60.0 | 55.5 | 1.97 | 509.0 |
| T4—TRP 60% 3 | 0.145 | 108.9 | 59.4 | 54.6 | 1.99 | 503.0 |
| T5—TRP 60% 3 | 0.165 | 108.7 | 61.5 | 56.8 | 1.93 | 520.0 |
| Average | 108.3 | 60.3 | 55.0 | 1.98 | 0.507 | |
| Stderr 5 | 0.3 | 0.3 | 0.5 | 0.02 | 0.004 | |
| p-value | 0.182 | 0.365 | 0.160 | 0.390 | 0.339 | |
| CV, % 6 | 0.193 | 3.68 | 5.81 | 5.57 | 5.53 |
| Treatments | L-Trp 4 | YW | SW | AW | AH | EST | HU |
|---|---|---|---|---|---|---|---|
| T1—BD 1 | 0.125 | 15.1 | 5.9 | 38.0 | 9.7 | 406.8 | 98.1 |
| T2—TRP 98% 2 | 0.145 | 15.1 | 6.2 | 38.3 | 9.9 | 403.6 | 99.3 |
| T3—TRP 98% 2 | 0.165 | 14.9 | 6.0 | 38.7 | 9.7 | 398.0 | 97.7 |
| T4—TRP 60% 3 | 0.145 | 14.8 | 6.2 | 39.0 | 9.9 | 411.8 | 97.5 |
| T5—TRP 60% 3 | 0.165 | 15.0 | 6.1 | 39.2 | 10.1 | 408.7 | 99.4 |
| Average | 15.0 | 6.1 | 38.6 | 9.9 | 405.8 | 98.4 | |
| Stderr 5 | 0.1 | 0.04 | 0.3 | 0.1 | 2.2 | 0.4 | |
| p-value | 0.765 | 0.129 | 0.599 | 0.607 | 0.332 | 0.491 | |
| CV, % 6 | 3.27 | 3.95 | 4.37 | 6.05 | 3.75 | 3.05 |
| Treatments | L-Trp 4 | Trp Sup 5 | Trp Intake | Trp Intake Corrected | EP |
|---|---|---|---|---|---|
| T1—BD 1 | 0.125 | 0 | 134.0 | 0 | 84.8 |
| T2—TRP 98% 2 | 0.145 | 0.204 | 156.2 | 21.5 | 90.7 |
| T3—TRP 98% 2 | 0.165 | 0.408 | 180.2 | 43.7 | 92.3 |
| T4—TRP 60% 3 | 0.145 | 0.333 | 157.7 | 21.7 | 91.0 |
| T5—TRP 60% 3 | 0.165 | 0.667 | 179.4 | 43.5 | 92.1 |
| Average | 161.5 | 26.1 | 90.7 | ||
| Stderr 6 | 2.5 | 0.5 | 0.7 | ||
| p-value | <0.0001 | <0.0001 | 0.041 | ||
| CV, % 7 | 1.85 | 2.05 | 4.97 |
| Models | Parameter Estimates | RBV | ||||||
|---|---|---|---|---|---|---|---|---|
| Estimate | SE | Lower | Upper | Lower | Average | Upper | ||
| Linear AIC = 274.5 R2 = 91.0% | α | 86.3 | 1.3 | 83.4 | 89.1 | 98.0 | 98.5 | 100.4 |
| βs | 0.153 | 0.045 | 0.050 | 0.256 | ||||
| βt | 0.151 | 0.044 | 0.050 | 0.251 | ||||
| Nonlinear AIC = 273.4 R2 = 91.0% | α | 84.8 | 1.5 | 81.5 | 88.2 | 101.0 | 100.0 | 107.0 |
| δ | 8.3 | 2.3 | 3.0 | 13.5 | ||||
| βs | −0.055 | 0.039 | −0.144 | 0.033 | ||||
| βt | −0.055 | 0.040 | −0.146 | 0.035 | ||||
Disclaimer/Publisher’s Note: The statements, opinions and data contained in all publications are solely those of the individual author(s) and contributor(s) and not of MDPI and/or the editor(s). MDPI and/or the editor(s) disclaim responsibility for any injury to people or property resulting from any ideas, methods, instructions or products referred to in the content. |
© 2025 by the authors. Licensee MDPI, Basel, Switzerland. This article is an open access article distributed under the terms and conditions of the Creative Commons Attribution (CC BY) license (https://creativecommons.org/licenses/by/4.0/).
Share and Cite
Estevão, S.C.O.; da Silva, G.H.N.; Oliveira, L.R.R.; dos Santos, L.O.; Raimundo, E.K.M.; Vieira, R.B.; Rodrigues, T.A.; Nogueira, B.R.F.; da Silva, E.A.; Amoroso, L.; et al. Bioavailability of Tryptophan Biomass for Laying Hens. Animals 2025, 15, 866. https://doi.org/10.3390/ani15060866
Estevão SCO, da Silva GHN, Oliveira LRR, dos Santos LO, Raimundo EKM, Vieira RB, Rodrigues TA, Nogueira BRF, da Silva EA, Amoroso L, et al. Bioavailability of Tryptophan Biomass for Laying Hens. Animals. 2025; 15(6):866. https://doi.org/10.3390/ani15060866
Chicago/Turabian StyleEstevão, Stéphane Cristyne O., Gabriel Henrique Nacamura da Silva, Livia Rastoldo R. Oliveira, Larissa Oliveira dos Santos, Erikson Kadoshe M. Raimundo, Rita Brito Vieira, Tiago A. Rodrigues, Bernardo Rocha F. Nogueira, Eliane Aparecida da Silva, Lizandra Amoroso, and et al. 2025. "Bioavailability of Tryptophan Biomass for Laying Hens" Animals 15, no. 6: 866. https://doi.org/10.3390/ani15060866
APA StyleEstevão, S. C. O., da Silva, G. H. N., Oliveira, L. R. R., dos Santos, L. O., Raimundo, E. K. M., Vieira, R. B., Rodrigues, T. A., Nogueira, B. R. F., da Silva, E. A., Amoroso, L., Lima, M. B. d., & Silva, E. P. d. (2025). Bioavailability of Tryptophan Biomass for Laying Hens. Animals, 15(6), 866. https://doi.org/10.3390/ani15060866