Article

Genome-Wide Identification and Evolutionary Analysis of Ionotropic Receptors Gene Family: Insights into Olfaction Ability Evolution and Antennal Expression Patterns in Oratosquilla oratoria

1
Jiangsu Provincial Key Laboratory of Coastal Wetland Bioresources and Environmental Protection, Jiangsu Key Laboratory for Bioresources of Saline Soils, Jiangsu Synthetic Innovation Center for Coastal Bio-Agriculture, Yancheng Teachers University, Yancheng 224051, China
2
College of Fisheries and Life Science, Shanghai Ocean University, Shanghai 201306, China
3
Chemical and Biological Engineering College, Yancheng Institute of Technology, Yancheng 224003, China
*
Authors to whom correspondence should be addressed.
These authors contributed equally to this work.
Animals 2025, 15(6), 852; https://doi.org/10.3390/ani15060852
Submission received: 3 February 2025 / Revised: 13 March 2025 / Accepted: 13 March 2025 / Published: 16 March 2025

Simple Summary

Ionotropic Receptors (IRs) are essential chemical receptor genes that play a pivotal role in olfactory perception among crustaceans, substantially influencing behaviors such as foraging, mating, and predator avoidance. Oratosquilla oratoria is an omnivorous species known for its acute sense of smell. In this study, we employed bioinformatics methods to identify and analyze the members of the IR gene family in O. oratoria to elucidate the potential functions of IRs in olfactory perception within this species. The analysis encompassed various aspects including physical and chemical properties, chromosomal locations, structural features, expression characteristics, and phylogenetic studies both within and between species. Our findings identified 50 IRs in O. oratoria, which were categorized into co-receptor IRs and tuning IRs. Co-receptor IRs exhibited a high degree of conservation across three crustacean species. In contrast, tuning IRs displayed several tandem repeat genes. Fluorescence in situ hybridization (FISH) revealed that OratIR75-1 was co-expressed with OratIR8a in the antenna tissues of O. oratoria, indicating its important role in olfactory processes. These results suggest that IRs are integral to the olfactory recognition mechanisms in O. oratoria. This research provides a scientific foundation for further investigations into the functional roles of IRs within this species.

Abstract

Olfaction plays a crucial role in crustaceans for essential activities such as foraging and predator evasion. Among the components involved in olfactory perception, Ionotropic Receptors (IRs) are particularly important. Oratosquilla oratoria, a perennial crustacean of substantial economic and ecological value, serves as an ideal model for studying olfactory mechanisms. Identifying the IR chemosensory genes in O. oratoria enhances our understanding of its olfactory recognition system. Based on the whole-genome data of O. oratoria, we identified and analyzed 50 members of the IR gene family (OratIRs) through bioinformatics approaches. These genes were classified into subfamilies of co-receptor IRs and tuning IRs. The physicochemical properties of the encoded proteins exhibit marked variability, indicating distinct roles. The motif types and conserved domains among these subfamilies display certain similarities, but their gene structures differ markedly. Furthermore, we found that OratIR25a, OratIR07629, and OratIR14286 are key nodes in protein–protein interaction networks, coordinating organisms’ responses to signals like temperature and acids. We utilized fluorescence in situ hybridization (FISH) to find that OratIR75-1 and OratIR8a demonstrated robust expression signals in the antennae of the O. oratoria. These findings lay a foundation for further investigations and elucidate the functional roles of olfactory receptor genes in crustaceans.

1. Introduction

Chemical sensation constitutes a vital sensory system for crustaceans [1,2,3]. Over an extended evolutionary period, crustaceans have developed a sophisticated array of chemical sensory systems capable of detecting external environmental information [4,5,6]. By employing highly specific and sensitive chemical receptors for chemical communication, they can adapt to environmental pressures, seek advantages, evade threats, and ensure both individual development and population reproduction [7,8,9]. Olfaction, as a chemical sense, is widely understood as the ability to distinguish odors, capable of detecting a large number of small, light volatile compounds (i.e., odors), allowing organisms to gather rich information about their chemical environment and identify substances to be sought or avoided [6,10,11,12]. Consequently, olfaction ranks among the most important chemical senses in crustaceans.
Ionotropic Receptors (IRs) constitute a family of ion channels derived from ionotropic glutamate receptors (iGluRs) and belong to a variant subfamily of iGluRs. They were initially identified in Drosophila melanogaster as crucial sensors for detecting environmental and intercellular chemical signals [13,14,15,16]. Both IRs and iGluRs exhibit similar molecular architectures, characterized by the presence of a conserved ligand-gated ion channel domain [15,16,17,18], including the extracellular N terminus, intracellular C terminus, and a ligand-binding domain (LBD) composed of S1 and S2 segments, along with the ion channel domain (ICD). Notably, the ion channel domain is the most conserved region across both IRs and iGluRs, consisting of three transmembrane domains (TM1–TM3) along with an ion channel pore (P), indicating that IRs may have retained their capacity for ion conduction [14]. However, unlike iGluRs, IRs do not possess a differentiated extracellular amino-terminal domain (ATD); instead, most IRs feature only a short N-terminal region preceding the S1 segment of the LBD [19].
iGluRs, as a conserved family of ligand-gated ion channels, primarily encompass NMDA receptors and non-NMDA receptors (AMPA and Kainate receptors) [11]. IRs evolved from iGluRs and diversified into various lineages throughout the evolutionary process. They can be categorized into two primary subfamilies: co-receptor IRs and tuning IRs [15,20,21,22,23]. The co-receptor IRs comprise four types: IR25a, IR8a, IR93a, and IR76b, which are co-expressed with other IRs [13,24]. Notably, both IR25a and IR8a exhibit distinctive characteristics by retaining the ATD of iGluRs absent in most tuning IRs, which is essential for the formation of functional receptor channels [14,15]. Tuning IRs display considerable variability among different species; in some species, they demonstrate enhanced specificity. These receptors form functional heterotetrameric channels through interactions with co-receptor IRs, thereby determining the specific binding characteristics of the receptor [13,25]. In addition to their role as chemoreceptors, IRs also participate in detecting temperature and humidity signals—showcasing a remarkable adaptability to environmental stimuli [26,27,28,29]. This structural and functional diversity enables IRs to fulfill an irreplaceable role in organisms’ adaptation to their environments.
Substantial progress has been made in elucidating the functions of ionotropic receptor (IR) genes in model organisms such as Drosophila. However, research efforts dedicated to IRs in crustaceans remain relatively limited. Studies on IRs across various crustacean species have yielded diverse results. In Daphnia, IR25a and IR93a were identified, along with a large number of divergent IRs [15]. In the terrestrial hermit crab Coenobita clypeatus, 20 candidate IR genes were discovered, including the conserved IR25a and IR93a [30]. In Panulirus argus, 108 IRs were identified, with higher expression levels observed in the antennular lateral flagella [31]. Transcriptomic analysis of olfactory sensory neurons (OSNs) in this species further revealed that OSNs express co-receptor IRs such as IR25a and IR93a, along with 9–53 tuning IRs, which vary in abundance [32]. Similarly, in Panulirus ornatus, tissue analysis showed 70 upregulated IR isoforms in aesthetasc-bearing regions of the antennules, including co-receptors (IR25a and IR93a) and divergent receptors (IR4, IR7, and IR21a) [33]. In Eriocheir japonica sinensis, 33 EsIRs were identified, highlighting their role as key odorant receptors with a specific evolutionary trend [34]. Decapod crustaceans, including P. argus, Homarus americanus, Procambarus clarkii, and Callinectes sapidus, express a high number of IRs ranging from 100 to 250. These IRs exhibit varying degrees of phylogenetic conservation and are more highly expressed in the lateral flagellum (LF) than in the dactyls [35]. Given the advancements in understanding IR expressions and characteristics in the aforementioned crustaceans, the paucity of research on IRs in Stomatopoda becomes particularly evident. This underscores the urgent need for further investigation into their functional roles and evolutionary significance.
Oratosquilla oratoria, commonly known as the mantis shrimp, or mantis prawn, belongs to the phylum Arthropoda, class Crustacea, order Stomatopoda, family Squillidae, and genus Oratosquilla. This perennial marine crustacean holds substantial economic value [36,37,38,39,40,41]. O. oratoria is a carnivorous species that primarily preys on small invertebrates. As a dominant member of the order Stomatopoda, it is widely distributed in the nearshore waters of the Northwest Pacific [42,43]. Valued for its tender meat and high protein content as well as its notable nutritional and pharmacological benefits, it enjoys considerable consumer preference [41,44]. However, due to overfishing and environmental degradation, O. oratoria resources are currently facing a severe decline while their economic value continues to rise [45]. To safeguard existing populations while addressing increasing consumption demands, strategies aimed at enhancing O. oratoria yield through research into its feeding-related chemoreception genes are essential for improving feeding efficiency. Comprehensive studies on the olfactory system of O. oratoria facilitate an understanding of how this species identifies informational substances when foraging and locating mates; they also elucidate mechanisms underlying chemical communication and perception. A substantial number of olfactory-related genes provide a foundation for investigating molecular mechanisms associated with these processes. Therefore, identifying and characterizing IR genes is crucial for studying gene function and revealing the intricacies of olfactory recognition.
This study identified the homologous genes within the IR gene family of O. oratoria utilizing whole-genome data and bioinformatics methodologies. The research systematically analyzed their physicochemical properties, chromosomal localization, phylogenetic evolution, and sequence characteristics. Furthermore, fluorescence in situ hybridization (FISH) was employed to localize the expression of two genes within this subfamily in the antennae and identify important regulatory genes of the IR gene family through protein–protein interaction mining. The research achievements will provide a theoretical foundation for a deeper understanding of the functions and mechanisms associated with the IRs of O. oratoria.

2. Materials and Methods

2.1. Sample Collection and Preparation

O. oratoria samples were collected from the Yellow Sea at Huangsha Port in Yancheng City, Jiangsu Province (33°44′ N, 120°24′ E). The selected specimens exhibited a body length ranging from 141 to 144 mm and a body width ranging from 30 to 32 mm. These samples were subsequently housed temporarily in the aquarium of the Jiangsu Provincial Key Laboratory of Saline Soil Biological Resources. A healthy specimen of O. oratoria was selected for further analysis; its antenna tissue was fixed using an in situ hybridization fixative to facilitate subsequent fluorescence in situ hybridization with paraffin sections.

2.2. Genomic Data Acquisition

Genomic data for O. oratoria [46] (GCA_046742065.1) were obtained from the Jiangsu Provincial Key Laboratory of Coastal Wetland Bioresources and Environmental Protection. The genomic data of Arthropoda utilized in this study were obtained from the National Center for Biotechnology Information (NCBI) database (https://www.ncbi.nlm.nih.gov/, accessed on 6 June 2024). The NCBI accession numbers for Litopenaeus vannamei [47] and Macrobrachium nipponense [48] are GCA_003789085.1 and GCA_015104395.1, respectively. The data for each downloaded species were standardized to ensure complete protein sequence information was available.

2.3. Sequence Search and Chromosomal Mapping Analysis of the IR Gene Family in O. oratoria

IR and iGluR genes were identified based on the genomic data of O. oratoria. (i) Construction of a Reference Sequence Library: The IR and iGluR protein sequences were obtained from publicly available datasets as well as the NCBI database (Table S1), which served as query sequences to establish the reference sequence library [15,31,35]. (ii) Homology Alignment: Using BLAST [49] software (version 2.13.0), we aligned the protein sequences of O. oratoria with the reference sequence database, setting an E-value threshold of ≤1 × 10⁻⁹ to identify candidate protein sequences corresponding to IR and iGluR within the O. oratoria protein database. (iii) Domain Alignment: Hidden Markov Model (HMM) profiles of PF00060, PF10613, and PF01094 were downloaded from the PFAM database (http://pfam.xfam.org, accessed on 7 June 2024) and used as query library files. We employed HMMER software (version 3.0) (http://hmmer.org, accessed on 7 June 2024) to search for specific domains associated with the IR gene family in these candidate protein sequences. By identifying sequences containing the Pfam domain PF00060, we predicted the ICD domain (including P, TM1–TM3) and the S2 region of the LBD. Additionally, we utilized PF10613 to predict the S1 region of the LBD [15,35]. Sequences that simultaneously contain the PF00060, PF10613, and PF01094 domains are iGluR gene family sequences. Sequences lacking these characteristic domains were filtered out to yield a final set of IR and iGluR gene family sequences. In addition, the IR and iGluR gene families of L. vannamei and M. nipponense were identified using the aforementioned methods. The identification of iGluRs was exclusively for constructing the phylogenetic tree in Section 2.5, which aimed to elucidate the evolutionary origins and relationships of the IR gene family.
All examined IR and iGluR genes were categorized into three groups based on their characteristics [31,35]: (i) the iGluRs group, which includes NMDA and non-NMDA (AMPA, Kainate); (ii) the co-receptor IRs subfamily; and (iii) the tuning IRs subfamily. Sequences from O. oratoria were assigned the following prefix: Orat (O. oratoria). The IR sequences in O. oratoria were designated with the prefix OratIR, followed by the original gene sequence number (e.g., OratIR02114, OratIR03796). Homologous sequences were named according to their corresponding IR homologs (e.g., OratIR25a, OratIR8a). In cases where a sequence within a species had multiple homologs, the suffixes ‘-1’, ‘-2’, etc., were appended to each homolog. NMDA iGluRs received designations beginning with the prefix OratNMDAr, followed by the suffixes ‘-1’, ‘-2’, etc., while non-NMDA iGluRs were designated using the prefix OratGluR with similar suffixes. Each IR gene in O. oratoria was designated as OratIRs. This nomenclature also applies to newly identified IR and iGluR genes in L. vannamei and M. nipponense.
To determine the distribution of OratIR genes across the chromosomes, we utilized the genomic annotation of O. oratoria to identify the chromosomal positions of these genes. The Gene Density Profile tool in TBtools (version 1.108) [50] was employed to generate gene density files, while the Gene Location Visualizer (Advanced) was used to visualize the locations of OratIRs on the chromosomes, effectively marking each gene’s position to elucidate their distribution throughout the chromosomal landscape.

2.4. Physicochemical Properties and Subcellular Localization Analysis of the IR Gene Family

The identified IR genes were analyzed using the ProtParam program available on the ExPASy service platform [51] (https://web.expasy.org/protparam/, accessed on 10 June 2024). This analysis calculated various physicochemical properties of the proteins, including amino acid length (aa), molecular weight (MW), theoretical isoelectric point (pI), instability index, aliphatic index, and grand average of hydropathicity (GRAVY). Furthermore, the subcellular localization of the IR genes was predicted utilizing the ProtComp 9.0 program from the Softberry service platform (http://www.softberry.com/, accessed on 11 June 2024).

2.5. Multiple Sequence Alignment and Phylogenetic Tree Construction Analysis of the IR Gene Family

To investigate the phylogenetic relationships among the members of the IR gene family in O. oratoria, as well as to explore the evolutionary and taxonomic relationships among various crustacean species, we constructed an intraspecific phylogenetic tree utilizing the IR and iGluR protein sequences derived from O. oratoria. Furthermore, interspecific phylogenetic analyses were conducted using IR and iGluR protein sequences from two additional species: L. vannamei and M. nipponense, with the iGluR/IR25a/IR8a branch serving as the root node [35]. Multiple sequence alignment of the IR gene family was performed using the MUSCLE tool (Multiple Protein Sequence Alignment) within MEGA11 software (version 6.0) [52]. Through the PhyML program in MEGA11, the maximum likelihood method (ML), incorporating 1000 bootstrap replicates, was employed to construct the phylogenetic tree, while iTOL [53] was utilized for visualization and enhancement of this tree.

2.6. Characterization of the IR Gene Family: Motif, Gene Structure, and Domain Prediction Analysis

To enhance the understanding of the function and evolution of members of the IR gene family, an analysis of conserved motifs, gene structures, and conserved domains can provide insights into their functional conservation and evolutionary changes. The identified OratIR gene family members were subjected to predictive analysis using the online tool MEME Suite [54] (https://meme-suite.org/meme/tools/meme, accessed on 13 June 2024). The parameters for this analysis were set as follows: minimum width: 30 bp, maximum width: 100 bp, and a maximum motif number of 8; all other parameters were maintained at their default settings. The Gene Structure Display Server (GSDS) [55] (https://gsds.gao-lab.org, accessed on 13 June 2024) was utilized to delineate the exon–intron structures of the OratIR genes, while TBtools was employed for visualizing these gene structures. The conserved domains of the OratIR gene family members were identified using the CD-search [56] tool on the NCBI official website (https://www.ncbi.nlm.nih.gov/Structure/bwrpsb/bwrpsb.cgi, accessed on 15 June 2024). The GOR4 website (https://npsa-prabi.ibcp.fr/cgi-bin/npsa_automat.pl?page=npsa_gor4.html, accessed on 16 June 2024) was used to predict the secondary structure of OratIR gene family members, and the SWISS-MODEL online platform (https://swissmodel.expasy.org/interactive, accessed on 18 June 2024) was utilized for protein 3D structure prediction.

2.7. Protein–Protein Interaction (PPI) Network Analysis of the IR Gene Family

To investigate and elucidate the interactions between proteins and to infer the regulatory roles of the IR gene family, Drosophila was selected as the reference species. The identified members of the OratIR gene family were utilized to ascertain protein interactions with other genes via the STRING protein interaction database (https://string-db.org/, accessed on 20 June 2024), with a maximum of 50 interactions displayed in the first layer. Following the acquisition of these interaction relationships, Cytoscape software (version 3.9.1) was employed to construct visual representations and analyze the interaction network.

2.8. Fluorescence In Situ Hybridization of the IR Gene Family

This experiment utilized paraffin sectioning and the SweAMI fluorescent in situ hybridization double staining technique. The in situ hybridization probes were designed by Servicebio, as listed in Table 1. The antennal tissue of O. oratoria was rinsed with phosphate-buffered saline (PBS) and subsequently immersed in an in situ hybridization fixative at 4 °C for a minimum of 12 h. Following fixation, the target area of the tissue was excised to approximately 3 mm thickness within a fume hood, dehydrated through a graded series of alcohols, cleared using xylene, and then embedded in paraffin. The paraffin-embedded blocks were sliced into sections measuring 4 μm thick, which were then spread out and baked in an oven at 62 °C for two hours. Following this, the sections were sequentially immersed in two changes of dewaxing solution for 15 min each. They were then treated with pure ethanol and a graded series of ethanol (85% and 75%) for 5 min each, before being soaked in DEPC water to complete the dewaxing process. Citrate buffer (pH 6.0) was utilized as a repair solution; the sections were placed in a repair box and heated in a water bath at 90 °C for 48 min to facilitate antigen retrieval. After natural cooling, the sections underwent digestion with proteinase K (20 μg/mL) at 37 °C for 5 min, followed by three washes with PBS for 5 min each. Subsequently, pre-hybridization solution was added, and the sections were incubated at 37 °C for one hour. The pre-hybridization solution was then discarded, after which a hybridization solution containing OratIR8a/OratIR75-1 probes (Servicebio, Wuhan, China) was introduced at a concentration of 500 nm. The sections were hybridized overnight at 40 °C. After hybridization, the sections were washed again before adding hybridization solutions containing signal probe 1 labeled with FAM (488) and signal probe 2 labeled with Cy3 (dilution ratio of 1:200), followed by incubation at 42 °C for three hours. The sections underwent another washing step. Finally, a DAPI staining solution was applied to counterstain the nuclei. The stained sections were observed and imaged using a Nikon Eclipse ci upright fluorescence microscope.

2.9. RT-qPCR Validation of the Expression of Five OratIRs in O. oratoria

In this study, RNA isolater Total RNA Extraction Reagent (Vazyme, Nanjing, China) was used to extract RNA from the muscle and antennal tissues of O. oratoria. Subsequently, the integrity of the RNA was examined via 1% agarose gel electrophoresis, and its concentration and purity were measured using a NanoDrop 2000 (Thermo Fisher Scientific, Waltham, MA, USA). After the RNA had passed the quality assessment, reverse transcription was carried out using HisyGo RT Red SuperMix for qPCR (+gDNA Wiper) (Vazyme, Nanjing, China) to synthesize cDNA for subsequent RT-qPCR verification.
Specific RT-qPCR primers for five members of the OratIRs gene family were designed using Primer Premier 6.0 software (Table 2), and β-actin was selected as the reference gene. Finally, RT-qPCR was performed in a 10 μL reaction system, which consisted of 5 μL of 2 × SupRealQ Purple Universal SYBR qPCR Master Mix, 0.5 μL of forward primer, 0.5 μL of reverse primer, 2 μL of cDNA template, and 2 μL of ddH₂O. The reaction program was as follows: pre-denaturation at 95 °C for 30 s; followed by 40 cycles of denaturation at 95 °C for 10 s, annealing at 56 °C for 30 s, and extension at 72 °C for 30 s; and a melting curve analysis of 95 °C for 30 s, 60 °C for 1 min, and 95 °C for 10 s.
The relative expression levels of the genes were calculated using the 2−ΔΔCT method [57]. Differences in gene expression between the two tissues were compared using t-tests. Visualization was performed using Prism software (version 5.01).

3. Results

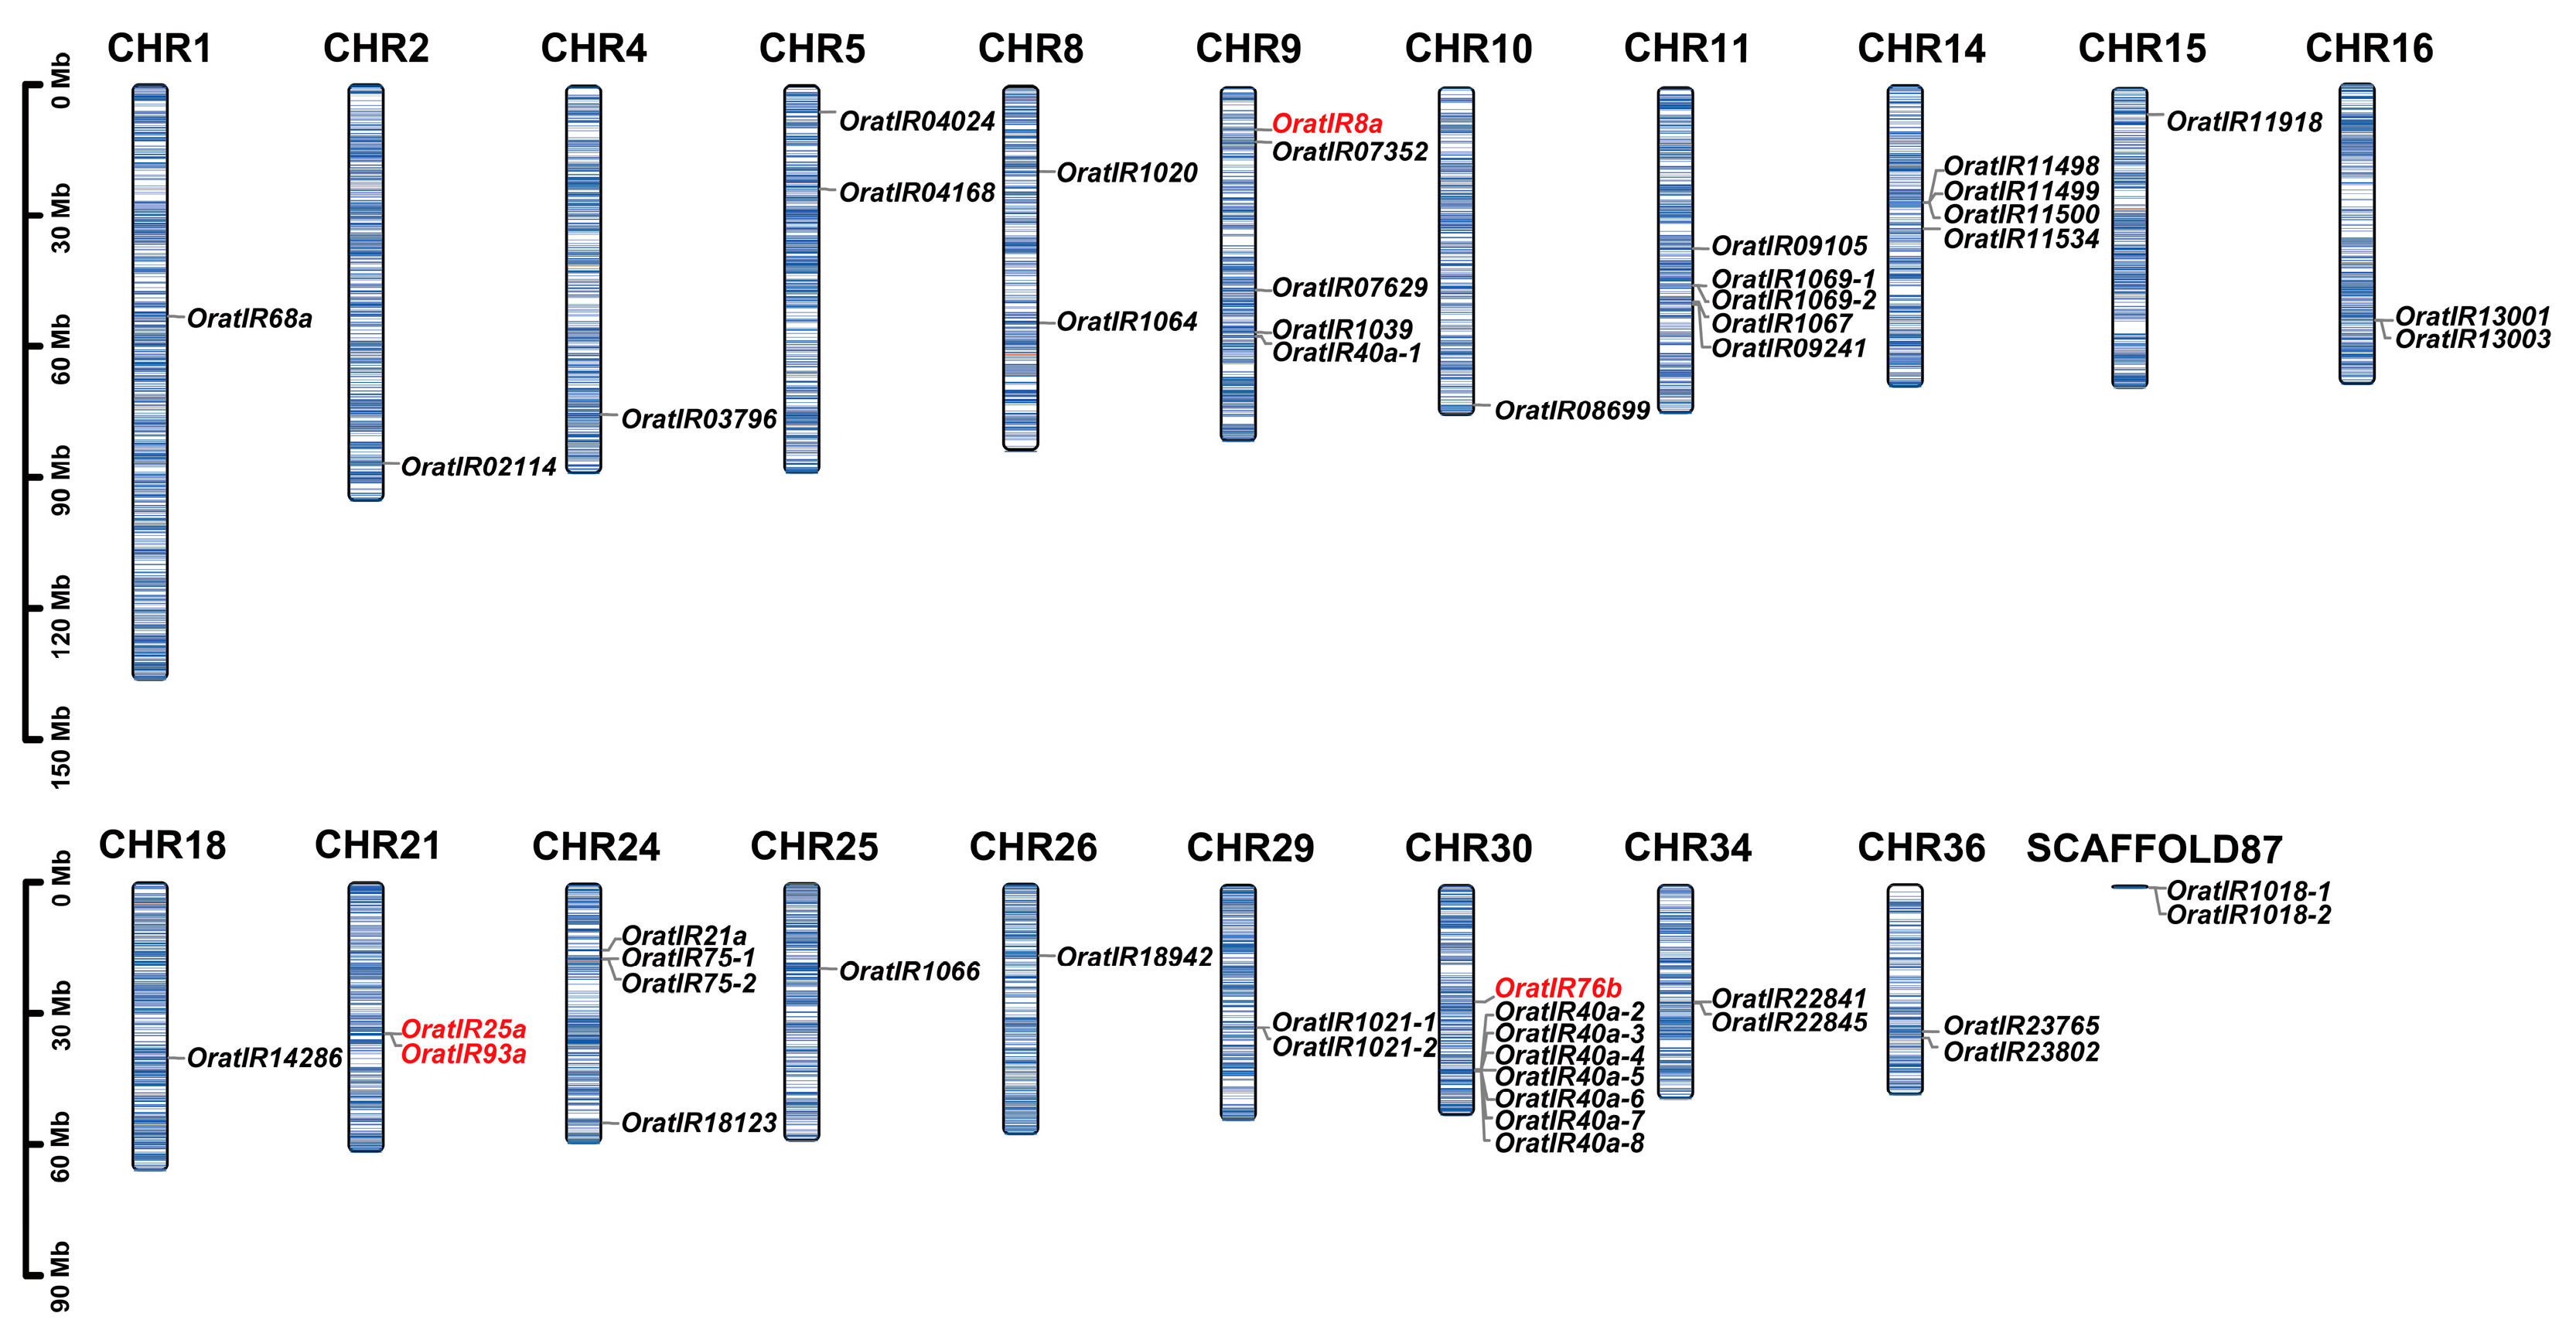
3.1. Identification, Classification, and Chromosomal Distribution of the IR Gene Family in O. oratoria

Utilizing the Hidden Markov Model of Lig_chan (PF00060) and Lig_chan-Glu_bd (PF10613), in conjunction with BLASTp homologous alignment, we conducted a comprehensive search for IR protein sequences containing conserved PFAM domains. After removing duplicate sequences, we identified a total of 50 IR protein sequences. Among these, the IRs consist of 4 co-receptor IRs and 46 tuning IRs, designated according to their subfamily classification. In the genomes of the closely related species L. vannamei and M. nipponense, 28 and 74 IR genes were identified, respectively (Table S2).
The chromosomal localization analysis of the OratIR gene family members (Figure 1) revealed that the 50 OratIRs are distributed across 20 distinct chromosomes and scaffold 87. The majority of these genes are situated in high-density regions, with varying numbers present on different chromosomes. Notably, chromosome 30 harbors a greater number of IR genes. The distribution patterns of IR subtypes differ among chromosomes. Co-receptor IRs are located on chromosomes 9, 21, and 30 while tuning IRs represent the most numerous category, dispersed across the remaining 19 chromosomes and on unassembled scaffold 87, excluding chromosome 21. Additionally, gene clustering was observed on chromosomes 11, 14, 24, and 30, as well as on scaffold 87. We propose that these clusters may have originated from tandem repeats, which is supported by their high density and clustering patterns. In the tuning IRs, the genes OratIR1069-1 and OratIR1069-2 cluster together, while OratIR11498, OratIR11499, and OratIR11500, like OratIR75-1 and OratIR75-2, form a cluster. Furthermore, the genes OratIR40a-2, OratIR40a-3, OratIR40a-4, OratIR40a-5, and OratIR40a-6 are clustered together, while OratIR40a-7 and OratIR40a-8 form another cluster. Additionally, the genes OratIR1018-1 and OratIR1018-2 exhibit clustering behavior as well. It was predicted that the distance between adjacent genes was less than 70 kb. Furthermore, their protein sequences exhibit a high degree of similarity, which further supports the hypothesis that these genes originated from tandem repeats (Table S3).

3.2. Physicochemical Properties and Subcellular Localization Analysis of the IR Gene Family

An analysis of the physicochemical properties and subcellular localization predictions of the OratIR gene family members was conducted, with results summarized in Table 3. The lengths of amino acids constituting the proteins of the IR gene family of O. oratoria vary significantly, ranging from 375 to 1882 amino acids (aa), while their molecular weights (MWs) span from 42.32 to 219.30 kDa. The average values are calculated at 726.34 aa and 81.90 kDa, respectively. We speculate that the substantial amino acid length variation in OratIR genes is likely due to gene duplications, followed by mutations altering gene regions and thus encoding lengths. The theoretical isoelectric points (pI) of the OratIRs range from acidic (4.0) to basic (9.4). Amino acids are classified based on their theoretical isoelectric points: those exceeding a pI of 7 are categorized as basic amino acids, whereas those below this threshold are classified as acidic amino acids. Among the analyzed set of 50 IRs, 16 consist predominantly of basic amino acids while the remaining 34 comprise acidic ones, and the acidic amino acids exhibit a higher average length and molecular weight compared to their basic counterparts. The instability index ranges from 27.98 to 87.04, while the aliphatic index spans from 68.18 to 106.92, and the grand average of hydropathicity (GRAVY) ranges from −0.902 to +0.229 overall; the proportion of hydrophobic proteins is 37%, while the proportion of hydrophilic proteins is 63%. According to the subcellular localization prediction results, 35 OratIRs encode proteins located in the plasma membrane, 6 genes localize in the endoplasmic reticulum, 5 genes reside in the golgi apparatus, 2 genes are situated in mitochondria, 1 gene is found in the vacuole, and 1 gene exists within extracellular space.

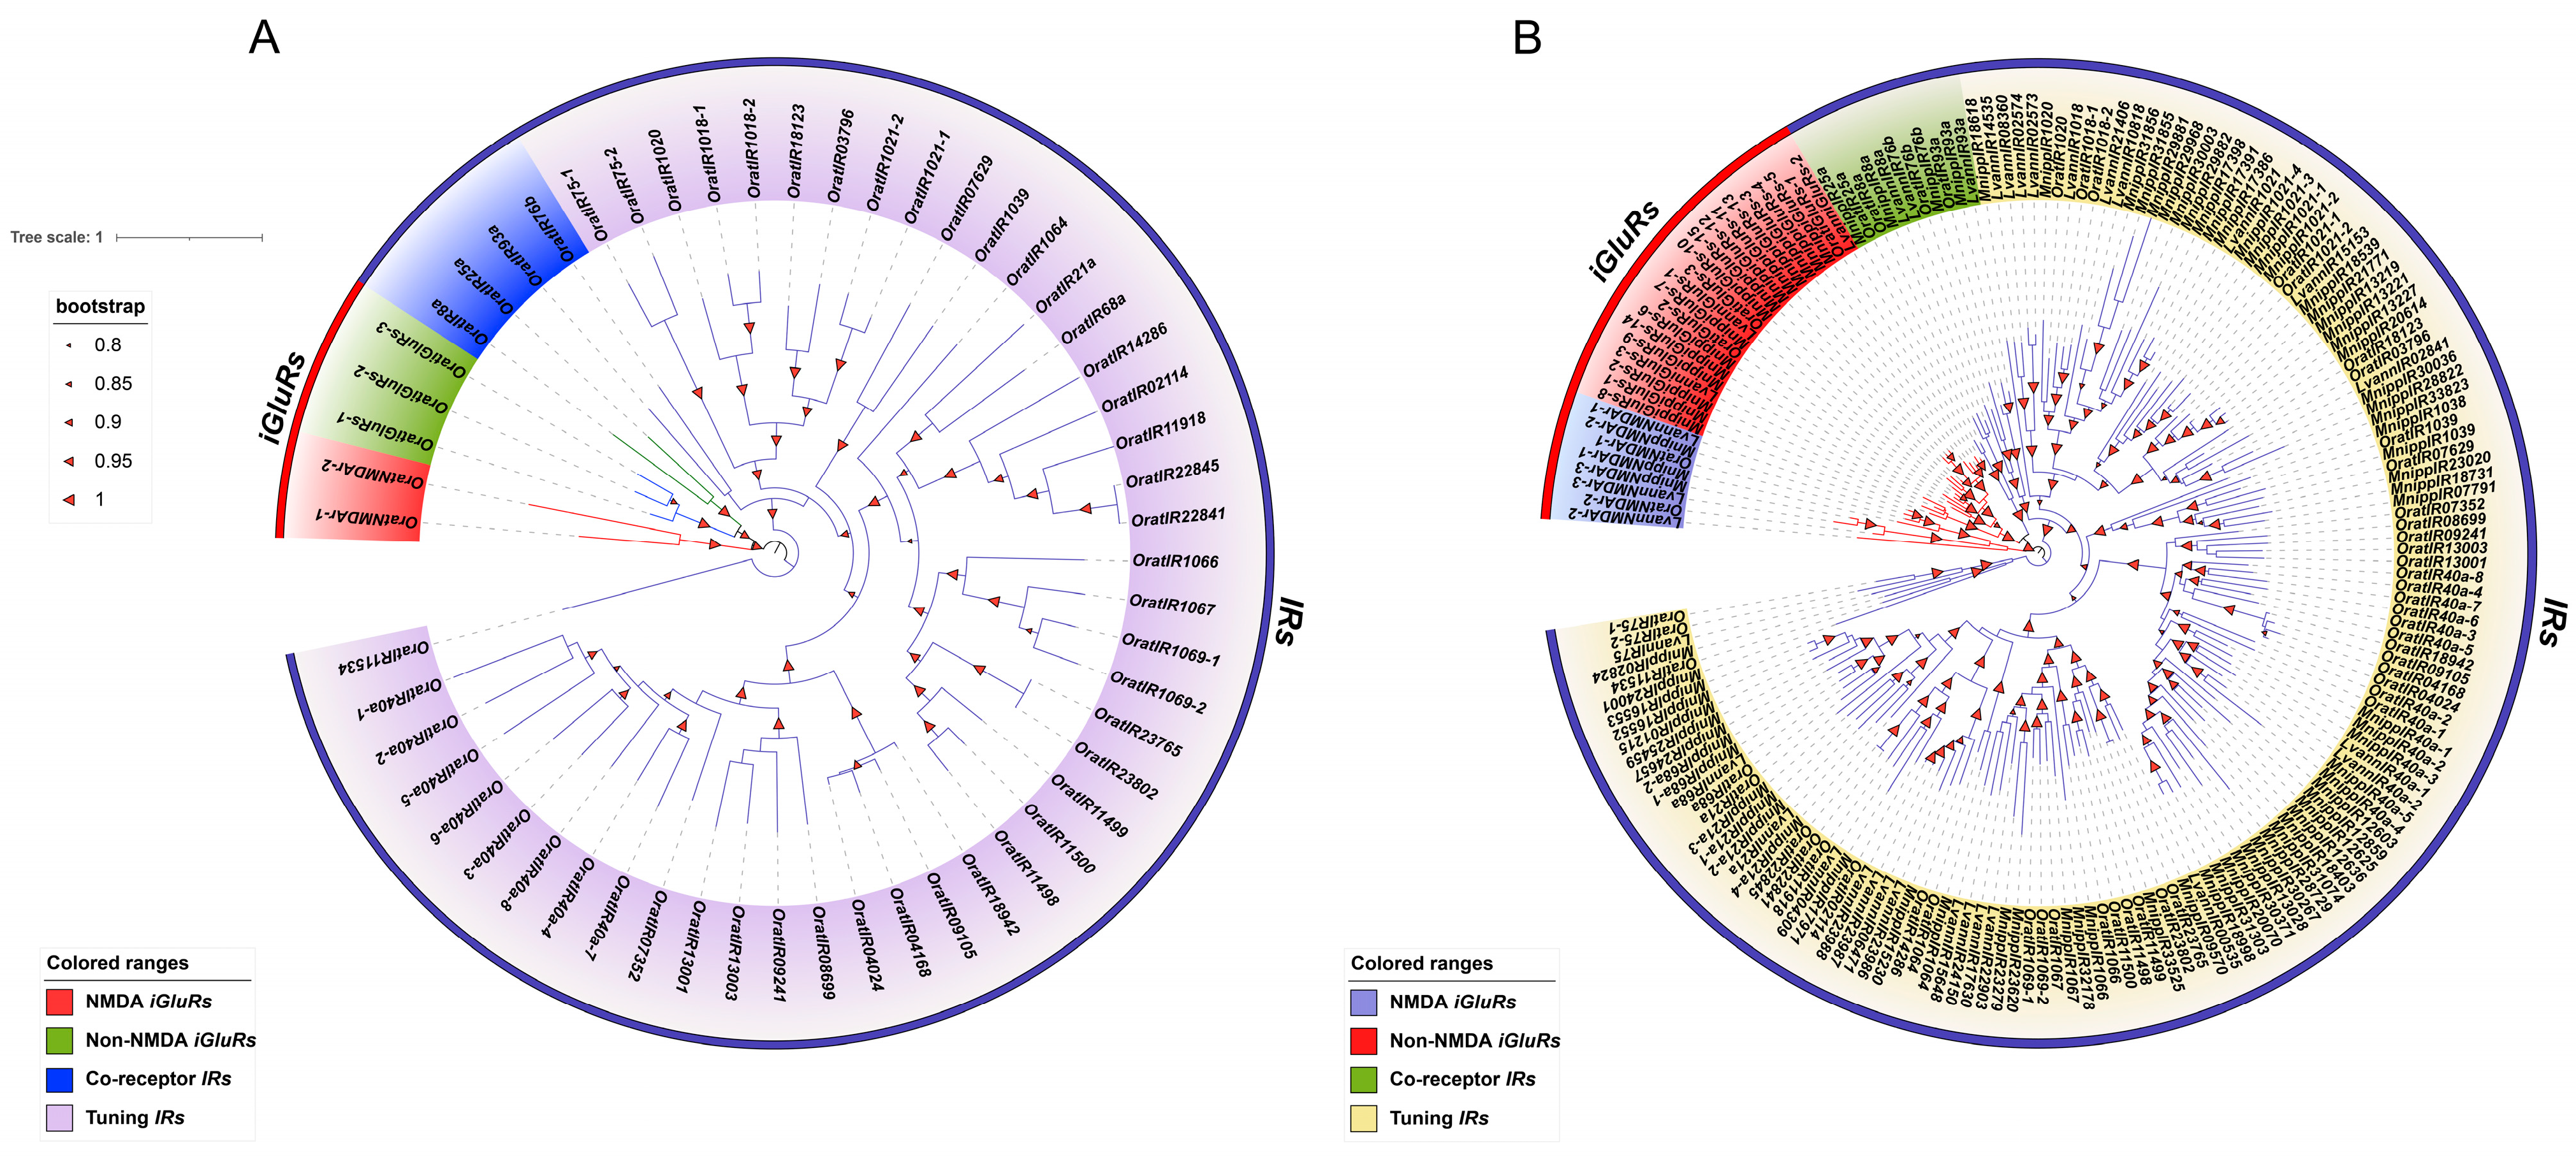
3.3. Interspecific and Intraspecific Phylogenetic Analysis of the IR Gene Family

To investigate the phylogenetic relationships within the IR and iGluR gene families in O. oratoria, we constructed an intraspecific phylogenetic tree using the maximum likelihood method implemented in MEGA software (version 6.0). The results (Figure 2A) showed that the tree is divided into two primary branches, with genes of each subfamily clustering separately. Notably, co-receptor IRs exhibited a close relationship with iGluRs. The sister branch formed by OratIR25a, OratIR8a, and non-NMDA iGluRs suggested a closer evolutionary relationship. In contrast, tuning IRs displayed greater evolutionary diversity in the phylogenetic tree and could be further divided into three branches, including various conserved tuning IRs. These subclasses included arthropod-conserved tuning IRs (IR21a, IR40a, IR68a, IR75, and IR1039), crustacean-conserved tuning IRs (IR1020, IR1064, IR1066, and IR1067), and decapod-conserved tuning IRs (IR1018, IR1021, and IR1069). Additionally, other tuning IRs appeared to be specific to O. oratoria.
To further investigate the evolutionary relationships of IR genes among different species, we combined the iGluR and IR protein sequences of O. oratoria, L. vannamei, and M. nipponense to construct an interspecific phylogenetic tree (Figure 2B). The tree was divided into two major branches. Among different species, the IR and iGluR gene subtypes clustered in their respective branches due to sequence similarity, indicating that the IR gene family diverged prior to species divergence. Notably, the number of co-receptor IRs remained relatively conserved across species, whereas tuning IRs showed substantial interspecific variation. For example, O. oratoria has 46 tuning IRs, compared to 25 in L. vannamei and 70 in M. nipponense, suggesting lineage-specific expansion or contraction of this gene family. From the interspecific phylogenetic tree, it is evident that, in L. vannamei, co-receptor IRs exhibit a close relationship with iGluRs. The 25 tuning IRs in L. vannamei can be divided into three branches, similar to those in O. oratoria, presenting a relatively simpler evolutionary pattern. Specifically, IR1018 and IR1021 cluster within the decapod-conserved tuning IR group. In M. nipponense, a similar close relationship between co-receptor IRs and iGluRs is observed. Moreover, M. nipponense possesses the largest number of tuning IRs, which are also distributed among the three branches of tuning IRs. Notably, among conserved tuning IRs, M. nipponense lacks IR75, IR1018, and IR1069. These results reveal distinct evolutionary patterns for these genes, indicating their conservation and functional diversification during crustacean evolution.

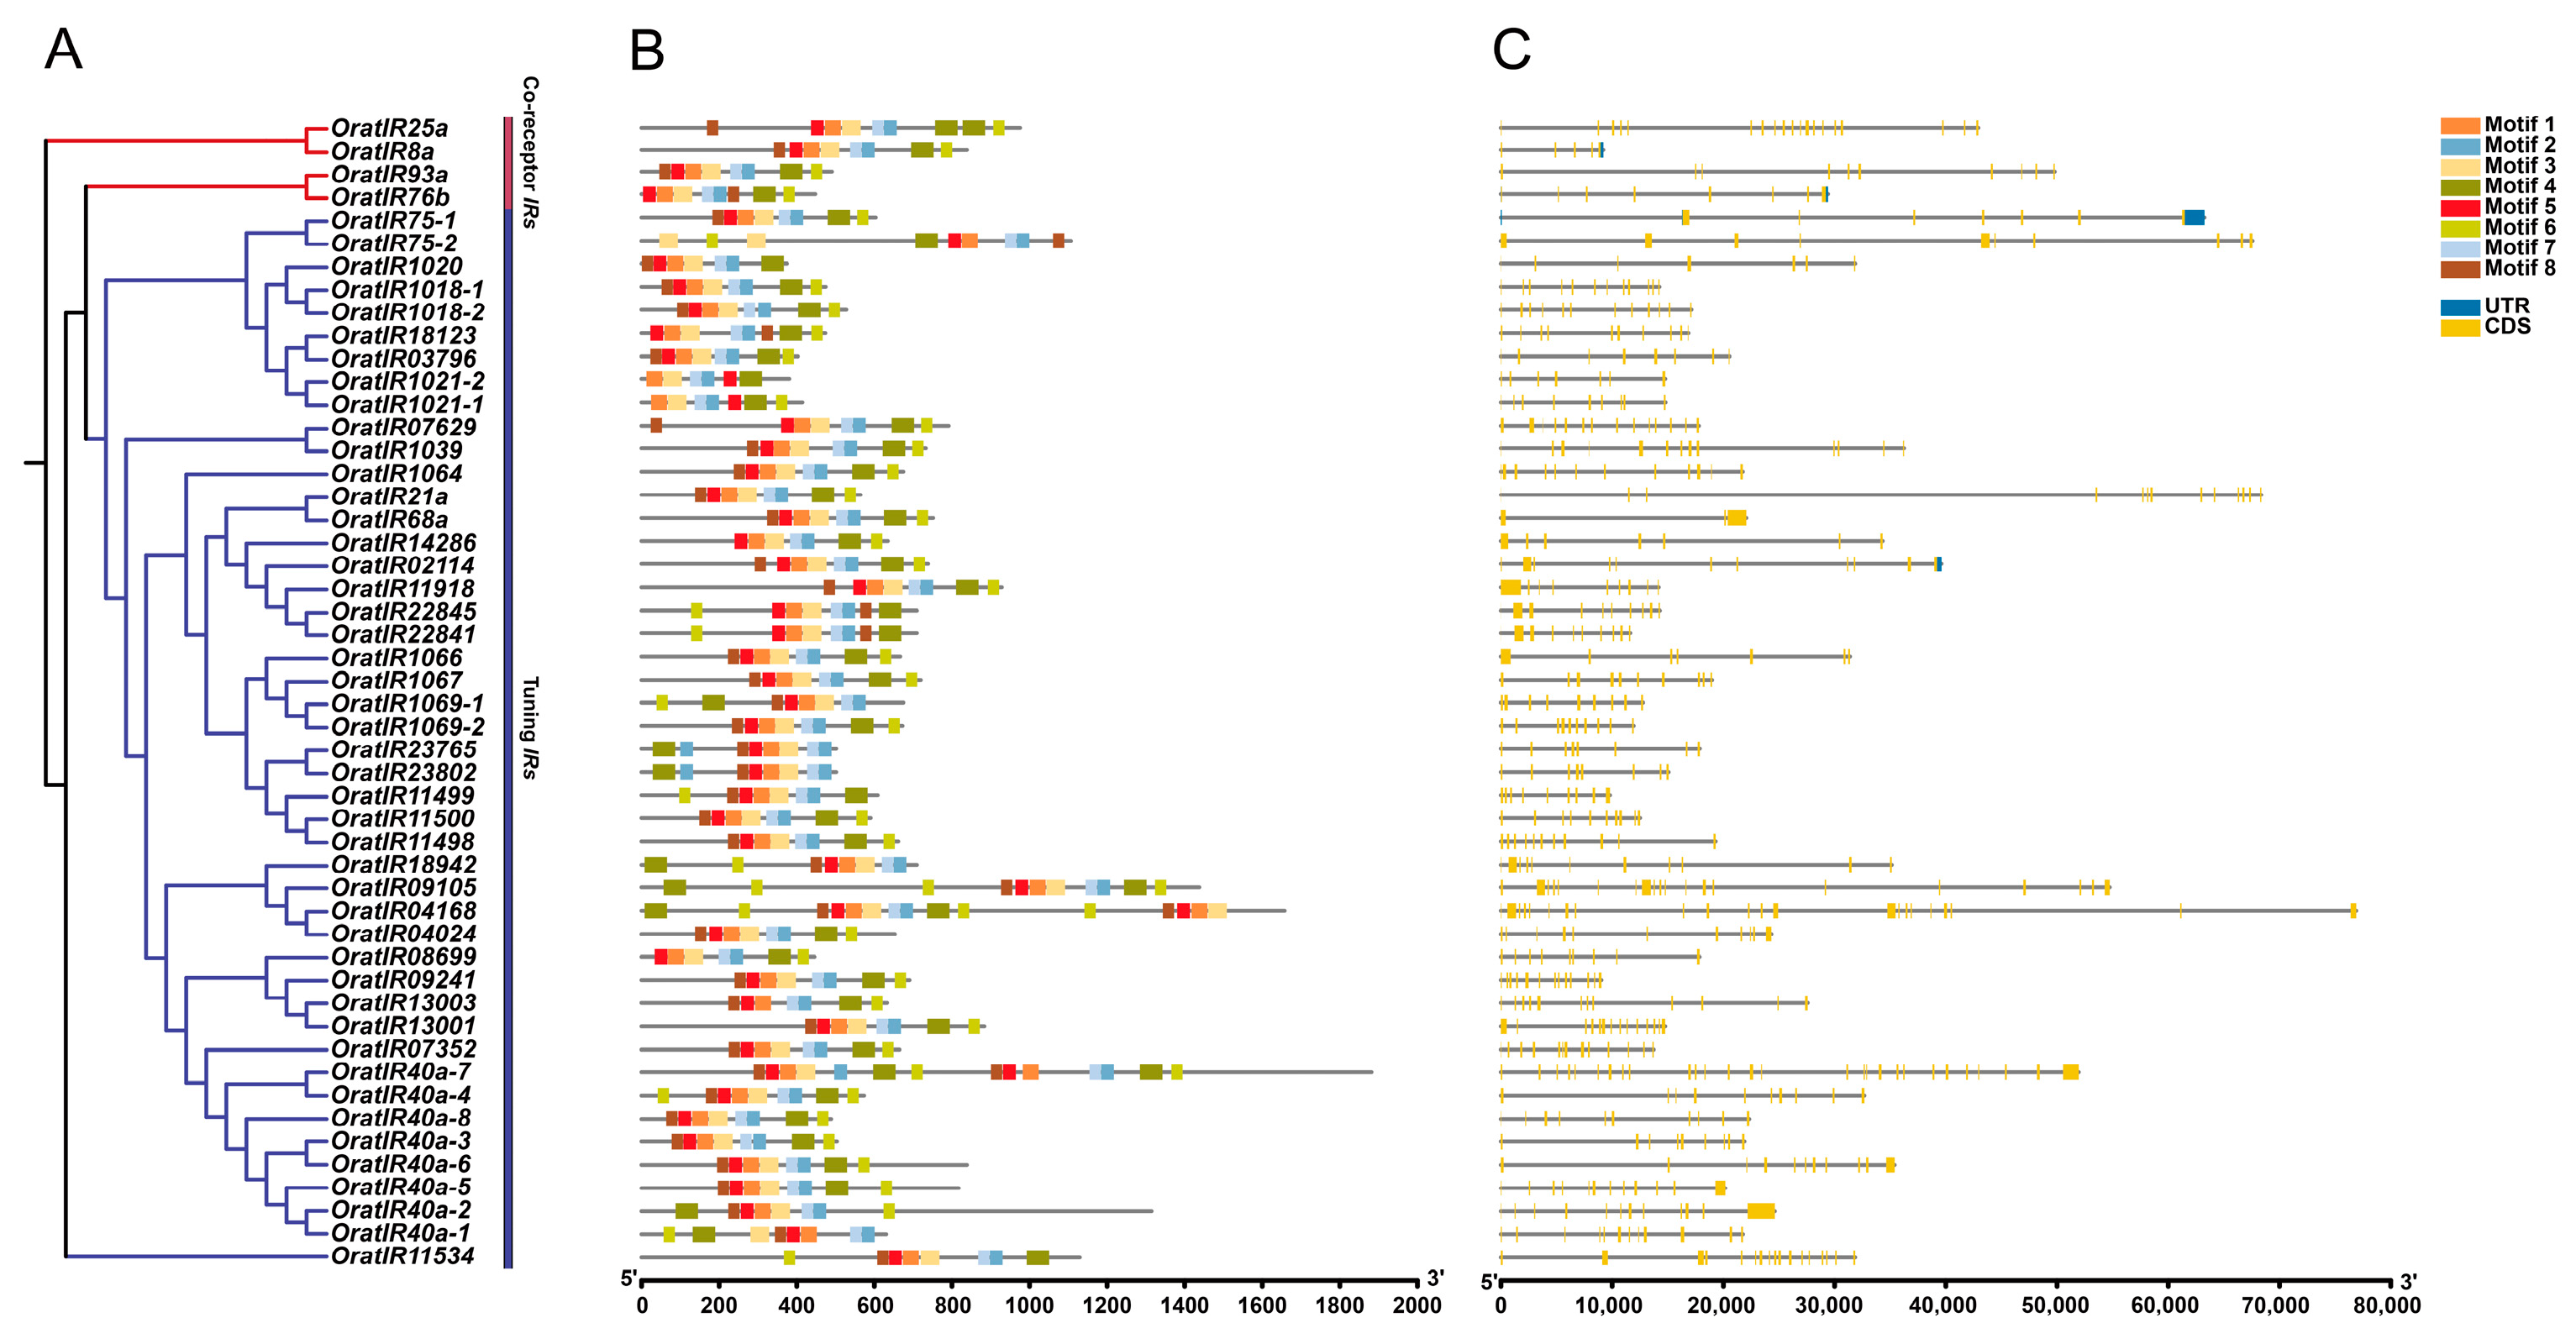
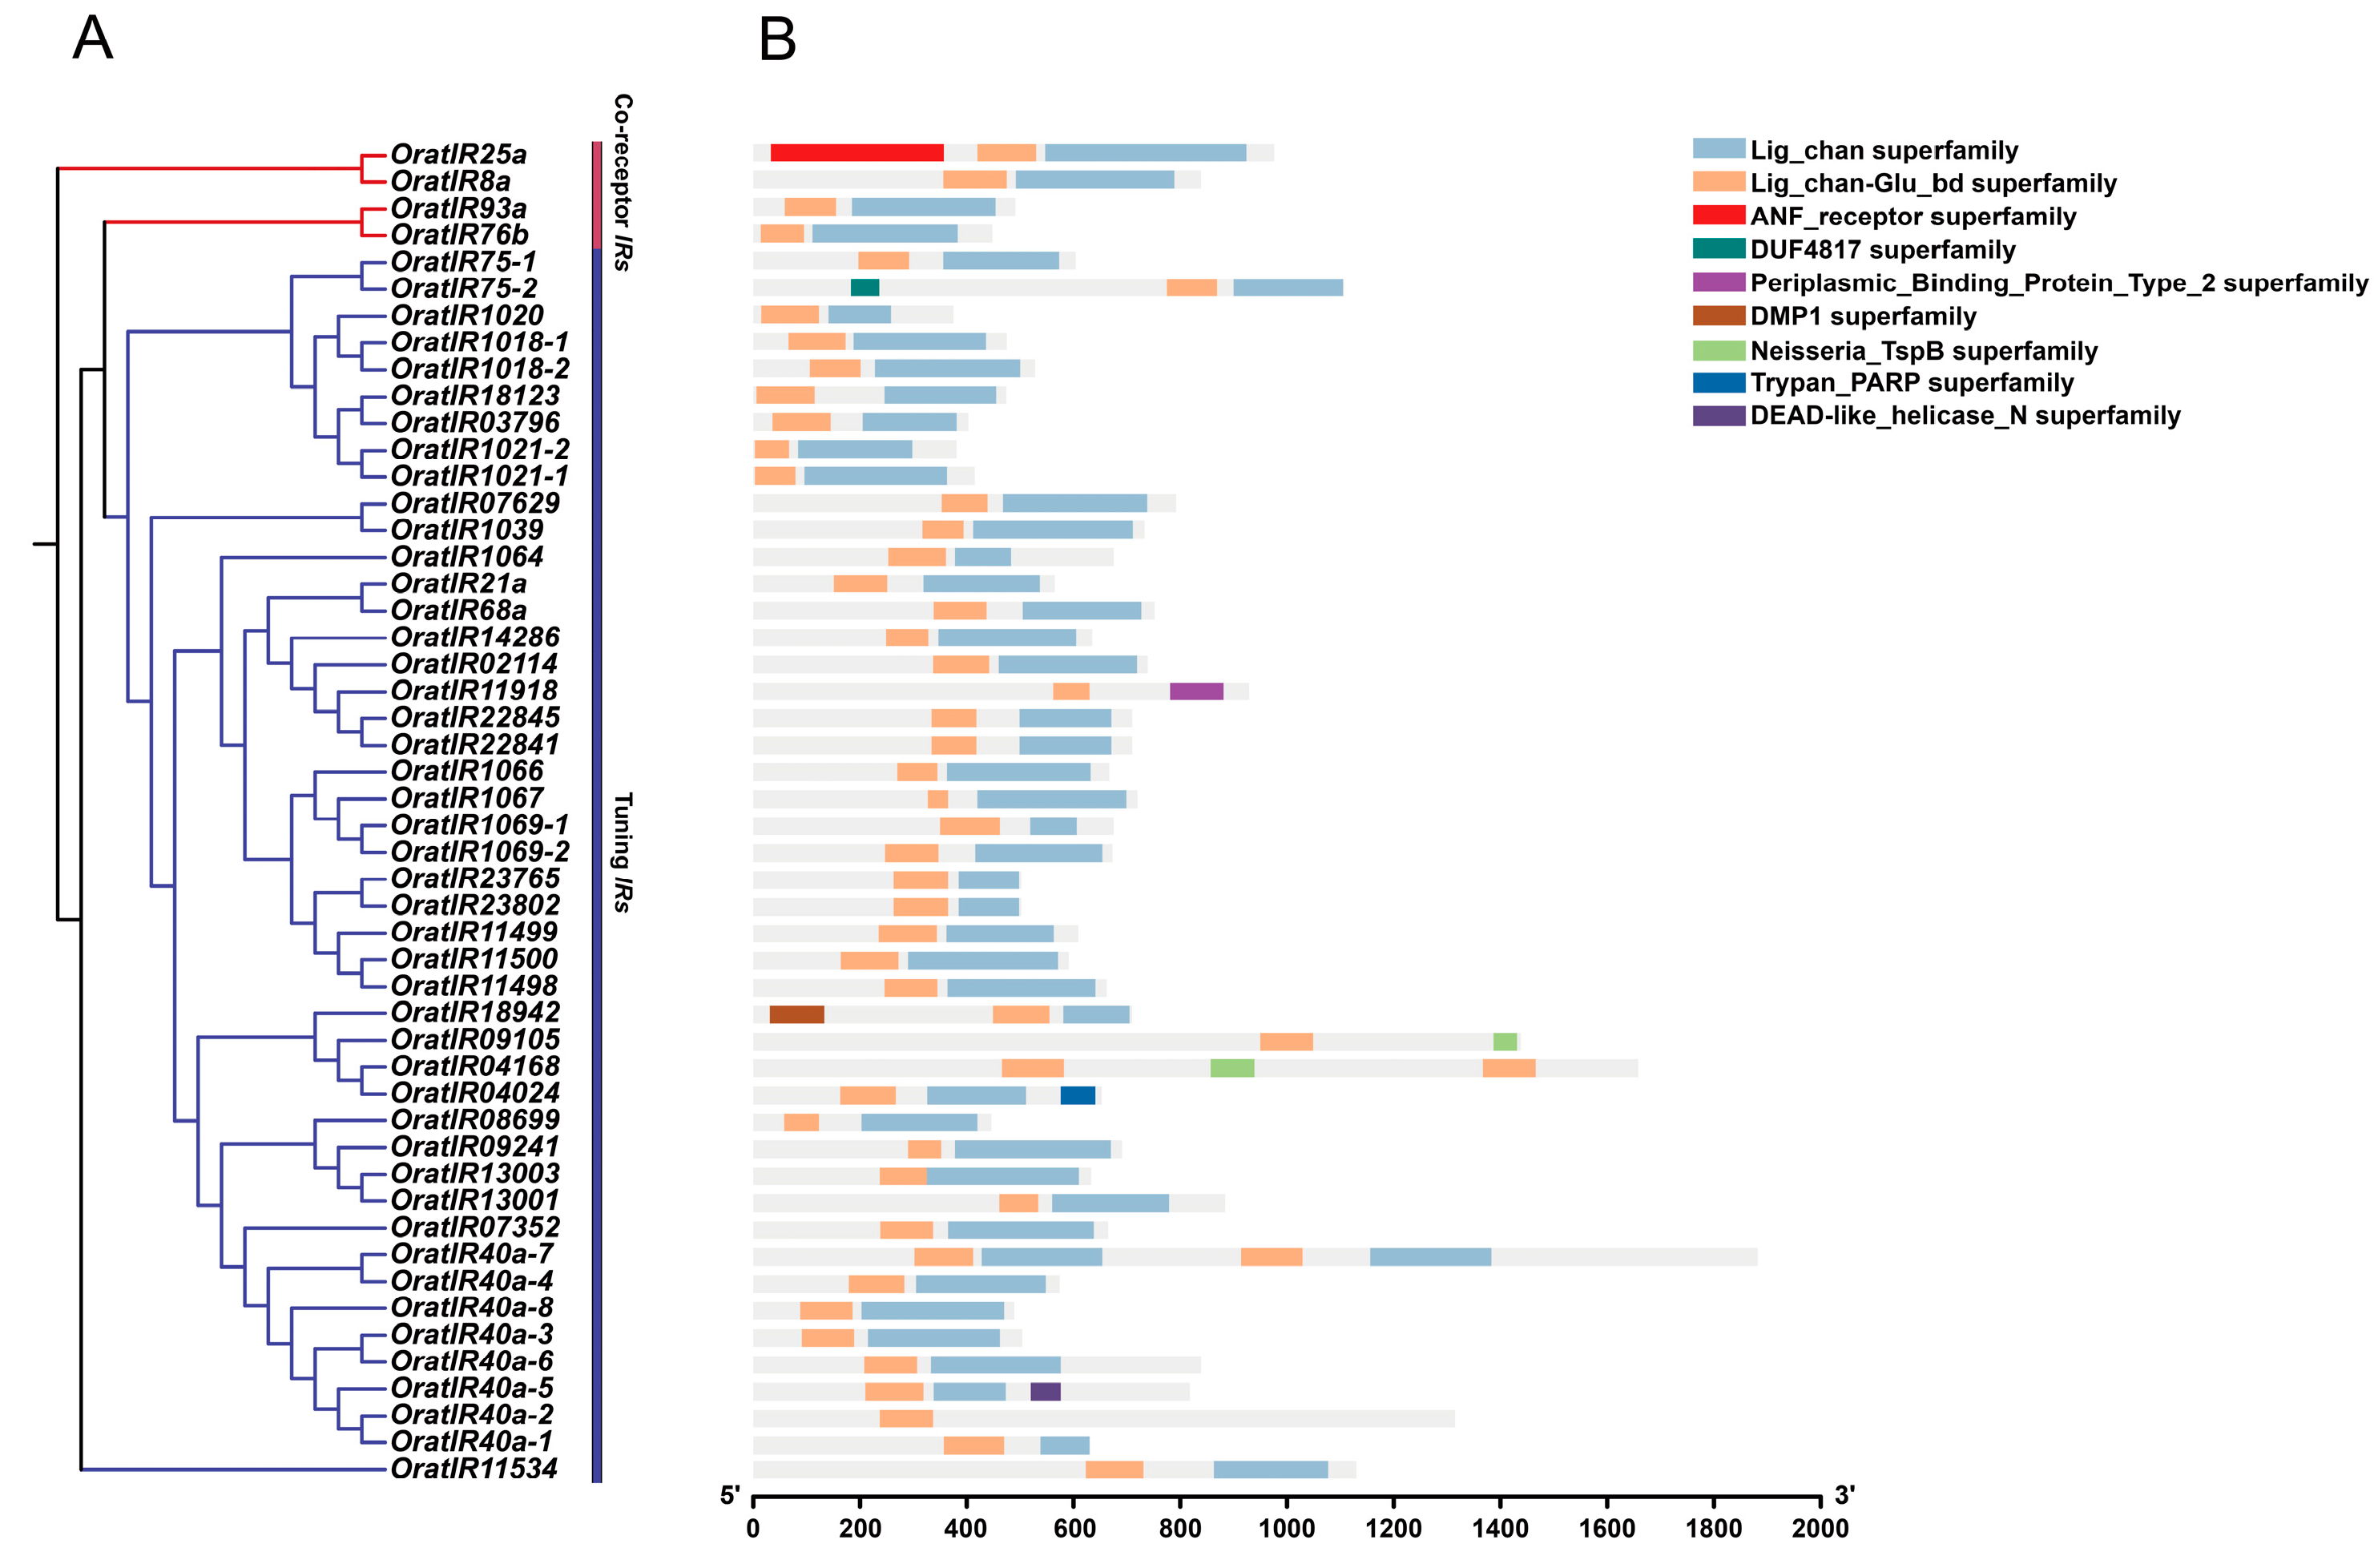
3.4. Motif, Gene Structure, and Domain Prediction Analysis of the IR Gene Family

To explore the diversity of OratIR protein structures, we analyzed 50 IR protein sequences using the MEME online tool. The analysis of conserved motifs within the IR gene family members of O. oratoria (Figure 3B) identified a total of eight conserved motifs, designated as motif 1 through motif 8, with detailed sequence information provided in Figure S1. The number and distribution of motifs across each group of IR proteins are generally similar, ranging from a minimum of 6 to a maximum of 15 motifs. Among these eight motifs, motif 1, motif 2, motif 4, and motif 5 are uniformly distributed; all members share these four motifs in common. Consequently, they represent typical domains of IRs, suggesting that they may have analogous functions. Gene structure analysis (Figure 3C) showed that the total number of OratIRs’ exons ranged from 3 to 28, while the number of introns varied between 2 and 27. The co-receptor IRs exhibit exon counts ranging from 5 to 19 and intron counts from 4 to 18, whereas tuning IRs display exon numbers ranging from 3 to 28 and intron numbers varying from 2 to 27. Notably, both maximum and minimum values for exons and introns are found in tuning IRs. Overall, substantial differences exist in the exon and intron structures of IRs within O. oratoria.
Protein domain information for the IR gene family members of O. oratoria was obtained using the CD-search tool on the NCBI website (Figure 4B). The results indicate that both the co-receptor IRs and tuning IRs subfamilies within the IR gene family of O. oratoria exhibit highly conserved structural characteristics. All four members of the co-receptor IRs possess both Lig_chan (Ligand-gated ion channel, PF00060) and Lig_chan-Glu_bd (Ligand-binding site for L-glutamate and glycine, PF10613). Collectively, these domains constitute the core functional module of the IRs, playing essential roles in the construction and regulation of ion channels as well as in the specific recognition of ligands. The Lig_chan superfamily comprises four transmembrane regions (M1–M4) present in iGluRs and NMDA receptors. The NMDA receptor, a subtype of iGluRs, operates through an activation mechanism that relies on the synergistic action of two ligands—L-glutamate and glycine—playing a critical regulatory role in synaptic signaling and neural plasticity. The Lig_chan-Glu_bd superfamily functions as a specific binding site for L-glutamate and glycine, situated within the S1 domain of the receptor. Consequently, the Lig_chan-Glu_bd domain represents a critical functional region for iGluRs family members (such as NMDA receptors) to bind ligands effectively, sense them, and activate ion channels. This mechanism enables IRs to respond precisely to external chemical signals. Additionally, OratIR25a also includes members from the ANF_receptor superfamily (Receptor family ligand binding region, PF01094). Tuning IRs demonstrate a high degree of similarity to co-receptor IRs in their domain compositions. Most conserved tuning IRs members concurrently possess the Lig_chan superfamily and the Lig_chan-Glu_bd superfamily. However, it is noteworthy that, among the arthropod-conserved tuning IRs, OratIR40a-2, as one of the few exceptions, contains only the Lig_chan-Glu_bd superfamily. OratIR40a-5, in addition to the Lig_chan superfamily and Lig_chan-Glu_bd superfamily, also includes the DEAD-like_helicase_N superfamily. Similarly, OratIR75-2 exhibits a unique domain combination that encompasses the Lig_chan superfamily and Lig_chan-Glu_bd superfamily, but also the DUF4817 superfamily. In other tuning IRs, OratIR04024 not only contains the Lig_chan superfamily and the Lig_chan-Glu_bd superfamily, but also shows the presence of the Trypan_PARP superfamily. Likewise, OratIR18942, in addition to the Lig_chan superfamily and Lig_chan-Glu_bd superfamily, also has the DMP1 superfamily. OratIR09105 and OratIR04168 only contain the Lig_chan-Glu_bd superfamily and the Neisseria_TspB superfamily. Furthermore, OratIR11918 is another member with a unique combination of domains, containing only the Lig_chan-Glu_bd superfamily and the Periplasmic Binding_Protein_Type_2 superfamily.
The secondary structure of OratIR proteins comprises alpha helix (Hh), extended strands (Ee), and random coils (Cc), with the highest proportion being random coils, which range from 35.73% to 76.73%. This is followed by alpha helices, accounting for 12.24% to 47.13%, while the proportion of extended strands is the smallest, ranging from 11.03% to 30.96% (Table 4). Utilizing known gene segments of OratIR proteins, homology modeling of the tertiary structure of OratIR proteins was conducted using SWISS-MODEL. The results (Figure S2) reveal notable differences among the 50 OratIR proteins; variability in their spatial structures underlies their functional distinctions. Consequently, variations in spatial structures among OratIR proteins dictate their functional differences.

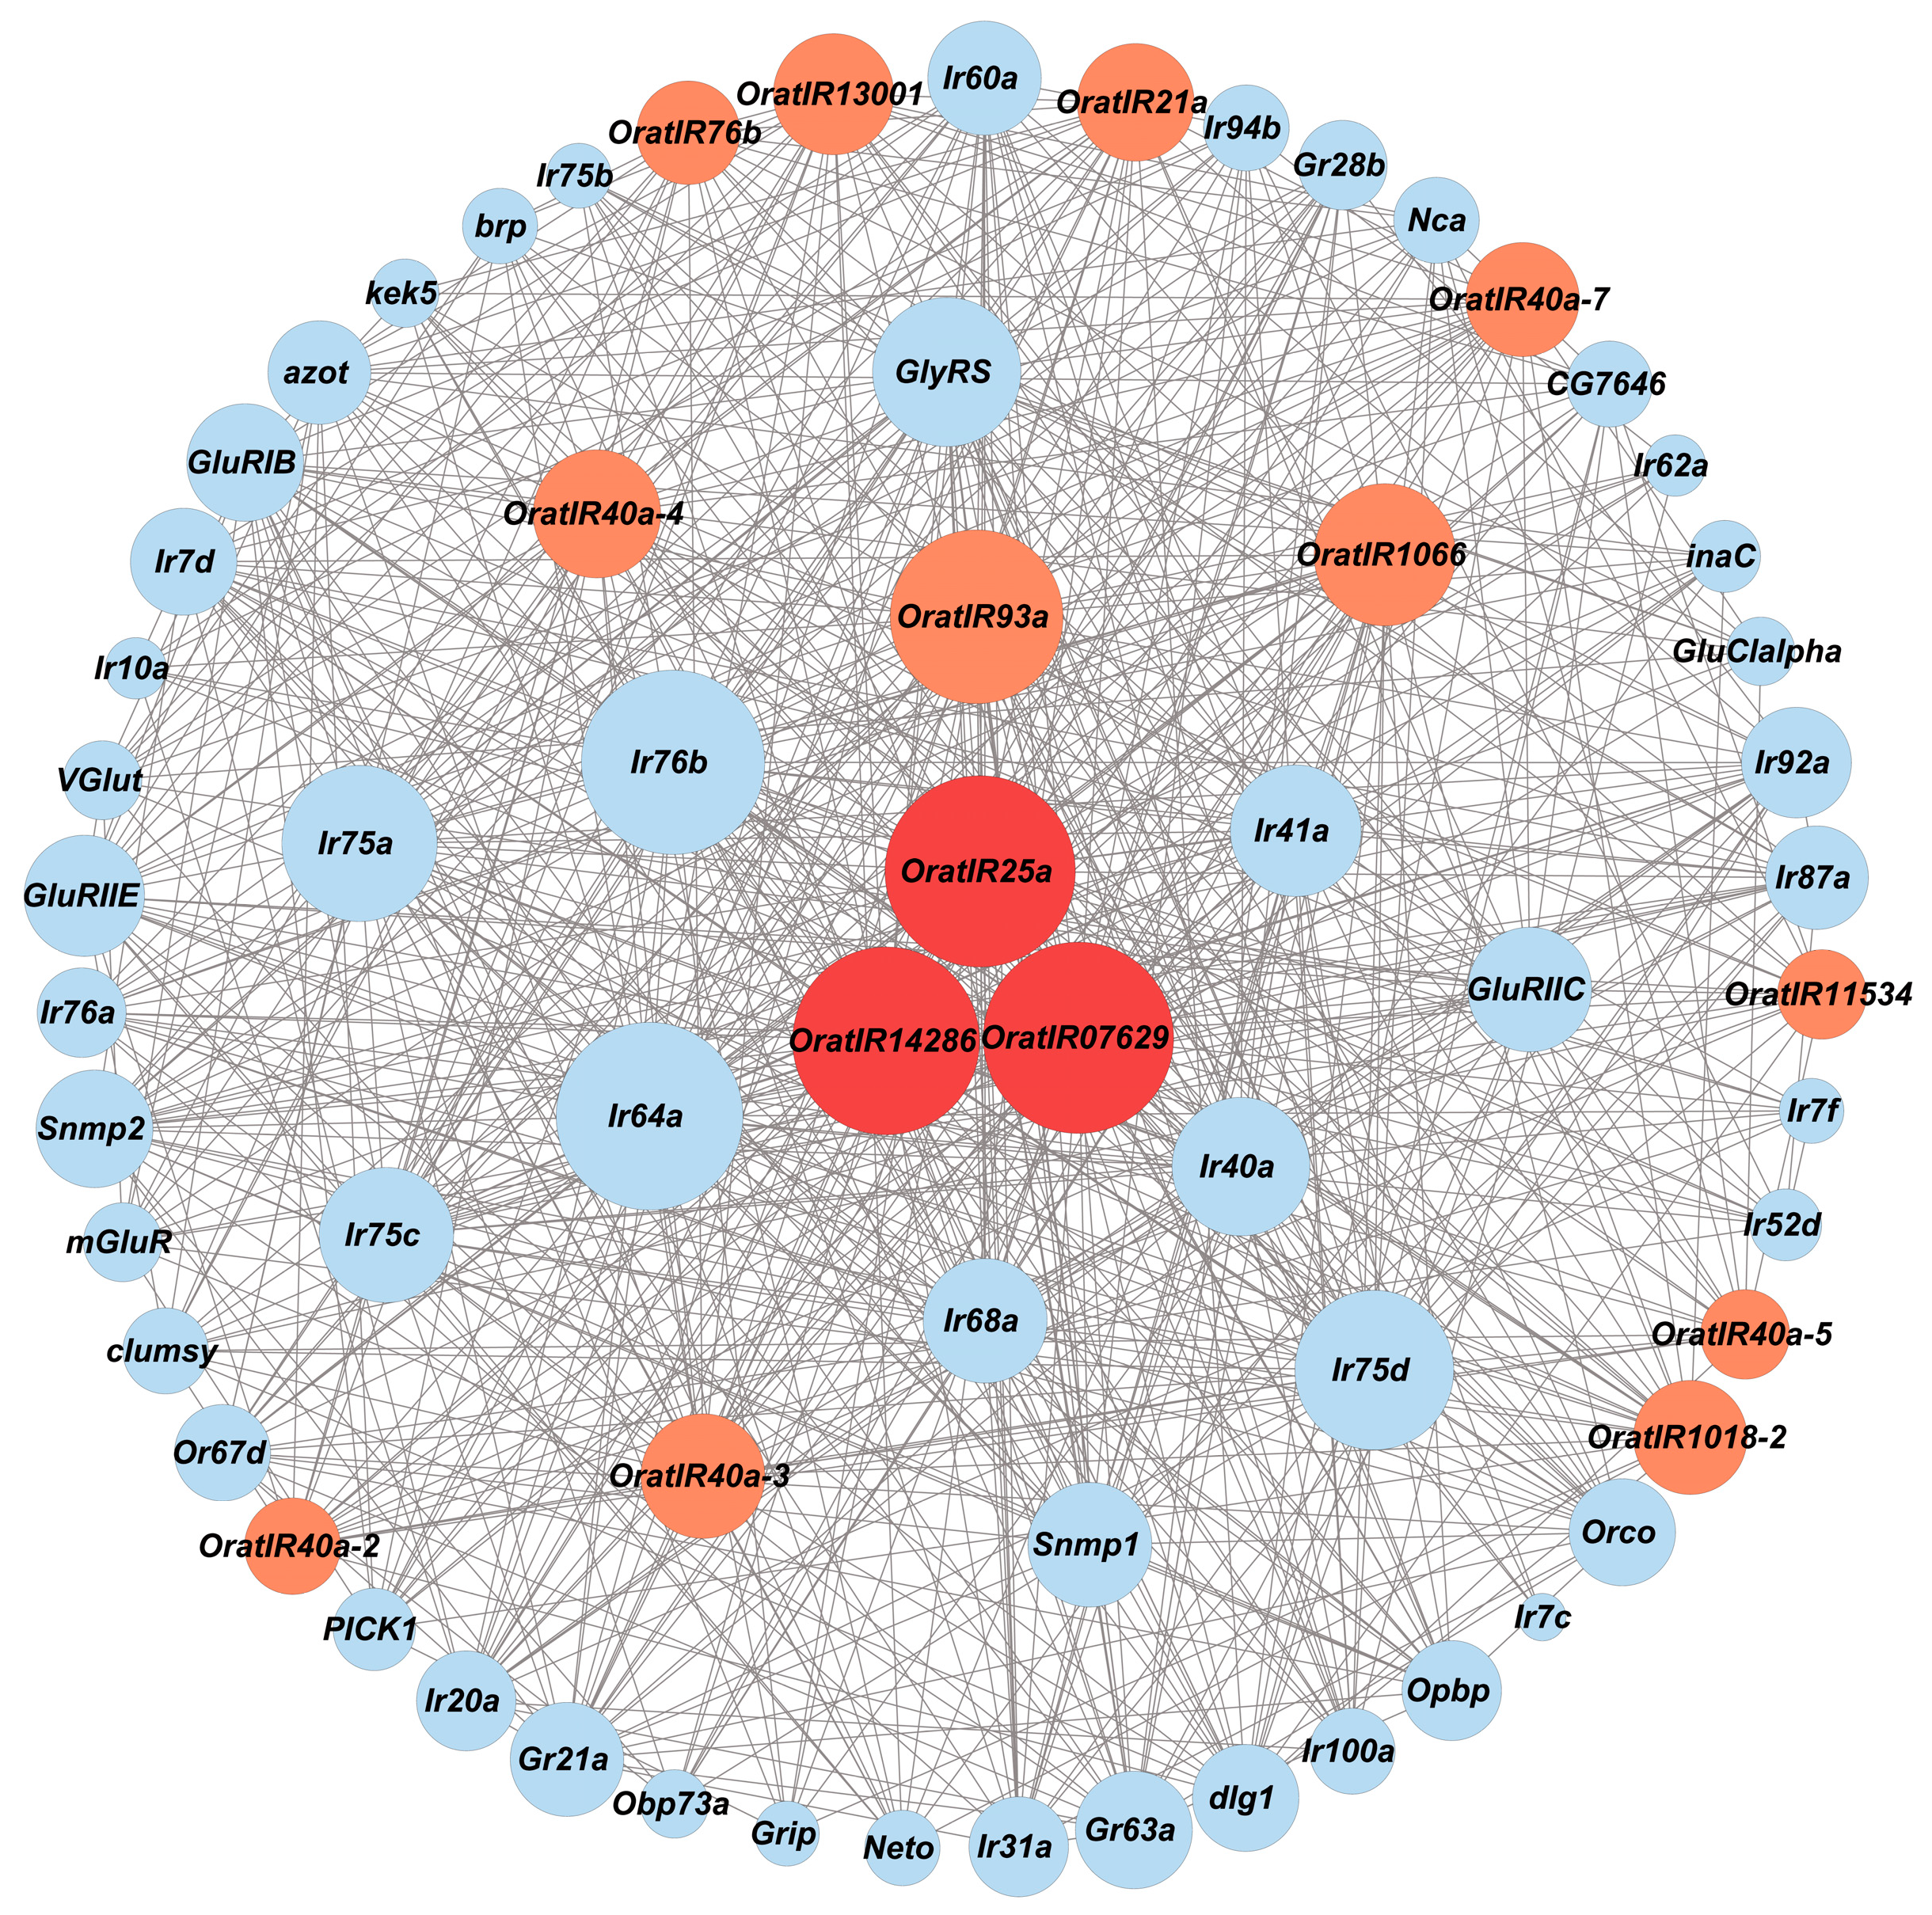
3.5. Protein Interaction Network of Genes Related to IRs

To investigate and analyze protein–protein interactions and infer the potential functions of the IR gene family in sensing and regulation, we examined the OratIR protein interaction network using the String tool, with Drosophila serving as a control model organism from the arthropods. The analysis revealed that a total of 15 OratIR proteins are involved in protein interactions, as illustrated in Figure 5. Notably, OratIR25a, OratIR07629, and OratIR14286 exhibit the highest number of interactions, serving as pivotal nodes in the network. Furthermore, all three demonstrate strong interaction relationships with OratIR93a, Ir40a, Ir64a, and Ir76b.
Based on the functional annotations derived from the String database (Tables S4 and S5), OratIR25a, OratIR93a, OratIR14286, and Ir40a participate in processes such as chemical stimulus detection, ion transmembrane transport, and functions related to the nervous system. Additionally, they exhibit activities related to inorganic molecular entity transmembrane transporter activity and ion channel activity. Specifically, OratIR25a is primarily involved in responding to environmental stimuli and regulating circadian rhythms through mechanisms that include temperature response, temperature compensation of the circadian clock, and entrainment of the circadian clock. OratIR07629 serves as an auxiliary receptor for ligand-specific IRs that predominantly detect a variety of organic acids while playing a crucial role in biological processes such as responses to acetate, chlorate, and inorganic substances. Ir64a serves as a broadly specific acid sensor that primarily detects acidic substances within the environment, and is involved in responses to acidic pH levels as well as reactions to chlorate. Ir76b plays a significant role in the chemical sensing of amines and salts, including the detection of chemical stimuli involved in the sensory perception of salty taste, with salty taste receptor activity and sodium ion transmembrane transporter activity. With amine compounds specifically, Ir76b is implicated in responses to organonitrogen compounds.

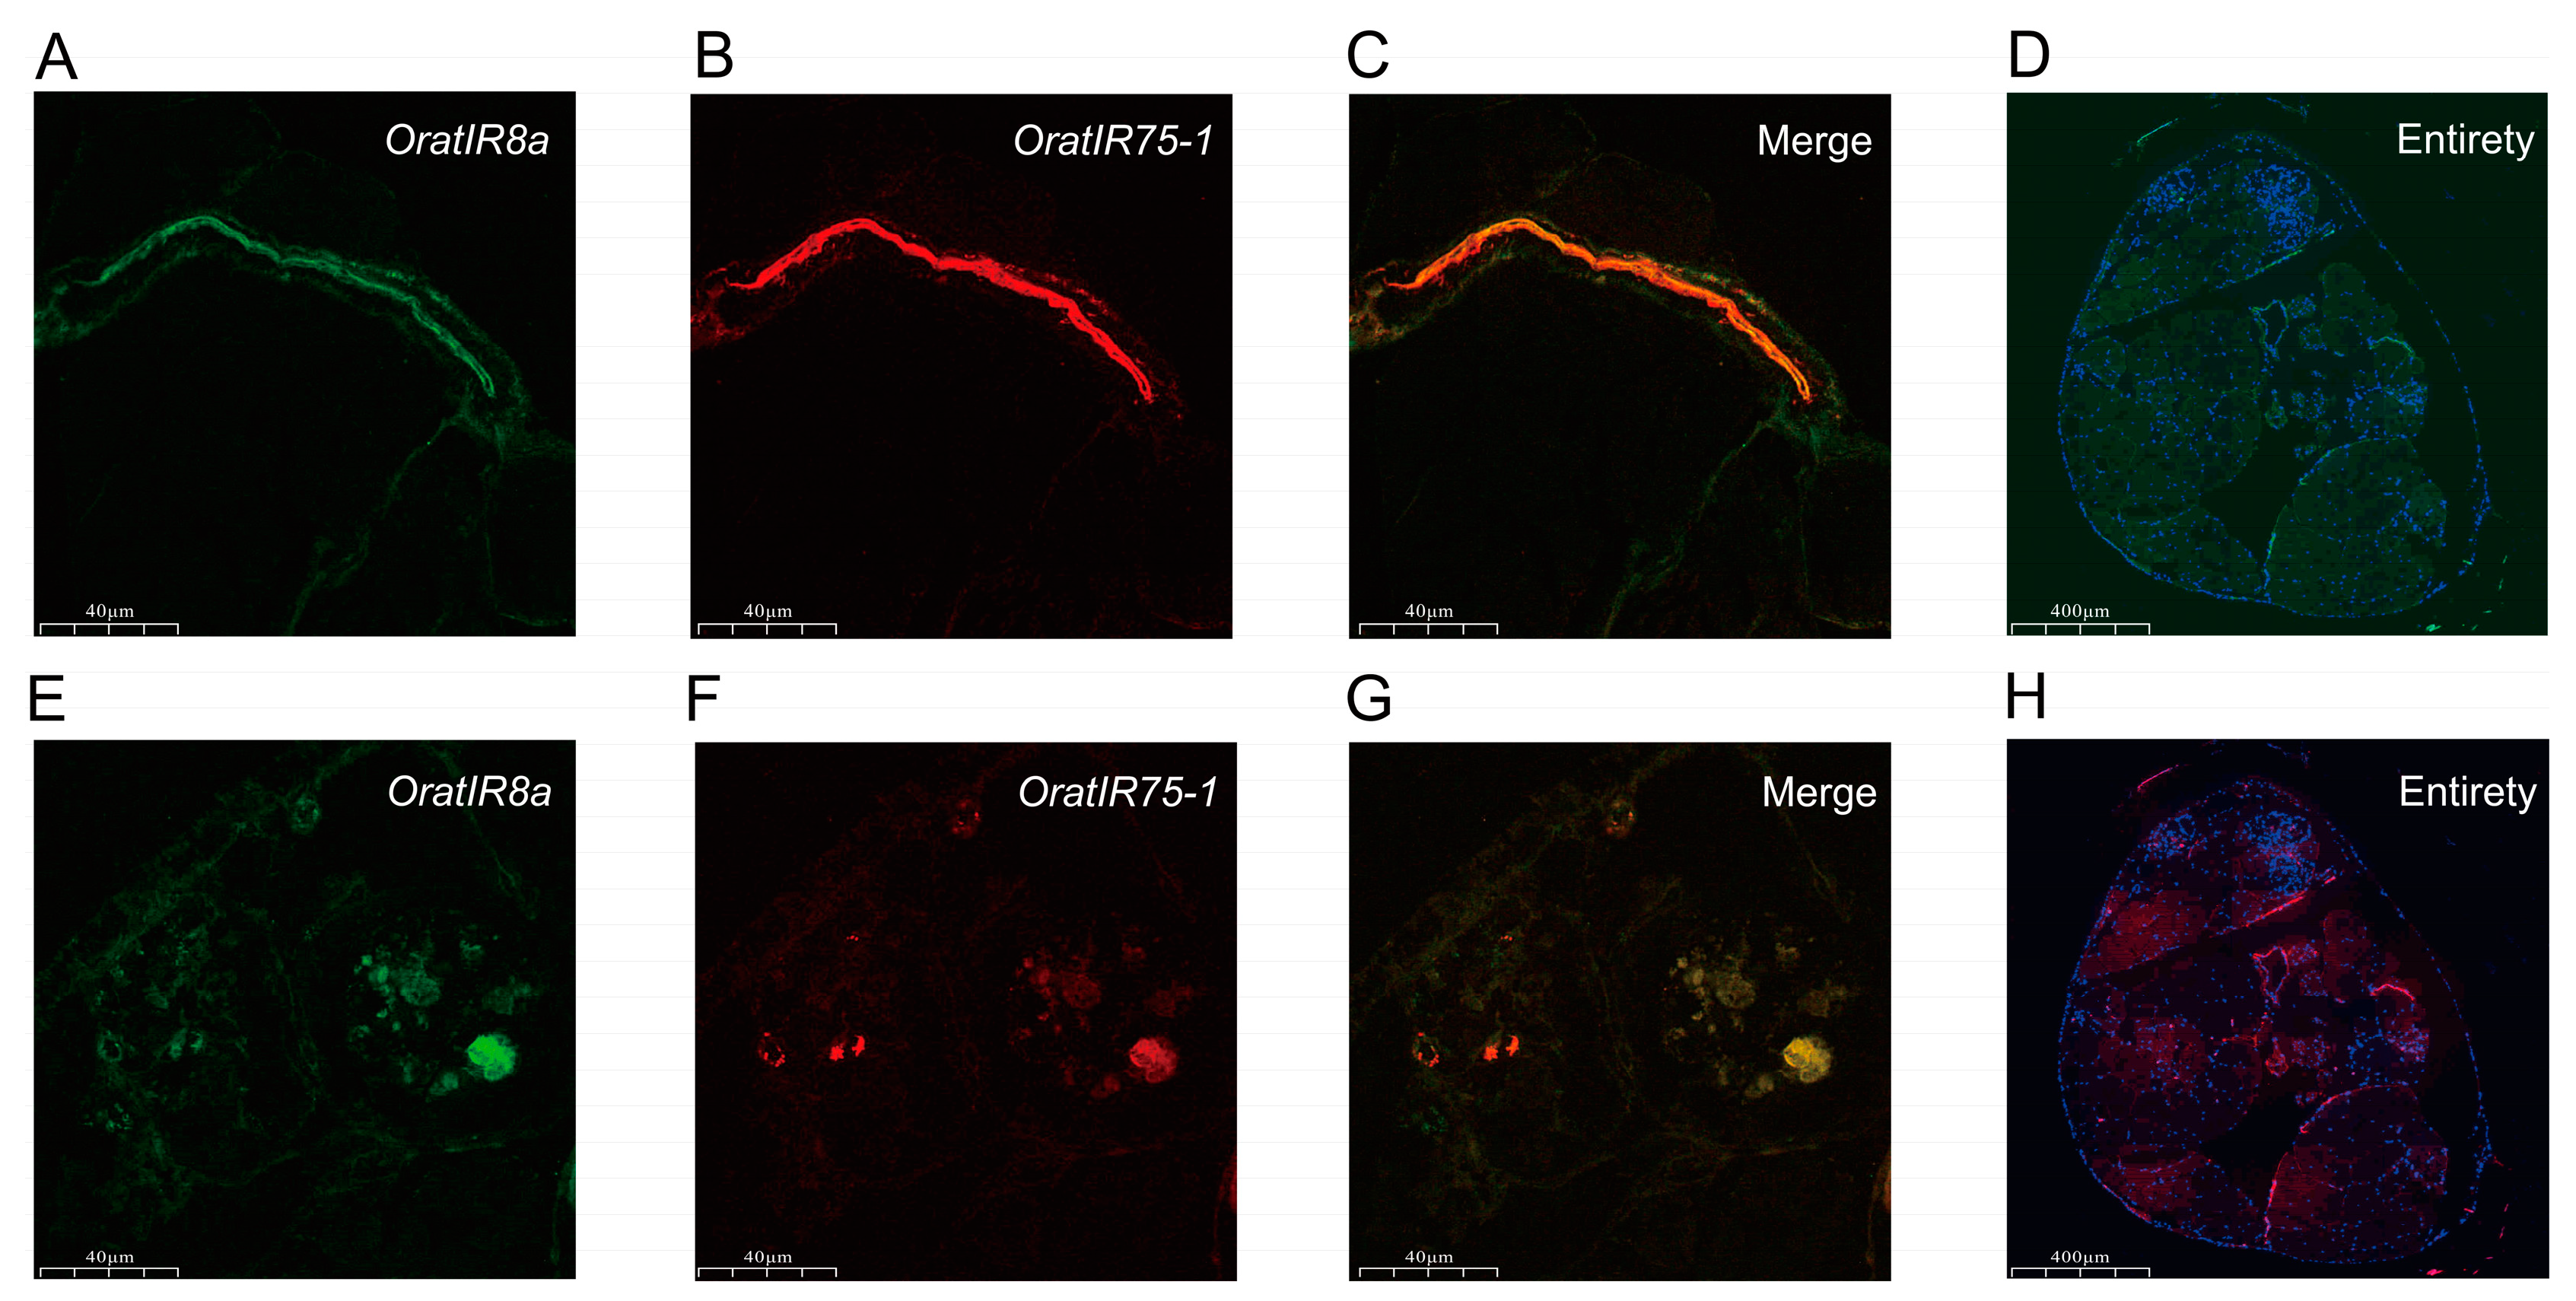
3.6. FISH Detection of OratIR8a and OratIR75-1

OratIR8a serves as a co-receptor for ligand-specific IRs, playing a critical role in mediating the binding of specific ligands to their receptors, while OratIR75-1, an important member of the expanded gene family, has been demonstrated to exhibit strong responsiveness to various acidic compounds [13,24,58,59,60]. Based on their unique molecular characteristics and potential functional significance, we employed fluorescent in situ hybridization (FISH) to systematically investigate the localization and co-expression patterns of these two genes in the antennae of O. oratoria. In the sections examined, the signal from the OratIR8a probe is represented by green fluorescence (FAM), while that from the OratIR75-1 probe is indicated by red fluorescence (Cy3). The results (Figure 6) demonstrate that, following fluorescent in situ hybridization, fluorescein-labeled genes are detectable within the antennae, with robust expression signals observed for both OratIR8a and OratIR75-1 in the antennae. Furthermore, both receptors are expressed in identical locations within the antennae, indicating a clear co-expression phenomenon.

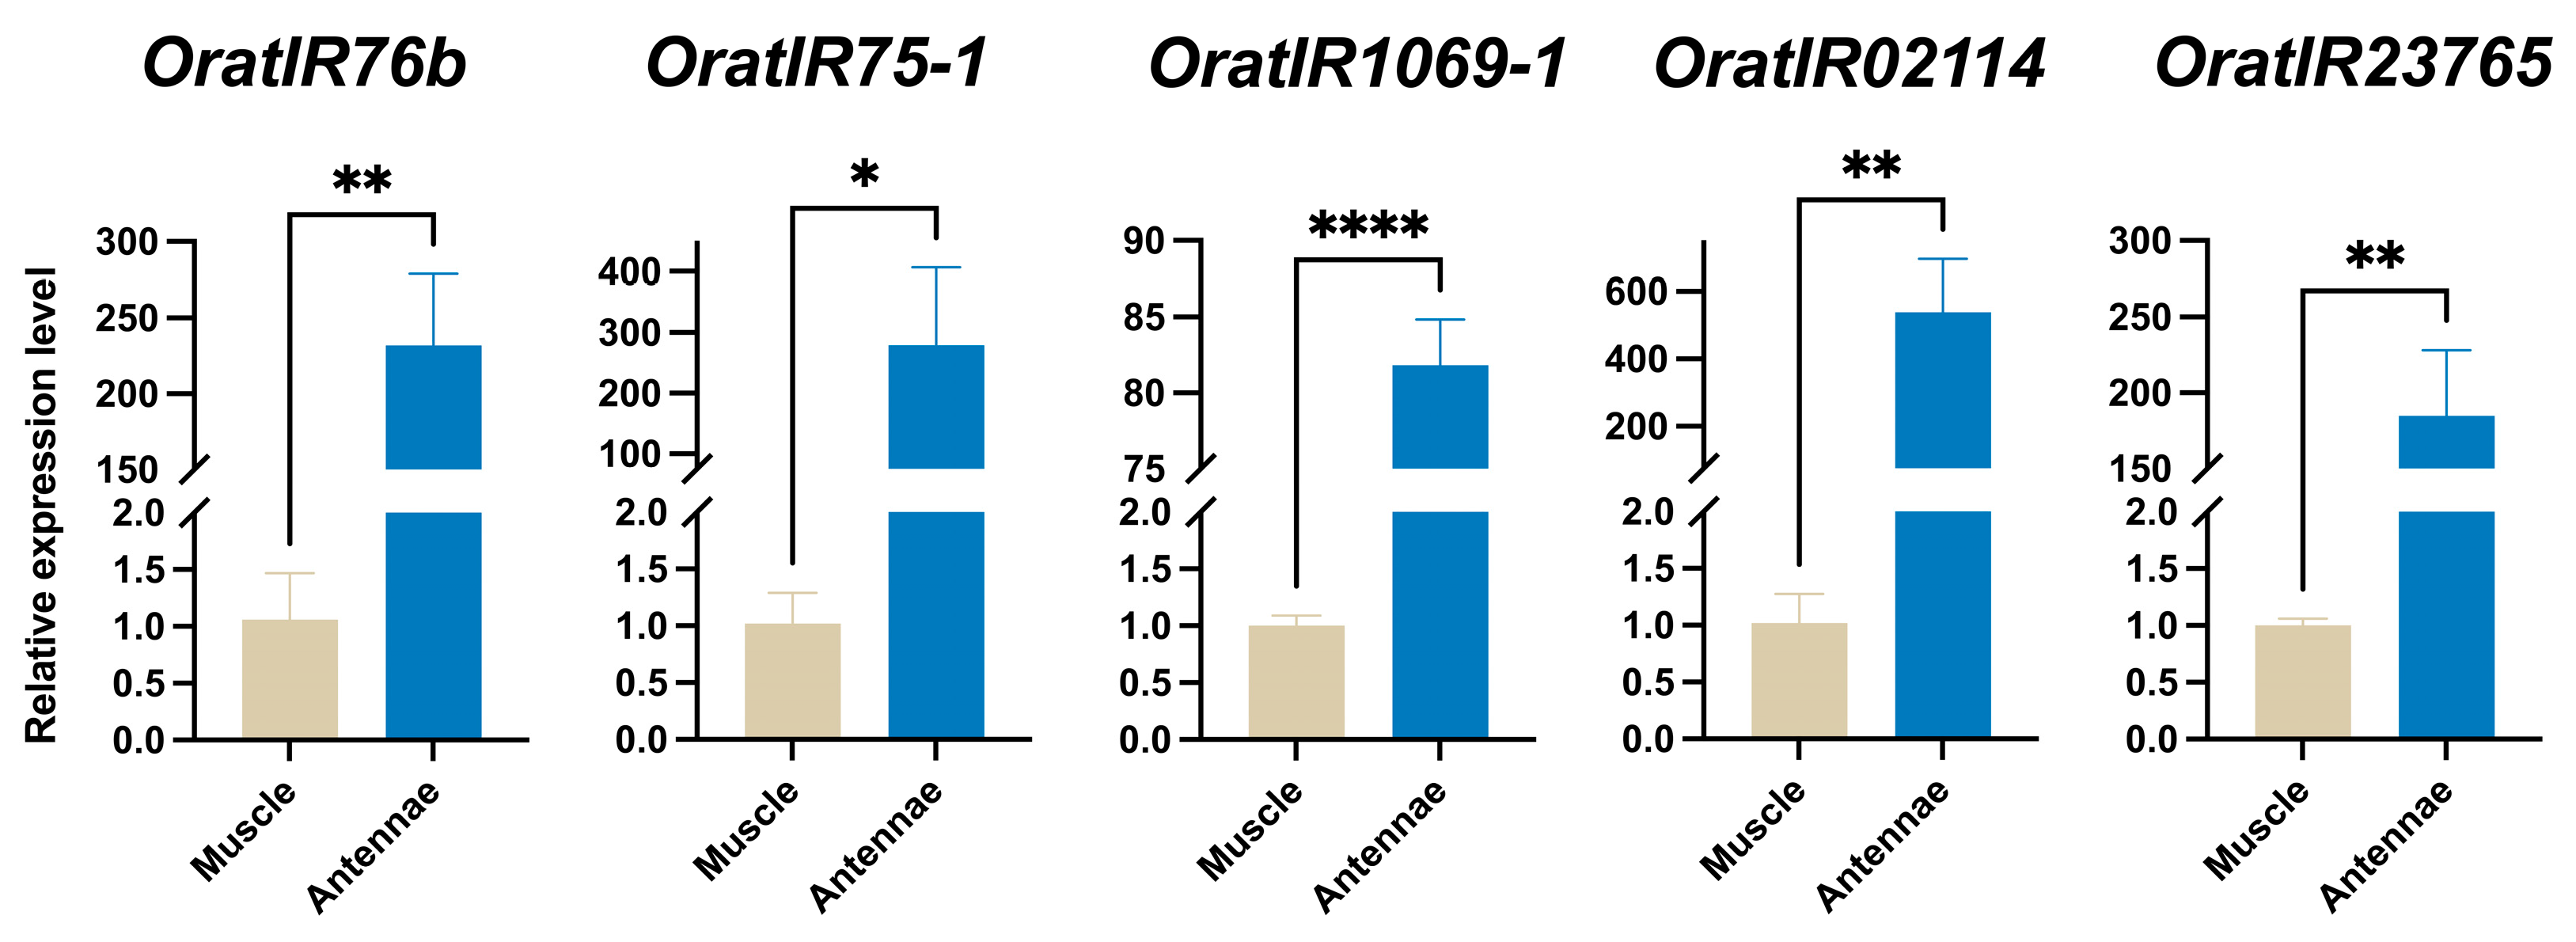
3.7. Expression Levels of Five OratIRs in O. oratoria Muscle and Tentacles

In this study, the expression levels of five genes from the OratIR family (including OratIR76b, OratIR75-1, OratIR1069-1, OratIR02114, and OratIR23765) in the muscle and antennal tissues of O. oratoria were quantified using RT-qPCR. The results demonstrated that the expression levels of all five OratIRs were significantly higher (p < 0.05) in antennal tissue compared to muscle tissue (Figure 7). This finding further confirms that OratIRs are highly expressed in the antennae of O. oratoria and may play a critical role in its olfactory evolution.

4. Discussion

Crustaceans employ their sensitive and intricate olfactory systems to detect critical chemical signals in their external environment, thereby regulating a variety of behavioral activities including foraging, mating, egg-laying, and predator avoidance [12,61,62]. Olfactory-related receptors are essential for signal transduction and represent some of the most important components of chemical communication [63]. Consequently, investigating these receptors is essential for elucidating the olfactory coding mechanisms in crustaceans. IRs are an identified class of olfactory-related receptors within the iGluR family; they were first characterized in the model organism Drosophila, in which substantial progress has been made in understanding their functions [14]. With the ongoing advancement and maturation of molecular biology technologies, an increasing number of various types and quantities of IRs have been identified. These include those from species such as Daphnia pulex [15], Panulirus argus, Homarus americanus, Procambarus clarkii, Callinectes sapidus [31,35,64], Coenobita clypeatus [30,65], and Scylla paramamosain [66]. In this study, we identified the IR genes of O. oratoria, L. vannamei, and M. nipponense at the whole-genome level. Our findings reveal that O. oratoria possesses 50 IR genes, while L. vannamei has 28, and M. nipponense exhibits 74 IR genes. There are obvious differences in the number of IR genes among different species. These differences likely stem from gene duplication or loss events, selective pressures imposed by diverse ecological niches, and functional constraints, which result in some gene subtypes being more conserved than others.
The amino acid length of the OratIR gene family ranges from 375 to 1882 aa, with a theoretical pI between 4.0 and 9.4, and the acidic proteins constitute 68% of this family, suggesting that OratIR proteins are enriched in acidic amino acids and possess the potential to function effectively in acidic subcellular environments. This finding is analogous to observations made regarding Gynaephora qinghaiensis [67]. In the study, the markedly higher proportion of hydrophilic proteins (63%) among OratIRs indicates their strong hydrophilicity. As receptors for sensing water-soluble compounds, this hydrophilic structure enables them to interact effectively with non-volatile compounds dissolved in water [15]. This characteristic aligns with the functional traits of the aquatic ancestors of protostomes, which preferentially recognize water-soluble hydrophilic acids and amines through IRs [24,68]. Therefore, the differences in amino acid length, pI, and other characteristics among different subfamilies of OratIRs may be closely related to the diversity of their gene functions. Subcellular localization prediction results indicate that most OratIR genes are predominantly located on the plasma membrane, which is consistent with the characteristics of IRs as variants within the iGluR subfamily. iGluRs detect external chemical signals by regulating cation flow across the plasma membrane, thereby influencing cells’ intrinsic physiological states [13,15]. It can be preliminarily inferred that the 35 IR genes situated on the plasma membrane serve as crucial components involved in recognizing and transmitting odor molecules, and those located within the endoplasmic reticulum, mitochondria, and vacuoles may be associated with material transport and synthesis.
Through chromosome localization analysis, OratIRs were found to be distributed across multiple chromosomes. This study identified six groups of tandemly repeated genes on chromosomes 11, 14, 24, and 30, as well as on scaffold 87. Notably, among these, the gene duplication events of IR40a and IR75 have also been similarly reported in arthropods [31,35,60,69,70,71]. Additionally, IR75 was found to be responsive to various acidic compounds [15,60]. Gene duplication serves as a crucial evolutionary mechanism, supplying new genetic material that can lead to novel gene functions through processes such as subfunctionalization or neofunctionalization [72,73]. These expanded gene families may facilitate the identification of similar chemical substances and enhance their differentiation [16]. Using FISH, we found that OratIR75-1 and OratIR8a are co-expressed in the antenna tissue of O. oratoria; similar findings in Agrotis segetum, where AsegIR75p/q and AsegIR8a were localized in the basal sensilla or tricho sensilla [60], suggest that IR genes exhibit polymorphic receptor localization in arthropods.
Through phylogenetic analysis of the IR and iGluR gene families in O. oratoria, the constructed intraspecific phylogenetic tree was divided into two branches. Co-receptor IRs show a close relationship with iGluRs. Specifically, one branch clusters IR25a, IR8a, and non-NMDA iGluRs together. This finding aligns with previous studies suggesting that IRs may share a common evolutionary origin with AMPA or Kainate receptors within the non-NMDA iGluRs [15,16]. On the other hand, the tuning IRs subfamily, which makes up a relatively large proportion, can be further split into three branches, including various conserved tuning IRs reported in previous studies [31,35]. Interspecies phylogenetic analysis revealed that the phylogenetic tree is also divided into two branches. Among different species, the gene subtypes of IRs and iGluRs cluster separately. The separate clustering of genes of each subfamily of iGluRs (including NMDA iGluRs and non-NMDA iGluRs) and IRs (including co-receptor IRs and tuning IRs) indicates that the divergence of the IR gene family occurred before the divergence of O. oratoria, L. vannamei, and M. nipponense.
Gene structure analysis demonstrated substantial variations in the number and positioning of introns and exons. The maximum and minimum numbers of exons and introns are both observed in tuning IRs, which display greater diversity, while co-receptor IRs remain relatively conserved, akin to Heliconius butterflies [74]. This architectural diversity may drive gene family evolution, endowing genes with novel functions and enhancing crustacean adaptability. Through the analysis of conserved structural domains, tuning IRs show a high degree of similarity in domain assembly with co-receptor IRs. Most members contain the Lig_chan and Lig_chan-Glu_bd superfamilies structure, aligning with characteristics typical of the conserved ligand-gated ion channel domains shared by iGluRs and IRs, thus maintaining their core functions [15]. Among these, the Lig_chan-Glu_bd superfamily possesses the ability to facilitate precise ligand binding and trigger conformational changes in the ion channel upon ligand interaction, thereby activating the channel [18,75]. However, some members exhibit structural diversity; for instance, OratIR25a possesses an additional ANF_receptor structural domain involved in assembling iGluR subunits and binding cofactors [76]. OratIR11918 contains PBP2, which can efficiently capture specific chemical ligands and synergistically interact with transmembrane transport complexes to facilitate substance transport across membranes [18,77]. Results from secondary structure prediction reveal that OratIR proteins are predominantly characterized by random coils and alpha helices, akin to G. qinghaiensis [67]. The random coil conformation exhibits inherent flexibility, while the spatial structures of alpha helices demonstrate enhanced stability [78]. Furthermore, variations in tertiary structure among different proteins indicate that both similarities and differences in spatial configuration may play an important role in contributing to functional diversity.
Protein–protein interaction analysis revealed that OratIR25a, OratIR07629, and OratIR14286 serve as pivotal nodes in protein interactions, all engaging with the proteins OratIR93a, Ir40a, Ir64a, and Ir76b. Among these genes, IR25a functions as a core receptor that collaborates with multiple partners. Research conducted in Drosophila has demonstrated that the roles of IRs extend beyond olfaction to include sensory processes such as temperature sensing, humidity detection, and taste perception [79]; within the protein–protein interaction (PPI) network, OratIR14286 corresponds to the IR21a gene in Drosophila, and the protein it encodes is a component of the antennal neural sensory system, participating in the environmental temperature response. It has been demonstrated that IR25a works in concert with IR21a and IR93a to modulate the physiological response of Drosophila to cold temperatures [17,26]. On the other hand, OratIR07629 corresponds to the IR8a gene in Drosophila. The IR8a gene encodes an ionotropic receptor family member that functions as an auxiliary receptor for detecting organic acids. Studies have shown that IR64a and IR8a form a functional ligand-gated ion channel that mediates Drosophila’s response to acidic chemicals (e.g., acetic acid, propionic acid, butyric acid). Specifically, while IR64a primarily detects acidic odors, it is regulated by IR8a, which ensures proper protein levels and transport for optimal function. Both receptors are co-expressed within specific neurons of Drosophila, where they jointly modulate physiological and behavioral responses to acidic environments [58,80]. IR93a is co-expressed with both IR25a and IR40a in the sacculus neurons of the antennae and contributes substantially to humidity sensing (hygrosensation). In particular, IR40a plays a primary role in detecting humidity by discerning dry air from variations in moisture levels [27,28,81]. Additionally, IR76b acts as a co-receptor alongside IR25a for perceiving acidic substances while also being involved in detecting other chemicals such as low salt concentrations and amino acids. Furthermore, these receptor complexes play an essential role in guiding Drosophila’s selection of acidic environments for oviposition [82,83,84,85]. In summary, OratIR25a, OratIR07629, and OratIR14286 play essential roles in coordinating the organism’s perception of temperature fluctuations, humidity changes, and organic acids, as well as its behavioral responses.

5. Conclusions

This study explores the Ionotropic Receptors (IRs), a less-researched chemosensory gene family in stomatopods. Based on the whole-genome data of O. oratoria, 50 IR genes were identified and classified into two subfamilies: co-receptor IRs and tuning IRs. Members of the same subfamily exhibited similar conserved motifs and domains. Through comparative analysis, the expansion and evolutionary diversification of IR genes in O. oratoria, L. vannamei, and M. nipponense were revealed. Phylogenetic analysis indicated that co-receptor IRs were highly conserved among the three crustaceans. However, many tandem repeat genes were found in the tuning IRs subfamily, among which OratIR40a was the most abundant in number. The OratIRs show strong hydrophilicity, enabling them to interact with non-volatile compounds in water. Through analysis of the protein interaction network, it was found that OratIR25a, OratIR07629, and OratIR14286 play an important role in the perception of temperature and acidic odors. OratIR75-1 was co-expressed with OratIR8a in the antenna tissue of O. oratoria, as detected by FISH. These findings deepen our understanding of the chemical sensory system in O. oratoria and provide a valuable reference for further exploring the evolution and function of IR genes.

Supplementary Materials

The following supporting information can be downloaded at: https://www.mdpi.com/article/10.3390/ani15060852/s1, Supplementary Figure S1. Sequence logos for the conserved motifs of the OratIRs, Supplementary Figure S2. The three-dimensional structure prediction of the OratIRs; Supplementary Table S1. IR/iGluR Protein Sequence IDs, Supplementary Table S2. Sequence list of the IR genes identified from O. oratoria, L. vannamei, and M. nipponense genomes, Supplementary Table S3. Location of the OratIRs in tandem duplications, Supplementary Table S4. Protein interactions of OratIRs with Drosophila as a model, Supplementary Table S5. String interaction annotations of OratIRs with Drosophila as a model.

Author Contributions

Conceptualization, C.-J.Y. and H.-B.Z.; Data curation, W.-Q.Y. and G.D.; Formal analysis, W.-Q.Y. and G.D.; Funding acquisition, H.-B.Z., B.-P.T., G.W. and D.-Z.Z.; Investigation, L.-L.W., Q.-N.L. and S.-H.J.; Methodology, L.-L.W. and Q.-N.L.; Project administration, G.W. and D.-Z.Z.; Resources, H.-B.Z. and S.-H.J.; Software, C.-J.Y.; Supervision, Q.-N.L. and B.-P.T.; Validation, H.-Y.W.; Visualization, H.-Y.W.; Writing—original draft, W.-Q.Y.; Writing—review and editing, G.D. All authors have read and agreed to the published version of the manuscript.

Funding

This work was supported by the National Natural Science Foundation of China (Grant No. 32070526).

Institutional Review Board Statement

Our research subject, Oratosquilla oratoria, is a common edible aquaculture species in China. Previous research on this species has not involved animal ethics issues. Nonetheless, throughout the experimental process, all handling and use of samples strictly adhered to the guidelines outlined in the “Guidelines for the Review of Animal Welfare and Ethics in China”, issued by the Animal Ethics and Welfare Committee of the Chinese Association for Laboratory Animal Sciences.

Informed Consent Statement

Not applicable.

Data Availability Statement

The genomic datasets used in this study are publicly available from the National Center for Biotechnology Information (NCBI) database under the following accession numbers: Oratosquilla oratoria (GCA_046742065.1), Litopenaeus vannamei (GCA_003789085.1), and Macrobrachium nipponense (GCA_015104395.1).

Acknowledgments

All individuals included in this section have consented to the acknowledgement.

Conflicts of Interest

The authors declare that they have no conflicts of interest.

References

  1. Chivers, D.P.; Brown, G.E.; Smith, R.J.F. The Evolution of Chemical Alarm Signals: Attracting Predators Benefits Alarm Signal Senders. Am. Nat. 1996, 148, 649–659. [Google Scholar] [CrossRef]
  2. Derby, C.D. Learning from Spiny Lobsters about Chemosensory Coding of Mixtures. Physiol. Behav. 2000, 69, 203–209. [Google Scholar] [CrossRef]
  3. Harzsch, S.; Krieger, J. Crustacean Olfactory Systems: A Comparative Review and a Crustacean Perspective on Olfaction in Insects. Prog. Neurobiol. 2018, 161, 23–60. [Google Scholar] [CrossRef]
  4. Derby, C.D. Structure and Function of Cuticular Sensilla of the Lobster Homarus americanus. J. Crustac. Biol. 1982, 2, 1–21. [Google Scholar] [CrossRef]
  5. Wyatt, T.D. Fifty Years of Pheromones. Nature 2009, 457, 262–263. [Google Scholar] [CrossRef]
  6. Su, C.Y.; Menuz, K.; Carlson, J.R. Olfactory Perception: Receptors, Cells, and Circuits. Cell 2009, 139, 45–59. [Google Scholar] [CrossRef]
  7. Atema, J. Chemical Signals in the Marine Environment: Dispersal, Detection, and Temporal Signal Analysis. Proc. Natl. Acad. Sci. USA 1995, 92, 62–66. [Google Scholar] [CrossRef]
  8. Joseph, R.M.; Carlson, J.R. Drosophila Chemoreceptors: A Molecular Interface between the Chemical World and the Brain. Trends Genet. 2015, 31, 683–695. [Google Scholar] [CrossRef]
  9. Kamio, M.; Derby, C.D. Finding Food: How Marine Invertebrates Use Chemical Cues to Track and Select Food. Nat. Prod. Rep. 2017, 34, 514–528. [Google Scholar] [CrossRef]
  10. Bhandawat, V.; Reisert, J.; Yau, K.W. Elementary Response of Olfactory Receptor Neurons to Odorants. Science 2005, 308, 1931–1934. [Google Scholar] [CrossRef]
  11. Fulton, K.A.; Zimmerman, D.; Samuel, A.; Vogt, K.; Datta, S.R. Common Principles for Odour Coding across Vertebrates and Invertebrates. Nat. Rev. Neurosci. 2024, 25, 453–472. [Google Scholar] [CrossRef]
  12. Touhara, K.; Vosshall, L.B. Sensing Odorants and Pheromones with Chemosensory Receptors. Annu. Rev. Physiol. 2009, 71, 307–332. [Google Scholar] [CrossRef]
  13. Abuin, L.; Bargeton, B.; Ulbrich, M.H.; Isacoff, E.Y.; Kellenberger, S.; Benton, R. Functional Architecture of Olfactory Ionotropic Glutamate Receptors. Neuron 2011, 69, 44–60. [Google Scholar] [CrossRef]
  14. Benton, R.; Vannice, K.S.; Gomez-Diaz, C.; Vosshall, L.B. Variant Ionotropic Glutamate Receptors as Chemosensory Receptors in Drosophila. Cell 2009, 136, 149–162. [Google Scholar] [CrossRef]
  15. Croset, V.; Rytz, R.; Cummins, S.F.; Budd, A.; Brawand, D.; Kaessmann, H.; Gibson, T.J.; Benton, R. Ancient Protostome Origin of Chemosensory Ionotropic Glutamate Receptors and the Evolution of Insect Taste and Olfaction. PLoS Genet. 2010, 6, e1001064. [Google Scholar] [CrossRef]
  16. Rytz, R.; Croset, V.; Benton, R. Ionotropic Receptors (IRs): Chemosensory Ionotropic Glutamate Receptors in Drosophila and Beyond. Insect Biochem. Mol. Biol. 2013, 43, 888–897. [Google Scholar] [CrossRef]
  17. Chen, C.; Buhl, E.; Xu, M.; Croset, V.; Rees, J.S.; Lilley, K.S.; Benton, R.; Hodge, J.J.L.; Stanewsky, R. Drosophila Ionotropic Receptor 25a Mediates Circadian Clock Resetting by Temperature. Nature 2015, 527, 516–520. [Google Scholar] [CrossRef]
  18. Mayer, M.L. Glutamate Receptors at Atomic Resolution. Nature 2006, 440, 456–462. [Google Scholar] [CrossRef]
  19. Fleischer, J.; Pregitzer, P.; Breer, H.; Krieger, J. Access to the Odor World: Olfactory Receptors and Their Role for Signal Transduction in Insects. Cell Mol. Life Sci. 2017, 75, 485–508. [Google Scholar] [CrossRef]
  20. Abuin, L.; Prieto-Godino, L.L.; Pan, H.; Gutierrez, C.; Huang, L.; Jin, R.; Benton, R. In Vivo Assembly and Trafficking of Olfactory Ionotropic Receptors. BMC Biol. 2019, 17, 34. [Google Scholar] [CrossRef]
  21. van Giesen, L.; Garrity, P.A. More than Meets the IR: The Expanding Roles of Variant Ionotropic Glutamate Receptors in Sensing Odor, Taste, Temperature and Moisture. F1000Research 2017, 6, 1753. [Google Scholar] [CrossRef] [PubMed]
  22. Robertson, H.M. Molecular Evolution of the Major Arthropod Chemoreceptor Gene Families. Annu. Rev. Entomol. 2019, 64, 227–242. [Google Scholar] [CrossRef]
  23. Sánchez-Alcañiz, J.A.; Silbering, A.F.; Croset, V.; Zappia, G.; Sivasubramaniam, A.K.; Abuin, L.; Sahai, S.Y.; Münch, D.; Steck, K.; Auer, T.O.; et al. An Expression Atlas of Variant Ionotropic Glutamate Receptors Identifies a Molecular Basis of Carbonation Sensing. Nat. Commun. 2018, 9, 4252. [Google Scholar] [CrossRef] [PubMed]
  24. Silbering, A.F.; Rytz, R.; Grosjean, Y.; Abuin, L.; Ramdya, P.; Jefferis, G.S.; Benton, R. Complementary Function and Integrated Wiring of the Evolutionarily Distinct Drosophila Olfactory Subsystems. J. Neurosci. 2011, 31, 13357–13375. [Google Scholar] [CrossRef]
  25. Wicher, D.; Miazzi, F. Functional Properties of Insect Olfactory Receptors: Ionotropic Receptors and Odorant Receptors. Cell Tissue Res. 2021, 383, 7–19. [Google Scholar] [CrossRef]
  26. Ni, L.; Klein, M.; Svec, K.V.; Budelli, G.; Chang, E.C.; Ferrer, A.J.; Benton, R.; Samuel, A.D.; Garrity, P.A. The Ionotropic Receptors IR21a and IR25a Mediate Cool Sensing in Drosophila. eLife 2016, 5, e13254. [Google Scholar] [CrossRef]
  27. Enjin, A.; Zaharieva, E.E.; Frank, D.D.; Mansourian, S.; Suh, G.S.; Gallio, M.; Stensmyr, M.C. Humidity Sensing in Drosophila. Curr. Biol. 2016, 26, 1352–1358. [Google Scholar] [CrossRef]
  28. Knecht, Z.A.; Silbering, A.F.; Ni, L.; Klein, M.; Budelli, G.; Bell, R.; Abuin, L.; Ferrer, A.J.; Samuel, A.D.; Benton, R.; et al. Distinct Combinations of Variant Ionotropic Glutamate Receptors Mediate Thermosensation and Hygrosensation in Drosophila. eLife 2016, 5, e17879. [Google Scholar] [CrossRef]
  29. Knecht, Z.A.; Silbering, A.F.; Cruz, J.; Yang, L.; Croset, V.; Benton, R.; Garrity, P.A. Ionotropic Receptor-Dependent Moist and Dry Cells Control Hygrosensation in Drosophila. eLife 2017, 6, e26654. [Google Scholar] [CrossRef]
  30. Groh, K.C.; Vogel, H.; Stensmyr, M.C.; Grosse-Wilde, E.; Hansson, B.S. The Hermit Crab’s Nose—Antennal Transcriptomics. Front. Neurosci. 2014, 7, 266. [Google Scholar] [CrossRef]
  31. Kozma, M.T.; Schmidt, M.; Ngo-Vu, H.; Sparks, S.D.; Senatore, A.; Derby, C.D. Chemoreceptor Proteins in the Caribbean Spiny Lobster, Panulirus argus: Expression of Ionotropic Receptors, Gustatory Receptors, and TRP Channels in Two Chemosensory Organs and Brain. PLoS ONE 2018, 13, e0203935. [Google Scholar] [CrossRef]
  32. Kozma, M.T.; Ngo-Vu, H.; Rump, M.T.; Bobkov, Y.V.; Ache, B.W.; Derby, C.D. Single Cell Transcriptomes Reveal Expression Patterns of Chemoreceptor Genes in Olfactory Sensory Neurons of the Caribbean Spiny Lobster, Panulirus argus. BMC Genom. 2020, 21, 649. [Google Scholar] [CrossRef]
  33. Kelly, T.R.; Fitzgibbon, Q.P.; Smith, G.G.; Banks, T.M.; Ventura, T. Tropical Rock Lobster (Panulirus ornatus) Uses Chemoreception via the Antennular Lateral Flagellum to Identify Conspecific Ecdysis. Sci. Rep. 2023, 13, 12409. [Google Scholar] [CrossRef]
  34. Shen, C.; Tang, D.; Zhang, Y.; Wu, L.; Luo, Y.; Tang, B.; Wang, Z. Identification of Putative Ingestion-Related Olfactory Receptor Genes in the Chinese Mitten Crab (Eriocheir Japonica Sinensis). Genes. Genom. 2021, 43, 479–490. [Google Scholar] [CrossRef]
  35. Kozma, M.T.; Ngo-Vu, H.; Wong, Y.Y.; Shukla, N.S.; Pawar, S.D.; Senatore, A.; Schmidt, M.; Derby, C.D. Comparison of Transcriptomes from Two Chemosensory Organs in Four Decapod Crustaceans Reveals Hundreds of Candidate Chemoreceptor Proteins. PLoS ONE 2020, 15, e0230266. [Google Scholar] [CrossRef]
  36. Maynou, F.; Abelló, P.; Sartor, P. A Review of the Fisheries Biology of the Mantis Shrimp, Squilla Mantis (L., 1758) (Stomatopoda, Squillidae) in the Mediterranean. Crustaceana 2004, 77, 1081–1099. [Google Scholar] [CrossRef]
  37. Kodama, K.; Oyama, M.; Lee, J.; Akaba, Y.; Tajima, Y.; Shimizu, T.; Shiraishi, H.; Horiguchi, T. Interannual Variation in Quantitative Relationships among Egg Production and Densities of Larvae and Juveniles of the Japanese Mantis Shrimp Oratosquilla oratoria in Tokyo Bay, Japan. Fish. Sci. 2009, 75, 875–886. [Google Scholar] [CrossRef]
  38. Lou, F.; Gao, T.; Han, Z. Effect of Salinity Fluctuation on the Transcriptome of the Japanese Mantis Shrimp Oratosquilla oratoria. Int. J. Biol. Macromol. 2019, 140, 1202–1213. [Google Scholar] [CrossRef]
  39. Sun, X.; Wang, G.; Yang, J.; Yu, W.; Xu, J.; Tang, B.; Ding, G.; Zhang, D. Whole Genome Evaluation Analysis and Preliminary Assembly of Oratosquilla oratoria (Stomatopoda: Squillidae). Mol. Biol. Rep. 2023, 50, 4165–4173. [Google Scholar] [CrossRef]
  40. Luo, F.; Zhou, J.; Celia, S.; Wang, L.; Tang, Y.; Han, Z.; Kang, B. How Oratosquilla oratoria Compound Eye Response to the Polarization of Light: In the Perspective of Vision Genes and Related Proteins. Int. J. Biol. Macromol. 2024, 259, 129053. [Google Scholar] [CrossRef]
  41. Zhang, D.; Ding, G.; Ge, B.; Zhang, H.; Tang, B. Development and Characterization of Microsatellite Loci of Oratosquilla oratoria (Crustacea: Squillidae). Conserv. Genet. Resour. 2012, 4, 147–150. [Google Scholar] [CrossRef]
  42. Zhang, D.; Ding, G.; Ge, B.; Zhang, H.; Tang, B.; Yang, G. Comparative Phylogeography of Two Marine Species of Crustacean: Recent Divergence and Expansion Due to Environmental Changes. Gene 2014, 550, 141–147. [Google Scholar] [CrossRef]
  43. Lou, F.; Gao, T.; Cai, S.; Han, Z. De Novo Assembly and Annotation of the Whole Transcriptome of Oratosquilla oratoria. Mar. Genom. 2018, 38, 17–20. [Google Scholar] [CrossRef]
  44. Jia, B.; Chen, J.; Yang, G.; Bi, J.; Guo, J.; Shang, K.; Wang, S.; Wu, Z.; Zhang, K. Improvement of Solubility, Gelation and Emulsifying Properties of Myofibrillar Protein from Mantis Shrimp (Oratosquilla oratoria) by Phosphorylation Modification under Low Ionic Strength of KCl. Food Chem. 2023, 403, 134497. [Google Scholar] [CrossRef] [PubMed]
  45. Cheng, J.; Sha, Z.-l. Cryptic Diversity in the Japanese Mantis Shrimp Oratosquilla oratoria (Crustacea: Squillidae): Allopatric Diversification, Secondary Contact and Hybridization. Sci. Rep. 2017, 7, 1972. [Google Scholar] [CrossRef]
  46. Zhang, D.; Sun, X.; Chen, L.; Lin, L.; Yin, C.; Yang, W.; Liu, J.; Liu, Q.; Zhang, H.; Jiang, S.; et al. The Chromosome-Level Genome Provides Insights into the Adaptive Evolution of the Visual System in Oratosquilla oratoria. BMC Biol. 2025, 23, 38. [Google Scholar] [CrossRef]
  47. Zhang, X.; Yuan, J.; Sun, Y.; Li, S.; Gao, Y.; Yu, Y.; Liu, C.; Wang, Q.; Lv, X.; Zhang, X.; et al. Penaeid Shrimp Genome Provides Insights into Benthic Adaptation and Frequent Molting. Nat. Commun. 2019, 10, 356. [Google Scholar] [CrossRef] [PubMed]
  48. Jin, S.; Bian, C.; Jiang, S.; Han, K.; Xiong, Y.; Zhang, W.; Shi, C.; Qiao, H.; Gao, Z.; Li, R.; et al. A Chromosome-Level Genome Assembly of the Oriental River Prawn, Macrobrachium nipponense. Gigascience 2021, 10, giaa160. [Google Scholar] [CrossRef]
  49. Altschul, S.F.; Gish, W.; Miller, W.; Myers, E.W.; Lipman, D.J. Basic Local Alignment Search Tool. J. Mol. Biol. 1990, 215, 403–410. [Google Scholar] [CrossRef]
  50. Chen, C.; Chen, H.; Zhang, Y.; Thomas, H.R.; Frank, M.H.; He, Y.; Xia, R. TBtools: An Integrative Toolkit Developed for Interactive Analyses of Big Biological Data. Mol. Plant 2020, 13, 1194–1202. [Google Scholar] [CrossRef]
  51. Duvaud, S.; Gabella, C.; Lisacek, F.; Stockinger, H.; Ioannidis, V.; Durinx, C. Expasy, the Swiss Bioinformatics Resource Portal, as Designed by Its Users. Nucleic Acids Res. 2021, 49, W216–W227. [Google Scholar] [CrossRef] [PubMed]
  52. Tamura, K.; Stecher, G.; Kumar, S. MEGA11: Molecular Evolutionary Genetics Analysis Version 11. Mol. Biol. Evol. 2021, 38, 3022–3027. [Google Scholar] [CrossRef]
  53. Letunic, I.; Bork, P. Interactive Tree of Life (iTOL) v6: Recent Updates to the Phylogenetic Tree Display and Annotation Tool. Nucleic Acids Res. 2024, 52, W78–W82. [Google Scholar] [CrossRef]
  54. Bailey, T.L.; Boden, M.; Buske, F.A.; Frith, M.; Grant, C.E.; Clementi, L.; Ren, J.; Li, W.W.; Noble, W.S. MEME Suite: Tools for Motif Discovery and Searching. Nucleic Acids Res. 2009, 37, W202–W208. [Google Scholar] [CrossRef] [PubMed]
  55. Hu, B.; Jin, J.; Guo, A.Y.; Zhang, H.; Luo, J.; Gao, G. GSDS 2.0: An Upgraded Gene Feature Visualization Server. Bioinformatics 2015, 31, 1296–1297. [Google Scholar] [CrossRef] [PubMed]
  56. Marchler-Bauer, A.; Bo, Y.; Han, L.; He, J.; Lanczycki, C.J.; Lu, S.; Chitsaz, F.; Derbyshire, M.K.; Geer, R.C.; Gonzales, N.R.; et al. CDD/SPARCLE: Functional Classification of Proteins via Subfamily Domain Architectures. Nucleic Acids Res. 2017, 45, D200–D203. [Google Scholar] [CrossRef]
  57. Livak, K.J.; Schmittgen, T.D. Analysis of Relative Gene Expression Data Using Real-Time Quantitative PCR and the 2−ΔΔCT Method. Methods 2001, 25, 402–408. [Google Scholar] [CrossRef]
  58. Ai, M.; Blais, S.; Park, J.; Min, S.; Neubert, T.A.; Suh, G.S.B. Ionotropic Glutamate Receptors IR64a and IR8a Form a Functional Odorant Receptor Complex In Vivo in Drosophila. J. Neurosci. 2013, 33, 10741–10749. [Google Scholar] [CrossRef]
  59. Tang, R.; Jiang, N.-J.; Ning, C.; Li, G.-C.; Huang, L.-Q.; Wang, C.-Z. The Olfactory Reception of Acetic Acid and Ionotropic Receptors in the Oriental Armyworm, Mythimna separata Walker. Insect Biochem. Mol. Biol. 2020, 118, 103312. [Google Scholar] [CrossRef]
  60. Hou, X.Q.; Zhang, D.D.; Powell, D.; Wang, H.L.; Andersson, M.N.; Löfstedt, C. Ionotropic Receptors in the Turnip Moth Agrotis segetum Respond to Repellent Medium-Chain Fatty Acids. BMC Biol. 2022, 20, 34. [Google Scholar] [CrossRef]
  61. Ache, B.W.; Young, J.M. Olfaction: Diverse Species, Conserved Principles. Neuron 2005, 48, 417–430. [Google Scholar] [CrossRef] [PubMed]
  62. Hansson, B.S.; Stensmyr, M.C. Evolution of Insect Olfaction. Neuron 2011, 72, 698–711. [Google Scholar] [CrossRef]
  63. Koehl, M.A.; Koseff, J.R.; Crimaldi, J.P.; McCay, M.G.; Cooper, T.; Wiley, M.B.; Moore, P.A. Lobster Sniffing: Antennule Design and Hydrodynamic Filtering of Information in an Odor Plume. Science 2001, 294, 1948–1951. [Google Scholar] [CrossRef]
  64. Corey, E.A.; Bobkov, Y.; Ukhanov, K.; Ache, B.W. Ionotropic Crustacean Olfactory Receptors. PLoS ONE 2013, 8, e60551. [Google Scholar] [CrossRef] [PubMed]
  65. Groh-Lunow, K.C.; Getahun, M.N.; Grosse-Wilde, E.; Hansson, B.S. Expression of Ionotropic Receptors in Terrestrial Hermit Crab’s Olfactory Sensory Neurons. Front. Cell Neurosci. 2015, 8, 448. [Google Scholar] [CrossRef]
  66. Zhao, M.; Wang, W.; Zhang, F.; Ma, C.; Liu, Z.; Yang, M.H.; Chen, W.; Li, Q.; Cui, M.; Jiang, K.; et al. A Chromosome-Level Genome of the Mud Crab (Scylla paramamosain Estampador) Provides Insights into the Evolution of Chemical and Light Perception in This Crustacean. Mol. Ecol. Resour. 2021, 21, 1299–1317. [Google Scholar] [CrossRef]
  67. Liu, Z.; Kou, G.; Nan, Y.; Wang, K.; Zhou, Y. Identification and Expression Profiling of Ionotropic receptors Gene in Gynaephora qinghaiensis (Lepidoptera: Lymantriidae). Acta Agrestia Sin. 2024, 32, 1382–1400. [Google Scholar] [CrossRef]
  68. Derby, C.D.; Sorensen, P.W. Neural Processing, Perception, and Behavioral Responses to Natural Chemical Stimuli by Fish and Crustaceans. J. Chem. Ecol. 2008, 34, 898–914. [Google Scholar] [CrossRef] [PubMed]
  69. Liu, N.Y.; Xu, W.; Dong, S.L.; Zhu, J.Y.; Xu, Y.X.; Anderson, A. Genome-Wide Analysis of Ionotropic Receptor Gene Repertoire in Lepidoptera with an Emphasis on Its Functions of Helicoverpa armigera. Insect Biochem. Mol. Biol. 2018, 99, 37–53. [Google Scholar] [CrossRef]
  70. Wang, T.T.; Si, F.L.; He, Z.B.; Chen, B. Genome-Wide Identification, Characterization and Classification of Ionotropic Glutamate Receptor Genes (iGluRs) in the Malaria Vector Anopheles sinensis (Diptera: Culicidae). Parasites Vectors 2018, 11, 34. [Google Scholar] [CrossRef]
  71. Biswas, T.; Vogel, H.; Biedermann, P.H.W.; Lehenberger, M.; Yuvaraj, J.K.; Andersson, M.N. Few Chemoreceptor Genes in the Ambrosia Beetle Trypodendron lineatum May Reflect Its Specialized Ecology. BMC Genom. 2024, 25, 764. [Google Scholar] [CrossRef] [PubMed]
  72. Moleirinho, A.; Carneiro, J.; Matthiesen, R.; Silva, R.M.; Amorim, A.; Azevedo, L. Gains, Losses and Changes of Function after Gene Duplication: Study of the Metallothionein Family. PLoS ONE 2011, 6, e18487. [Google Scholar] [CrossRef]
  73. Crow, K.D.; Wagner, G.P. What Is the Role of Genome Duplication in the Evolution of Complexity and Diversity? Mol. Biol. Evol. 2006, 23, 887–892. [Google Scholar] [CrossRef]
  74. van Schooten, B.; Jiggins, C.D.; Briscoe, A.D.; Papa, R. Genome-Wide Analysis of Ionotropic Receptors Provides Insight into Their Evolution in Heliconius butterflies. BMC Genom. 2016, 17, 254. [Google Scholar] [CrossRef] [PubMed]
  75. Sobolevsky, A.I.; Rosconi, M.P.; Gouaux, E. X-Ray Structure of AMPA-Subtype Glutamate Receptor: Symmetry and Mechanism. Nature 2009, 462, 745–756. [Google Scholar] [CrossRef] [PubMed]
  76. Jin, R.; Singh, S.K.; Gu, S.; Furukawa, H.; Sobolevsky, A.I.; Zhou, J.; Jin, Y.; Gouaux, E. Crystal Structure and Association Behaviour of the GluR2 Amino-Terminal Domain. EMBO J. 2009, 28, 1812–1823. [Google Scholar] [CrossRef]
  77. Mayer, M.L.; Armstrong, N. Structure and Function of Glutamate Receptor Ion Channels. Annu. Rev. Physiol. 2004, 66, 161–181. [Google Scholar] [CrossRef]
  78. Liu, J.W. Bioinformatics Analysis of Structure and Function of OATP1B1 Protein. Mol. Plant Breed. 2023, 21, 2230–2235. [Google Scholar] [CrossRef]
  79. Rimal, S.; Lee, Y. The Multidimensional Ionotropic Receptors of Drosophila melanogaster. Insect Mol. Biol. 2018, 27, 1–7. [Google Scholar] [CrossRef]
  80. Ai, M.; Min, S.; Grosjean, Y.; Leblanc, C.; Bell, R.; Benton, R.; Suh, G.S.B. Acid Sensing by the Drosophila Olfactory System. Nature 2010, 468, 691–695. [Google Scholar] [CrossRef]
  81. Koh, T.; He, Z.; Gorur-Shandilya, S.; Menuz, K.; Larter, N.K.; Stewart, S.; Carlson, J.R. The Drosophila IR20a Clade of Ionotropic Receptors Are Candidate Taste and Pheromone Receptors. Neuron 2014, 83, 850–865. [Google Scholar] [CrossRef] [PubMed]
  82. Zhang, Y.V.; Ni, J.; Montell, C. The Molecular Basis for Attractive Salt Taste Coding in Drosophila. Science 2013, 340, 1334–1338. [Google Scholar] [CrossRef] [PubMed]
  83. Hussain, A.; Zhang, M.; Üçpunar, H.K.; Svensson, T.; Quillery, E.; Gompel, N.; Ignell, R.; Grunwald Kadow, I.C. Ionotropic Chemosensory Receptors Mediate the Taste and Smell of Polyamines. PLoS Biol. 2016, 14, e1002454. [Google Scholar] [CrossRef]
  84. Ganguly, A.; Pang, L.; Duong, V.K.; Lee, A.; Schoniger, H.; Varady, E.; Dahanukar, A. A Molecular and Cellular Context-Dependent Role for Ir76b in Detection of Amino Acid Taste. Cell Rep. 2017, 18, 737–750. [Google Scholar] [CrossRef]
  85. Chen, Y.; Amrein, H. Ionotropic Receptors Mediate Drosophila Oviposition Preference through Sour Gustatory Receptor Neurons. Curr. Biol. 2017, 27, 2741–2750.e4. [Google Scholar] [CrossRef] [PubMed]
Figure 1. Chromosome location analysis of OratIRs. The black scale on the left represents the position, with column length representing chromosome size, and blue lines within the columns representing gene density on the chromosomes.
Animals 15 00852 g001
Figure 2. Phylogenetic tree. (A) Maximum-likelihood phylogenetic tree of IRs and iGluRs from O. oratoria. Different background colors represent different subfamilies: clades with NMDA iGluRs are colored red (lines are red); clades with non-NMDA iGluRs are colored green (lines are blue); clades with co-receptor IRs are colored blue (lines are green and purple); clades with tuning IRs are colored purple (lines are purple). (B) Maximum-likelihood phylogenetic tree of IRs and iGluRs from O. oratoria, L. vannamei, and M. nipponense. Clades with NMDA iGluRs are colored purple; clades with non-NMDA iGluRs are colored red; clades with co-receptor IRs are colored green; clades with tuning IRs are colored yellow. The outer circle in different colors represents subfamilies of iGluRs and IRs, with red indicating iGluRs and blue indicating IRs (lines: red for iGluRs, blue for IRs). iGluRs, ionotropic glutamate receptors; IRs, ionotropic receptors.
Animals 15 00852 g002
Figure 3. Phylogenetic relationships, conserved motifs, and gene structures of the OratIRs. (A) Phylogenetic relationships of the OratIRs. Red denotes iGluRs, and blue denotes IRs. (B) Conserved motifs of the OratIRs. Motifs 1 to 8 are marked with different colors. (C) Gene structures of the OratIRs. Blue boxes indicate UTR regions, yellow boxes indicate CDS regions, and black lines represent intron regions.
Animals 15 00852 g003
Figure 4. Phylogenetic relationships and protein domain analysis of the OratIRs. (A) Phylogenetic relationships of the OratIRs. Red denotes iGluRs, and blue denotes IRs. (B) Protein domain of the OratIRs. Different colored boxes represent various protein domain superfamilies.
Animals 15 00852 g004
Figure 5. Protein–protein interactions of OratIRs. Circles with red or orange represent IRs in O. oratoria, blue circles represent IRs in Drosophila, and the size of the circles indicates the number of connected nodes.
Animals 15 00852 g005
Figure 6. The expression of OratIR8a and OratIR75-1 in the antennae of O. oratoria. (A,E) Green fluorescence shows labeling with the OratIR8a probe, scale bar: 40 µm; (B,F) red fluorescence shows labeling with the OratIR75-1 probe, scale bar: 40 µm; (C,G) co-labeling with the OratIR8a probe and the OratIR75-1 probe indicated by yellow-orange fluorescence, scale bar: 40 µm; (D) the entirety of the antennae co-labeled with DAPI (blue) and the OratIR8a probe (green), scale bar: 400 µm; (H) the entirety of the antennae co-labeled with DAPI (blue) and the OratIR75-1 probe (red), scale bar: 400 µm.
Animals 15 00852 g006
Figure 7. Relative expression levels of OratIRs in muscle and antennae tissues. *, p < 0.05; **, p < 0.01; ****, p < 0.0001.
Animals 15 00852 g007
Table 1. Primers used for fluorescence in situ hybridization (FISH) experiments.
Probe NamePrimer Sequence (5′~3′)Usage
OratIR8aCCGTCACTGATTGGTGAAGACAGGOratIR8a in situ hybridization probe utilized FAM (488) fluorochrome for visualization, with the excitation light-emitting green fluorescence.
CTTGATCCAGCTCTGCTTCATTGC
GAGCTGTTTGGGTCATGTCCCTGC
CCAGTGACCACAAGAGCAGCAAC
GGTTGTTCAGCAAAGGGCTCACC
OratIR75-1GGCATCACTCAAAGACTTCGGAGCOratIR75-1 in situ hybridization probe utilized Cy3 fluorochrome for visualization, with the excitation light-emitting red fluorescence.
CGGAGGTGGAGCCCAGTAAGGTTC
GGTGTCGGGAAGTCGACGTACTG
GAGGTTACTCGTGTAGAAGGCCAG
CGTAGGTCCAGGAGAACATCACTG
Each probe is composed of a mixture of five oligonucleotides and is a multi-sequence mixed probe.
Table 2. Primers used for qPCR assays.
Primer NameForward Primer (5′~3′)Reverse Primer (5′~3′)
OratIR76bGTATGGTGGGAATGGTCAATCGTAGTAGGCGTGGGTG
OratIR75-1TCAACTACGGAGCAGGAAGAGAAGAAGGAAGAGGATGG
OratIR1069-1GTGGTGGTGATGATGATGACGTCCTTCTCCTCCTCTT
OratIR02114GATGCTGCTGATGCTACTATGTGAAGGAGGAGGTTGT
OratIR23765AGACTGACCACGACAACGGGGAGTATAAGACCCAAGCACC
β-actinATCGTTCGTGACATTAAGGACAAGGAATGAAGGCTGGAA
Table 3. Physicochemical properties and subcellular localization of the OratIRs.
Gene NameAmino Acid Length (aa)Molecular Weights (kDa)Isoelectric Point (pI)Instability IndexAliphatic IndexGrand Average of Hydropathicity
(GRAVY)
Subcellular Localization
OratIR8a83993.474.939.8482.3−0.182Plasma membrane
OratIR25a976109.734.8839.4383.05−0.178Plasma membrane
OratIR93a49156.155.9138.9881.14−0.117Endoplasmic reticulum
OratIR76b44852.39.0837.1186.14−0.16Golgi
OratIR21a56562.276.5742.43105.880.188Plasma membrane
OratIR40a-163170.845.9150.2992.69−0.208Plasma membrane
OratIR40a-21315151.954.9876.6280.87−0.119Endoplasmic reticulum
OratIR40a-350456.185.4738.5488.810.061Plasma membrane
OratIR40a-457464.065.5736.1104.230.207Plasma membrane
OratIR40a-581893.007.5641.9299.66−0.087Plasma membrane
OratIR40a-683992.984.0027.9883.03−0.553Mitochondrial
OratIR40a-71882219.304.2287.0470.65−0.902Extracellular
OratIR40a-848954.308.6138.4996.670.065Golgi
OratIR68a75285.188.3744.9691.9−0.042Plasma membrane
OratIR75-160468.589.452.1385.91−0.273Golgi
OratIR75-21107127.239.3256.4173.21−0.584Plasma membrane
OratIR1018-147553.497.6343.4597.770.176Plasma membrane
OratIR1018-252858.595.3547.393.410.082Plasma membrane
OratIR102037542.326.3831.3795.760.113Plasma membrane
OratIR1021-141546.318.1842.5891.330.028Plasma membrane
OratIR1021-238142.885.6545.9989.550.021Plasma membrane
OratIR103973383.056.7941.4394.13−0.048Plasma membrane
OratIR106467575.206.4137.3891.41−0.035Endoplasmic reticulum
OratIR106666776.178.3240.395.130.01Plasma membrane
OratIR106772082.018.0144.3791.51−0.137Endoplasmic reticulum
OratIR1069-167576.124.2130.8175.24−0.577Golgi
OratIR1069-267375.485.9235.698.96−0.02Plasma membrane
OratIR0211473983.727.2748.3699.010.017Plasma membrane
OratIR0379640344.048.6333.91106.920.229Plasma membrane
OratIR0402465373.527.6738.5795.93−0.076Plasma membrane
OratIR041681658184.006.6848.1887.22−0.222Plasma membrane
OratIR0735266573.965.9739.3696.030.070Vacuolar
OratIR0762979288.696.3642.3487.37−0.093Plasma membrane
OratIR0869944649.186.3936.0190.47−0.017Plasma membrane
OratIR091051438159.587.4249.8787.20−0.248Plasma membrane
OratIR0924169177.188.9735.37100.850.045Mitochondrial
OratIR1149866275.035.7943.3692.51−0.026Plasma membrane
OratIR1149960968.888.113985.81−0.057Plasma membrane
OratIR1150059166.835.7134.1587.11−0.052Endoplasmic reticulum
OratIR115341130127.384.7772.9168.18−0.756Plasma membrane
OratIR11918929105.236.6243.489.89−0.174Golgi
OratIR1300188497.375.6246.8591.07−0.147Plasma membrane
OratIR1300363371.536.1439.38102.560.089Plasma membrane
OratIR1428663573.695.4243.8889.940.026Endoplasmic reticulum
OratIR1812347453.446.5445.690.46−0.185Plasma membrane
OratIR1894271079.46.6750.7890.01−0.183Plasma membrane
OratIR2284171080.315.3147.5391.46−0.083Plasma membrane
OratIR2284571080.275.3947.691.61−0.081Plasma membrane
OratIR2376550256.356.2435.3490.28−0.034Plasma membrane
OratIR2380250256.36.0835.8590.08−0.027Plasma membrane
Table 4. Summary of two-dimensional structures of the OratIRs.
Gene NameGene IDAlpha Helix (Hh)Extended Strand (Ee)Random Coil (Cc)
OratIR8aOrat_gene07298318/37.90%163/19.43%358/42.67%
OratIR25aOrat_gene16135349/35.76%198/20.29%429/43.95%
OratIR93aOrat_gene16136106/21.59%152/30.96%233/47.45%
OratIR76bOrat_gene21236130/29.02%98/21.88%220/49.11%
OratIR21aOrat_gene17732185/32.74%99/17.52%281/49.73%
OratIR40a-1Orat_gene07733242/38.35%106/16.80%283/44.85%
OratIR40a-2Orat_gene21360161/12.24%145/11.03%1009/76.73%
OratIR40a-3Orat_gene21361151/29.96%121/24.01%232/46.03%
OratIR40a-4Orat_gene21362202/35.19%122/21.25%250/43.55%
OratIR40a-5Orat_gene21363270/33.01%182/22.25%366/44.74%
OratIR40a-6Orat_gene21364234/27.89%163/19.43%442/52.68%
OratIR40a-7Orat_gene21367887/47.13%264/14.03%731/38.84%
OratIR40a-8Orat_gene21368178/36.40%94/19.22%217/44.38%
OratIR68aOrat_gene00368237/31.52%159/21.14%356/47.34%
OratIR75-1Orat_gene17760251/41.56%70/11.59%283/46.85%
OratIR75-2Orat_gene17762337/30.44%195/17.62%575/51.94%
OratIR1018-1Orat_gene29704161/33.89%117/24.63%197/41.47%
OratIR1018-2Orat_gene29705179/33.90%117/22.16%232/43.94%
OratIR1020Orat_gene06678168/44.80%73/19.47%134/35.73%
OratIR1021-1Orat_gene20793114/27.47%100/24.10%201/48.43%
OratIR1021-2Orat_gene20797137/35.96%75/19.69%169/44.36%
OratIR1039Orat_gene07724237/32.33%138/18.83%358/48.84%
OratIR1064Orat_gene06913207/30.67%131/19.41%337/49.93%
OratIR1066Orat_gene18414241/36.13%151/22.64%275/41.23%
OratIR1067Orat_gene09232239/33.19%166/23.06%315/43.75%
OratIR1069-1Orat_gene09184127/18.81%164/24.30%384/56.89%
OratIR1069-2Orat_gene09189254/37.74%122/18.13%297/44.13%
OratIR02114Orat_gene02114237/32.07%155/20.97%347/46.96%
OratIR03796Orat_gene03796151/37.47%74/18.36%178/44.17%
OratIR04024Orat_gene04024182/27.87%156/23.89%315/48.24%
OratIR04168Orat_gene04168413/24.91%345/20.81%900/54.28%
OratIR07352Orat_gene07352265/39.85%118/17.74%282/42.41%
OratIR07629Orat_gene07629261/32.95%174/21.97%357/45.08%
OratIR08699Orat_gene08699156/34.98%81/18.16%209/46.86%
OratIR09105Orat_gene09105345/23.99%304/21.14%789/54.87%
OratIR09241Orat_gene09241261/37.77%122/17.66%308/44.57%
OratIR11498Orat_gene11498189/28.55%128/19.34%345/52.11%
OratIR11499Orat_gene11499132/21.67%155/25.45%322/52.87%
OratIR11500Orat_gene11500173/29.27%119/20.14%299/50.59%
OratIR11534Orat_gene11534446/39.47%182/16.11%502/44.42%
OratIR11918Orat_gene11918260/27.99%157/16.90%512/55.11%
OratIR13001Orat_gene13001221/25.00%193/21.83%470/53.17%
OratIR13003Orat_gene13003267/42.18%111/17.54%255/40.28%
OratIR14286Orat_gene14286204/32.13%140/22.05%291/45.83%
OratIR18123Orat_gene18123166/35.02%117/24.68%191/40.30%
OratIR18942Orat_gene18942146/20.56%169/23.80%395/55.63%
OratIR22841Orat_gene22841213/30.00%161/22.68%336/47.32%
OratIR22845Orat_gene22845216/30.42%158/22.25%336/47.32%
OratIR23765Orat_gene23765114/22.71%131/26.10%257/51.20%
OratIR23802Orat_gene23802114/22.71%132/26.29%256/51.00%
Disclaimer/Publisher’s Note: The statements, opinions and data contained in all publications are solely those of the individual author(s) and contributor(s) and not of MDPI and/or the editor(s). MDPI and/or the editor(s) disclaim responsibility for any injury to people or property resulting from any ideas, methods, instructions or products referred to in the content.

