Article

Structure and Function Analyses of the Thioredoxin 2 and Thioredoxin Reductase Gene in Pacific White Shrimp (Litopenaeus vannamei)

1
Hainan Provincial Key Laboratory for Functional Components Research and Utilization of Marine Bio-Resources, Institute of Tropical Biosciences and Biotechnology, Chinese Academy of Tropical Agricultural Sciences, Haikou 571101, China
2
College of Biology and Agriculture, Jiamusi University, Jiamusi 154007, China
*
Authors to whom correspondence should be addressed.
These authors contributed equally to this work.
Animals 2025, 15(5), 629; https://doi.org/10.3390/ani15050629
Submission received: 9 January 2025 / Revised: 17 February 2025 / Accepted: 18 February 2025 / Published: 21 February 2025
(This article belongs to the Section Aquatic Animals)

Simple Summary

In this study, the full-length open reading frames (ORFs) of thioredoxin 2 (Trx2) and thioredoxin reductase (TrxR) were successfully cloned from the Pacific white shrimp (Litopenaeus vannamei). They were highly expressed in the hepatopancreas and gill. Through ammonia-N stress or lipopolysaccharide (LPS) injection, we found out that LvTrx2 was involved in the immune defense response process of stress resistance and antibacterial activity, LvTrxR was involved in antioxidant defense processes, and 4-nonylphenol (4-NP) stress after silencing LvTrx2 caused an increase in the oxidative damage level in lipids. Glutaredoxin 2 (Grx2), Grx3, glutathione peroxidase (GPx), and glutathione S-transferase (GST) were upregulated and may have a synergistic effect with LvTrx2. These results indicate that the Trx system participates in regulating antioxidant processes, and LvTrx2 and LvTrxR play a crucial role in defending environmental stress.

Abstract

The thioredoxin (Trx) system is one of the most significant systems in living organisms as it regulates cellular redox reactions and plays a pivotal protective role within the cell by promoting redox homeostasis. Trx and thioredoxin reductase (TrxR) are the core oxidoreductases of the Trx system. In this study, the novel full-length cDNAs of LvTrx2 and LvTrxR were cloned from Litopenaeus vannamei. The ORFs of LvTrx2 and LvTrxR were 453 bp and 1785 bp, encoding polypeptides consisting of 150 and 596 amino acids. Sequence alignment analysis revealed that the amino acid sequence of LvTrx2 shared a high degree of identity (93%) with that of Penaeus chinensis, while in LvTrxR, it exhibited a similarity level of 95% with previously submitted Penaeus chinensis and Penaeus monodon sequences. Regarding tissue-specific expression patterns, LvTrx2 showed its highest expression levels in hepatopancreas and gill. For LvTrxR, the highest expression was observed in gill followed by hepatopancreas and intestine. During exposure to ammonia-N, there was a significant upregulation in the relative mRNA levels of LvTrx2 and LvTrxR in hepatopancreas and gill, with the peak values occurring at 24 h or 48 h of exposure. After LPS injection, the LvTrx2 and LvTrxR transcripts in hepatopancreas and gill had different upregulated levels. These findings suggest that LvTrx2 and LvTrxR play pivotal roles in enhancing stress resistance and bolstering antibacterial defense mechanisms in L. vannamei. To explore the roles, LvTrx2 expression was knocked down in vivo to verify the defense mechanism against 4-NP stress. LvTrx2 silencing in 4-NP-challenged shrimp could significantly induce the gene expression of antioxidant-related genes (except for LvTrxR) and aggravate the oxidative damage of lipids. This study suggests that the Trx system is involved in regulating the antioxidant processes, and LvTrx2 and LvTrxR play a vital role in defense responses against environmental stress.

1. Introduction

Pacific white shrimp (Litopenaeus vannamei) is known as one of the three highest-production shrimp in the world, which is the most economic aquaculture species [1]. In China, the yields of L. vannamei occupied the first position in shrimp mariculture [2]. Due to the development of industrialization and intensive culture systems, the degradation of aquaculture environments has become a significant factor affecting L. vannamei over the past two decades. The L. vannamei species residing in benthic zones of ponds are susceptible to the influence of environmental pollutants (ammonia nitrogen [3], organic pesticides [4], heavy metal [5], etc.) and various other factors (temperature [6], salinity [7], pH [8], etc.). Thus, it is imperative to comprehend the resistance mechanisms of L. vannamei against environmental pollutants.
The thioredoxin (Trx) system is a nicotinamide adenine dinucleotide phosphate (NADPH)-dependent reductase system, consisting of Trx, thioredoxin reductase (TrxR), NADPH, and thioredoxin interacting protein (Txnip). The Trx system regulates cellular redox reactions and plays a pivotal protective role within the cell by promoting redox homeostasis [9,10]. Trx and TrxR are the core oxidoreductases of the Trx system. Trx is a small disulfide reductase (approximately 12 kDa) that belongs to the thioredoxin superfamily. Trx plays an important role in maintaining the delicate balance of oxidative stress and safeguarding cells against oxidative damage [11]. Trx consists of two distinct types: cytosolic Trx (Trx1) and mitochondrial Trx (Trx2) [12]. Trx1 includes three additional Cys residues apart from the two in the active center, which is the predominant form of Trx involved in physiological processes (e.g., cell growth, apoptosis, and inflammatory response). Trx2 possesses two Cys residues at its active site. Its precursor protein carries a mitochondrial localization sequence, and mature Trx2 is localized within the mitochondria [13,14]. The conserved active site of most Trx is Cys-Gly-Pro-Cys, which can catalyze the progress of many redox reactions. Their primary function is to participate in a series of physiological and biochemical reactions, such as redox reactions, by reducing disulfide bonds on intracellular target proteins [15,16]. TrxR, weighing between 55 and 60 kDa, is a selenium-containing dimeric flavoprotein with an NADPH domain and has broad substrate specificity [17]. TrxRs are the sole known enzymes capable of reducing Trxs, establishing TrxR as an essential component of Trx functionality [18]. The relatively conservative domain of TrxR is Cys-Val-Asn-Val-GLy-Cys, close to the FAD domain. In vivo, TrxR eliminates reactive oxygen species (ROS) while maintaining cellular and tissue homeostasis internally and peripherally. Mammalian cells contain three distinct types of this enzyme: TrxR1, TrxR2, and thioredoxin glutathione reductase (TGR) [11].
In recent years, Trx and TrxR have garnered significant attention due to their diverse and potent functions. They have a crucial involvement in oxidative stress regulation, cell growth, proliferation, apoptosis, and signal transduction pathways [11]. In Phascolosoma esculenta, the recombinant Trx2 protein exhibited antioxidant activity and enhanced the cadmium (Cd) tolerance of Escherichia coli. Following Trx2 interference, alterations in the expression of apoptosis-related genes were observed, proving that PeTrx2 played an important role in antioxidant and anti-apoptosis P. esculenta [19]. Previous research on Hippocampus abdominalis has demonstrated that HaTrx-2 exhibits significant antioxidant and free radical scavenging properties, as evidenced by cell viability assays, DPPH radical scavenging activities, and MCO assays [20]. For Sinopotamon henanense, TrxR participates in the redox process under Cd exposure [21]. A limited number of investigations have focused on decapods. This current study presents the initial cloning of full-length sequences for Trx2 and TrxR from L. vannamei with subsequent molecular characterization analysis. To investigate the biological functions of Trx2 and TrxR, the expression patterns of Trx2 and TrxR were examined in Pacific white shrimp under ammonia-N stress and following lipopolysaccharide (LPS) injection. Additionally, Trx2 was silenced to elucidate its role in L. vannamei after exposure to 4-nonylphenol (4-NP) stress.

2. Materials and Methods

2.1. Experimental Shrimp

Healthy Pacific white shrimp L. vannamei were purchased from a local shrimp farm in Haikou, China, with an average body weight of 8.22 ± 1.18 g and reared in cycling filtered plastic tanks in salinity 20‰, temperature 22–23 °C, and pH 7.9–8.0 conditions. Before the stress experiment started for 12 h, the shrimp were fed a commercial shrimp diet (40.0% protein, 5.0% fat, 5.0% fiber, and 16.0% ash) twice daily.

2.2. Ammonia-N Stress and LPS Challenge

Expression changes in LvTrx2 and LvTrxR in shrimp were determined under ammonia-N stress or LPS injection. Two ammonia-N doses (zero and 20 mg L−1) were administered in each ammonia-N exposure experiment. The 20 mg L−1 ammonia-N solution was prepared using ammonium chloride (NH4Cl) (Guangzhou Chemical Reagent Factory, Guangzhou, China) to 20‰ seawater [22]. The actual mean doses of ammonia-N for the control and test groups were 0.01 and 20.32 mg L−1, respectively. Three replicates were set for the test and control groups under ammonia-N stress, respectively. Each replicate had 25 shrimp in plastic tanks with 80 L of water (22–23 °C, pH 7.9–8.0, salinity 20‰) aerated continuously using air stones. The seawater was renewed daily.
The LPS (2 mg mL−1) from Escherichia coli (055: B5, Sigma, Burlington, MA, USA) was dissolved in physiological saline solution (0.85% NaCl) to achieve a dosage of 2 μg μL−1. The L. vannamei were allocated into two groups, with 25 shrimp per replicate. The LPS injection dose of the test groups was 8 μg g−1 wet weight based on a previous study [23]. The control shrimp received an equivalent amount of sterile physiological saline solution.
After 0, 3, 6, 12, 24, and 48 h of ammonia-N stress or LPS injection, nine shrimp were collected from each group. Before RNA extraction, the hepatopancreas and gill of shrimp were rapidly dissected and preserved in liquid nitrogen followed by storage at −80 °C.

2.3. RNA Extraction and Complementary DNA (cDNA) Synthesis

The tissue samples were pulverized in liquid nitrogen followed by the extraction of total RNA using TRIzol reagent (Invitrogen, Waltham, MA, USA) as per the manufacturer’s protocol. The extracted RNAs were treated with RNase-free DNase I (TakaRa, Kusatsu, Shiga, Japan). The quantity and quality of each RNA were measured using a NanoDrop 2000 spectrophotometer (NanoDrop Technologies, Wilmington, DE, USA). Agarose electrophoresis (1%) was performed to verify the integrity of the RNA. First-strand cDNA was synthesized from total RNA using the PrimeScript RT reagent kit with a gDNA Eraser (Takara, Dalian, China).

2.4. Cloning of Trx2 and TrxR and Sequence Analysis

A small fragment of Trx2 and TrxR cDNA was derived from the transcriptome data we previously acquired for L. vannamei. The Basic Local Alignment Search Tool (BLAST, https://blast.ncbi.nlm.nih.gov/Blast.cgi, accessed on 10 January 2024) analysis of all the expressed sequence tags (ESTs) from a cDNA library of multiple species revealed a high degree of similarity between the EST and the previously identified Trx2 and TrxR. The first-round polymerase chain reaction (PCR) was performed using Trx2 primers (Trx2 F1 and R1) or TrxR primers (TrxR F1 and R1) (Table 1). The PCR conditions included 1 cycle of denaturation at 94 °C for 3 min, followed by 35 cycles of amplification consisting of denaturation at 94 °C for 30 s, annealing at 58 °C for 30 s, and extension at 72 °C for 1 min. A final extension step was carried out at 72 °C for 10 min.
The PCR products were cloned into the pMD18-T Vector (Takara, Dalian, China) and subjected to sequencing analysis conducted by the Beijing Genomics Institute (BGI) (Guangzhou, China).

2.5. Rapid Amplification of cDNA Ends (RACE)

Based on the obtained small sequence of L.vannamei Trx2 and TrxR, specific primers for the 3′ and 5′ ends were designed using the 3′-Full RACE Core Set with PrimeScript RTase (Takara, Dalian, China) and the SMART RACE cDNA Amplification Kit (Clontech, Mountain View, CA, USA). The primer sequences are provided in Table 1.
The PCR for the 3′ end was performed using gene-specific primer Trx2-3′F1 or TrxR-3′F1 and the 3′ RACE Outer Primer. The PCR was in a 50 µL reaction volume containing 2 µL of 3′-RACE-Ready cDNA, 8 µL of 1 × cDNA Dilution Buffer II, 2 µL of 3′ RACE Outer Primer (10 µM), 2 µL of Gene-Specific Outer Primer (10 μM), 4 µL of 10 × LA PCR Buffer II (Mg2+ Free), 3 µL of MgCl2 (25 mM), 0.25 µL of TaKaRa LA Taq (5 U/µL), and 28.75 µL of dH2O. The PCR protocol consisted of an initial denaturation step at 94 °C for 3 min, followed by 30 cycles of denaturation at 94 °C for 30 s, annealing at 58 °C for 30 s, extension at 72 °C for 1 min, and a final extension step at 72 °C for 10 min.
The 5′-untranslated regions (UTRs) were amplified using Trx2-5′R1 or TrxR-5′R1 and universal primer mix (UPM). The PCRs include 2.5 µL of 5′-RACE-Ready cDNA, 5 µL of 10 × UPM, 1 µL of 5′ Gene-specific primer TrxR-5′R1 or TrxR-5′R1, 15.5 µL of PCR-Grade H2O, 25 µL of 2× SeqAmp Buffer, and 1 µL of SeqAmp DNA Polymerase. The PCR was performed at 94 °C for 30 s, 68 °C for 30 s, and 72 °C for 3 min. We 30 PCR cycles first as described and analyzed 5 µL from each tube, along with the appropriate DNA size markers, on a 1.2% agarose gel. Electrophoresis was performed for 10 min at 20 V/200 mA, after which SYBR® Green I (Molecular Probes, Eugene, OR, USA) staining was used to visualize the PCR products. The gel-purified products of the 5′- and 3′-RACE PCR were cloned and sequenced according to the described protocol. All primer sequences can be found in Table 1.

2.6. Bioinformatics Analysis

The open reading frame (ORF) and amino acid sequences were analyzed using the software EditSeq (v7.1). The nucleotide and amino acid sequences of Trx2 and TrxR cDNA were analyzed via the BLAST algorithm at The National Center for Biotechnology Information (NCBI) website (https://blast.ncbi.nlm.nih.gov/Blast.cgi, accessed on 8 March 2024) and Expasy search program (http://au.expasy.org/tools/, accessed on 8 March 2024). Multiple sequence alignment was performed using Clustal X software (1.83). Subcellular localization of proteins was analyzed using TargetP. SignalP 4.1 software (https://services.healthtech.dtu.dk/services/SignalP-4.1/, accessed on 9 March 2024) was used to predict the signal peptide. NetPhos 3.1 software (https://services.healthtech.dtu.dk/services/NetPhos-3.1/, accessed on 9 March 2024) was used for the phosphorylation site analysis. Based on NCBI BLAST, a diverse set of sequences from invertebrates to vertebrates, exhibiting moderate-to-high sequence similarity (45–95%), were utilized to construct the phylogenetic tree. Neighbor-joining phylogenetic tree based on the deduced amino acid sequences of Trx2 and TrxR was constructed using Molecular Evolutionary Genetics Analysis (MEGA) 6.0 software. Bootstrap sampling was performed with 1000 replicates, and branches with less than 40% bootstrap support were collapsed. Evolutionary distances were calculated using the Poisson correction method.

2.7. Tissue Expression

We randomly selected nine shrimp to collect samples. For each shrimp, a 25-gauge needle and 1.5 mL syringe were used to collect hemolymph (400 μL) from the pericardial sinus, and the same volume of ice-cold anticoagulant solution (AS, glucose 20.5 g L−1, sodium citrate 8 g L−1, sodium chloride 4.2 g L−1, pH 7.5) was absorbed. Hemocytes were separated by centrifugation at 800× g and 4 °C for 5 min, and the hemocyte pellets were used for RNA extraction. The same shrimp were dissected out of the eyestalk, gill, hepatopancreas, muscle, and intestine and preserved in liquid nitrogen for RNA extraction.
Using the house-keeping gene β-actin as an internal control, the relative expression of LvTrx2 or LvTrxR was determined in various tissues (gill, hepatopancreas, eyestalk, intestine, muscle, and hemocytes) through quantitative real-time PCR (qRT-PCR).

2.8. Gene Expression Analysis Under Different Stress Conditions

Following the previously described method for RNA extraction and cDNA synthesis, subsequent amplification was performed. After ammonia-N stress and LPS injection, a qRT-PCR using Stratagene Mx3005P (Agilent, Santa Clara, CA, USA) was employed to investigate the expression of LvTrx2 and LvTrxR in the hepatopancreas and gill (Table 1). The results were quantified using the 2−ΔΔCt method [24]. All data are presented as means ± standard deviation (SD).

2.9. LvTrx2 Gene Silence Experiment

2.9.1. Double-Stranded RNA (dsRNA) Synthesis

The DNA templates for the dsRNA preparation were generated using gene-specific primers, Trx2i-F and Trx2i-R, containing a T7 promoter sequence at the 5′ end (Table 1). To serve as a control, green fluorescent protein (GFP) dsRNA was amplified from a pGFP vector template using primers with the T7 promoter sequences indicated in Table 1. The PCR products were purified using the QIAquick PCR Purification Kit (QIAGEN, Hilden, Germany) and utilized as templates for synthesizing LvTrx2 or GFP dsRNA with the T7 RiboMAXTM Express RNAi System (Promega, Madison, WI, USA). The synthesized dsRNAs were validated through agarose electrophoresis and their concentrations were estimated by spectrophotometry at an absorbance of 260 nm.

2.9.2. Gene Silencing and qRT-PCR

In the RNA interference (RNAi) experiment, dsRNAs were dissolved in a protective buffer (10 mM Tris-HCl, pH 7.5, 400 mM NaCl) to achieve a final dose of 2.5 μg μL−1. The shrimp were divided into two groups and injected with LvTrx2 (2.5 µg g−1 shrimp) or GFP dsRNA (2.5 µg g−1 shrimp) at the lateral region of the fourth abdominal segment [25]. The hepatopancreas were individually collected from twenty shrimp at time points of 0, 24, 48, 72, and 96 h after dsRNA injection. The transcript level of the Trx2 gene in each RNA sample was examined by qRT-PCR using specific primer pairs Trx2-RT-F1 and Trx2-RT-R1 (Table 1).

2.9.3. Effects of 4-NP Stress on LvTrx2-Interfered Shrimp

To evaluate the impact of 4-NP stress on L. vannamei following LvTrx2 suppression, shrimp were randomly allocated into two experimental groups. One group received an injection of GFP dsRNA as a control, while the other group was injected with Trx2 dsRNA. Twenty-four hours after the injection, all groups of shrimp were exposed to 4-NP (500 µg L−1). Then, the samples were collected 24 h after the injection and 0, 1.5, 3, 6, 12, and 24 h after exposure. At each point, thirty shrimp from each group were randomly selected for hepatopancreas collection. The hepatopancreas was rapidly frozen in liquid nitrogen and stored at −80 °C before RNA extraction.

2.9.4. Expression Levels of LvTrx2 and Antioxidant-Related Genes

Nine shrimp were collected from each time point, and the hepatopancreas of the shrimp was rapidly dissected and preserved in liquid nitrogen followed by storage at −80 °C. The relative expression levels of LvTrx2, LvTrxR, and several other antioxidant-related genes (GPx, GST, glutaredoxin 2 (Grx2), (Grx3)) were determined using qRT-PCR in LvTrx2-silenced shrimp and control shrimp (dsGFP).

2.9.5. Malondialdehyde (MDA) Content

The MDA content was utilized to evaluate the degree of lipid peroxidation through the thiobarbituric acid (TBA) assay under conditions of oxidative stress. The MDA content in the hepatopancreas was measured using commercial kits (Nanjing Jiancheng Bioengineering Institute, Nanjing, China) according to the manufacturer’s instructions. The MDA content in the lipid hydroperoxide decomposition products could react with TBA to form red compounds exhibiting an absorption peak of 532 nm. The data underwent triplicate testing. The average of the three values was utilized for the data analysis.

2.10. Statistical Analyses

The data were reported as means ± SD. The normality of the data was assessed using the Shapiro–Wilk test. A one-way analysis of variance [26] was employed to analyze the data. A multiple comparison (Tukey) test was conducted to compare significant differences among the treatments using the Statistical Package for the Social Sciences (SPSS) 18.0 software (SPSS Inc., Chicago, IL, USA). A significance level of p < 0.05 was considered statistically significant.

3. Results

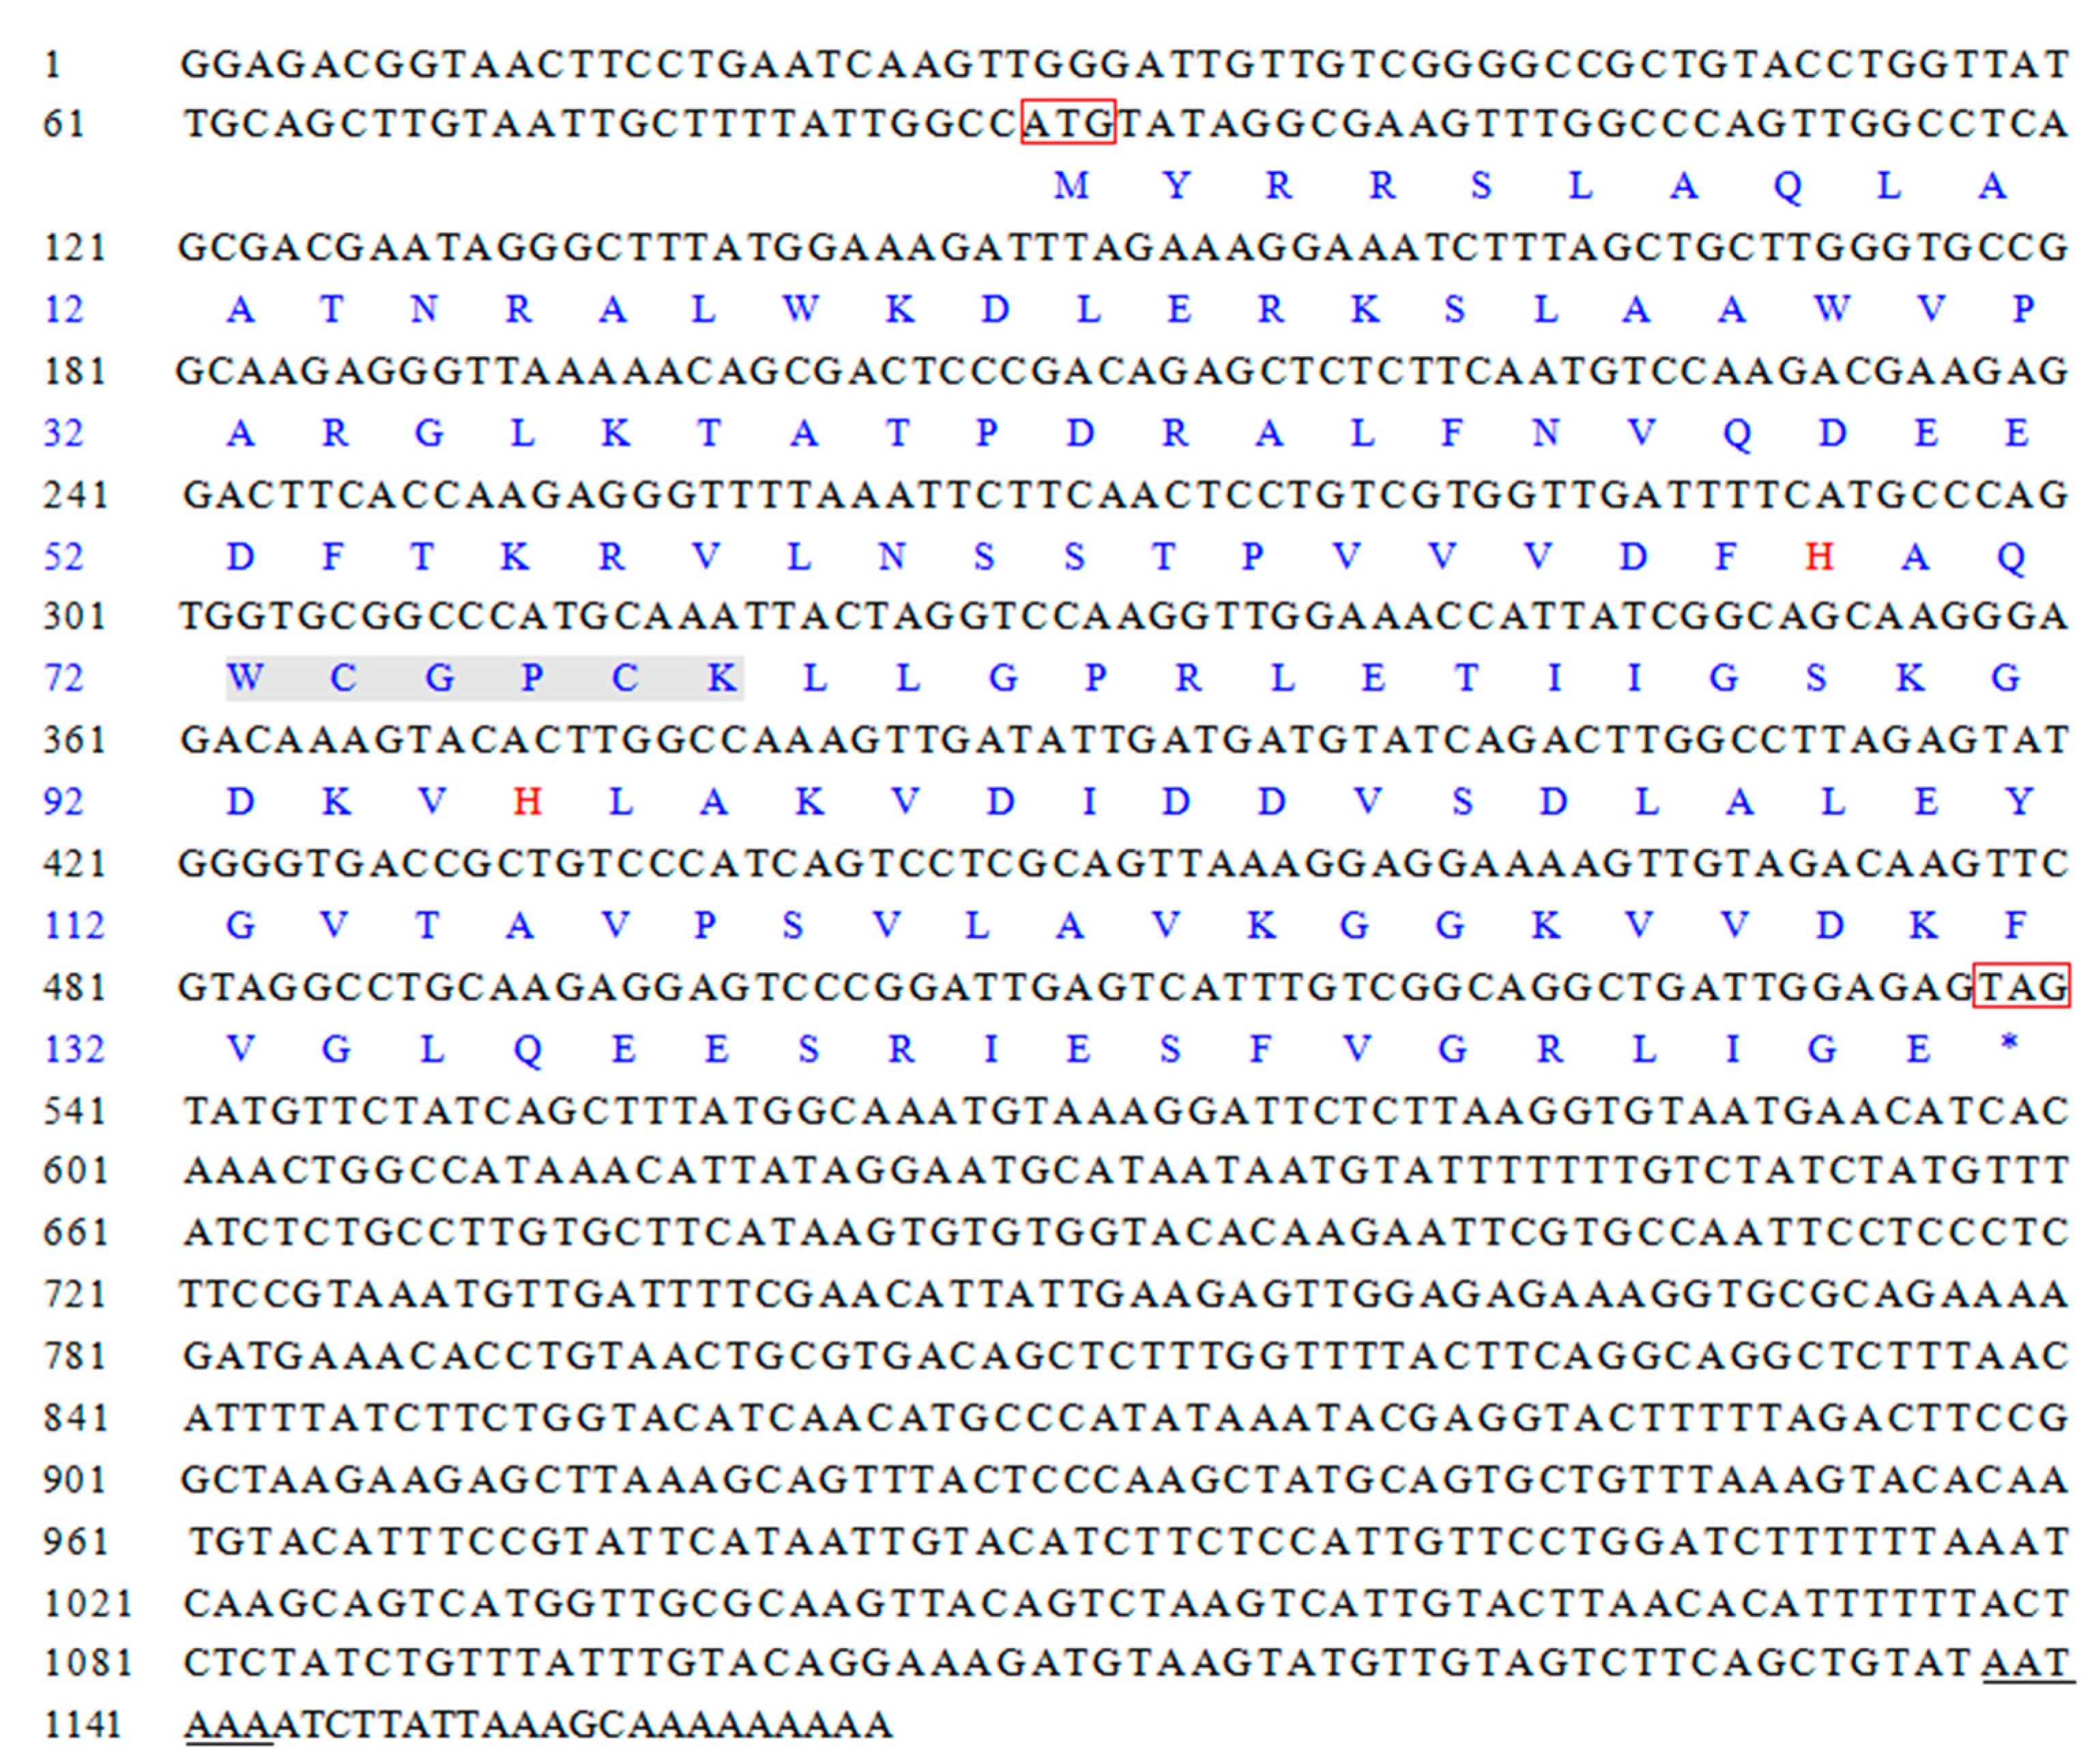
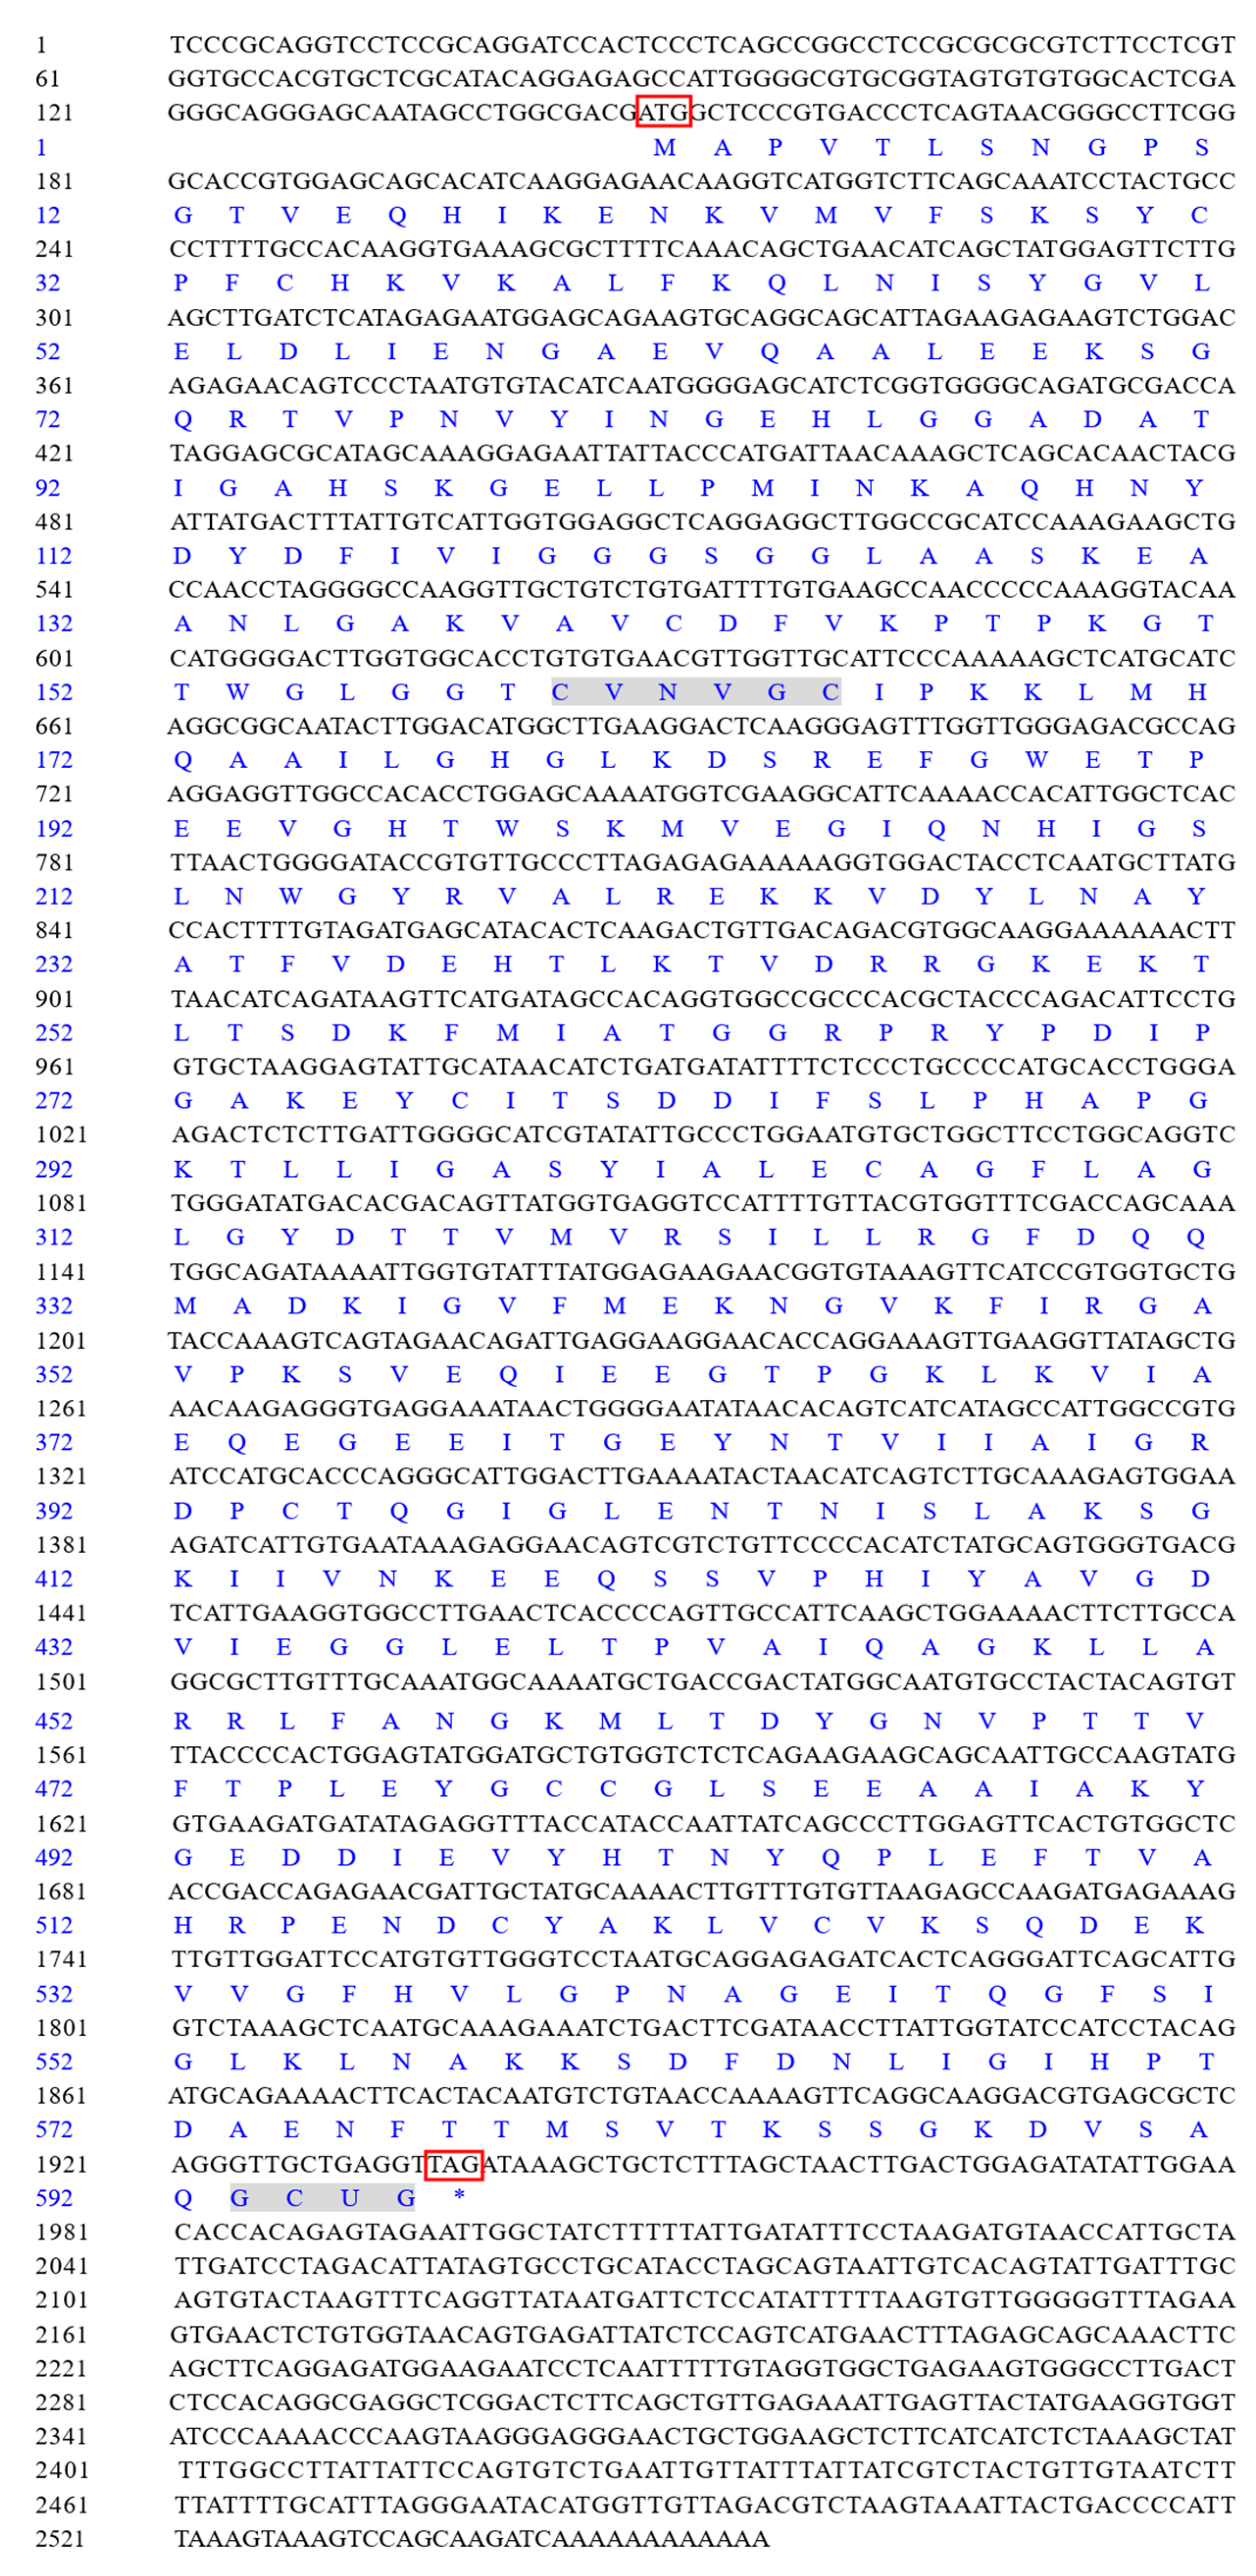
3.1. Cloning and Sequence Analysis of LvTrx2 and LvTrxR Genes

The cDNA template was derived from the hepatopancreas of L. vannamei. The full-length cDNA of LvTrx2 was 1165 bp, comprising an 87 bp 5′-UTR and a 625 bp 3′-UTR, and it exhibited a typical polyadenylation signal AATAAA repeat and a poly(A) tail. The complete ORF of LvTrx2 spanned 453 bp, corresponding to a coding sequence for 150 amino acids. The protein encoded by LvTrx2 exhibited a molecular weight of 16.46 kDa, a theoretical pI of 7.76, and an instability index of 29.79, classifying it as a stable protein. The LvTrx2 protein contained 41 charged amino acid residues, with 20 being negatively charged and 21 positively charged. It exhibited an aliphatic index of 99.40 and an average hydrophilicity value of −0.109. The protein was predicted to possess 10 phosphorylation sites, consisting of 7 serine and 3 threonine (Thr) residues. The absence of a signal peptide in the LvTrx2 protein sequence was observed. In terms of secondary structure prediction, α-helix accounted for 30.67% (46 amino acids) and extended strand accounted for 22.67% (34 amino acids), while random coil constituted the majority at 46.67% (70 amino acids) (Figure 1).
The full-length cDNA of LvTrxR was 2554 bp, consisting of a 146 bp 5′-UTR and a 618 bp 3′-UTR. The ORF of LvTrxR was 1785 bp, encoding a polypeptide of 596 amino acids. The LvTrxR-encoded protein exhibited a molecular weight of 64.34 kDa, a theoretical pI of 5.87, and an instability index of 30.13, which classified it as a stable protein. The LvTrxR protein contained 71 negatively charged and 60 positively charged residues. It exhibited an aliphatic index of 85.89 and an average hydrophilicity value of −0.180. The protein was predicted to contain 23 Ser, 20 Thr, and 6 tyrosine (Tyr) phosphorylation sites. The LvTrxR protein lacks signal peptide. In terms of secondary structure prediction, the α-helix constituted 26.01% (155 amino acids), the extended strand accounted for 26.34% (157 amino acids), β-turn represented 12.58% (75 amino acids), while the random coil comprised the majority at 35.07% (209 amino acids). A high abundance of glycine residues was observed in the polypeptide, accounting for 11.20% (67 amino acids) (Figure 2).

3.2. Multiple Alignment and Phylogenetic Analysis

The blast analysis revealed that LvTrx2 exhibited the highest similarity with Trx2 from two species of shrimp, Chinese shrimp (Penaeus chinensis, XP_047475382.1) and giant tiger prawn (Penaeus monodon, XP_037785345.1), showing 93% identity in both cases. Additionally, LvTrx2 shared a significant homology with the Chinese mitten crab (Eriocheir sinensis) (XP_050712400.1), displaying 85% identity. Notable similarities were observed with the mud crab (Scylla paramamosain) (AFW97641.1) and gazami crab (Portunus trituberculatus) (XP_045121346.1), exhibiting 84% identity each, as well as oriental river prawn (Macrobrachium nipponense) (AQW44864.1) with 71% identity. The sequence information used for alignment and constructing evolutionary trees is supplemented in Table S1.
The BLAST analysis indicated that LvTrxR shared the highest similarity with TrxR from P. chinensis (XP_047469221.1, 95%), P. monodon (XP_037782185.1, 95%), and Penaeus indicus (XP_063611883.1, 95%). The second closest similarity was found with the karuma shrimp (Penaeus japonicus) (XP_042872148.1, 93% identity). This was followed by the American lobsters (Homarus americanus) (XP_042238035.1), crayfish (Procambarus clarkii) (XP_045595557.1), and swimming crab (P. trituberculatus) (XP_045134908.1), with similarities of 81%, 78%, and 77%, respectively. Additional sequence information used for alignment and constructing evolutionary trees is found in Table S1.
Multiple sequence alignment has revealed that LvTrx2 contains a conserved domain specific to the Trx family, which is critical for the fundamental structure and function of the Trx protein. The Trp-Cys-Gly-Pro-Cys-Lys (W-C-G-P-C-K) structural domain, the Trx family activate area, is highly conservative in Trx2 for all of the compared species. Using TargetP, the subcellular localization of proteins was analyzed, and LvTrx2 amino acid sequences had mitochondrial targeting peptide (mTP), which indicates that it plays a role in mitochondria (Figure 3A).
Through multiple sequence alignment, LvTrxR contains a conserved domain Cys-Val-Asn-Val-Gly-Cys (C-V-N-V-G-C), which is specific to the TrxR protein family. The conserved domain plays a significant role in fundamental architecture and exhibits high conservation across all of the species that were compared. The sequence terminates with an unusual amino acid called selenocysteine (Sec, U), which is present in Gly-Cys-Sec-Gly (G-C-U-G) (Figure 3B).
Phylogenetic tree analysis was conducted to investigate the evolutionary relationship between LvTrx2 or LvTrxR and the chosen vertebrates and invertebrates, providing insights into their inter-relationships. The phylogenetic tree exhibited congruence with the taxonomic classification of the species. L. vannamei clustered with P. monodon and P. chinensis, which belong to crustaceans (Figure 4).

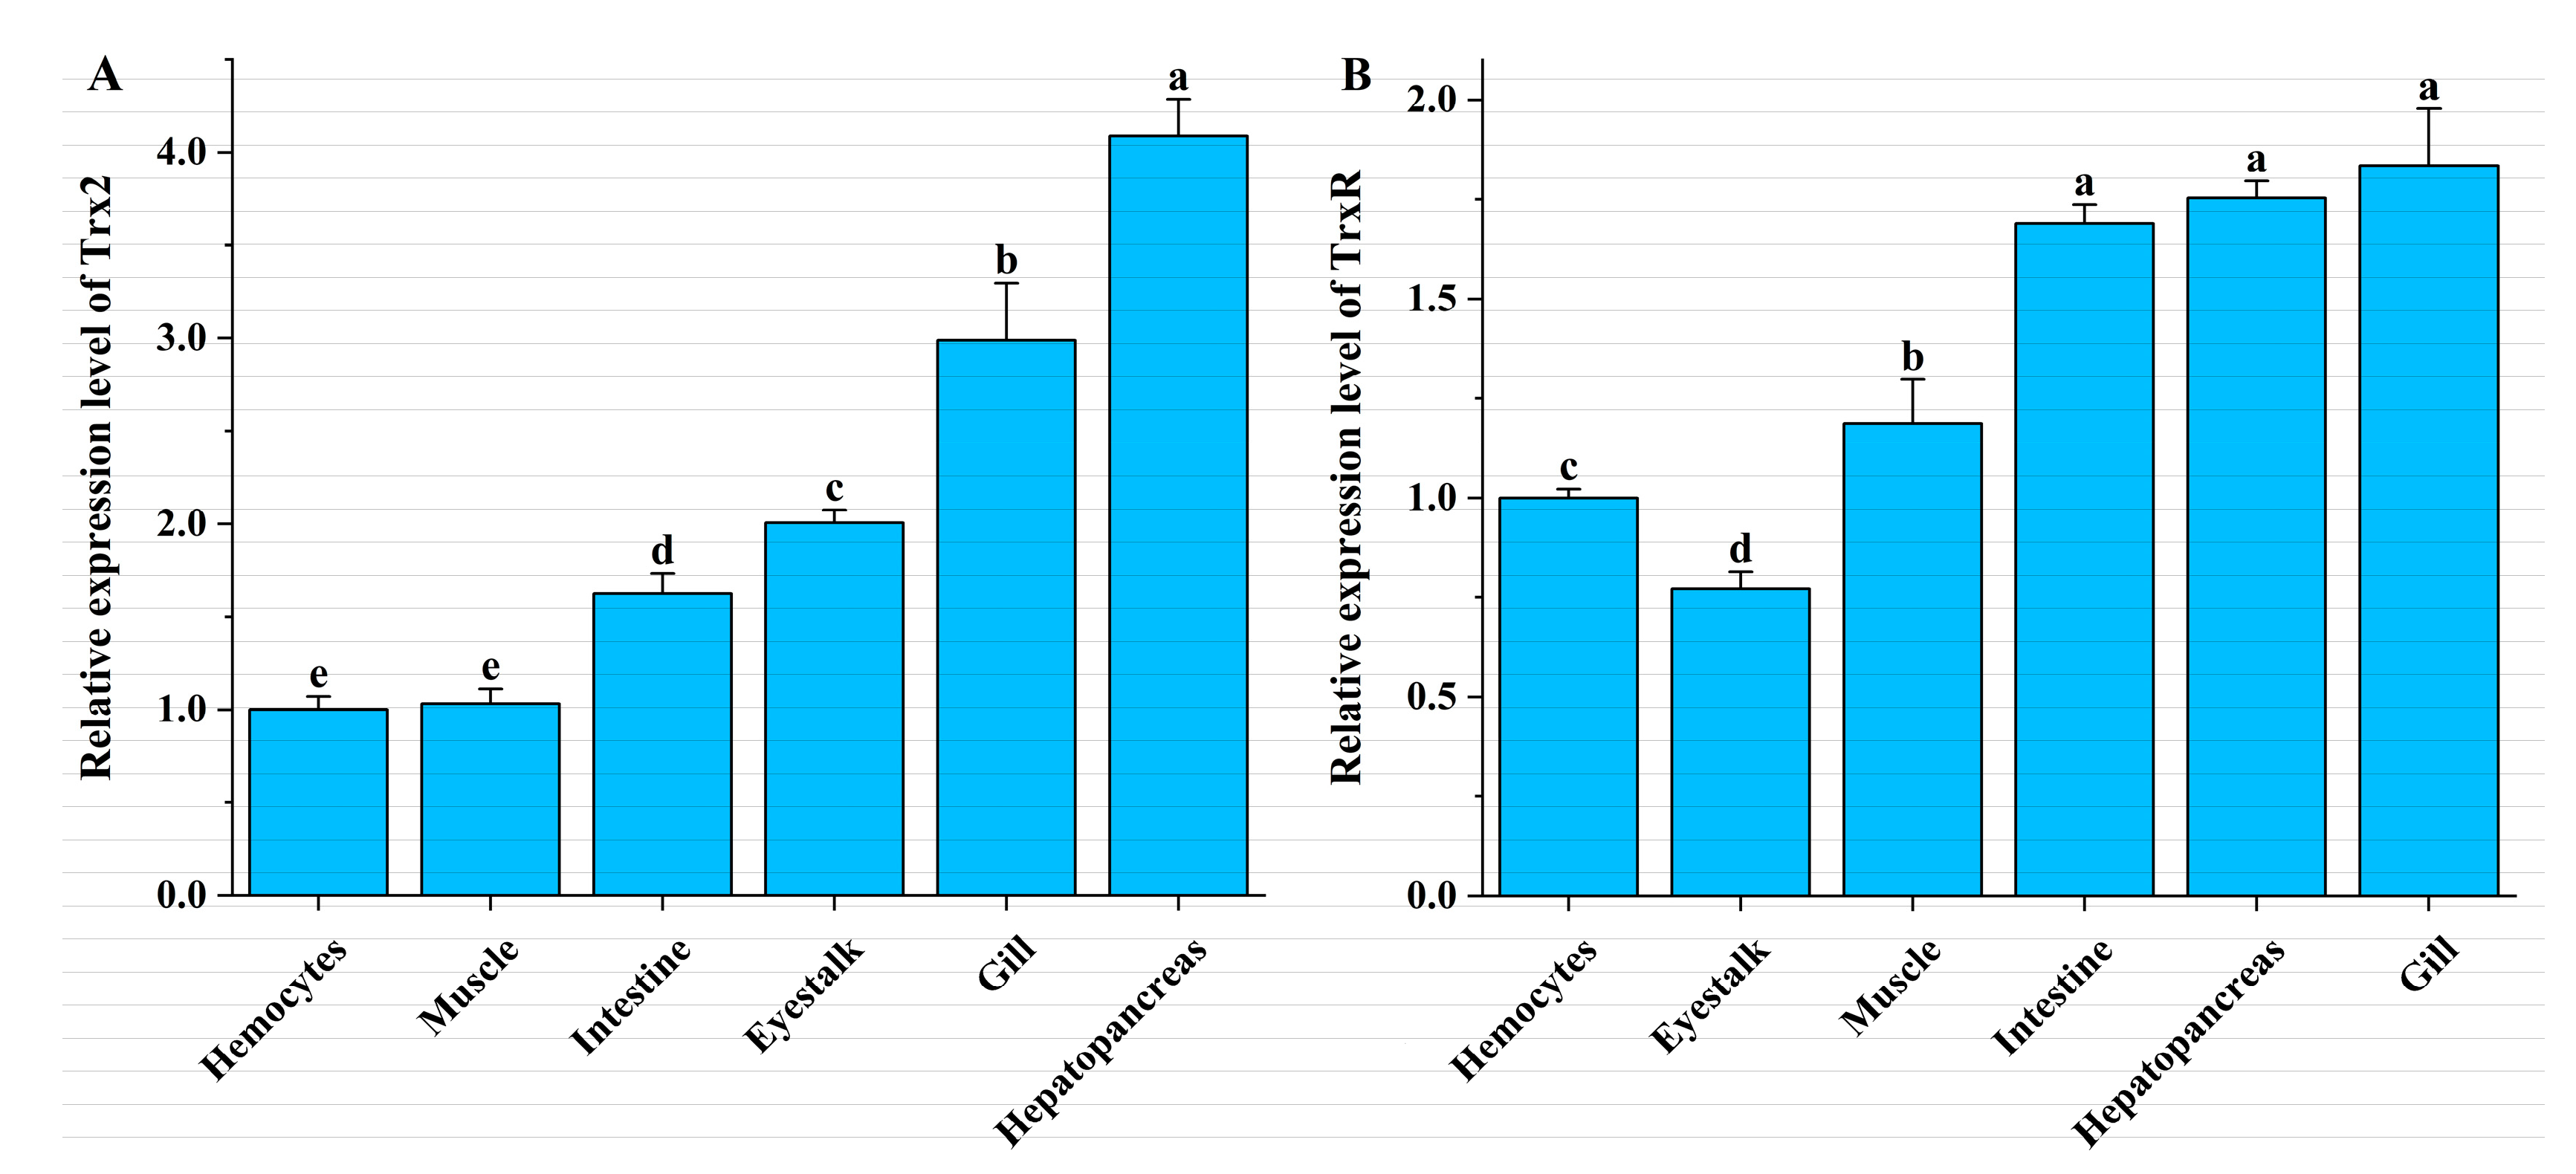
3.3. Tissue Expression in L. vannamei

qRT-PCR showed the ubiquitous presence of LvTrx2 and LvTrxR in all examined tissues of L. vannamei, including gill, hepatopancreas, eyestalk, intestine, muscle, and hemocytes. LvTrx2 exhibited expression levels in the hepatopancreas, gill, and eyestalk, followed by the intestine, whereas its expression level was lowest in muscle and hemocytes (Figure 5A). LvTrxR displayed the highest expression levels in gill, hepatopancreas, and intestine, and moderate levels were observed in muscle and hemocytes, while its expression level was relatively low in the eyestalk (Figure 5B).

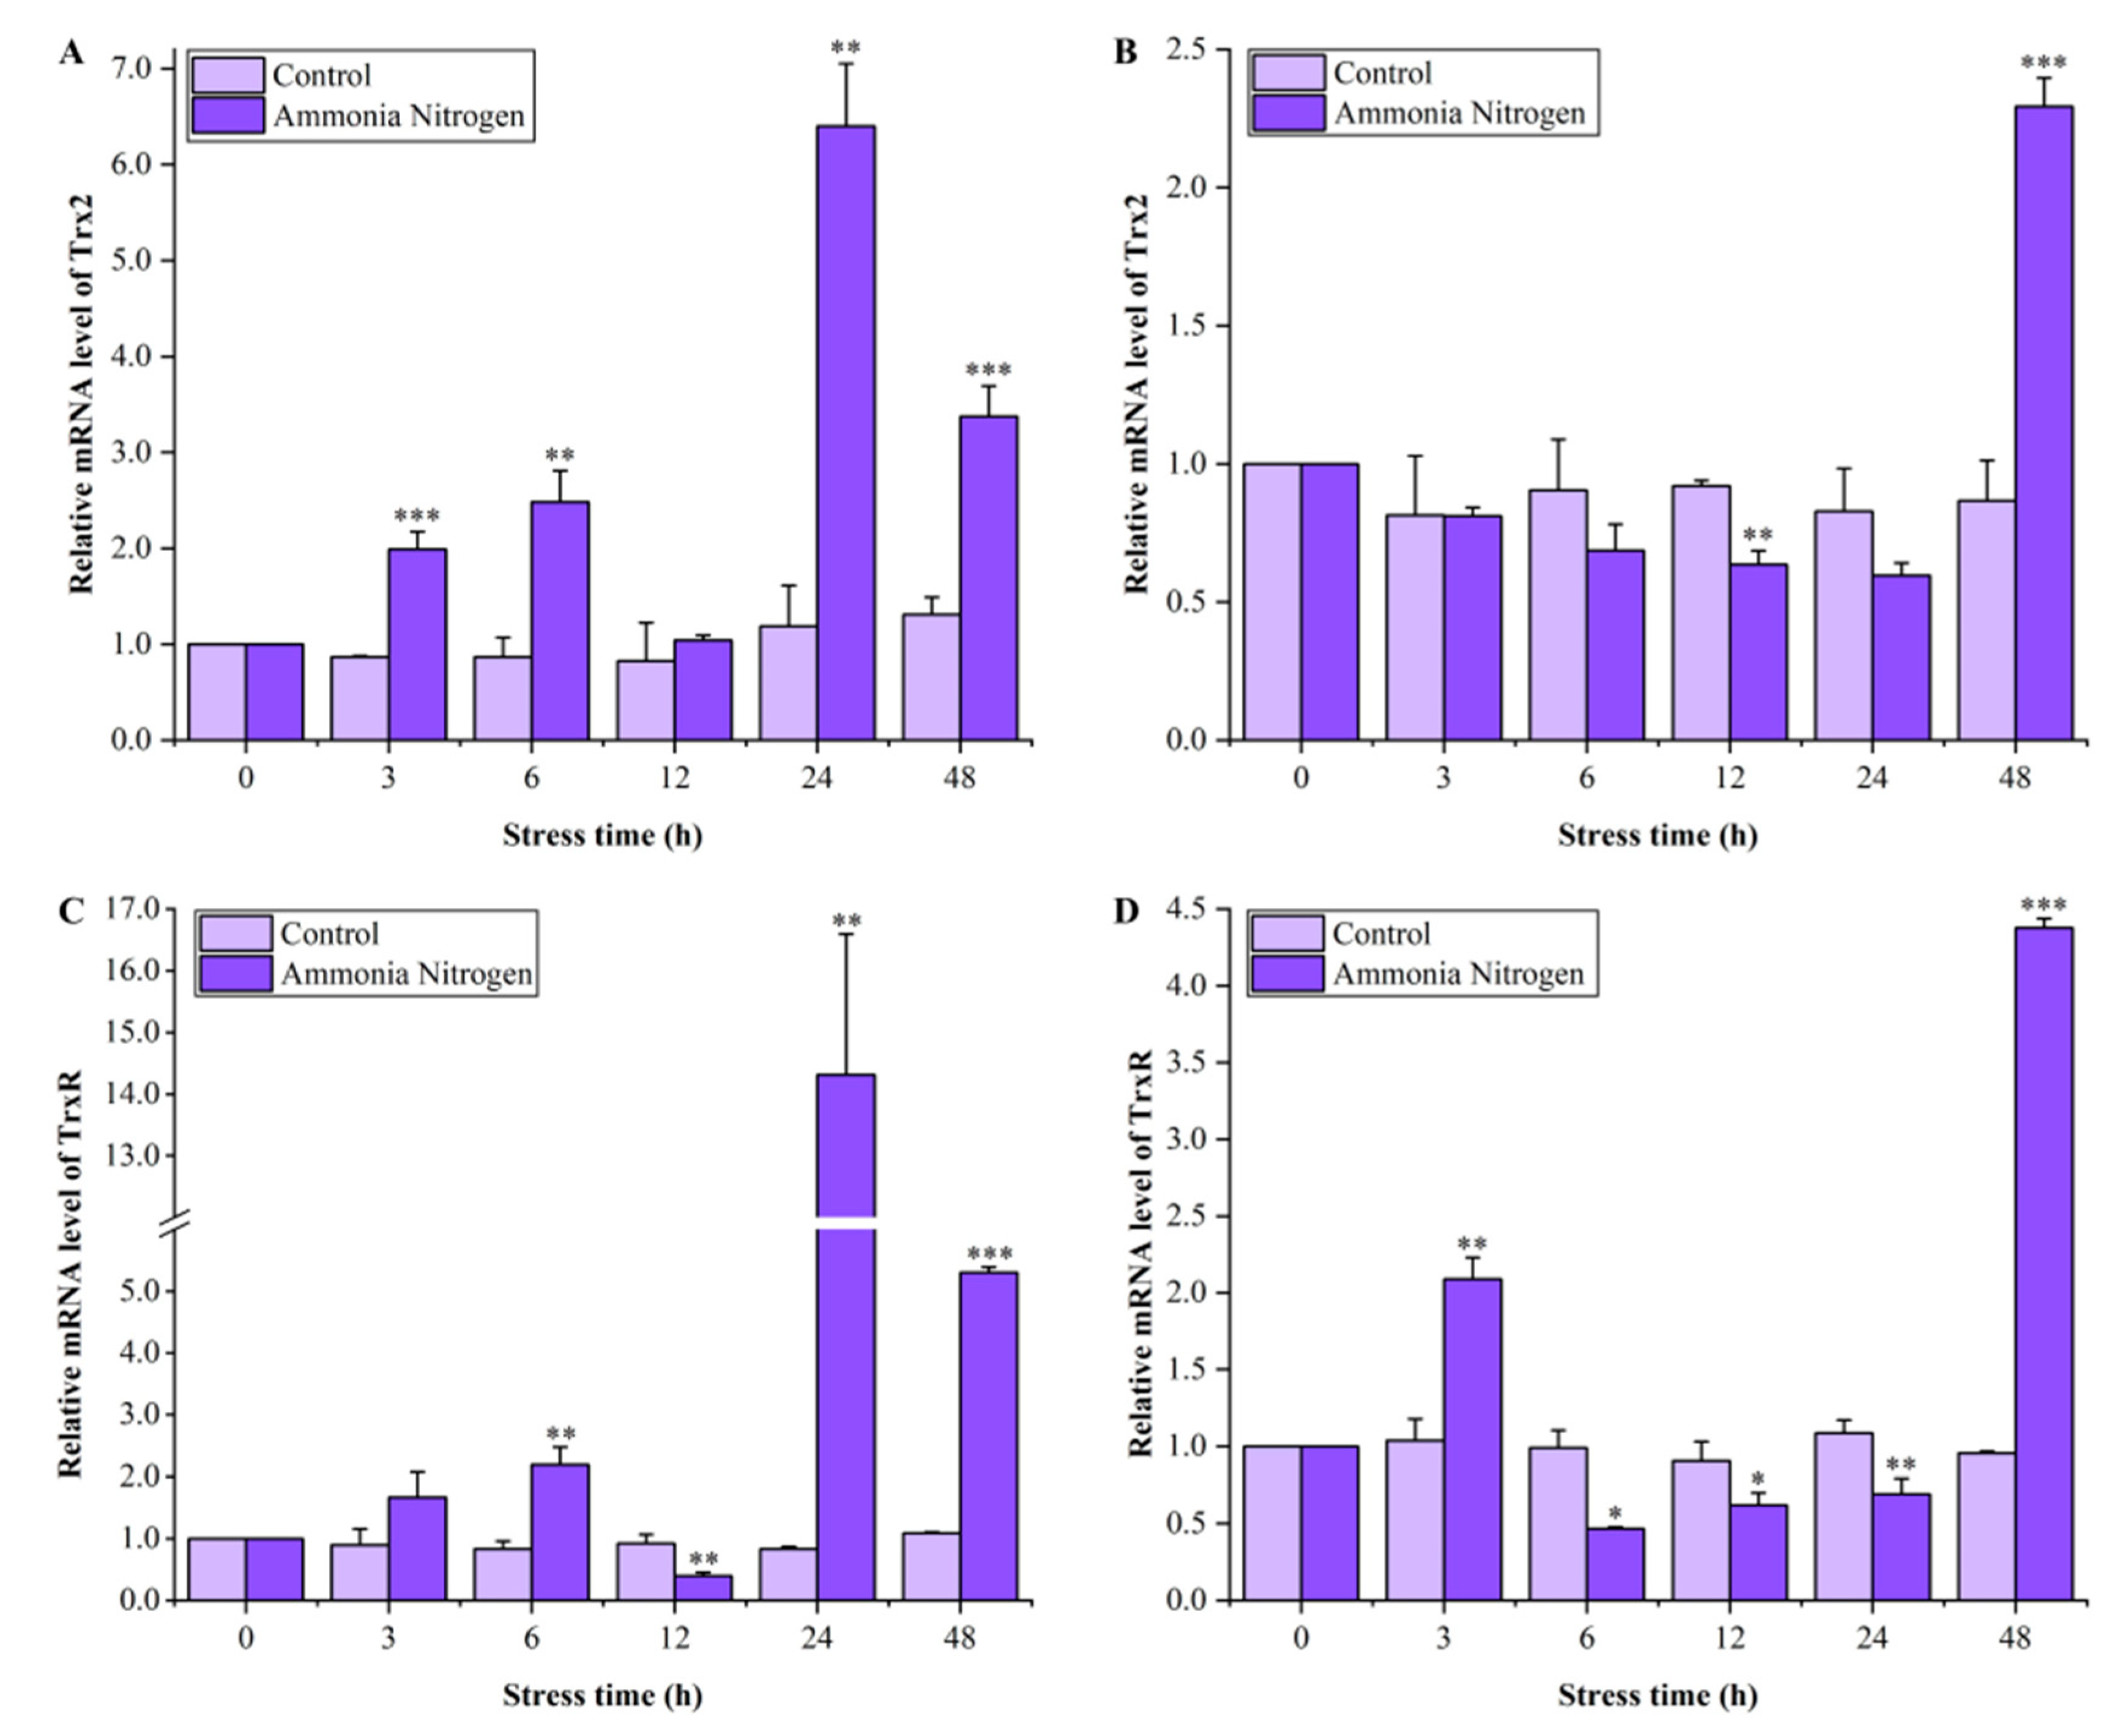
3.4. Expression Profiles of LvTrx2 and LvTrxR in Hepatopancreas and Gill During Ammonia-N Stress

During exposure to ammonia-N, the LvTrx2 transcripts in the hepatopancreas exhibited significant upregulation after 3 and 6 h (p < 0.01). At 24 and 48 h, there was an extremely significant upregulation (p < 0.01), with the peak value observed after 24 h of exposure being approximately 5.4 times higher than that of the control group (Figure 6A). The LvTrx2 transcripts in the gill exhibited no significant change at 3–6 h, which were significantly inhibited after 12 h of exposure (p < 0.01), and these transcripts returned to levels comparable to the control group at 24 h. The LvTrx2 expression was significantly upregulated at 48 h (p < 0.001), which was about 2.65 times higher than the control group (Figure 6B).
The relative expression level of the LvTrxR gene in the hepatopancreas of L. vannamei under ammonia-N stress was slightly upregulated at 3–6 h (p < 0.01), followed by a significant downregulation at 12 h (p < 0.01). After 24 h and 48 h of stress, the expression level increased sharply (p < 0.01) and reached its peak at 24 h, which was 17.13 times that of the control group (Figure 6C). The relative expression of the LvTrxR gene in the gill tissue showed a similar trend to that of the hepatopancreas. At the initial stage (3 h), the expression level of LvTrxR increased slightly (p < 0.01) and then decreased significantly (6–24 h) (p < 0.05). At 48 h, the expression level increased sharply and was extremely significant (p < 0.001). Notably, the LvTrxR gene expression level in the gill peaked at 48 h, exhibiting a significant increase of 4.57-fold compared to that observed in the control group (Figure 6D).

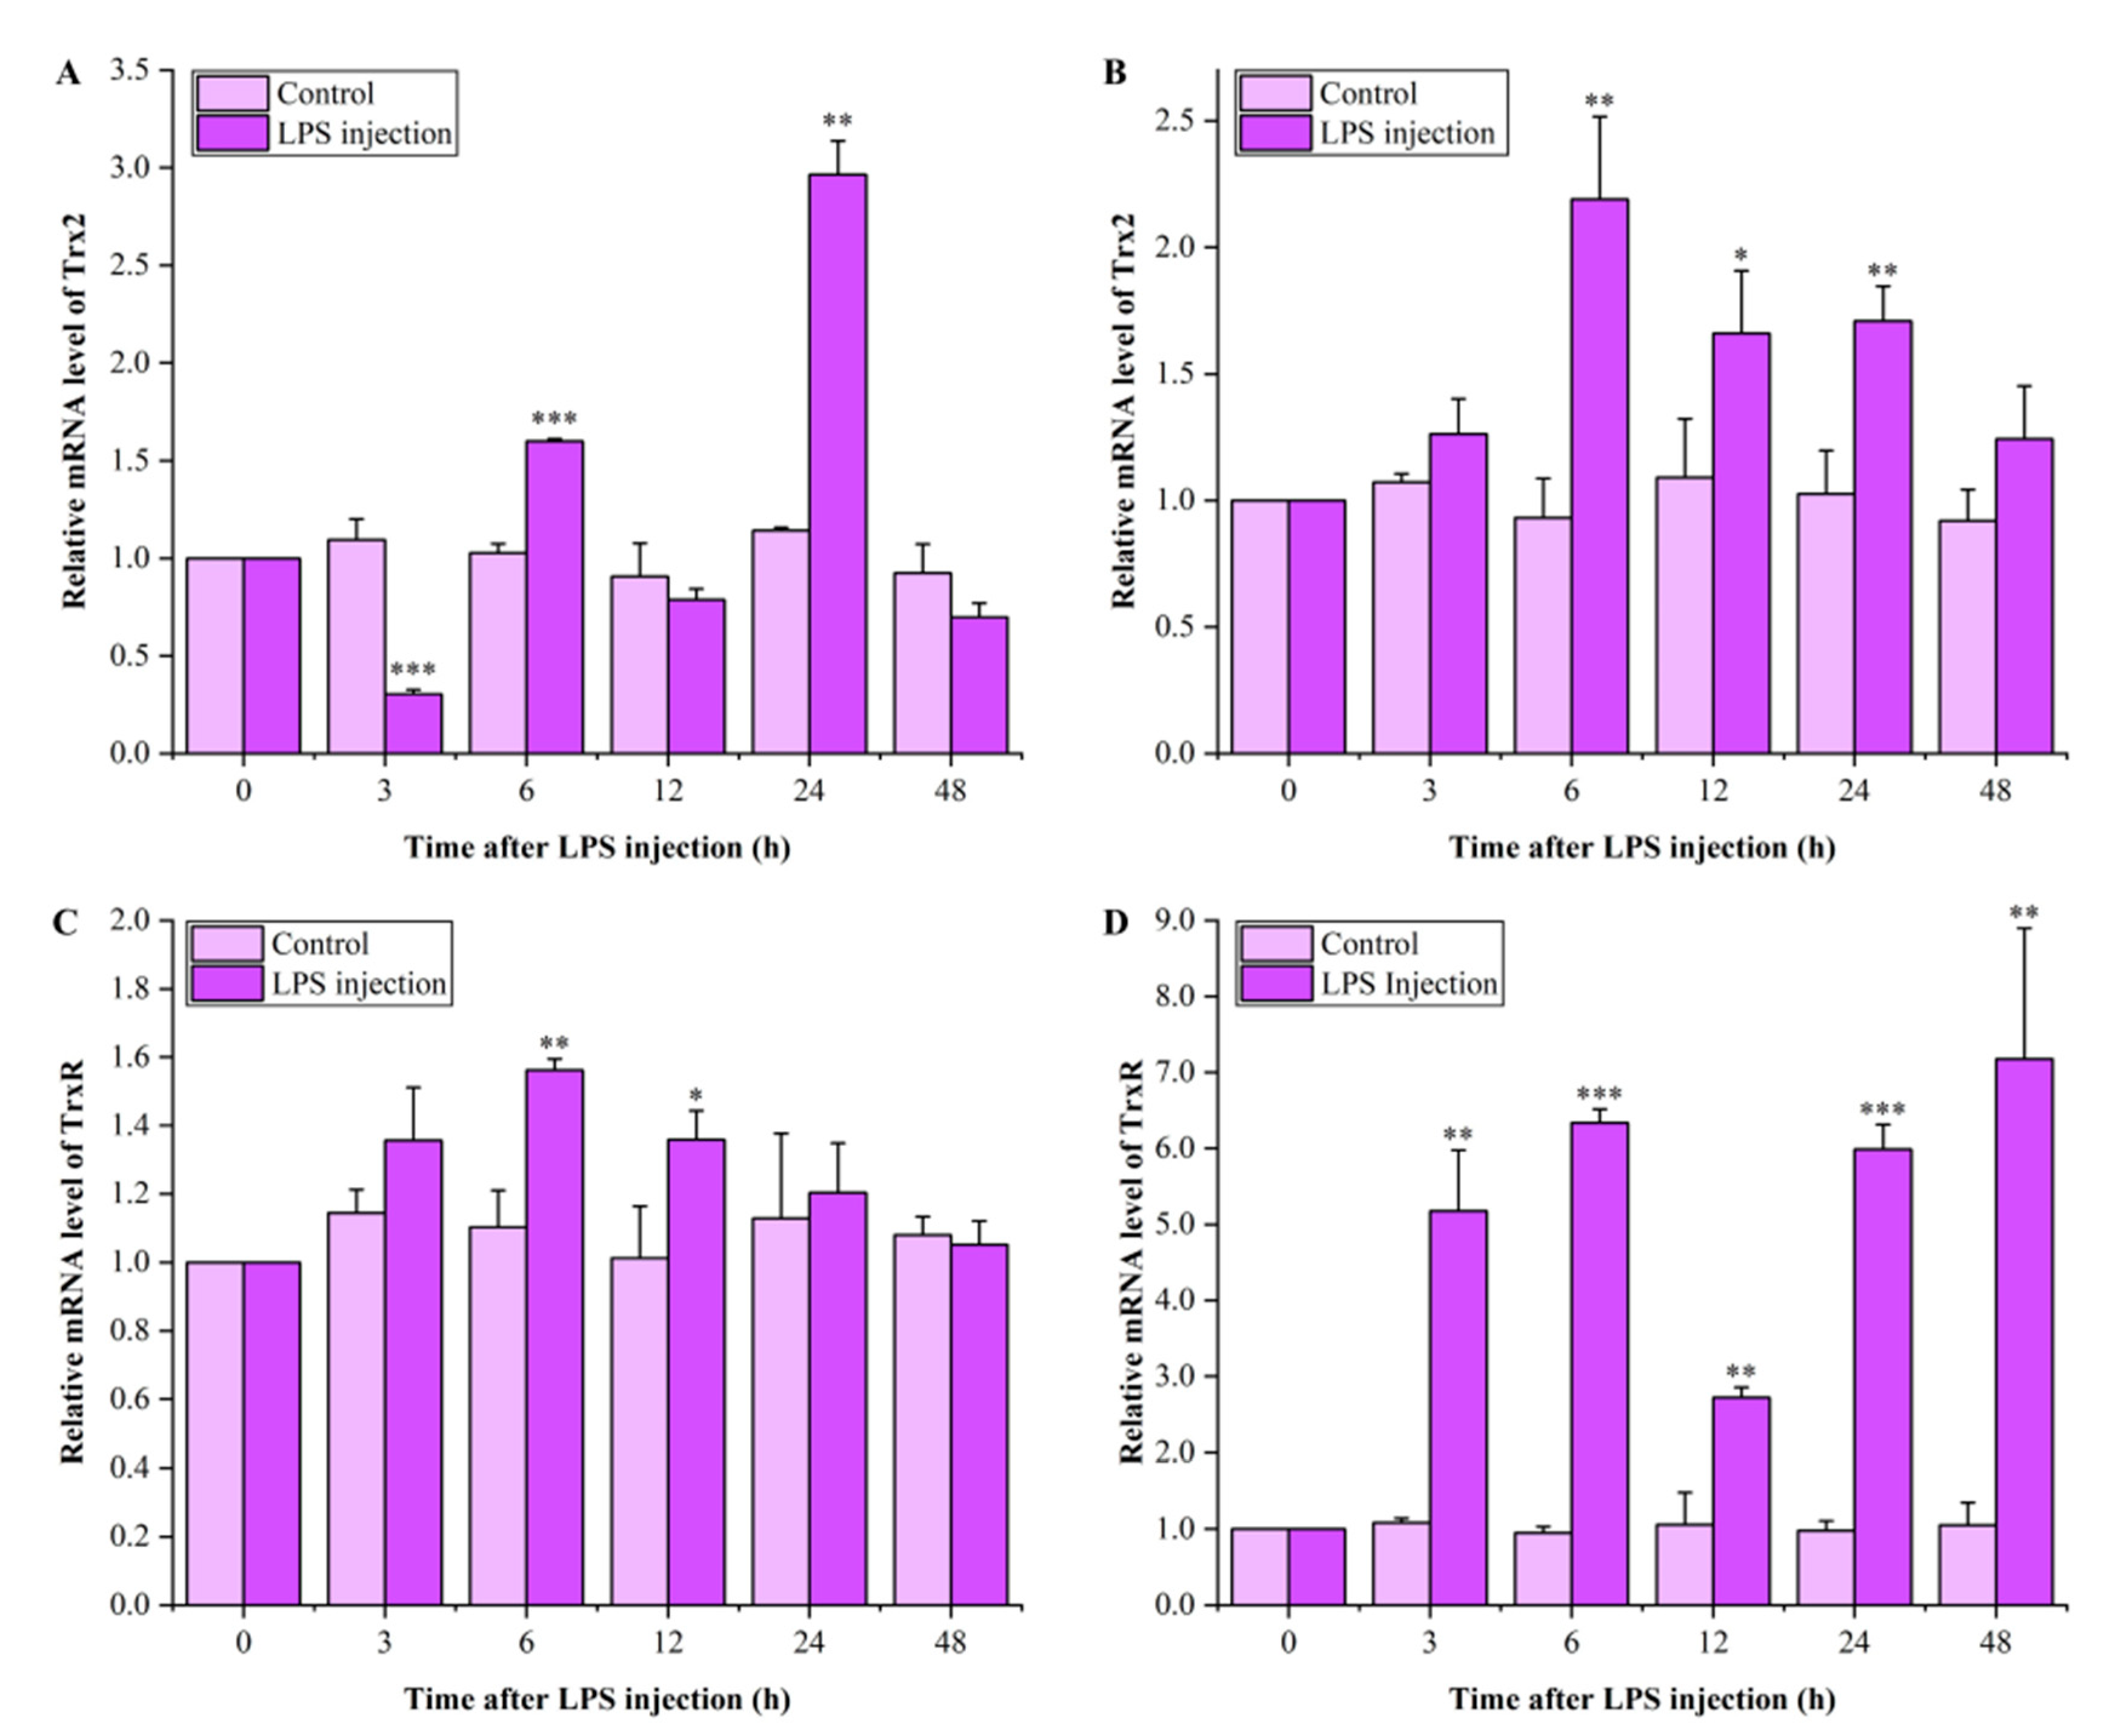
3.5. Expression Profiles of LvTrx2 and LvTrxR in Hepatopancreas and Gill After LPS Injection

The transcriptional level of LvTrx2 in the hepatopancreas extremely significantly decreased 3 h after the injection (p < 0.001). It rebounded after 6 h of stimulation, showing a significantly higher expression compared to the control group (p < 0.001). After 12 h of stress, the LvTrx2 expression was restored to levels like the control group (p > 0.05). The expression level of LvTrx2 was significantly increased at 24 h of stress (p < 0.001) and reached its peak value, which was about 2.60 times that of the control group. After 48 h of stress, the LvTrx2 expression level returned to levels comparable with the control group (p > 0.05) (Figure 7A). The expression level of LvTrx2 in the gill showed no change at 3 h after exposure (p > 0.05), followed by a significant upregulation of the expression levels after 6–24 h of exposure (p < 0.05). The peak expression level was observed at 6 h, approximately 2.35 times higher than the control group. By 48 h post-LPS injection, the expression levels had returned to those of the control group (p > 0.05) (Figure 7B).
The expression level of LvTrxR in the L. vannamei hepatopancreas showed no significant change after 3 h of LPS injection. At 6–12 h, the levels of LvTrxR were significantly higher than those in the control group (p < 0.05) and returned to similar levels as the control group (p > 0.05) (Figure 7C). After LPS injection, the expression level of LvTrxR in the gill significantly increased within 48 h after stimulation (p < 0.01), reaching a peak at 48 h with a 6.81-fold increase compared to the control group (Figure 7D).

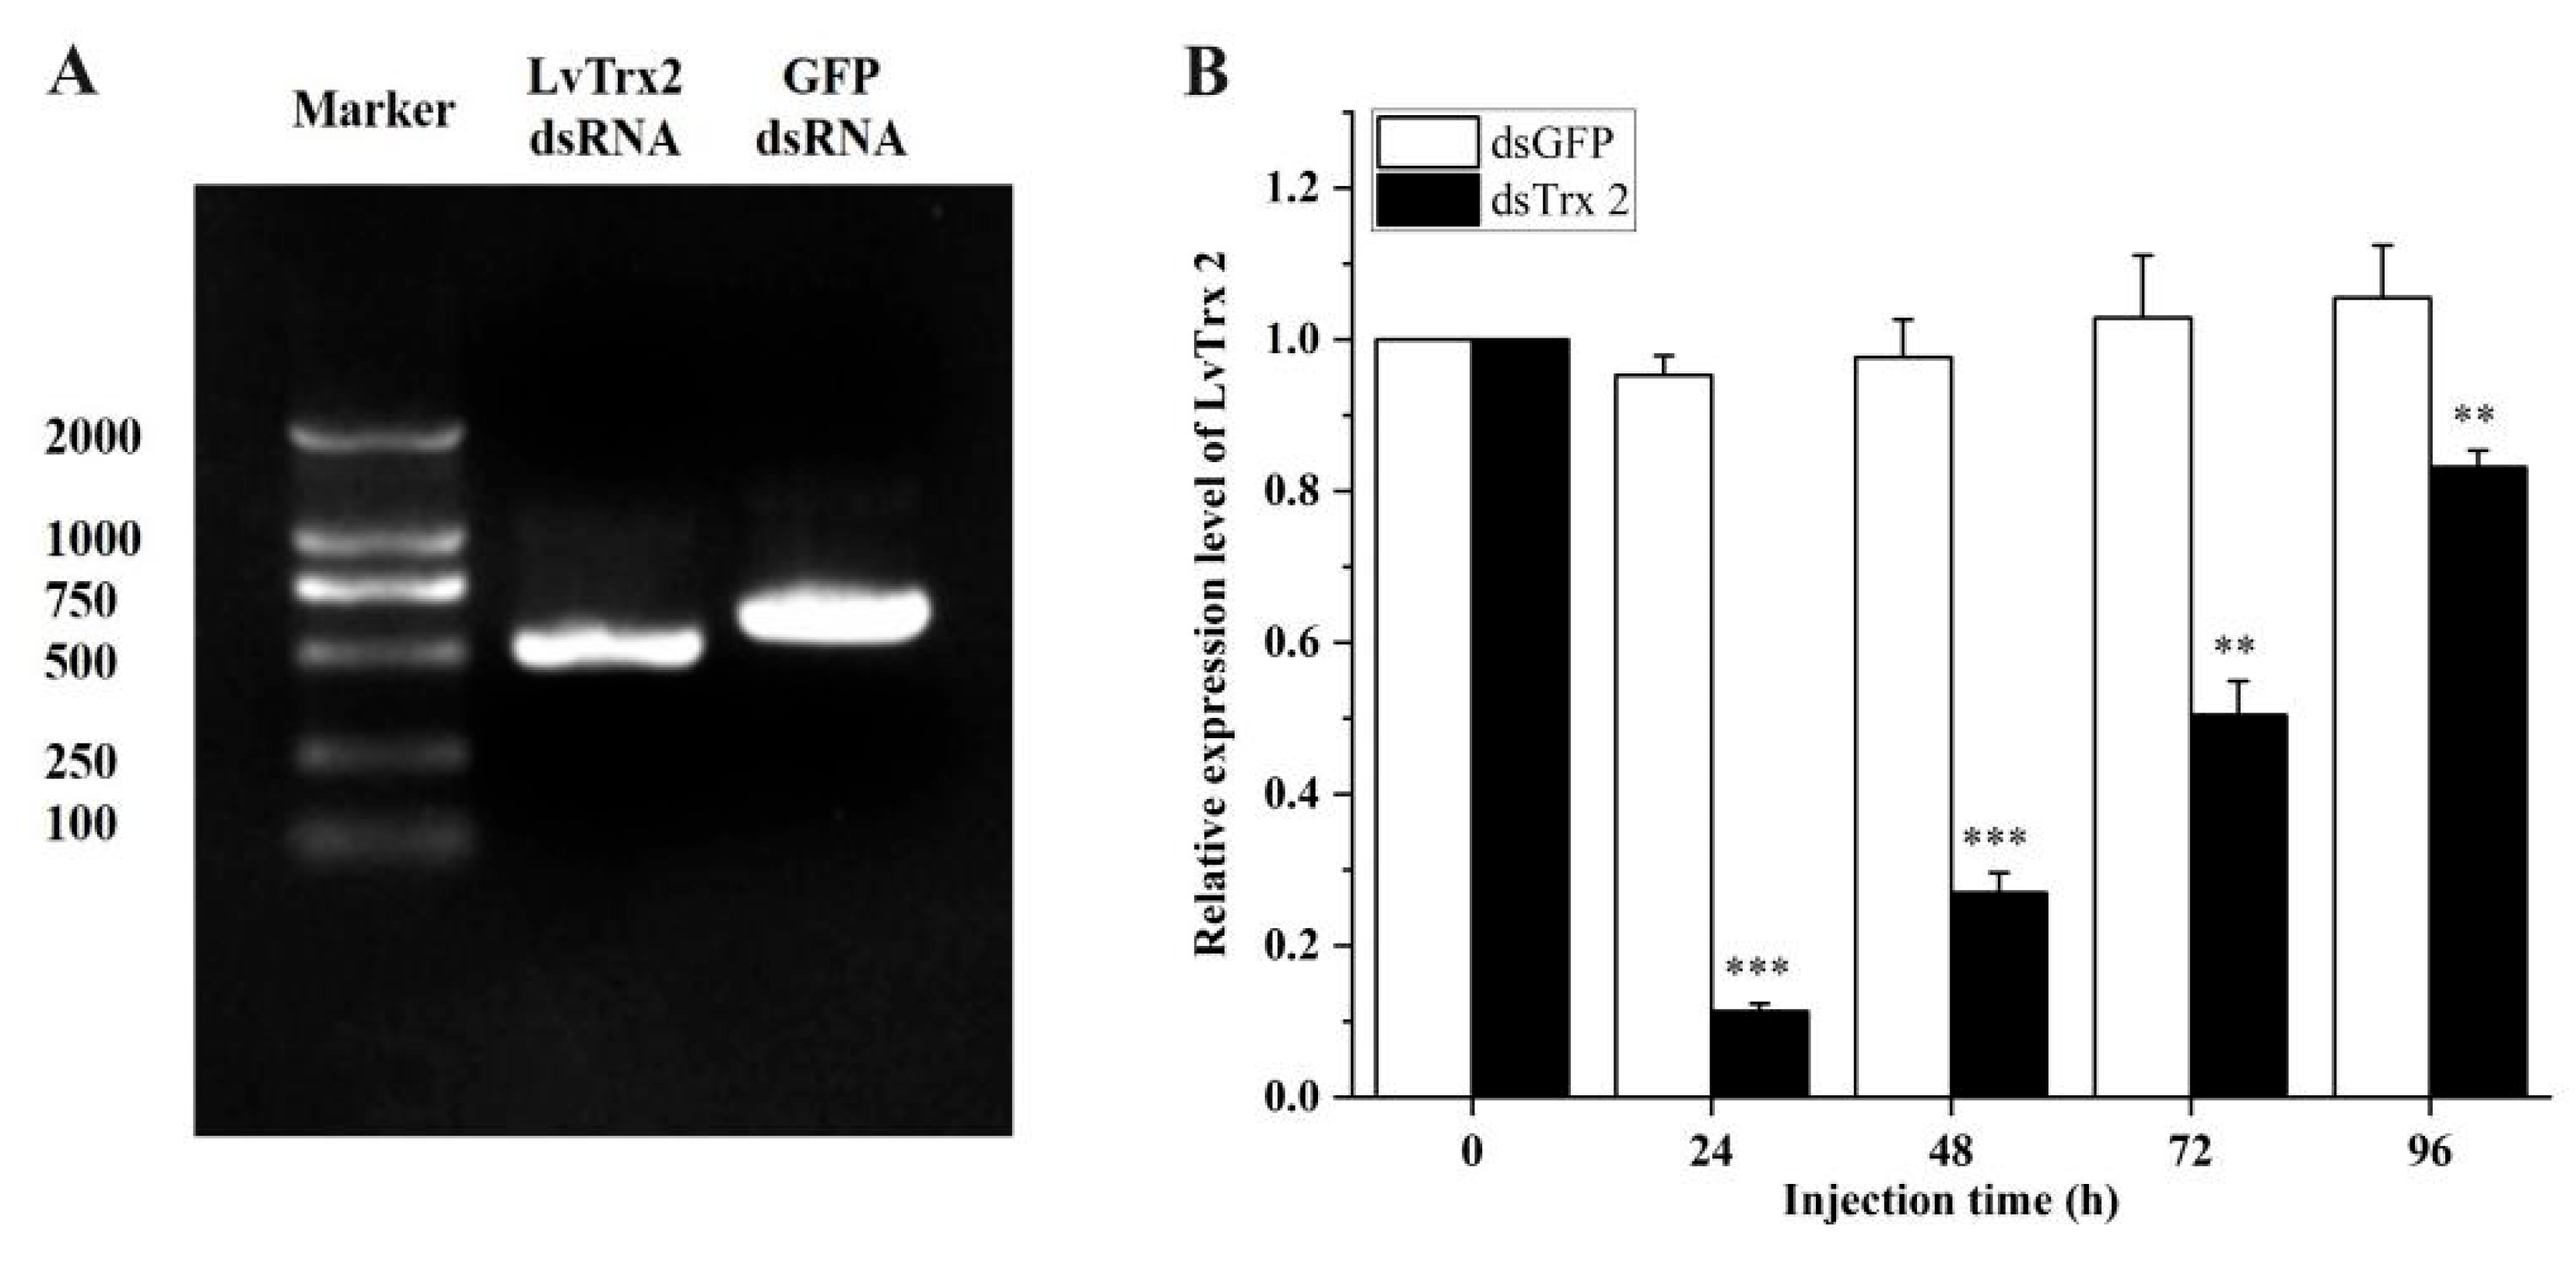
3.6. LvTrx2 Silencing Assay

The dsRNA of LvTrx2 and GFP was synthesized using a T7 promoter-specific primer, which resulted in theoretical fragment sizes of 617 bp and 717 bp, respectively. The detection of synthetic target bands through agarose gel electrophoresis revealed the presence of single, high-quality synthesized bands without any additional bands (Figure 8A). The expression levels of LvTrx2 in dsLvTrx2-injected shrimp decreased to less than 50% of the original level at 24 and 48 h post-injection, while the expression of LvTrx2 remained constant in the shrimp injected with dsGFP (Figure 8B).

3.7. Expression Patterns in LvTrx2-Silenced Shrimp Following 4-NP Challenge

Twenty-four hours post-injection (designated as the 0 h of 4-NP exposure), the expression patterns of LvTrx2-related genes were detected under 4-NP stress. In the dsGFP-injected shrimp, the expression level of LvTrx2 was significantly increased after 4-NP stress for 1.5 and 12 h (p < 0.05). In the dsTrx2-injected shrimp, the expression level of LvTrx2 was significantly higher than that at 0 h after 1.5–6 h of 4-NP stress (p < 0.05). Compared to the dsGFP shrimp, the transcriptional level of Trx2 in dsTrx2-interfered shrimp remained significantly lower at each time point after 4-NP exposure (p < 0.05), with the lowest expression observed at 0 h post-exposure (Figure 9A).
After 4-NP stress, the expression level of TrxR in the dsGFP-injected shrimp was significantly higher at 3 h and 6 h post-exposure than at 0 h (p < 0.05). In the dsTrx2-injected shrimp, there was no significant change in the expression level of LvTrxR during the whole process of 4-NP stress compared with that at 0 h stress (p > 0.05). Compared to the dsGFP shrimp, except for 1.5 h and 24 h, TrxR expression in the dsTrx2-injected group was lower than in the dsGFP-injected group (p < 0.05) (Figure 9B).
Grx2 expression levels in the dsGFP-injected shrimp significantly increased at 1.5 h post-exposure, followed by a continuous decrease from 6 to 24 h after stress, reaching its lowest level at 24 h (p < 0.05). With the increase in interference time, the Grx2 expression level first decreased and then increased. In the dsTrx2-injected shrimp, the expression level of LvGrx2 showed a significant decrease after 3 h of 4-NP stress (p < 0.05). There was no significant difference in the expression level from 0 to 6–12 h (p > 0.05), followed by a significant increase after 24 h of stress (p < 0.05). Compared with the control group (dsGFP-injected), the Grx2 expression level was significantly lower at 1.5 to 3 h while it was significantly higher than that at 6 and 24 h (p < 0.05) (Figure 9C).
In the dsGFP-injected shrimp, the expression level of Grx3 was significantly increased after 3 h of 4-NP stress (p < 0.05) but significantly decreased at 24 h post-exposure (p < 0.05). In the dsTrx2-injected shrimp, the expression level of Grx3 significantly decreased after 3 h of 4-NP stress (p < 0.05), followed by an upregulation from 12 to 24 h post-exposure (p < 0.05). Compared to the dsGFP group, the Grx3 expression level in dsTrx2-injected shrimp was significantly inhibited at 0–3 h post-exposure (p < 0.05), while it exhibited a significant increase after 24 h of stress (p < 0.05) (Figure 9D).
In the dsGFP-injected shrimp, the expression level of GPx was significantly decreased at 3, 6, and 24 h under 4-NP stress (p < 0.05). In dsTrx2-injected shrimp, the expression level of GPx significantly increased (p < 0.05) from 6 to 24 h under stress, reaching its peak at 6 h. Compared to the dsGFP group, the expression level of GPx in dsTrx2-injected shrimp was significantly lower at the initial stage of stress (1.5 h), whereas it showed a significant increase during 3–24 h of stress (p < 0.05) (Figure 9E).
In the dsGFP-injected shrimp, the GST expression levels were lower from 0 to 24 h exposure (p < 0.05). In the dsTrx2-injected shrimp, a significant increase was observed after 6 h of stress, while a significant decrease was observed at 24 h (p < 0.05). Compared to the dsGFP shrimp, the GST expression level in dsTrx2 shrimp was significantly higher at 1.5–12 h post-exposure (p < 0.05) (Figure 9F).

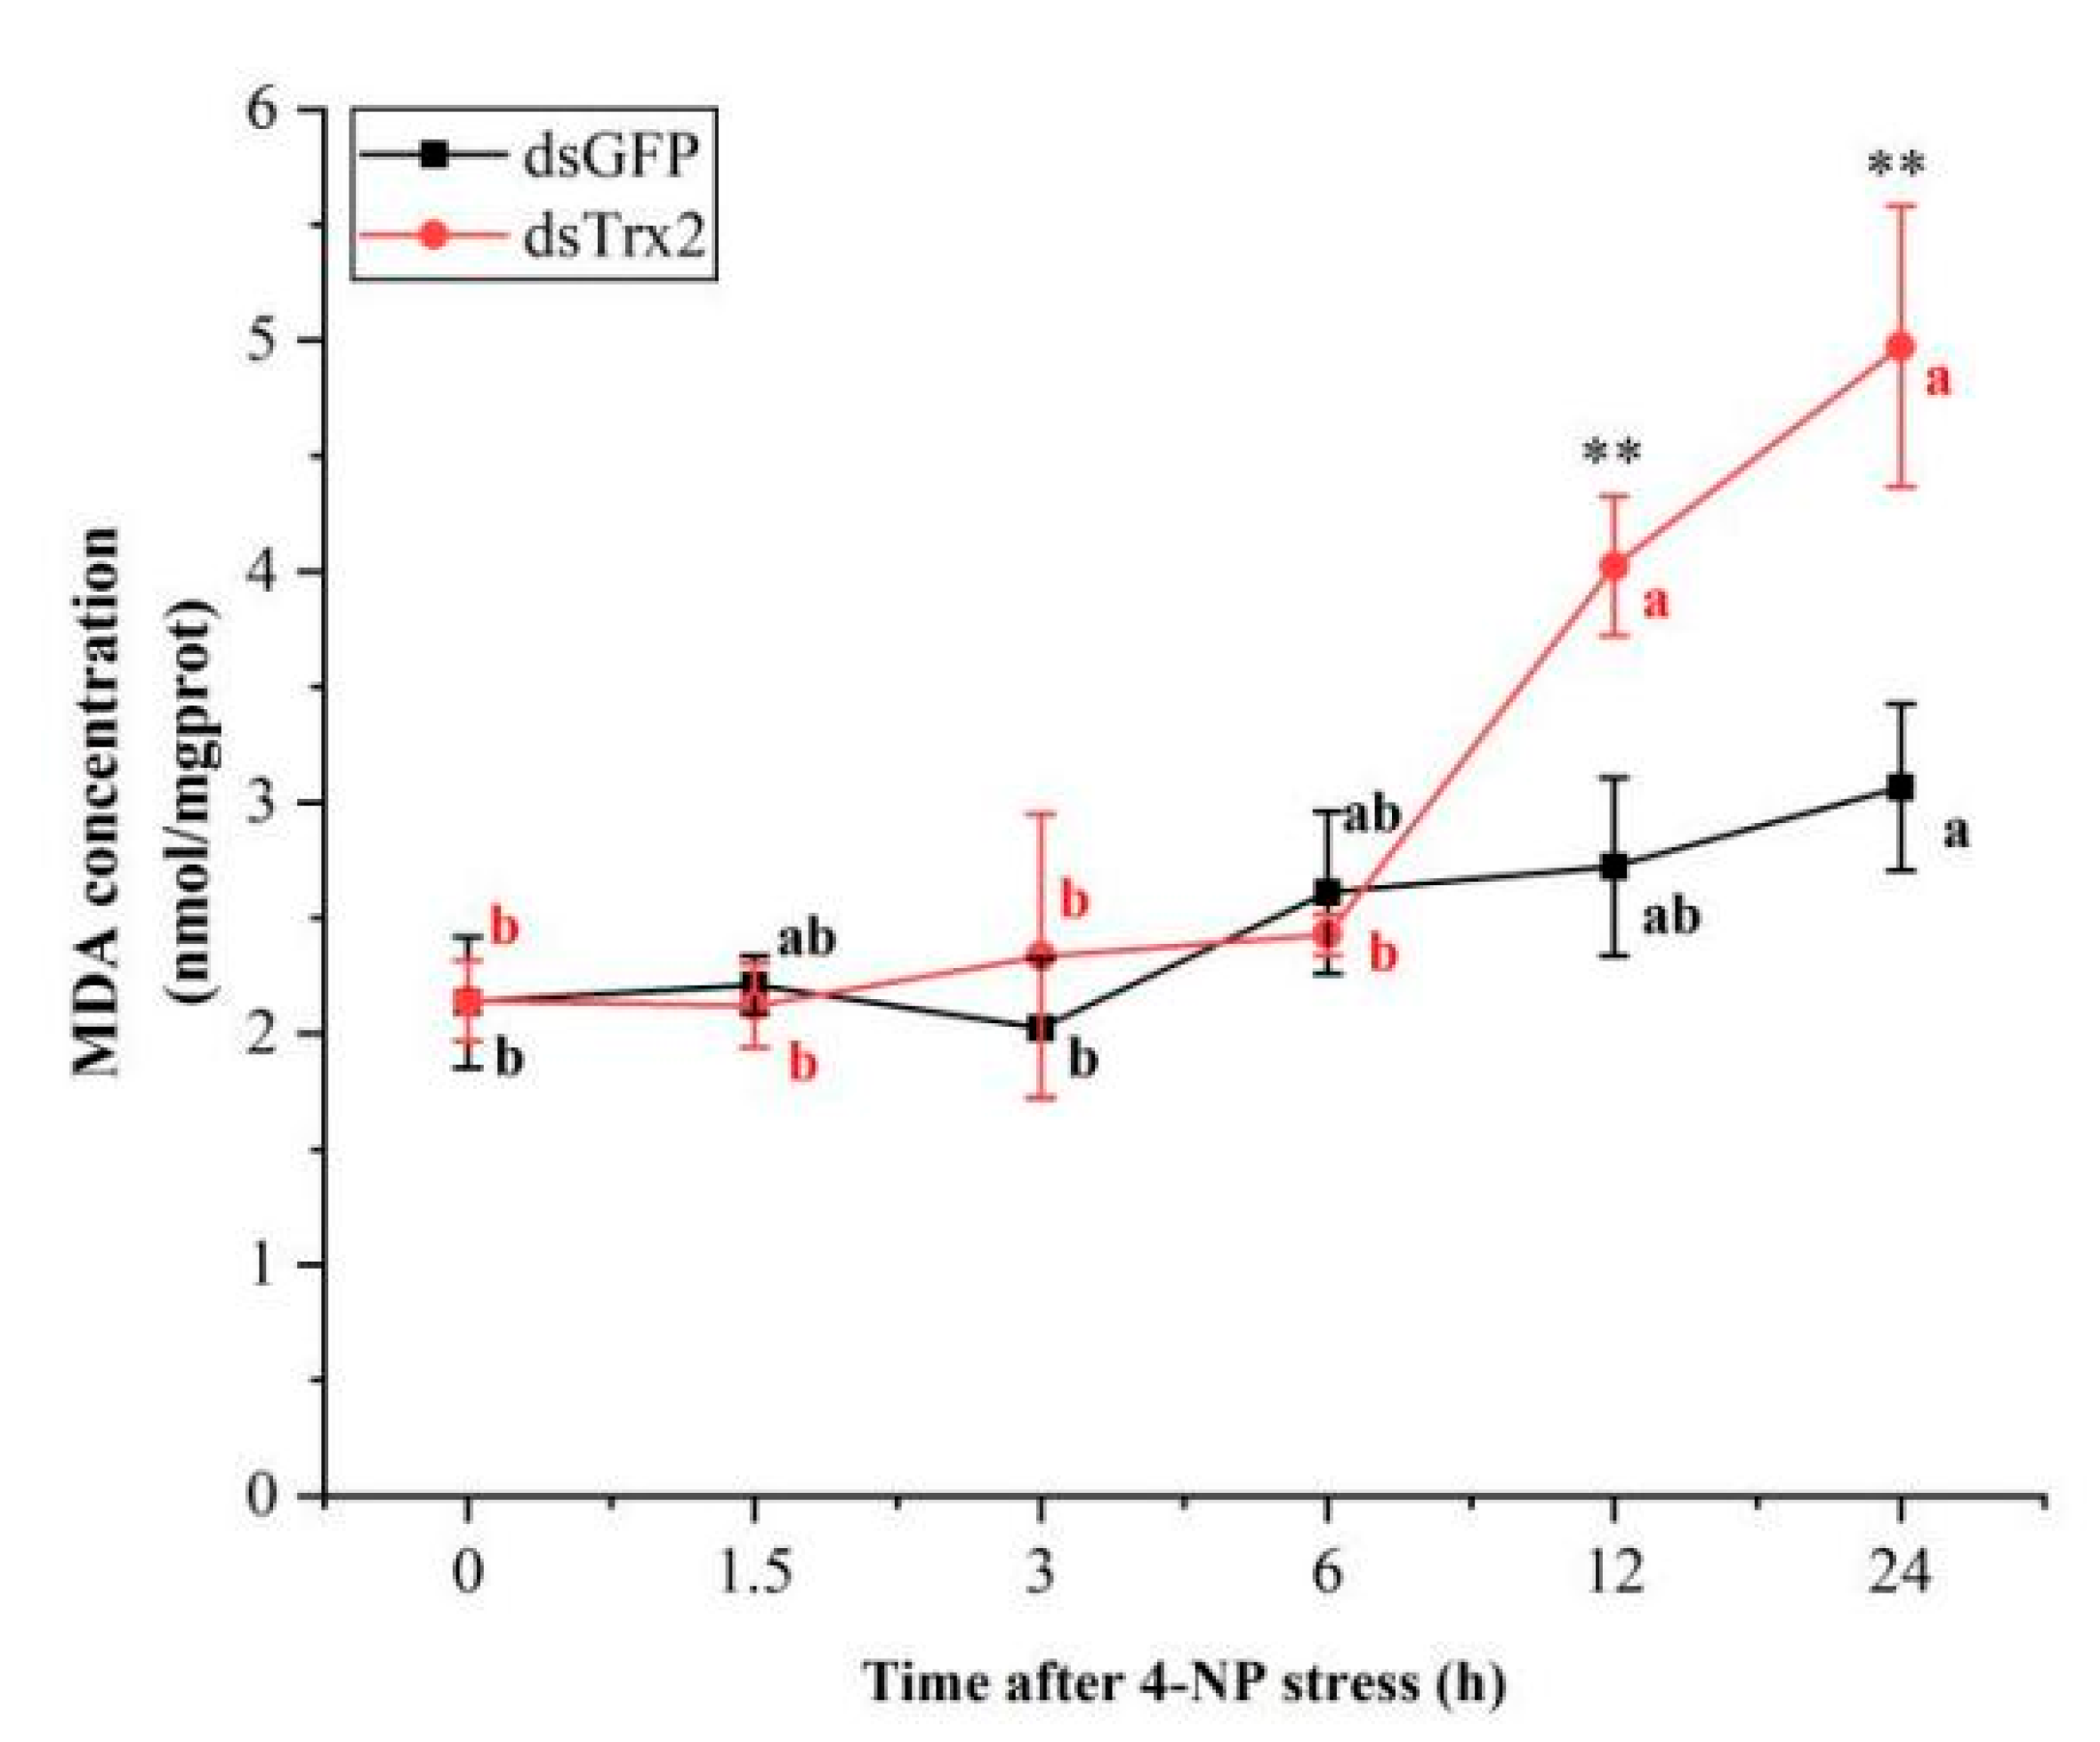
3.8. MDA Content in LvTrx2-Interfered Shrimp Under 4-NP Stress

In the dsGFP shrimp, the MDA content showed no significant change from 0 to 12 h of stress (p > 0.05), but it significantly increased at 24 h post-exposure (p < 0.05). In the dsTrx2 shrimp, the level of MDA content was significantly increased at 12 and 24 h after 4-NP stress (p < 0.05). Compared to the dsGFP shrimp, the MDA content in dsTrx2 shrimp was increased at 12 and 24 h post-exposure (p < 0.01) (Figure 10).

4. Discussion

The Trx system is a crucial mechanism in living organisms, governing cellular redox reactions and playing a pivotal role in maintaining redox homeostasis within the cell [27]. Trx and TrxR are essential components of this system. In this study, we cloned the full-length sequences of Trx2 and TrxR from L. vannamei, followed by subsequent molecular characterization analysis. The conserved domain and BLAST analyses revealed that the LvTrx2 protein belonged to the thioredoxin superfamily, exhibiting a highly stable active site sequence (W-C-G-P-C-K) that shares significant similarity with the Trx2 amino acid sequence of other species. Subcellular localization analysis shows that LvTrx2 possesses a mitochondrial targeting peptide, indicating its potential to enter mitochondria for functional purposes. In mammals, Trx has two distinct regulatory pathways: one is mediated by Trx1, predominantly localized in the cytoplasm and nucleus; the other is mediated by Trx2 found within mitochondria [11], consistent with previous results. The LvTrxR protein contains the conserved domain CVNVGC, which is unique to the TrxR family. Additionally, at the C-terminus of the LvTrxR protein, a GCUG sequence containing the rare amino acid Sec (U) exists as an active site incorporating Se. In the genetic code, the encoding of Sec is UGA, commonly used as a termination codon; if mRNA has a SElenoCysteine Insertion Sequence (SECIS), UGA becomes the encoding of Sec. Only a few enzymes contain this amino acid, such as TrxR, formate dehydrogenase, etc. Sec contains selenium alcohol groups that are more easily oxidized, and it has antioxidant activity in protein molecules [26].
The expression levels of LvTrx2 and LvTrxR were detected in all of the tested tissues (gill, hepatopancreas, eyestalk, intestine, muscle, and hemocytes), indicating their involvement in fundamental metabolic processes. These findings are consistent with the results obtained from other species. In Kuruma shrimp (Marsupenaeus japonicus), Trx expression was observed in all six tissues [28]. The transcription levels of Trx and Trx2 were detected in all six tissues examined in S. paramamosain [29]. The expression levels of both Trx and TrxR2 were found across all tissues of large yellow croaker (Larimichthys crocea) [30]. Although the presence of Trx2 and TrxR is widespread in various tissues and organs, their distribution exhibits distinct tissue specificity. M. japonicus Trx was highly expressed in the gill and intestine [28]. In S. paramamosain, Trx1 showed stronger expression in the gill and testis but displayed weaker expression in hemocytes [29], while Trx2 expression levels were highest in the gill and hepatopancreas [31], which is consistent with the findings of LvTrx2 in this study. In L. crocea, TrxR2 transcripts were highest in the gill and heart [30]. In the present study, LvTrx2 and LvTrxR showed the highest levels of expression in both the hepatopancreas and gill. Trx2 and TrxR exhibited different expression patterns in different tissues, which suggests that LvTrx2 and LvTrxR possess a diverse range of biological functions in various tissues and organs. The hepatopancreas plays significant roles in immune response, digestion, metabolism, and detoxification processes in crustaceans. Gills are one of the most vital organs in crustaceans, serving primarily for gas and ion exchange with the external environment. Due to contact with the external environment, gills are susceptible to pathogen infections and environmental stress. Damage to gill tissues can result in the death of crustaceans. The high expression levels of LvTrx2 and LvTrxR in the hepatopancreas and gill suggest their involvement in innate immunity and detoxification processes.
Trx plays an important role in defense against oxidative, hydrogen peroxide (H2O2) metabolism, immune response, anti-inflammatory, methionine sulfoxide reductases, transcription control, and signal transduction [11,32]. The first cloned rCcTrx1 protein possessed redox activity and protected against the oxidative damage of supercoiled DNA [33]. The overexpression of MjTrx in M. japonicus can increase the concentration of H2O2. MjTrx functioned in regulating redox homeostasis and shrimp antiviral immunity [28]. A different antioxidant response of Trx is elicited by the infectious hypodermal and hematopoietic necrosis (IHHNV) or white spot syndrome virus (WSSV) infectious process [34]. Different from Trx, TrxR is an essential player in antioxidant defenses, cellular redox systems, growth control, and selenium metabolism [35]. After selenium exposure in O. mykiss in vitro, TrxR was responsive to selenium exposure [18]. However, the functions of Trx2 and TrxR in L. vannamei were not explicated or elucidated. This study aimed to investigate the role of LvTrx2 and LvTrxR genes in mitigating environmental stress and pathogen infection by assessing their expression response under ammonia-N stress and LPS injection.
Ammonia-N, a prominent oxygen-consuming pollutant in aquatic environments, exerts detrimental effects on various aquatic organisms, including crustaceans, algae, and fish [36,37]. Ammonia-N induced metabolic and hematological dysfunction in Hong Kong oysters (Crassostrea hongkongensis) [38]. In L. vannamei, ammonia-N induced the injury of hepatopancreas and oxidative stress and increased the content of ROS [3]. In this study, the expression levels of LvTrx2 and LvTrxR genes in different tissues exhibited different response patterns in response to different stresses or stimuli. Similarly to the observations in the big-belly seahorse (H. abdominalis), HaTrx2 exhibited varying mRNA expression levels in response to immune challenges, which were dependent on both tissue type and time interval [20]. During ammonia-N stress, LvTrx2 from the hepatopancreas exhibited a rapid response, leading to a significant upregulation within 3 h. In gill tissues, no significant changes or a certain degree of inhibition were observed during the early stage of stress. It was not until 48 h that the expression level of LvTrx2 changed significantly. The molecular response of LvTrx2 in the hepatopancreas was more sensitive compared to that in the gill following exposure to ammonia-N. These findings imply that LvTrx2 plays a more significant role in the defense mechanisms of the hepatopancreas against ammonia-N stress compared to the gill. The hepatopancreas is a crucial organ involved in immune response, detoxification, and metabolism processes [39]. The upregulation of the LvTrx2 expression level in the hepatopancreas can protect this organ. The gene expression level of LvTrxR was highly sensitive to ammonia-N stress. In the early stage of stress, the expression level of LvTrxR in the hepatopancreas and gills was significantly induced, followed by inhibition in the middle stage and subsequent re-induced upregulation in the later stage. The stimulation of macrophage lines and primary macrophage cultures from rainbow trout (O. mykiss) with pathogen-associated molecular patterns (PAMPs) results in the transcriptional induction of both Trx and TrxR during infection [18], which is consistent with the findings reported in this study. These findings suggest that LvTrxR may play an important role in the early and later stages of ammonia-N stress. Upon exposure to ammonia-N, LvTrxR expression in the hepatopancreas was approximately 14 times higher in the stress group compared to that in the control group, which indicates that the antioxidant protective effect of LvTrxR on hepatopancreas may be significant at this juncture. The accumulation of ammonia-N in the hepatopancreas contributes to severe damage, necessitating a rapid upregulation of LvTrxR to facilitate oxidative repair processes for proteins within this organ.
LPS is an integral component in the outer membrane of Gram-negative bacteria. LPS can reduce the metabolic ability of exogenous substances, induce inflammation, and reduce antioxidant capacity [40]. In our study, after LPS injection, the response mode of LvTrx2 was different from that under ammonia-N stress. In hepatopancreas, the LvTrx2 expression level was initially suppressed and then rapidly upregulated. In the gill tissue, the sustained upregulation of LvTrx2 expression was observed in the mid-term. These findings indicate that LvTrx2 is involved in the immune response against Gram-negative bacterial infection. The response of LvTrx2 to the LPS challenge was more pronounced in the gill than in the hepatopancreas, with the highest relative expression level observed in the former. Similarly, the expression level of LvTrxR in the gill remained upregulated throughout the 48 h experiment, while in hepatopancreas, it significantly increased during the mid-term stage. When infected with LPS, LvTrxR plays an important role in the antioxidant defense process of gill, whereas it may contribute to antioxidant defense during the middle stage in hepatopancreas. Gill is an important organ for oxygen exchange in aquatic animals, which is crucial for their survival. The upregulation of LvTrx2 and TrxR in the gill would protect this pivotal organ involved in respiration.
When L. vannamei encounter oxidative stress, they regulate the expression levels of antioxidant enzyme genes and activate the activity of antioxidant enzymes to respond to adverse environments [41]. Based on our previous research findings, 4-NP stress can induce oxidative stress in both the hepatopancreas and gills of L. vannamei [39,42]. Notably, LvTrx2 exhibited significant upregulation in the hepatopancreas transcriptome under 4-NP stress. Therefore, LvTrx2 was knocked down in vivo to verify the defense mechanism against 4-NP stress. The results indicated that, in comparison to the GFP-interfered group (control), the transcriptional levels of LvTrx2 and LvTrxR were downregulated in LvTrx2-interfered shrimp. Both Trx2 and TrxR belong to the Trx system and have an interactive relationship with each other. The expression of Grx2 and Grx3 decreased before exhibiting an increase at a later stage. In contrast, significant upregulation in the mRNA expression levels of GPx and GST was observed at multiple exposure times. The synergistic interaction between the thioredoxin system and the glutathione system suggests that Trx interference can lead to alterations in the expression of glutathione-related genes, thereby inducing GST expression via oxidative stress signaling pathways [43]. The MDA contents in LvTrx2-interfered shrimp were higher than those in the control group at a later stage (12 h and 24 h) after stress, which indicates that LvTrx2 silencing increases the degree of oxidative damage. Trx interference can exacerbate lipid peroxidation and increase MDA levels [43]. These findings indicate a robust association between LvTrx2 expression and other antioxidant-related genes, while Grx2, Grx3, GPx, and GST appear to compensate for the function of LvTrx2. These results suggest that LvTrx2 plays an irreplaceable role in oxidative defense.

5. Conclusions

In this study, the full-length ORFs of LvTrx2 and LvTrxR were successfully cloned from L. vannamei belonging to the thioredoxin system. LvTrx2 and LvTrxR were expressed in all tested tissues, highly expressed in the hepatopancreas and gill. Through ammonia-N stress or LPS injection, the upregulation of the LvTrx2 expression level in hepatopancreas and gill was induced to varying degrees, which indicates that LvTrx2 is involved in the immune defense response process of stress resistance and antibacterial activity. Under ammonia-N stress and bacterial infection status, LvTrxR is involved in antioxidant defense processes in both hepatopancreas and gill. The LvTrx2 expression silence experiment revealed that under 4-NP stress, the suppression of LvTrx2 transcription caused an increase in the oxidative damage level in lipids and inhibited the expression levels of Trx2 and TrxR. Both Trx2 and TrxR belong to the Trx system and have an interactive relationship with each other. The expression levels of some antioxidant genes (e.g., Grx2, Grx3, GPx, and GST) were upregulated and may have a synergistic effect with LvTrx2, when LvTrx2 was suppressed, which can play a compensatory role but cannot completely replace the function of LvTrx2 and prove the importance of the defense function of LvTrx2 under 4-NP stress.

Supplementary Materials

The following supporting information can be downloaded at: https://www.mdpi.com/article/10.3390/ani15050629/s1.

Author Contributions

T.X.: writing—original draft preparation, investigation, data curation. P.-H.Z.: methodology, investigation, data curation, funding acquisition. K.-E.L.: writing—original draft preparation, investigation, data curation, software. X.-X.Z.: investigation, data curation. J.-T.L., Z.-L.Z., and W.-Y.H.: investigation. L.-M.Z.: supervision. Y.-P.L.: conceptualization, methodology, writing—reviewing and editing, supervision. J.-A.X.: conceptualization, writing—reviewing and editing, supervision, funding acquisition. All authors have read and agreed to the published version of the manuscript.

Funding

This research was supported by the Hainan Provincial Natural Science Foundation of China (No. 323MS085 & No. 324MS094), Social Public-Interest Scientific Institution Reform Special Fund (No. ITBBQDF2023006), and the Chinese Academy of Tropical Agricultural Sciences for Science and Technology Innovation Team of National Tropical Agricultural Science Center (No. CATASCXTD202416).

Institutional Review Board Statement

The animal protocol utilized in this study was authorizedby the Animal Ethics Committee of the Institute of Tropical Biosciences and Biotechnology, Chinese Academy of Tropical Agricultural Sciences (Protocol code ITBB20240203 and date of November 2024).

Informed Consent Statement

Not applicable.

Data Availability Statement

The partial data analyzed in this study are available from the corresponding author upon reasonable request.

Conflicts of Interest

The authors declare no conflict of interest.

References

  1. FAO. The State of World Fisheries and Aquaculture 2022; Towards Blue Transformation; FAO: Rome, Italy, 2022. [Google Scholar]
  2. CAFS. China Fishery Statistical Yearbook; Ministry of Agriculture and Rural Affairs: Beijing, China, 2022. [Google Scholar]
  3. Wang, F.F.; Huang, L.; Liao, M.Q.; Dong, W.N.; Liu, C.; Zhuang, X.Q.; Liu, Y.; Yin, X.L.; Liang, Q.J.; Wang, W.N. Pva-miR-252 participates in ammonia nitrogen-induced oxidative stress by modulating autophagy in Penaeus vannamei. Ecotoxicol. Environ. Saf. 2021, 225, 112774. [Google Scholar] [CrossRef] [PubMed]
  4. Duarte-Restrepo, E.; Jaramillo-Colorado, B.E.; Duarte-Jaramillo, L. Effects of chlorpyrifos on the crustacean Litopenaeus vannamei. PLoS ONE 2020, 15, e0231310. [Google Scholar] [CrossRef] [PubMed]
  5. Frías-Espericueta, M.G.; Abad-Rosales, S.; Nevárez-Velázquez, A.C.; Osuna-López, I.; Páez-Osuna, F.; Lozano-Olvera, R.; Voltolina, D. Histological effects of a combination of heavy metals on Pacific white shrimp Litopenaeus vannamei juveniles. Aquat. Toxicol. 2008, 89, 152–157. [Google Scholar] [CrossRef] [PubMed]
  6. Wang, Z.L.; Qu, Y.X.; Yan, M.T.; Li, J.Y.; Zou, J.X.; Fan, L.F. Physiological Responses of Pacific White Shrimp Litopenaeus vannamei to Temperature Fluctuation in Low-Salinity Water. Front. Physiol. 2019, 10, 1025. [Google Scholar] [CrossRef] [PubMed]
  7. Kır, M.; Sunar, M.C.; Topuz, M.; Sarıipek, M. Thermal acclimation capacity and standard metabolism of the Pacific white shrimp Litopenaeus vannamei (Boone, 1931) at different temperature and salinity combinations. J. Therm. Biol. 2023, 112, 103429. [Google Scholar] [CrossRef]
  8. Han, S.Y.; Wang, B.J.; Liu, M.; Wang, M.Q.; Jiang, K.Y.; Liu, X.W.; Wang, L. Adaptation of the white shrimp Litopenaeus vannamei to gradual changes to a low-pH environment. Ecotoxicol. Environ. Saf. 2018, 149, 203–210. [Google Scholar] [CrossRef]
  9. Powis, G.; Kirkpatrick, D.L. Thioredoxin signaling as a target for cancer therapy. Curr. Opin. Pharmacol. 2007, 7, 392–397. [Google Scholar] [CrossRef]
  10. Jia, J.J.; Xu, G.T.; Zhu, D.S.; Liu, H.J.; Zeng, X.S.; Li, L. Advances in the Functions of Thioredoxin System in Central Nervous System Diseases. Antioxid. Redox Signal. 2023, 38, 425–441. [Google Scholar] [CrossRef]
  11. Lu, J.; Holmgren, A. The thioredoxin antioxidant system. Free Radic. Biol. Med. 2014, 66, 75–87. [Google Scholar] [CrossRef]
  12. Vlamis-Gardikas, A.; Holmgren, A. Thioredoxin and glutaredoxin isoforms. Meth. Enzymol. 2002, 347, 286–296. [Google Scholar]
  13. Hirota, K.; Nakamura, H.; Masutani, H.; Yodoi, J. Thioredoxin superfamily and thioredoxin-inducing agents. Ann. N. Y. Acad. Sci. 2002, 957, 189–199. [Google Scholar] [CrossRef] [PubMed]
  14. Zhang, J. The Mitochondrial Thioredoxin Is Required for Liver Development in Zebrafish. Ph.D. Thesis, Huazhong University of Science and Technology, Wuhan, China, 2013. [Google Scholar]
  15. Kim, D.H.; Kim, J.W.; Jeong, J.M.; Park, H.J.; Park, C.I. Molecular cloning and expression analysis of a thioredoxin from rock bream, Oplegnathus fasciatus, and biological activity of the recombinant protein. Fish Shellfish Immunol. 2011, 31, 22–28. [Google Scholar] [CrossRef] [PubMed]
  16. Santhekadur, P.K. Annual Reviews of Biochemistry. Curr. Sci. 2020, 118, 2000–2001. [Google Scholar]
  17. Hasan, A.A.; Kalinina, E.; Tatarskiy, V.; Shtil, A. The Thioredoxin System of Mammalian Cells and Its Modulators. Biomedicines 2022, 10, 1757. [Google Scholar] [CrossRef] [PubMed]
  18. Pacitti, D.; Wang, T.; Martin, S.A.; Sweetman, J.; Secombes, C.J. Insights into the fish thioredoxin system: Expression profile of thioredoxin and thioredoxin reductase in rainbow trout (Oncorhynchus mykiss) during infection and in vitro stimulation. Dev. Comp. Immunol. 2014, 42, 261–277. [Google Scholar] [CrossRef] [PubMed]
  19. Gu, S.W.; Zheng, X.B.; Gao, X.M.; Liu, Y.; Chen, Y.E.; Zhu, J.Q. Cadmium-Induced Oxidative Damage and the Expression and Function of Mitochondrial Thioredoxin in Phascolosoma esculenta. Int. J. Mol. Sci. 2024, 25, 13283. [Google Scholar] [CrossRef]
  20. Nadarajapillai, K.; Sellaththurai, S.; Liyanage, D.S.; Yang, H.; Lee, J. Molecular and functional explication of thioredoxin mitochondrial-like protein (Trx-2) from big-belly seahorse (Hippocampus abdominalis) and expression upon immune provocation. Fish Shellfish Immunol. 2020, 99, 495–504. [Google Scholar] [CrossRef]
  21. Xu, Z.H.; Liu, J.; Wang, E.M.; Zhao, C.Y.; Hu, X.L.; Chu, K.H.; Wang, L. Detoxification and recovery after cadmium exposure in the freshwater crab Sinopotamon henanense. Environ. Sci. Pollut. Res. Int. 2021, 28, 58050–58067. [Google Scholar] [CrossRef]
  22. Lin, Y.C.; Chen, J.C. Acute toxicity of ammonia on Litopenaeus vannamei Boone juveniles at different salinity levels. J. Exp. Mar. Biol. Ecol. 2001, 259, 109–119. [Google Scholar] [CrossRef]
  23. Duan, Y.F.; Wang, Y.; Zhang, J.S.; Liu, Q.S.; Ding, X. Morphologic, digestive enzymes and immunological responses of intestine from Litopenaeus vannamei after lipopolysaccharide injection. J. Invertebr. Pathol. 2018, 153, 186–194. [Google Scholar] [CrossRef]
  24. Livak, K.; Schmittgen, T. Analysis of Relative Gene Expression Data using Real-Time Quantitative PCR and the 2(-Delta Delta C(T)) Method. Methods 2001, 25, 402–408. [Google Scholar] [CrossRef] [PubMed]
  25. Xian, J.A.; Zhang, X.X.; Guo, H.; Wang, D.M.; Wang, A.L. Cellular responses of the tiger shrimp Penaeus monodon haemocytes after lipopolysaccharide injection. Fish Shellfish Immunol. 2016, 54, 385–390. [Google Scholar] [CrossRef] [PubMed]
  26. Alim, I.; Caulfield, J.T.; Chen, Y.; Swarup, V.; Geschwind, D.H.; Ivanova, E.; Seravalli, J.; Ai, Y.; Sansing, L.H.; Ste.Marie, E.J.; et al. Selenium Drives a Transcriptional Adaptive Program to Block Ferroptosis and Treat Stroke. Cell 2019, 177, 1262–1279. [Google Scholar] [CrossRef] [PubMed]
  27. Xinastle-Castillo, L.O.; Landa, A. Physiological and modulatory role of thioredoxins in the cellular function. Open Med. 2022, 17, 2021–2035. [Google Scholar] [CrossRef]
  28. Guo, N.N.; Sun, X.J.; Xie, Y.K.; Yang, G.W.; Kang, C.J. Cloning and functional characterization of thioredoxin gene from kuruma shrimp Marsupenaeus japonicus. Fish Shellfish Immunol. 2019, 86, 429–435. [Google Scholar] [CrossRef]
  29. Hu, J.H. Study on Thioredoxin System and Severalgenes Related to Antioxidant in Mud Crab, Scylla paramam. Master’s Thesis, Shanghai Ocean University, Shanghai, China, 2014. [Google Scholar]
  30. Chen, M.N. Identification and Function Analysis of Thioredoxin and Thioredoxin Reductase from Larimichthys crocea. Master’s Thesis, Zhejiang Ocean University, Zhoushan, China, 2018. [Google Scholar]
  31. Hu, J.H.; Zhang, F.Y.; Jiang, K.J.; Fang, Y.B.; Wang, J.; Zhao, M.; Qiao, Z.G.; Ma, L.B. Molecular characterization of thioredoxin-1 and thioredoxin reductase activity in mud crab Scylla paramamosain. Genet. Mol. Res. 2014, 13, 10241–10255. [Google Scholar] [CrossRef]
  32. Pannala, V.R.; Dash, R.K. Mechanistic characterization of the thioredoxin system in the removal of hydrogen peroxide. Biophys. J. 2015, 108, 610a–611a. [Google Scholar] [CrossRef]
  33. Ruan, Z.L.; Liu, G.Y.; Guo, Y.F.; Zhou, Y.H.; Wang, Q.Q.; Chang, Y.L.; Wang, B.L.; Zheng, J.M.; Zhang, L.M. First report of a thioredoxin homologue in jellyfish: Molecular cloning, expression and antioxidant activity of CcTrx1 from Cyanea capillata. PLoS ONE 2017, 9, e97509. [Google Scholar] [CrossRef]
  34. Garcia-Orozco, K.D.; Sanchez-Paz, A.; Aispuro-Hernandez, E.; Gomez-Jimenez, S.; Lopez-Zavala, A.; Araujo-Bernal, S.; Muhlia-Almazan, A. Gene expression and protein levels of thioredoxin in the gills from the whiteleg shrimp (Litopenaeus vannamei) infected with two different viruses: The WSSV or IHHNV. Fish Shellfish Immunol. 2012, 32, 1141–1147. [Google Scholar] [CrossRef]
  35. Bjørklund, G.; Zou, L.; Peana, M.; Chasapis, C.T.; Hangan, T.; Lu, J.; Maes, M. The Role of the Thioredoxin System in Brain Diseases. Antioxidants 2022, 11, 2161. [Google Scholar] [CrossRef]
  36. Lin, W.; Wu, J.Y.; Luo, H.M.; Liu, X.L.; Cao, B.B.; Hu, F.; Liu, F.; Yang, J.F.; Yang, P.H. Sub-chronic ammonia exposure induces hepatopancreatic damage, oxidative stress, and immune dysfunction in red swamp crayfish (Procambarus clarkii). Ecotoxicol. Environ. Saf. 2023, 254, 114724. [Google Scholar] [CrossRef] [PubMed]
  37. Liu, S.Y.; Luo, L.; Zuo, F.Y.; Huang, X.L.; Zhong, L.; Liu, S.; Geng, Y.; Ou, Y.P.; Chen, D.F.; Cai, W.L.; et al. Ammonia nitrogen stress damages the intestinal mucosal barrier of yellow catfish (Pelteobagrus fulvidraco) and induces intestinal inflammation. Front. Physiol. 2023, 14, 1279051. [Google Scholar] [CrossRef] [PubMed]
  38. Lu, J.; Yao, T.; Shi, S.K.; Ye, L.T. Effects of acute ammonia nitrogen exposure on metabolic and immunological responses in the Hong Kong oyster Crassostrea hongkongensis. Ecotoxicol. Environ. Saf. 2022, 237, 113518. [Google Scholar] [CrossRef] [PubMed]
  39. Yu, D.J.; Zhai, Y.F.; He, P.M.; Jia, R. Comprehensive Transcriptomic and Metabolomic Analysis of the Litopenaeus vannamei Hepatopancreas After WSSV Challenge. Front. Immunol. 2022, 13, 826794. [Google Scholar] [CrossRef]
  40. Wang, Z.L.; Wu, Q.P.; Liao, G.W.; Fan, L.F. New insights into the regulation mechanism of Litopenaeus vannamei hepatopancreas after lipopolysaccharide challenge using transcriptome analyses. Fish Shellfish Immunol. 2022, 128, 466–473. [Google Scholar] [CrossRef]
  41. Guo, H.; Xian, J.A.; Li, B.; Ye, C.X.; Wang, A.L.; Miao, Y.T.; Liao, S.A. Gene expression of apoptosis-related genes, stress protein and antioxidant enzymes in hemocytes of white shrimp Litopenaeus vannamei under nitrite stress. Comp. Biochem. Physiol. C Toxicol. Pharmacol. 2013, 157, 366–371. [Google Scholar] [CrossRef]
  42. Su, X.B.; Li, T.; Zhu, X.W.; Zheng, P.H.; Pan, H.K.; Guo, H. Exploring the impact of nonylphenol exposure on Litopenaeus vannamei at the histological and molecular levels. Ecotoxicol. Environ. Saf. 2024, 279, 116475. [Google Scholar] [CrossRef]
  43. Holmgren, A.; Lu, J. Thioredoxin and thioredoxin reductase: Current research with special reference to human disease. Biochem. Biophys. Res. Commun. 2010, 396, 120–124. [Google Scholar] [CrossRef]
Figure 1. Nucleotide and amino acid sequences of L. vannamei Trx2 gene. The letters in the box represent the initiation codon (ATG) and a termination codon (TAG), while the underlined region indicates the polyadenylation signal sequence (AATAAA). The conserved domain (W-C-G-P-C-K) is highlighted in gray, and two relatively non-conservative histidine residues (H) are displayed in red font. * indicates translation termination.
Animals 15 00629 g001
Figure 2. Nucleotide and amino acid sequences of L. vannamei TrxR gene. The letters in the box indicate the initiation codon (ATG) and the termination codon (TAG). The conserved domains C-V-N-V-G-C and G-C-U-G are highlighted in gray. * indicates translation termination.
Animals 15 00629 g002
Figure 3. Multiple sequence alignments of LvTrx2 (A) and LvTrxR (B). The blue region indicates that all sequences share the same amino acid residue. The square shows the conserved domain of LvTrx2 and LvTrxR. The blue region indicates all sequences shared the same amino acid residue, the green region indicates all sequences shared ≥75% of the same amino acid residue, and the yellow region indicates all sequences shared ≥50% of the same amino acid residue.
Animals 15 00629 g003
Figure 4. Phylogenetic analysis of L. vannamei LvTrx2 (A) and LvTrxR (B).
Animals 15 00629 g004
Figure 5. Expression levels of LvTrx2 (A) and LvTrxR (B) genes in different tissues of L. vannamei. Data in the same group with different letters are significantly different (p < 0.05).
Animals 15 00629 g005
Figure 6. Expression levels of LvTrx2 in the hepatopancreas (A) and gill (B) and LvTrxR in the hepatopancreas (C) and gill (D) of L. vannamei under ammonia-N stress. Statistical significance was calculated using SPSS 18.0 (* stands for p < 0.05, ** stands for p < 0.01, *** stands for p < 0.001).
Animals 15 00629 g006
Figure 7. Expression levels of LvTrx2 in the hepatopancreas (A) and gill (B) and LvTrxR in the hepatopancreas (C) and gill (D) of L. vannamei after LPS injection. Statistical significance was calculated using SPSS 18.0 (* stands for p < 0.05, ** stands for p < 0.01, *** stands for p < 0.001).
Animals 15 00629 g007
Figure 8. The quality of dsRNA synthesized in vitro (A) and the silencing efficiency of LvTrx2 dsRNA injection (B). Statistical significance was calculated using SPSS 18.0 (** stands for p < 0.01, *** stands for p < 0.001).
Animals 15 00629 g008
Figure 9. Expression levels of LvTrx2 (A), LvTrxR (B), Grx2 (C), Grx3 (D), GPx (E), and GST (F) in the hepatopancreas of LvTrx2-interfered shrimp were detected under 4-NP stress (n = 9). Significant differences between the dsTrx2 and dsGFP groups at the same exposure time are indicated by asterisks (* stands for p < 0.05, ** stands for p < 0.01, *** stands for p < 0.001). Data in the same group with different letters are significantly different (p < 0.05).
Animals 15 00629 g009
Figure 10. Time course of MDA contents in LvTrx2-interfered shrimp under 4-NP stress (n = 9). Significant differences between dsTrx2- and dsGFP-injected shrimp at the same exposure time are indicated with asterisks (** p < 0.01). Data in the same group with different letters are significantly different (p < 0.05).
Animals 15 00629 g010
Table 1. The sequences of the primers used in the present study.
PrimersGene IDSequences (5′–3′)
Trx2-F1XM_027353791.2ATTCTTCAACTCCTGTCGTG
Trx2-R1TCTCCAATCAGCCTGCC
TrxR-F1XM_027357384.1GCTCCCGTGACCCTCAGTAA
TrxR-R1CCAATGTGGTTTTGAATGCCTT
Trx2-3′F1 ATTCTTCAACTCCTGTCGTG
Trx2-5′R1 TGCCGACAAATGACTCAATCCG
TrxR-3′F1 AATGTGCCTACTACAGTGTTTACCCC
TrxR-5′R1 GCACATTGCCATAGTCGGTCAGC
3′RACE Outer Primer TACCGTCGTTCCACTAGTGATTT
UPM long primer CTAATACGACTCACTATAGGGCAAGCAGTGGTATCAACGCAGAGT
Short primerCTAATACGACTCACTATAGGGC
Trx2-RT-F1 TGATAAGCAGCCTGATGGTG
Trx2-RT-R1 GCCTTGTTTCTGTTCCTCCA
TrxR-RT-F1 GTCGTCTGTTCCCCACATCTAT
TrxR-RT-R1 GCACATTGCCATAGTCGGTC
Trx2i-F (with T7)GGATCCTAATACGACTCACTATAGGTCAGCGACGAATAGGGC
Trx2i-F TCAGCGACGAATAGGGC
Trx2i-R (with T7)GGATCCTAATACGACTCACTATAGGCAACATTTACGGAAGAGGGA
Trx2i-R CAACATTTACGGAAGAGGGA
GFPi-F (with T7)TAATACGACTCACTATAGGGAGAGTGCCCATCCTGGTCGAGCT
GFPi-F GTGCCCATCCTGGTCGAGCT
GFPi-R (with T7)TAATACGACTCACTATAGGGAGATGCACGCTGCCGTCCTCGAT
GFPi-R TGCACGCTGCCGTCCTCGAT
Trx1-FXM_027377405.2TTAACGAGGCTGGAAACA
Trx1-RAACGACATCGCTCATAGA
Grx2-FMG757219TGATAAGCAGCCTGATGGTG
Grx2-RGCCTTGTTTCTGTTCCTCCA
Grx 3-FXM_070127026.1TTCAGCCGCACAACCATA
Grx 3-RAGTCCTTGTCGCACTTCCTC
GPx-FAY973252AGGGACTTCCACCAGATG
GPx-RCAACAACTCCCCTTCGGTA
GST-FAY573381AAGATAACGCAGAGCAAGG
GST-RTCGTAGGTGACGGTAAAGA
MGST3-FXM_027382186.2TGTGCCGTTGGTGGTGC
MGST3-RCAAGGAGCCCAGTAGCAAAAC
β-Actin FAF300705AACAGCGACTCCCGACAGA
β-Actin RCCTTGGACCTAGTAATTTGCATG
Those underlined are the sequences of the T7 promoter.
Disclaimer/Publisher’s Note: The statements, opinions and data contained in all publications are solely those of the individual author(s) and contributor(s) and not of MDPI and/or the editor(s). MDPI and/or the editor(s) disclaim responsibility for any injury to people or property resulting from any ideas, methods, instructions or products referred to in the content.

