1. Introduction
External morphology and cranial traits are important criteria for classifying small mammals [
1]. The Daurian ground squirrel (
Spermophilus dauricus, Brandt, 1844) is widely distributed in Mongolia, Russia, regions north of the Yellow River, and Northeast China. Owing to its seasonal body fat accumulation and hibernation behavior, it has become a key animal model in physiological ecology studies in China. However, there has long been controversy over the subspecific classification of
S. dauricus, and researchers often confuse it with its close relatives. This is largely due to a lack of systematic research on the variation in its morphological traits. Currently, four subspecies are generally recognized [
2]:
S. d. dauricus occurs in Russia and Mongolia, although some scholars argue that its distribution extends into China, ranging from southeast Inner Mongolia to the Greater Khingan Mountains [
3]. The remaining three subspecies—
S. d. ramosus,
S. d. mongolicus, and
S. d. obscurus—are endemic to China.
The ground squirrels in Beijing were described as
S. d. mongolicus Milne-Edwards, 1867. This subspecies was once classified under
Citellus dauricus Allen, 1940 [
4], who also noted that it should be conspecific with
C. mongolicus umbratus Thomas, 1908 [
5]. Those in Jilin were described as
C. m. ramosus Thomas, 1909. However, Bannikov considered mongolicus and ramosus forms to be the same subspecies, recognizing only two subspecies:
C. d. dauricus and
C. d. mongolicus. In contrast, Gromov recognized only
C. d. ramosus. Additionally, another subspecies,
C. d. yamashinai Kuroda, 1939, was recorded with a type locality in northern Manzhouli, Inner Mongolia, China [
6], but this form was not mentioned in some of the most complete species descriptions [
7,
8].
Chinese scholars also hold divergent views on its subspecific classification. A comprehensive review of Chinese mammals revealed three subspecies of
S. dauricus within China:
S. d. ramosus, distributed in Heilongjiang, Jilin, Liaoning, eastern Inner Mongolia, and Shanxi;
S. d. mongolicus, distributed in Beijing, Hebei, Tianjin, Henan and Shandong; and
S. d. obscurus, distributed in northwestern Gansu and Xinjiang [
2]. However, the China Biodiversity Red List states that
S. dauricus occurs in areas north of Hebei, Inner Mongolia, and Northeast China, with no mention of its presence in northwestern China [
9]. Another study classified ground squirrels in northwestern regions as Pallid ground squirrels (
S. pallidicauda) rather than
S. dauricus [
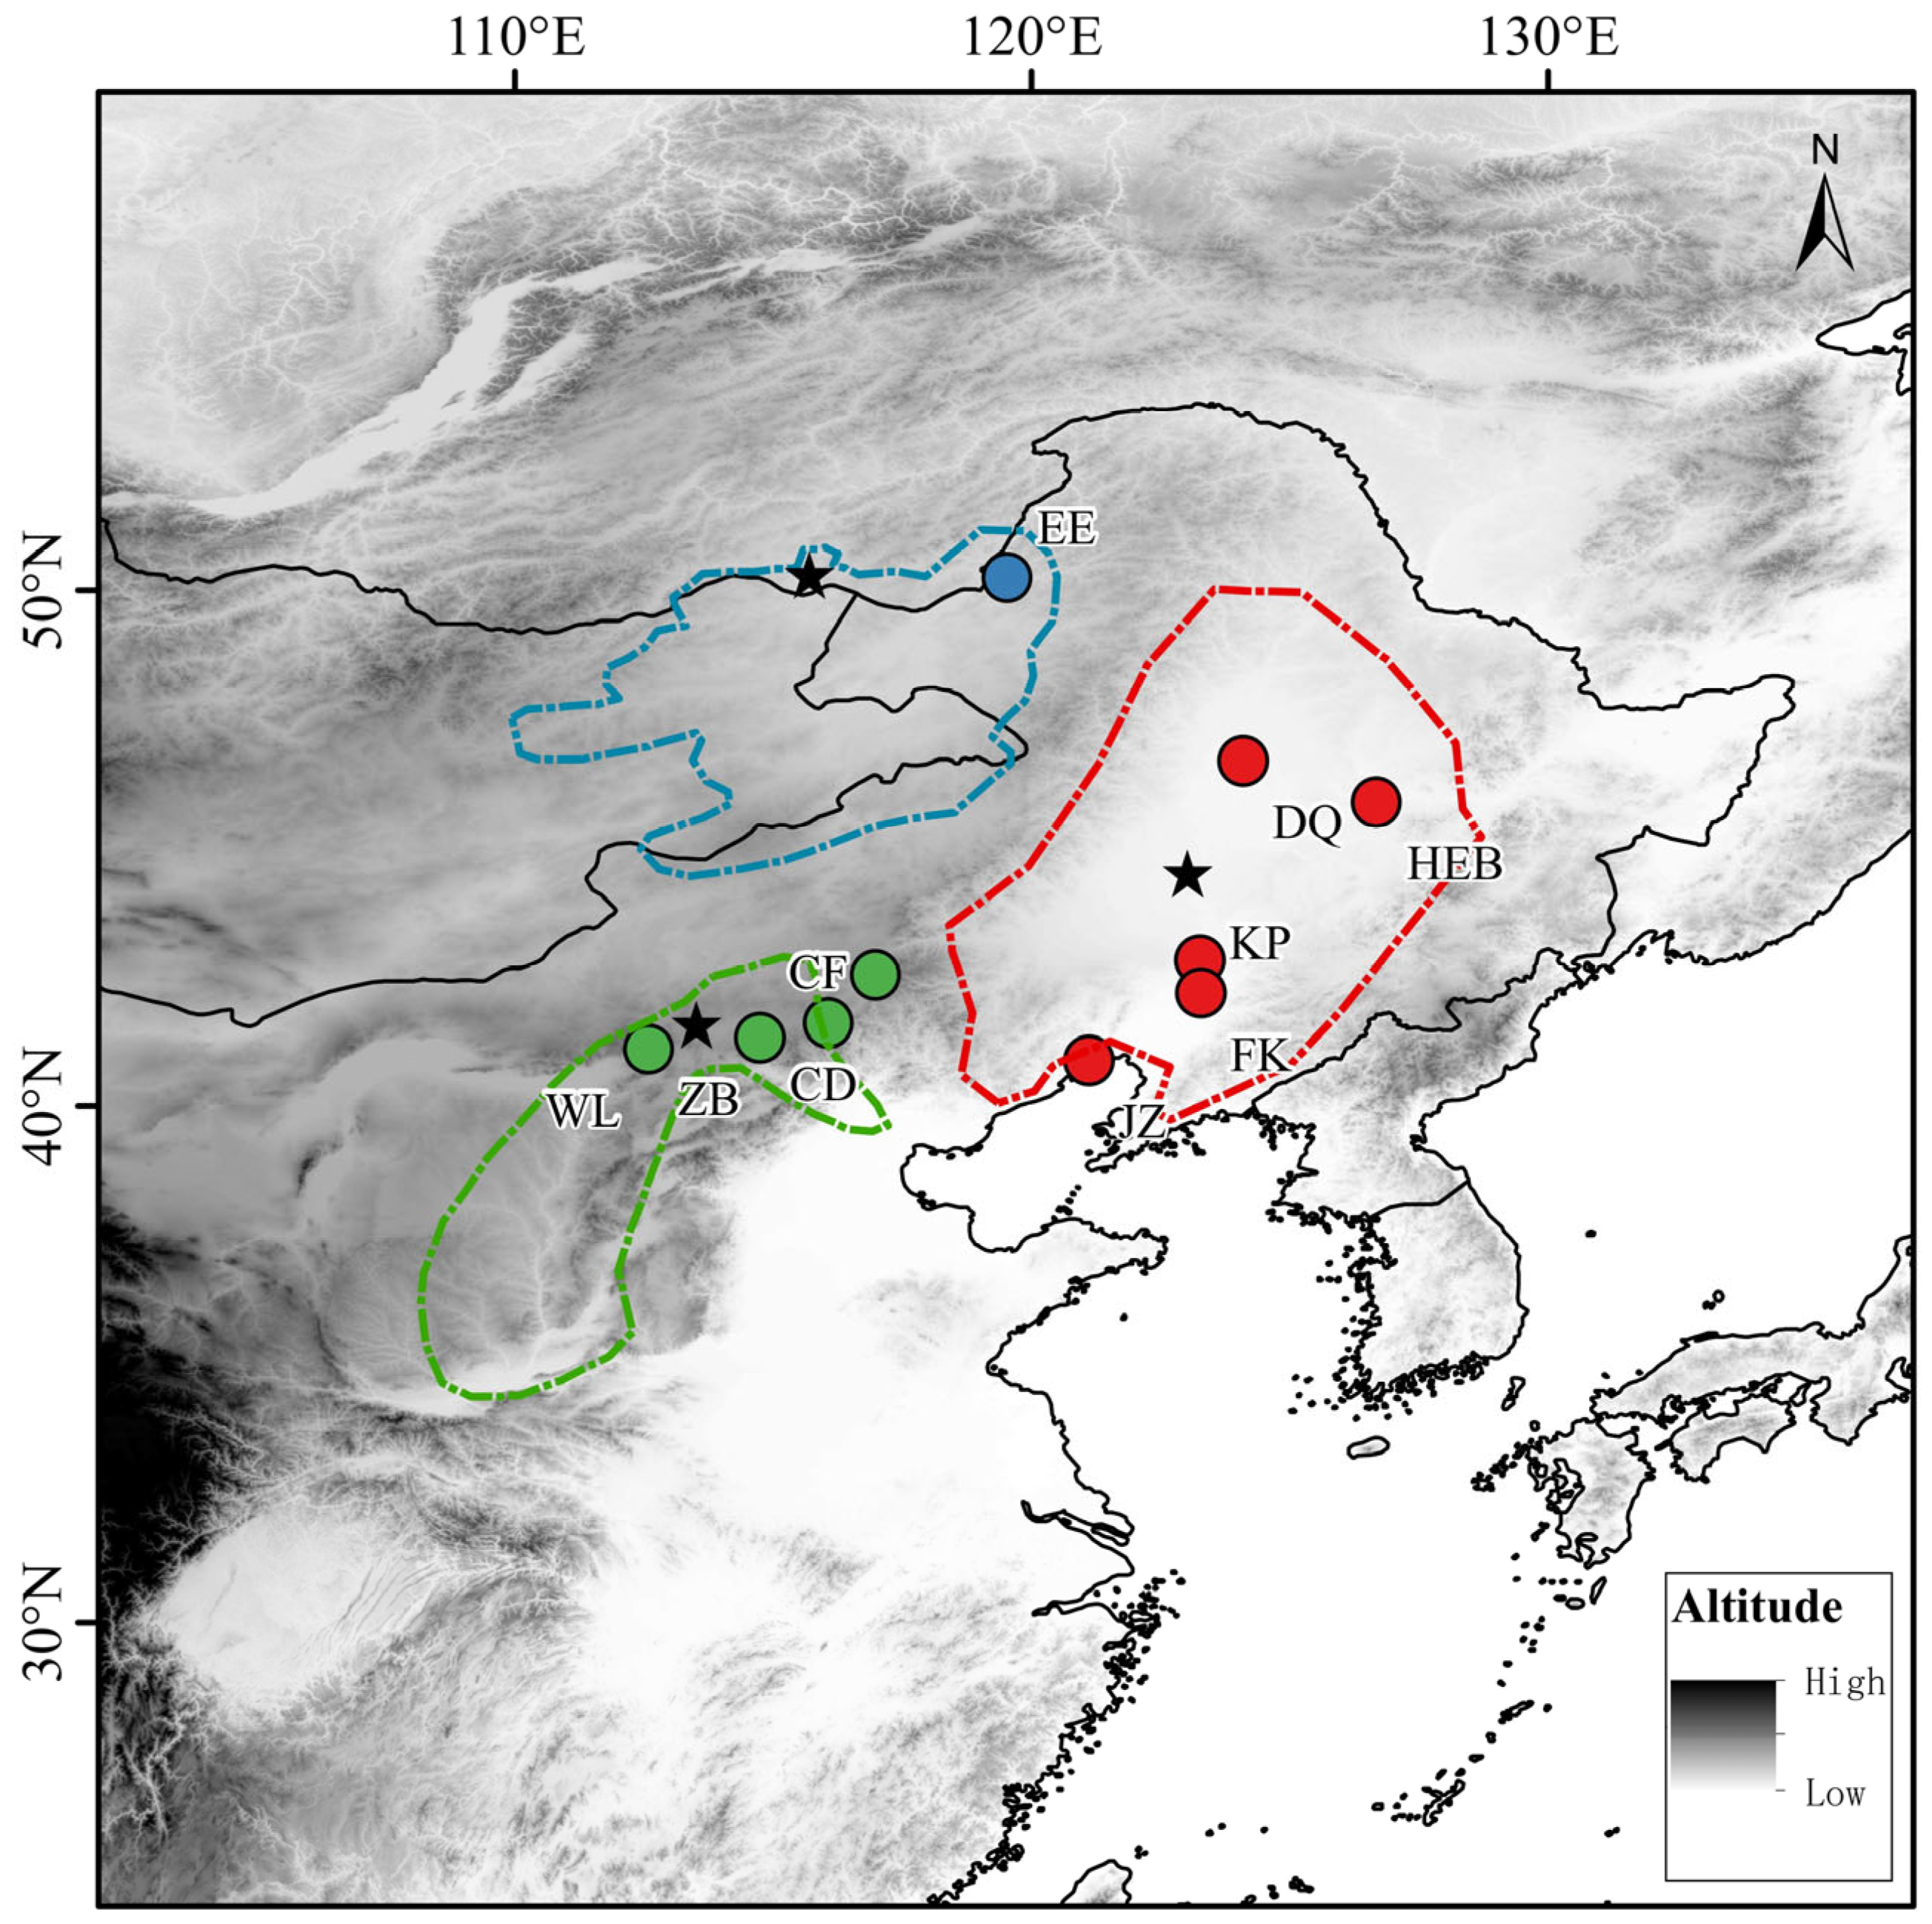
10]. Given these inconsistencies, this study focuses on whether geographic populations in northeastern Inner Mongolia, the Northeast Plain, and Hebei exhibit subspecific and morphological differentiation; thus, no samples were collected from Gansu, Xinjiang, or other regions. Notably, authoritative global mammal monographs do not recognize subspecies of
S. dauricus, treating all proposed subspecies as synonyms of “dauricus” [
11].
On the basis of molecular evidence, Russian scholars have hypothesized that the
S. dauricus population distributed in China should be divided into three populations: the Inner Mongolia population, the Northeast population and the Hebei population [
3]. They also suggested conducting extensive sampling within China to verify this hypothesis. Although scholars have different views on the subspecific classification of
S. dauricus, no existing studies have conducted systematic morphological measurements and statistical analyses of
S. dauricus in different geographical populations. Given the above situation, this study aims to clarify the phenotypic differentiation characteristics of different geographical populations of
S. dauricus through systematic analysis of morphological data, with the aim of filling the gap in the morphological data of this species’ subspecific classification and providing support for further clarifying the subspecific classification relationships of this species.
3. Results
3.1. Basic Statistics
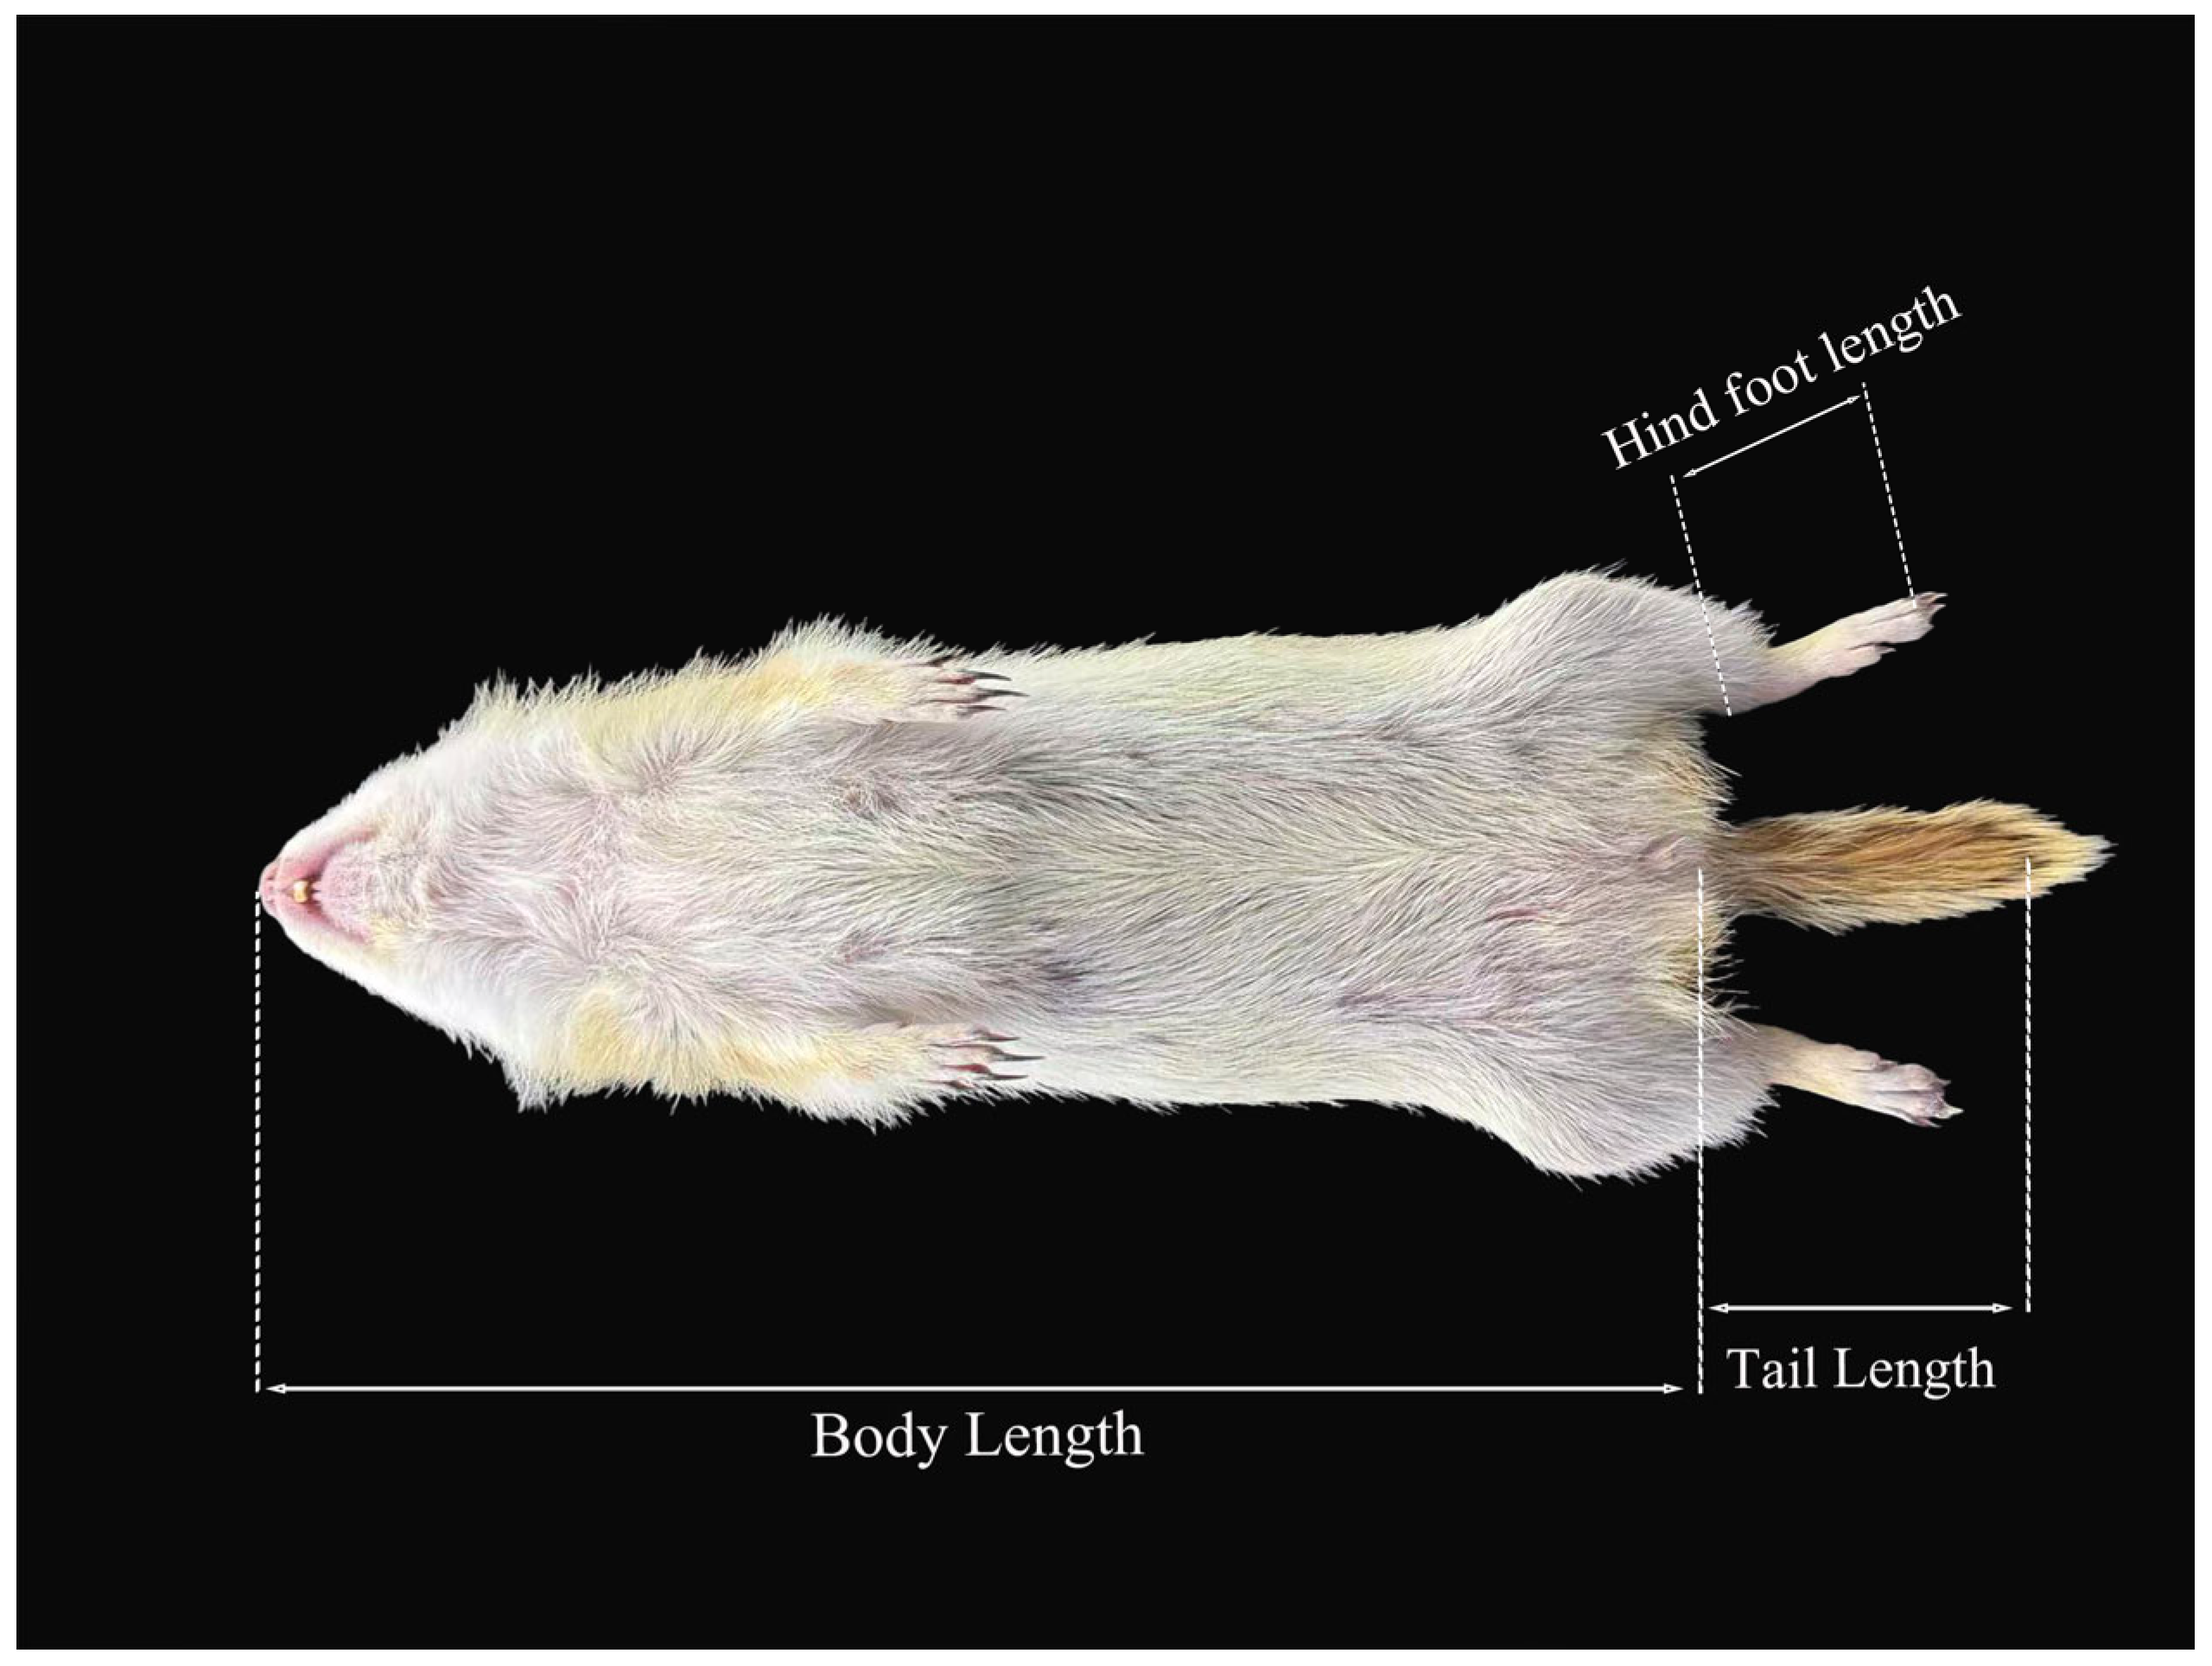
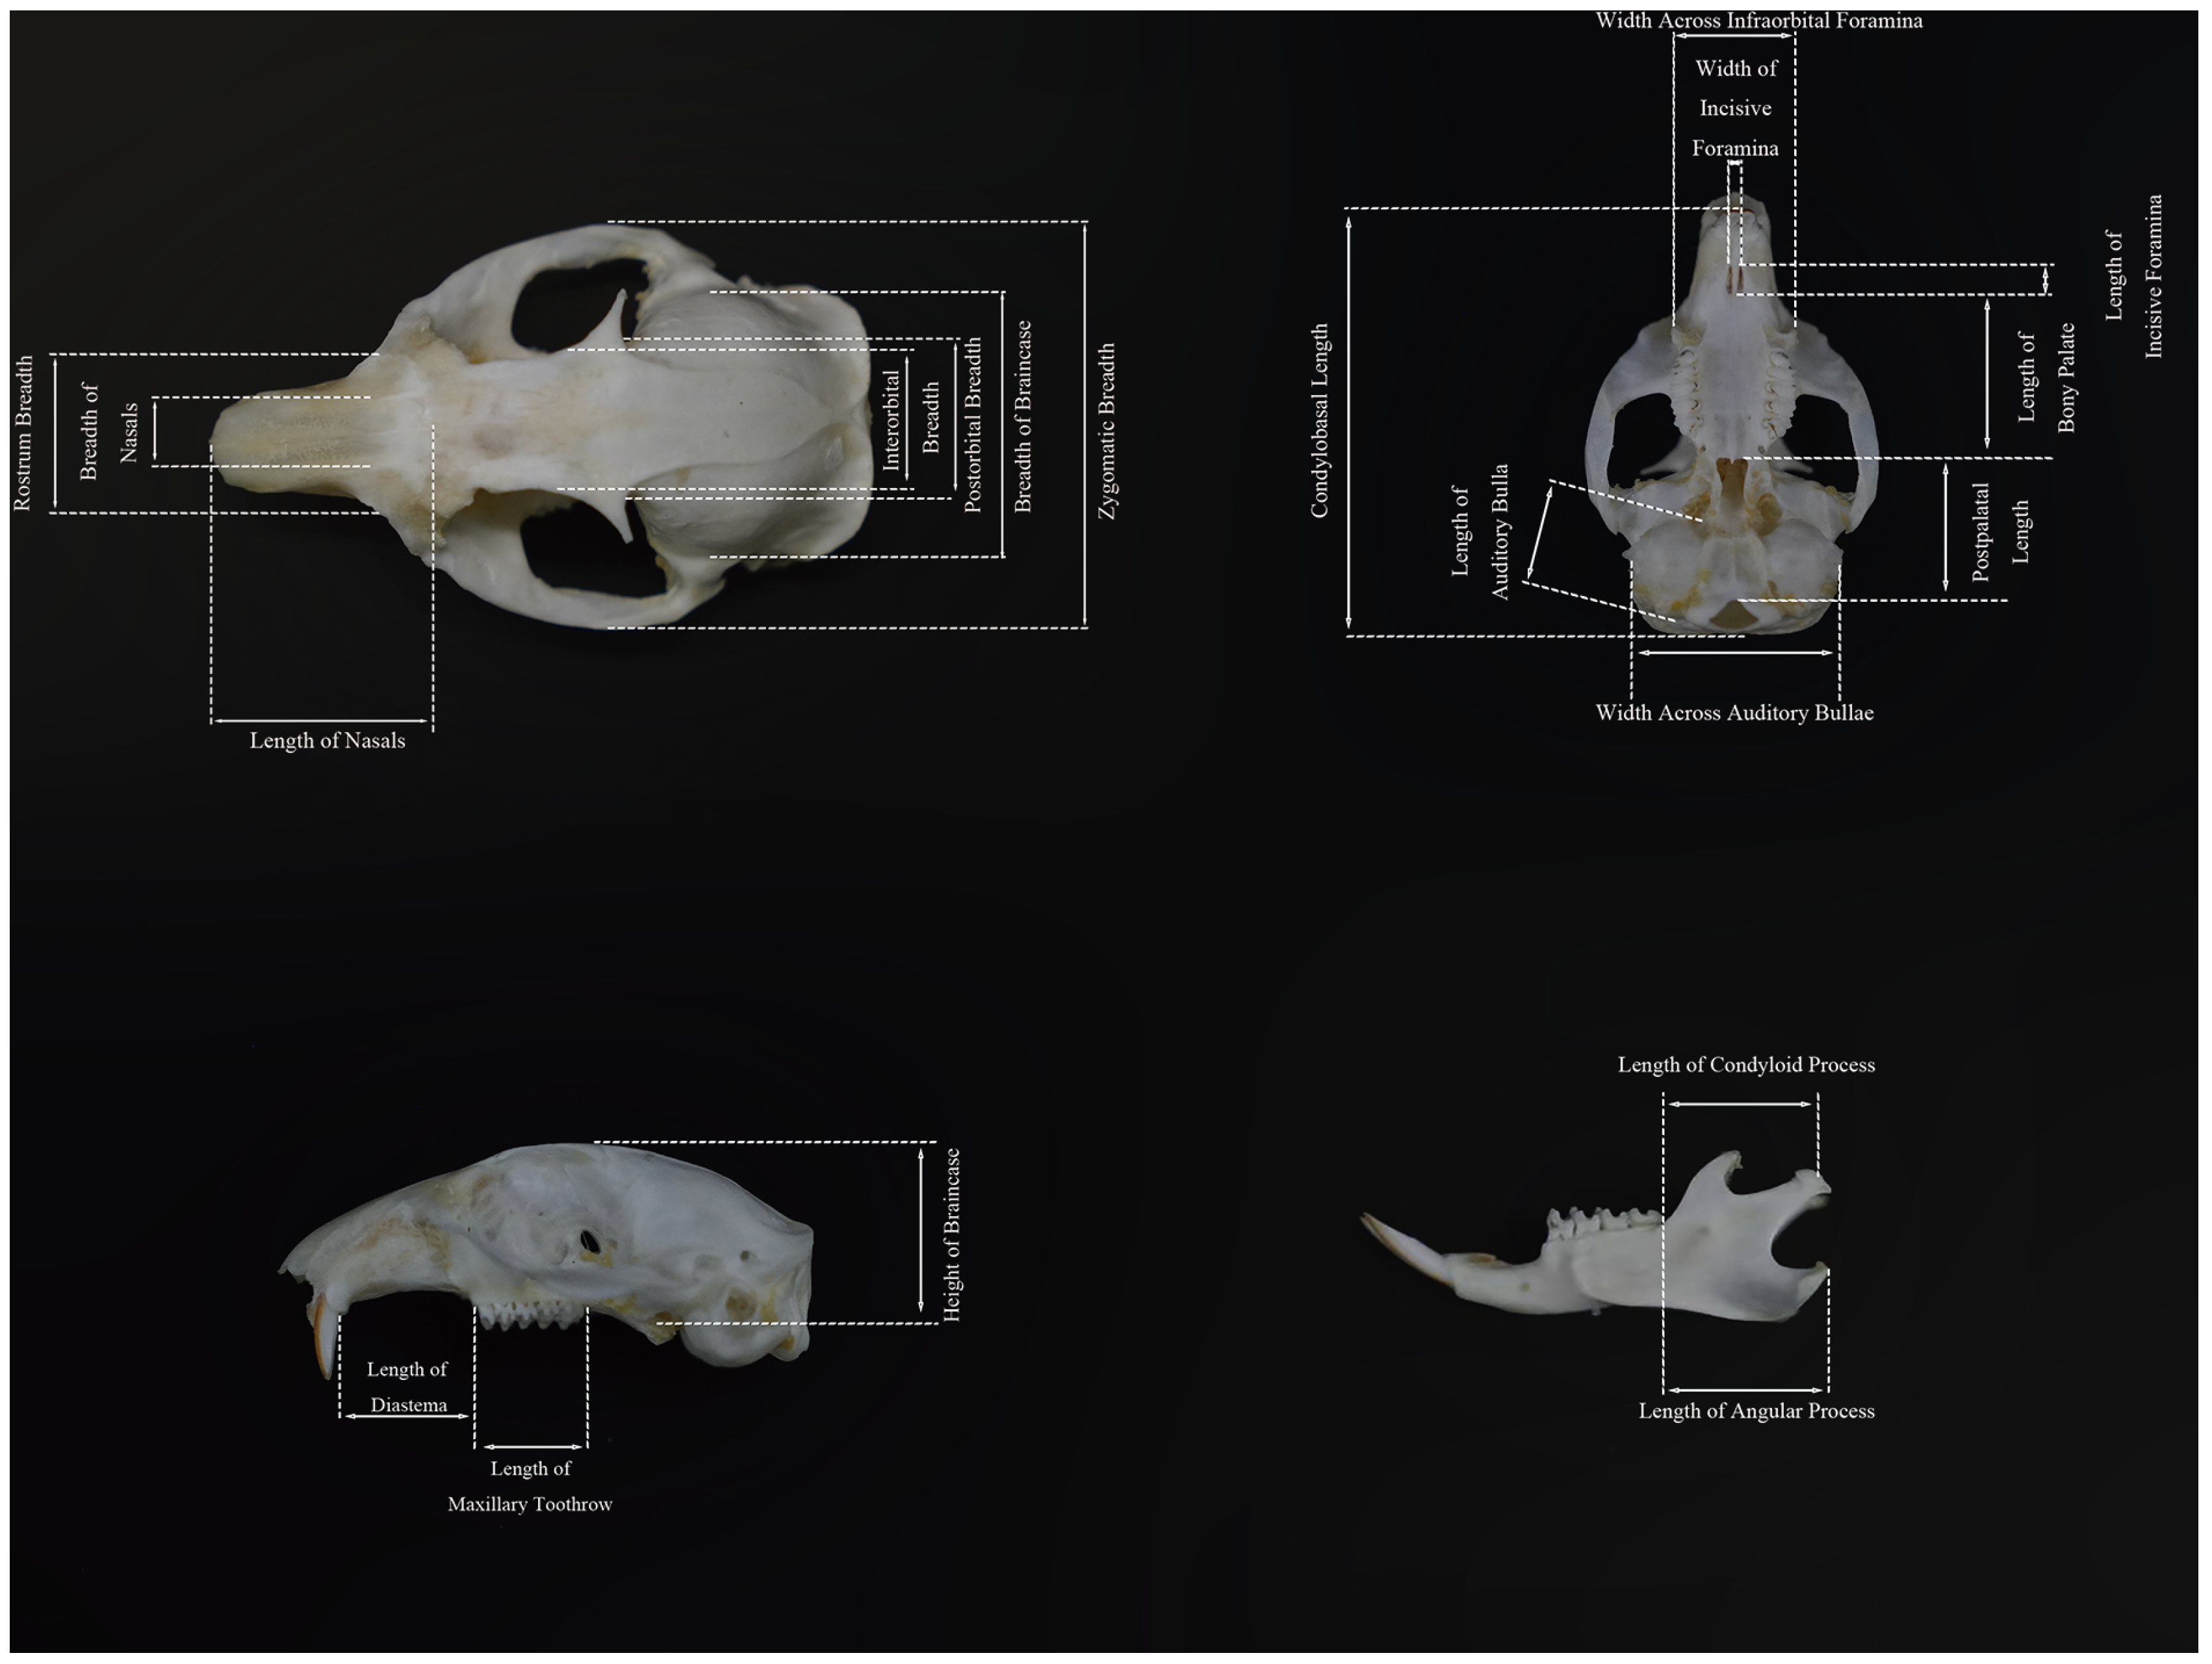
A systematic analysis was conducted on the morphological characteristics of 5 external variables and 20 cranial variables in 10 populations. The K-S test results indicated that the measured values of 14 morphological traits were normally distributed (
p > 0.05), and 10 of them met the homogeneity of variance criterion (
p > 0.05). The analysis of differences between males and females revealed that only one morphological variable, the length of the hind limbs, was significantly different (
p < 0.05), and the sex bimodal index of all the morphological traits was low (SSD < 5%) (
Table 2). However, this difference was biologically negligible when evaluated by the SSD index. The SSD is used to analyze differences in body size with respect to animal sex [
17]. An SSD < 5% is generally recognized as indicating weak sexual dimorphism in morphological traits, as such a small magnitude of difference does not reflect meaningful biological divergence between sexes [
18]. Therefore, we believe that there are no obvious sex differences in the morphological characteristics of
S. dauricus. The subsequent analysis combines the sample sizes of males and females for comparison.
3.2. Morphological Clustering Analysis (MCA)
The subsequent analysis combines the sample sizes of males and females for comparison. The clustering heatmap results revealed that the body size and cranial dimensions of individuals in the KP, DQ, JZ, and FK subgroups were greater than those of individuals in the other subgroups. Additionally, the clustering results indicated that all the subgroups could be divided into two main clusters: the first cluster included the DQ, JZ, and FK subgroups; the second cluster was further subdivided into two subclusters, one composed of the ZB, CD, and WL subgroups; and the other composed of the EE, CF, and HEB subgroups (
Figure S1). The clustering results are not consistent with the supposed affiliations of the subgroups to specific geographical populations as reported in existing studies.
3.3. Analysis of Morphological Differences Among Subgroups
For inter-subgroup difference comparisons among the 10 subgroups, two indicators (WN, LAP) had p < 0.05 in the preliminary statistical test, suggesting potential intergroup differences. However, when pairwise comparisons were performed between all groups (after multiple comparison correction), no statistically significant differences were observed between any groups. Given that multiple comparison correction in statistical analyses better controls Type I errors, this study ultimately adopted the corrected pairwise comparison results as the basis for conclusions. Statistical analyses revealed the following results. In terms of external morphology: For BL, the DQ (225.57 ± 2.34 mm) and FK (222.80 ± 3.81 mm) subgroups presented the highest values, whereas the ZB subgroup (194.50 ± 5.37 mm) presented the lowest values (H9,57 = 34.13, p < 0.01). For HFL, the FK (37.60 ± 0.51 mm) and JZ (37.91 ± 0.56 mm) subgroups were larger, whereas the CF (34.33 ± 0.67 mm) and CD (34.50 ± 1.18 mm) subgroups were smaller (H9,57 = 26.77, p < 0.01). The FK subgroup (66.40 ± 3.25 mm) presented the longest TL, whereas the EE (51.60 ± 1.18 mm) and HEB (51.00 ± 1.41 mm) subgroups presented the shortest TL (F9,57 = 3.746, p < 0.01). For T/B was highest in the ZB subgroup (0.31 ± 0.02), which differed significantly from the EE subgroup and other subgroups; T/B values were relatively similar among the remaining subgroups (F9,57 = 2.492, p < 0.05). There were no statistically significant differences in EH among the subgroups (H9,57 = 34.13, p = 0.1).
In cranial morphology: For CBL, the FK (45.43 ± 0.41 mm) and DQ (45.65 ± 0.72 mm) subgroups presented the highest values, whereas the EE subgroup (41.13 ± 0.30 mm) presented the lowest (F9,57 = 16.356, p < 0.01). For ZB, the FK subgroup (30.81 ± 0.45 mm) had the highest value, and the WL subgroup (27.00 ± 0.32 mm) had the lowest value (F9,57 = 14.02, p < 0.01). For RB, the JZ (9.97 ± 0.06 mm) and DQ (9.96 ± 0.32 mm) subgroups presented the longest values, whereas the EE (8.96 ± 0.10 mm) and ZB (8.95 ± 0.16 mm) subgroups presented the shortest values (F9,57 = 6.71, p < 0.01). For LIF, the FK subgroup (3.58 ± 0.06 mm) had the longest value, whereas the DQ (2.71 ± 0.21 mm) and HEB (2.79 ± 0.12 mm) subgroups had the shortest values (H9,57 = 32.90, p < 0.01).
Overall, the NE population (including the FK, DQ, and JZ subgroups) was larger in both external and cranial morphology and significantly larger than the other subgroups in 16 morphological indicators: HBC, BBC, RB, IOB, WAIF, WIF, LAB, WAB, CBL, ZB, LN, LD, LBP, PPL, LMTR, and LCP. In contrast, the HB and IM populations (the HB population, including the WL and ZB subgroups, and the IM population, including the EE subgroups) were relatively smaller. For these 16 indicators, the statistical results were as follows (respectively, ANOVA/Kruskal-Wallis: F
9,57 = 4.72,
p < 0.01; H
9,57 = 30.08,
p < 0.01; F
9,57 = 6.71,
p < 0.01; F
9,57 = 5.49,
p < 0.01; H
9,57 = 26.65,
p < 0.01; H
9,57 = 24.11,
p < 0.01; F
9,57 = 4.96,
p < 0.01; H
9,57 = 41.71,
p < 0.01; F
9,57 = 16.36,
p < 0.01; F
9,57 = 14.02,
p < 0.01; F
9,57 = 13.51,
p < 0.01; F
9,57 = 8.59,
p < 0.01; F
9,57 = 9.84,
p < 0.01; F
9,57 = 6.88,
p < 0.01; H
9,57 = 32.57,
p < 0.01; F
9,57 = 6.39,
p < 0.01) (
Table S2). However, the BL and TL values were greater in the NE population, indicating that the animals in the NE population had relatively greater body sizes. The HB population has the smallest body length, whereas the IM population has the shortest tail.
3.4. Principal Components Analysis (PCA) Based on Morphological Traits
PCA was conducted on 25 morphological indicators of
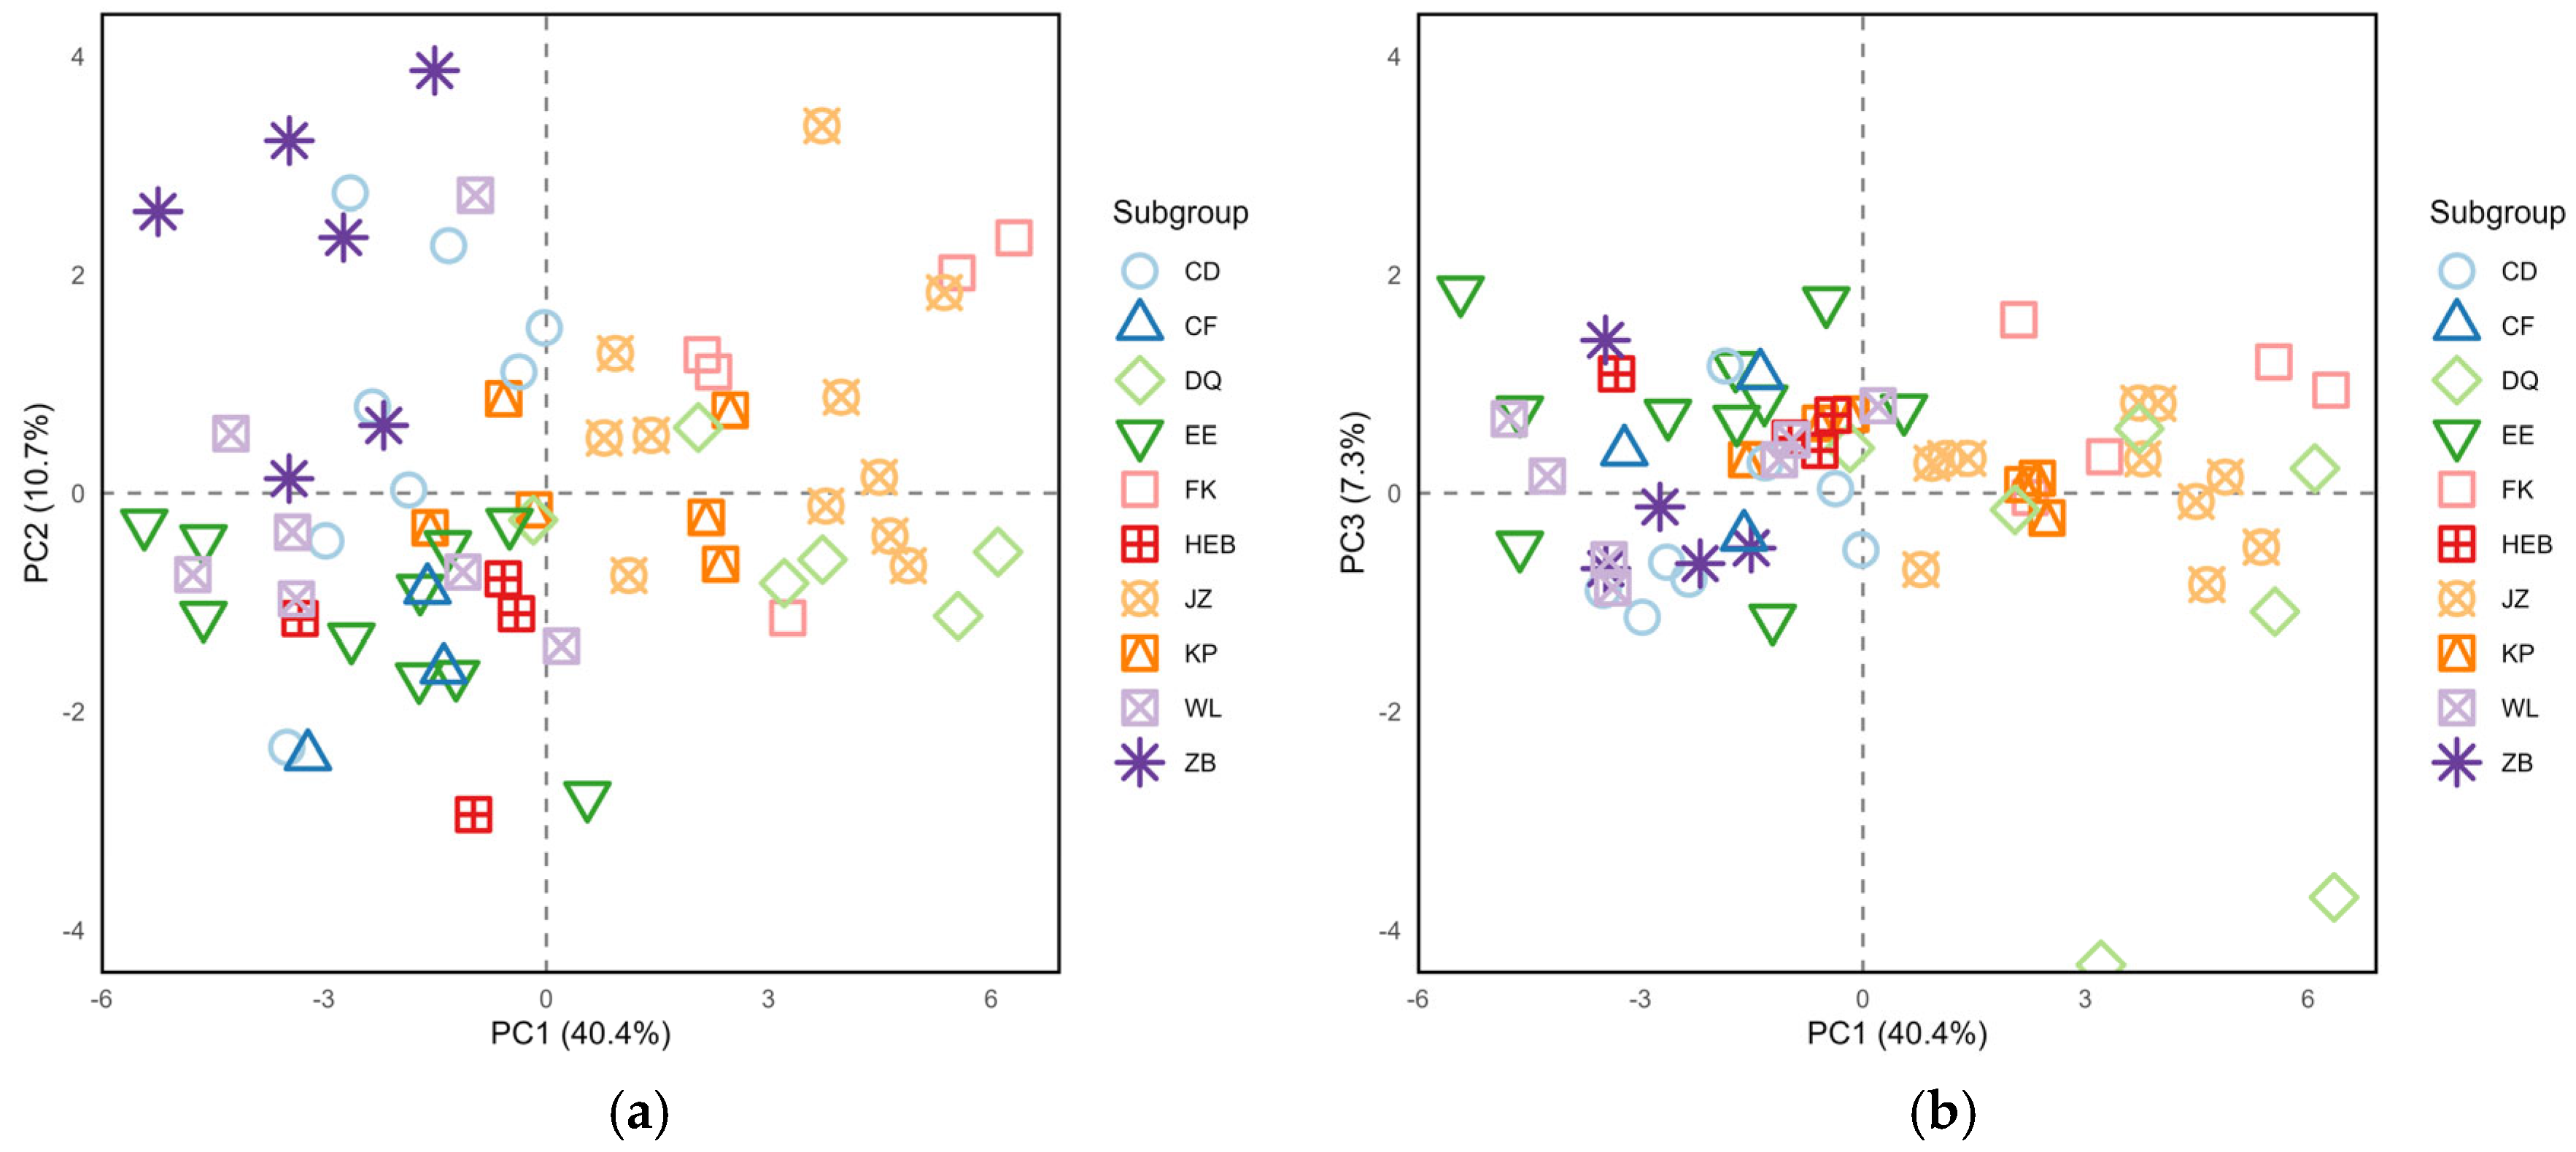
S. dauricus at the subgroup level. The analysis generated three principal components, which collectively accounted for 58.40% of the phenotypic variation. Among these, the first principal component (PC1) exhibited the greatest variation, with an eigenvalue of 10.1 and a variance contribution rate of 40.42% (
Table 3). This dominant component alone accounted for nearly half of the total explained variation, highlighting its critical role in capturing the most substantial phenotypic differentiation among subgroups. Specifically, PC1 had high positive loadings concentrated on cranial indicators such as CBL (0.942), ZB (0.897), LBP (0.865), PPL (0.818), LN (0.813), and LD (0.811) reflecting the overall variation in cranial morphology. The second principal component (PC2, eigenvalue = 2.7, variance contribution = 10.68%) was strongly correlated with tail-related traits like T/B (0.896) and TL (0.752), indicating variation in body proportions. The third principal component (PC3, eigenvalue = 1.8, variance contribution = 7.3%) was associated mainly with LAP (0.458) and WAB (0.633), revealing potential differences in diet and sensory system specialization among the subgroups.
The results of the PC1-PC2 scatter plot revealed that individuals from the JZ, FK, and DQ subgroups were distributed mainly on the right side of the PC1 axis, suggesting that these individuals likely had relatively larger cranial sizes. Individuals from the ZB, CD, and WL subgroups were located on the left side of the PC1 axis, whereas those from the EE, HEB, and CF subgroups were distributed in the lower-left quadrant. Notably, individuals in the KP subgroup were widely distributed across all four quadrants, indicating substantial morphological variation (
Figure 4a). In the PC1-PC3 scatter plot, individuals from the JZ, FK, and DQ subgroups still aggregated mainly on the right side of the PC2 axis, whereas individuals from the other subgroups were concentrated on the left side (
Figure 4b).
3.5. Clustering Based on Discriminant Function Analysis (DFA) of Morphological Traits
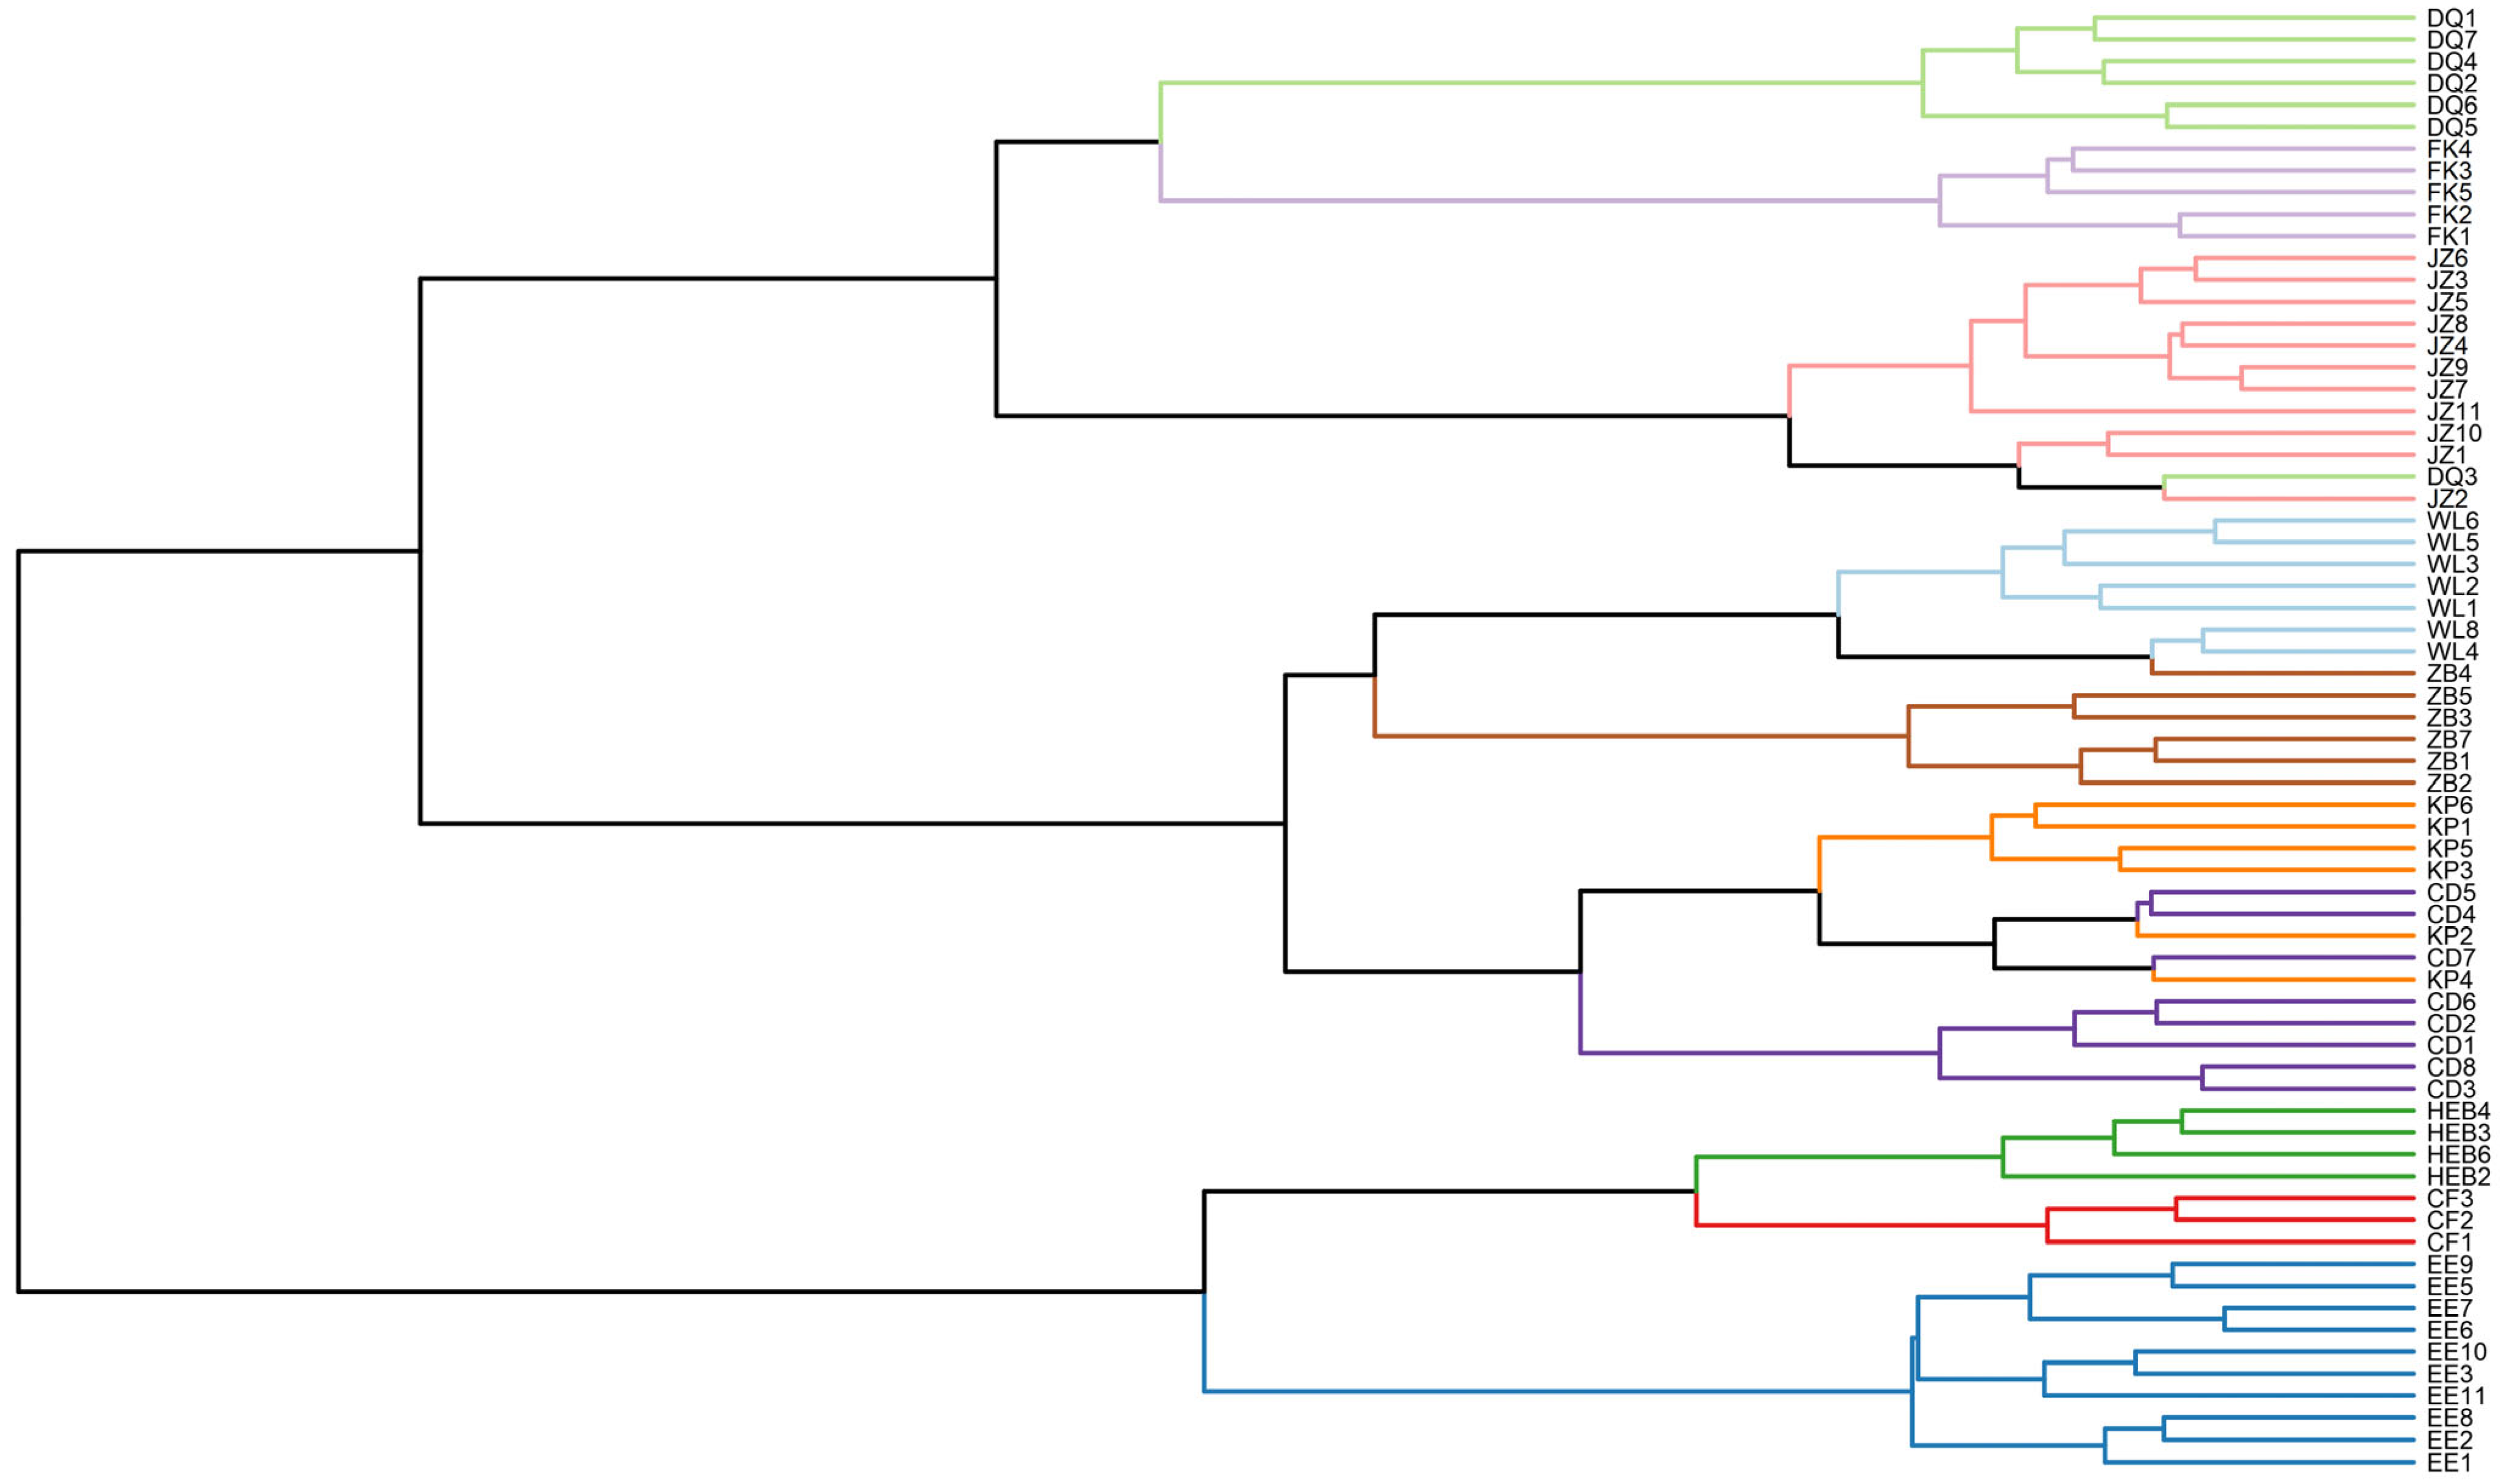
The dendrogram structure from the cluster analysis (based on the DFA results) clearly shows two main branching patterns (
Figure 5). First, the EE, CF, and HEB subgroups clustered into an independent main branch, suggesting close morphological affinity among these three subgroups. Second, the remaining subgroups clustered into a second main branch, which was further subdivided into two sub branches: the DQ, FK, and JZ subgroups clustered into the first sub branch, whereas the WL, ZB, CD, and KP subgroups clustered into the second sub branch.
On the basis of branch proximity in the clustering dendrogram, we reclassified the 10 subgroups into three major geographical populations: specifically, the NE population included the DQ, FK, and JZ subgroups; the HB population included the WL, ZB, CD, and KP subgroups; and the IM population included the EE, CF, and HEB subgroups.
3.6. Correlation Analysis Between Morphological Traits and Environmental Factors
This study further examined the correlations between six key environmental factors—latitude, longitude, elevation, MAT, MAT, and NDVI—and multiple morphological traits of
S. dauricus, with key results visualized in a heatmap (
Figure 6).
From the overall trend of these correlations, different environmental factors exhibited distinct differences in their influences on morphological traits. Specifically, elevation, MAP, MAT, and longitude were significantly correlated with most morphological traits (p < 0.05), whereas latitude and the NDVI had relatively limited effects on these traits.
As revealed by the correlation heatmap, elevation was significantly negatively correlated with 12 morphological traits (ZB, HBC, RB, LN, PPL, LCP, CBL, LD, BL, HFL, BBC, and LAP) (p < 0.05); annual precipitation was significantly positively correlated with 11 traits (ZB, RB, PPL, CBL, WN, LD, LAB, BBC, LIF, WIF, and WAB) (p < 0.05); and the annual average temperature was significantly positively correlated with 12 traits (TL, HBC, RB, IOB, PPL, CBL, WN, LD, LAB, HFL, LIF, and WIF) (p < 0.05).
Notably, the NDVI was significantly positively correlated with only WN and was not significantly correlated with the other morphological traits. In contrast, longitude was significantly positively correlated with seven traits (ZB, RB, PPL, LAB, BL, BBC, and LAP) (p < 0.05), whereas latitude was not significantly correlated with any of the measured morphological traits.
3.7. Redundancy Analysis (RDA) of Morphological Traits and Environmental Factors
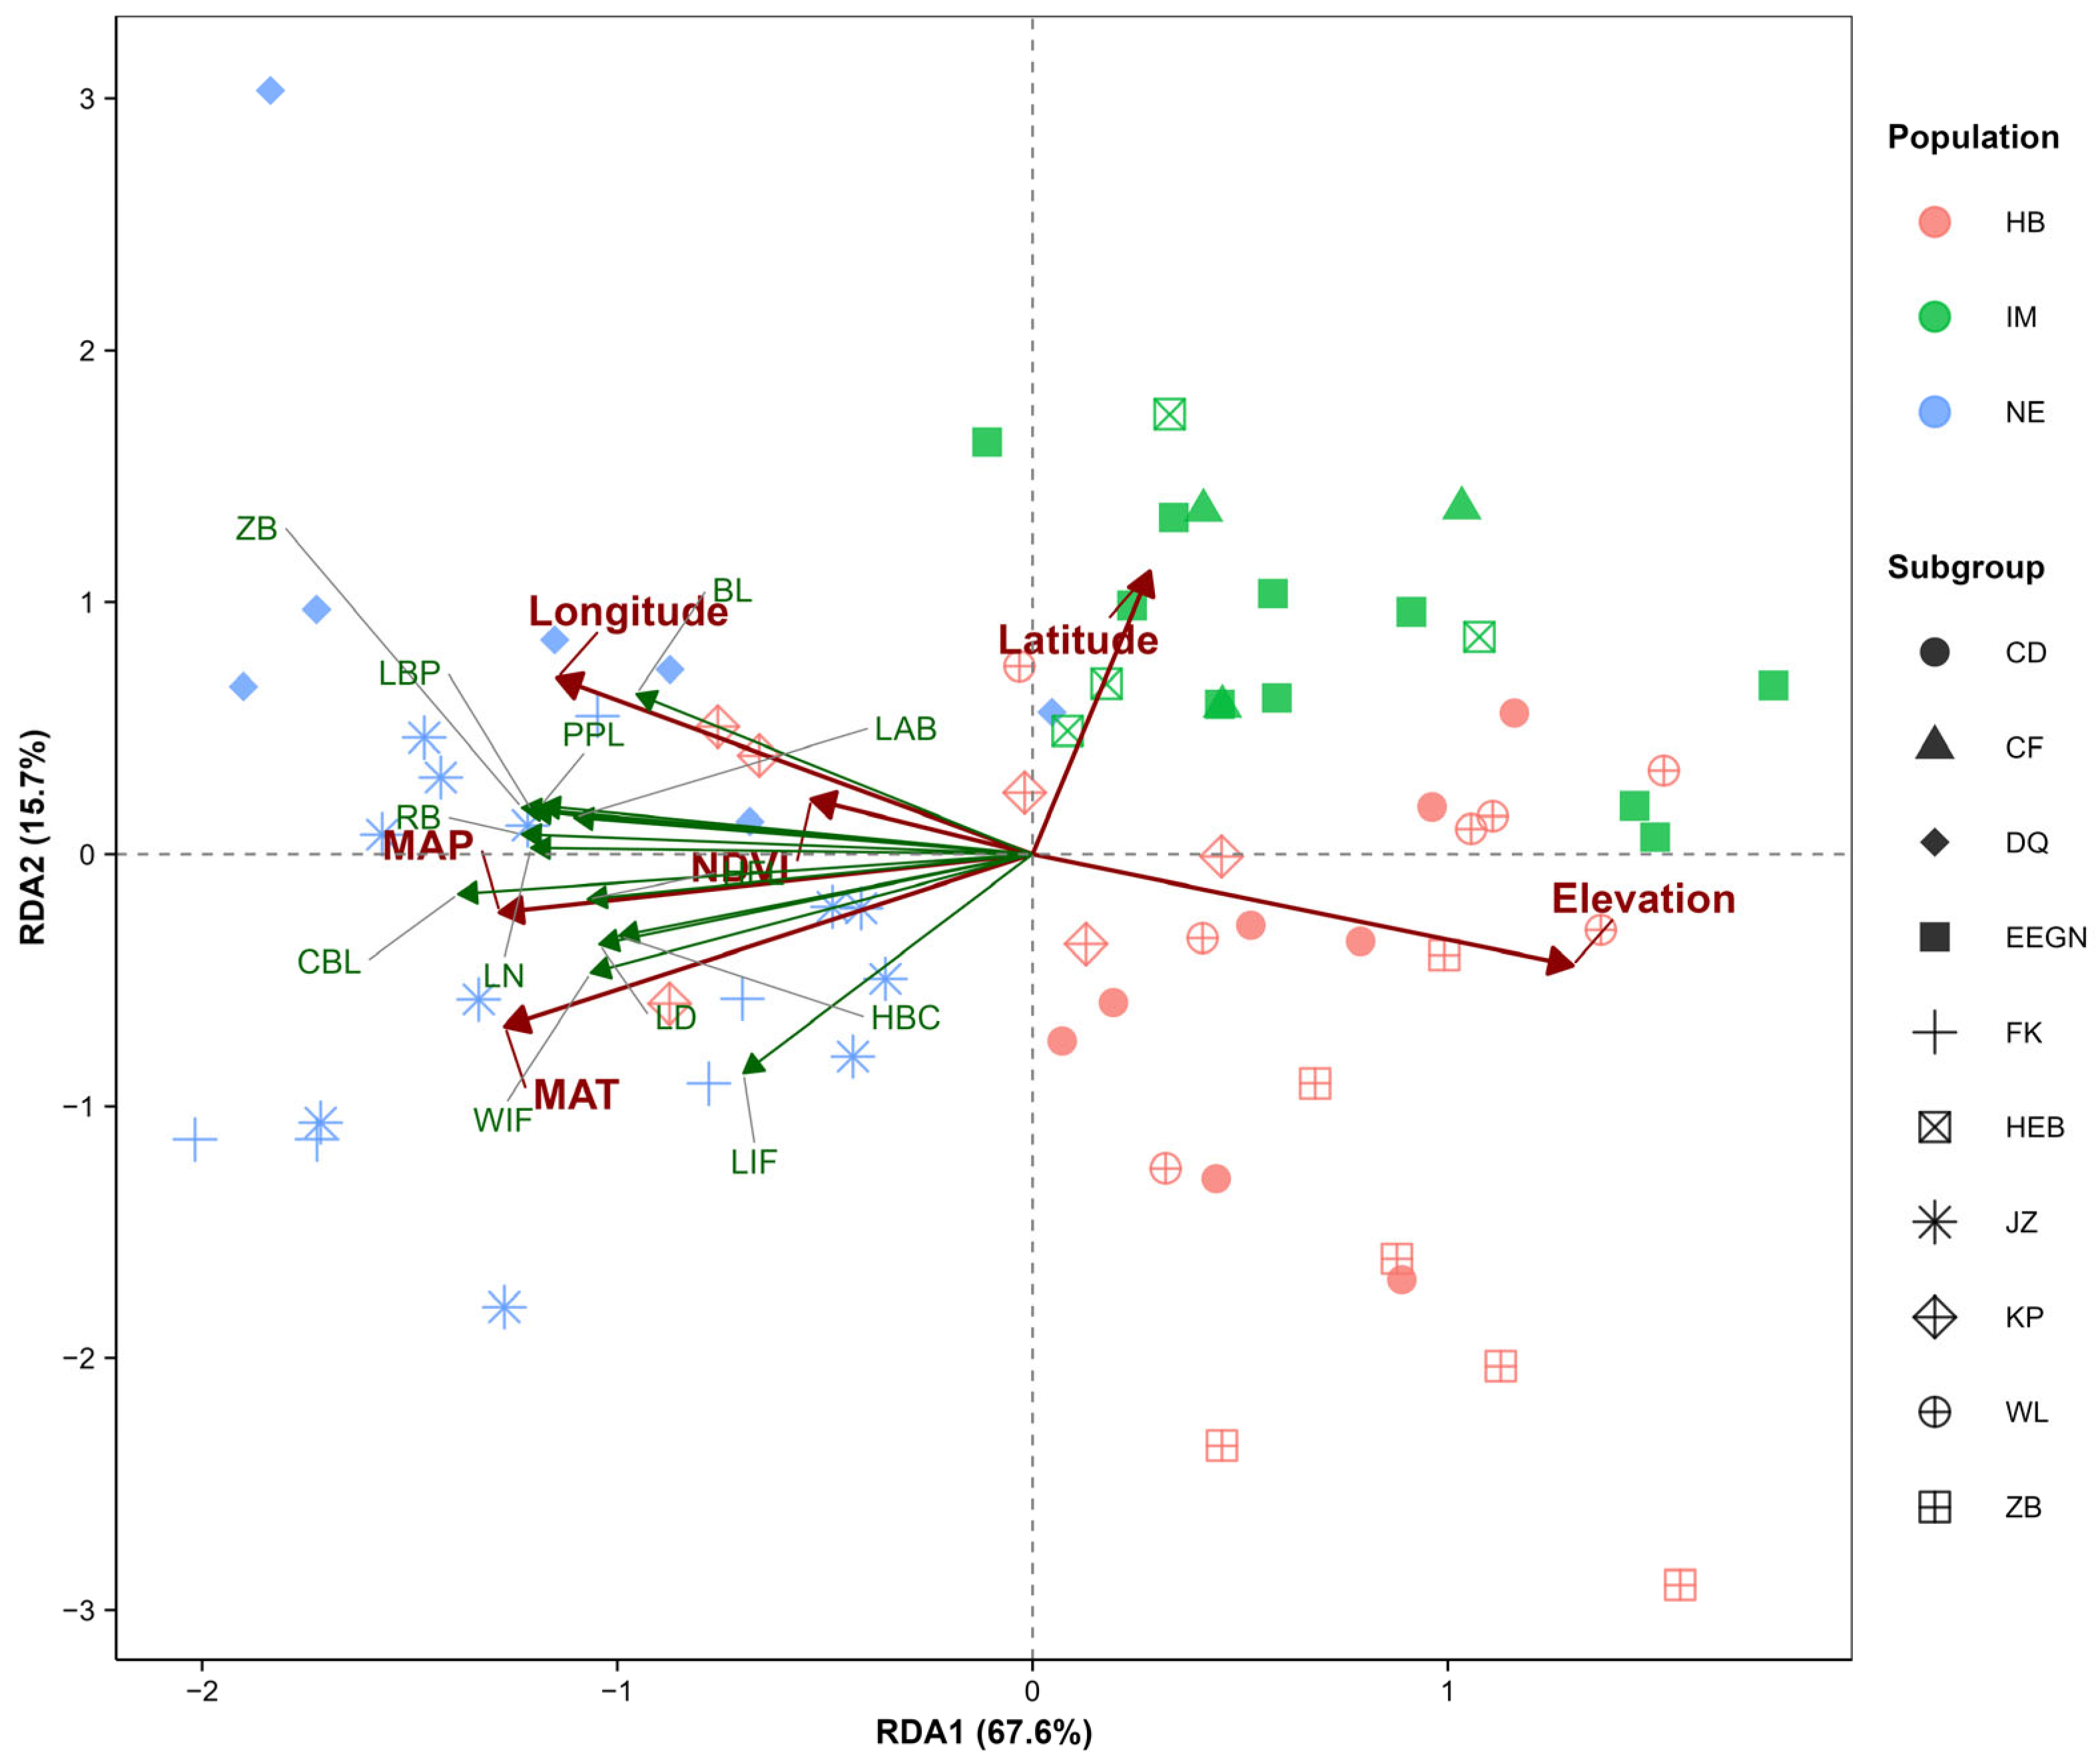
This study employed RDA to explore the relationships among populations, morphological traits, and environmental factors. The eigenvalues of the first two RDA axes were 6.66 and 1.45, respectively. These two axes (RDA1 and RDA2) accounted for 67.6% and 15.7% of the total variance, respectively, with a cumulative explanatory power of 83.3% (
Table 4).
The results from the RDA ordination plot indicated that the first ordination axis (RDA1) was positively correlated with latitude and elevation, whereas the second ordination axis (RDA2) was negatively correlated with longitude, MAT, NDVI, and MAP. Furthermore, all the morphological characteristics presented positive correlations with longitude, MAT, NDVI, and MAP and negative correlations with latitude and elevation (
Figure 7). MAT, MAP, and elevation had extremely significant effects on the morphological variation in
S. dauricus (
p < 0.01), whereas longitude had a significant effect (
p < 0.05); however, latitude and the NDVI had no statistically significant effect on the variation (
p > 0.05) (
Table 5). Notably, these findings were largely consistent with the results of the correlation analysis conducted in this study.
4. Discussion
In mammals, intraspecific geographical variation in morphology is a widespread phenomenon, often exhibiting complex patterns, including clinal variation, discrete types, and mosaic types [
19]. External and cranial morphological data play irreplaceable roles in exploring intraspecific phylogenetic relationships [
20,
21,
22]. Nadler investigated differences between two subspecies of
Spermophilus richardsonii via cranial data and reported that the skull size of
S. r. richardsonii was significantly larger than that of
S. r. elegans [
23]. Through morphometric analyses, Gunduz demonstrated significant morphological differences among three ground squirrel species in Turkey [
24]. Sinitsa confirmed the taxonomic status of the extinct ground squirrel
Spermophilus citelloides by comparing morphological traits among
Spermophilus species [
25].
In this study, we conducted systematic morphological analyses to explore the geographical variation in S. dauricus. By integrating this variation with recorded subspecific classifications and performing multivariate analyses, we propose a revised classification of Chinese S. dauricus into three geographical populations. Specifically, we suggest adjusting the traditional classification of Northeast subspecies (originally including the CF, EE, HEB, DQ, FK, KP, and JZ subgroups) and the Hebei subspecies (originally including the WL, ZB, and CD subgroups). However, whether these three geographical populations have differentiated at the subspecies level requires further genetic analysis combined with genomic data. Morphological clustering and DFA-based clustering adopt distinct analytical logics: the former is predicated on the species’ existing three-subspecies classification, conducting confirmatory analysis of 10 small populations. Its core objective is to verify whether these small populations conform to the morphological aggregation pattern of the predefined subspecies, with grouping based on the comprehensive similarity of all morphological traits and their congruence with the subspecies classification. The latter does not predefine any subspecies groups, instead directly performing exploratory analysis on the 10 small populations. By weighting key morphological traits with significant intergroup differences and low intragroup variation, it automatically identifies natural clustering patterns, thereby revealing the intrinsic morphological differentiation among the small populations. Despite their differing analytical logics, the results of the two clustering methods are highly consistent, both classifying S. dauricus within China into three geographical populations: (1) the NE population, which includes the FK, DQ, and JZ subgroups and corresponds to S. d. ramosus; (2) the HB population, which includes the ZB, CD, WL, and KP subgroups and corresponds to S. d. mongolicus; and (3) the IM population, which includes the EE, HEB, and CF subgroups and corresponds to S. d. dauricus. The results of morphometric analyses, heatmaps, and PCA clearly revealed that the NE population was significantly larger than the other two populations in terms of 15 morphological traits. This morphological differentiation may be closely related to the habitat, survival conditions, and hibernation characteristics of S. dauricus.
On the basis of these factors, individuals in the NE geographical population are relatively larger in size. Moreover, the morphological trait data from these measurements can serve as important diagnostic criteria for differentiating S. dauricus populations across regions. After visualizing the data via multivariate analyses, we found that the three geographical populations had distinct distribution centers in the PCA ordination plot. The clustering results generated from the DFA outputs for these 10 populations indicate that they can be divided into two main branches: one including the JZ, DQ, and FK populations and the other consisting of two additional groups (WL, CD, ZB, KP; and EE, HEB, CF). These clustering results were highly congruent with the PCA results. Additionally, this study documented the numerical ranges and mean values of key external and cranial measurements for each geographical population. These traits are the primary drivers of differences in body size and cranial morphology among the three geographical populations, and the data provide robust support for the subspecific classification of S. dauricus.
We further explored the associations between environmental factors and the morphological differentiation of different geographical populations of
S. dauricus. In current animal ecology research, the academic community has developed two classic explanatory frameworks for how environmental factors regulate the development of animal body size and the evolution of skull dimensions—Bergmann’s law and Allen’s rule. Bergmann’s Law states that in regions with high ambient temperatures, animals exhibit smaller body sizes and larger surface areas; in contrast, the opposite pattern occurs in regions with lower environmental temperatures [
26]. In contrast, Allen’s rule emphasizes that in cold environments, protruding structures on the body surface of endothermic animals tend to shorten to reduce surface area and conserve heat; in warm environments, these structures tend to be relatively elongated to facilitate heat dissipation [
27].
Studies on other ground squirrel species have confirmed that temperature and precipitation directly or indirectly regulate body size differentiation. For example, increased precipitation enhances plant productivity, providing more abundant food resources for Mexican ground squirrels (
S. mexicanus), which indirectly promotes larger body size in this species [
28]. Similarly, Arctic ground squirrels (
Urocitellus parryii plesius) exhibit body size differences between forest and meadow habitats, a pattern indirectly mediated by temperature and precipitation [
29].
Our correlation analysis revealed that most morphological traits of S. dauricus were significantly positively correlated with annual mean temperature and annual mean precipitation and significantly negatively correlated with latitude and elevation. Specifically, the EE population, which is distributed in the northernmost region of China, has smaller TL and T/B values, whereas populations in Northeast China (JZ, FK, and DQ) have larger values for these traits. This pattern aligns closely with the core prediction of Allen’s law. RDA further supported these findings: MAP and MAT collectively account for the largest proportion of phenotypic variation in S. dauricus, with MAP exhibiting the strongest statistical association and explaining the highest share of this variation. Additionally, population clusters identified via factor analysis show distinct aggregation in the ordination space, indicating that long-term environmental adaptation has driven morphological differentiation among geographical populations.
In the Northeast China Plain, the natural grassland habitat of the NE population has been largely replaced by farmland, shifting the dominant habitat type from natural grassland to agricultural land. This transformation has altered food resources from herbaceous plants to hard-shelled crops, such as peanuts, which are more concentrated in distribution and nutritionally richer. The larger skulls and body sizes in the NE population accommodate more developed masticatory muscles, facilitating efficient mastication of these hard-shelled crops. Furthermore, human agricultural activities have disrupted the foraging behavior of natural predators, reducing selection pressure on auditory vigilance; notably, the NE population exhibits lower auditory specialization than the IM and HB populations.
Hibernation differences have further exacerbated morphological divergence among geographical populations. The NE population inhabits the warm, humid Northeast Plain and emerges from hibernation earlier, typically ending hibernation in March [
30]. By this time, plant resources have already begun to grow, ensuring timely food availability. This earlier emergence provides individuals with a longer growth period and sufficient time to acquire nutrients, promoting the development of larger body sizes. In contrast, the HB population occupies high-elevation grasslands with cold climates, and the IM population resides in high-latitude, high-elevation regions. These areas experience seasonal fluctuations in food resources and greater predation pressure from natural predators. Both geographical populations enter hibernation earlier (late September) and emerge later (March–May) [
31,
32]. Compared with the IM and HB populations, the NE population of
S. dauricus experiences lower survival pressure, benefits from a longer growth period, and inhabits an environment with less seasonal fluctuations in food resources and more favorable habitat conditions (elevation, MAT, and MAP), ultimately resulting in a larger body size.
Notably, this study has certain limitations in classifying populations of S. dauricus in northeastern Inner Mongolia, China, as it relies solely on data from populations within China. Therefore, it is necessary to integrate the morphological data of S. dauricus from Mongolia and Russia and analyze the morphological affinity between these transboundary populations and those in northeastern Inner Mongolia, China—thereby verifying the morphological affinity between the IM population and S. d. dauricus. Additionally, molecular biological methods can be used to detect genetic differentiation among populations, further verifying whether these morphological differences have reached the level of subspecies differentiation. Moreover, more in-depth experimental investigations can be conducted on the interaction mechanism between key environmental factors and morphological traits to reveal the underlying physiological and ecological processes. These studies provide a more comprehensive explanation for the relationship between the subspecies differentiation pattern and the ecological adaptation of S. dauricus.
5. Conclusions
This study conducted systematic measurements and multivariate statistical analyses of five external morphological traits and 20 cranial morphological traits of the S. dauricus populations at 10 sampling sites within China. It clarified the morphological differentiation characteristics of the populations and their environmental driving mechanisms.
The results showed that there were significant morphological differences among different geographical populations of S. dauricus, and this differentiation could support the classification of these populations into three geographical groups: NE, IM, and HB.
This grouping better reflects the adaptive morphological responses of the populations to regional environmental conditions and is inconsistent with the existing subspecies classification system for this species [
2]. Mean Annual Precipitation (MAP), Mean Annual Temperature (MAT), and altitude are the key environmental factors influencing the species’ morphological differentiation. These factors jointly shape variations in body size and cranial morphology of
S. dauricus. The NE population inhabits the warm and humid Northeast Plain, where food resources are more abundant, the hibernation period is shorter, and predation pressure is lower. Consequently, it has evolved a longer tail, larger body size, and relatively less specialized auditory structures. In contrast, the HB population (distributed at higher altitudes) and the IM population (distributed at higher latitudes) occupy habitats with significantly lower annual average temperatures, dominated by arid grasslands. These habitats have relatively scarce food resources and longer hibernation periods, leading the two populations to evolve a smaller body size, shorter tail, and relatively more developed auditory structures. This study not only clarified the morphological variation patterns of the geographical populations of
S. dauricus but also provided new morphological evidence to resolve the subspecies classification disputes, laying a foundation for subsequent studies on the species’ population evolution, ecological adaptation, and taxonomic revision.
