Article

In Vitro and In Vivo Evaluation of Autochthonous Probiotics and Their Effects on the Mucosal Health of Nile Tilapia (Oreochromis niloticus)

Fish Health and Nutrition Research Group, School of Biological and Marine Sciences, University of Plymouth, Plymouth PL4 8AA, UK
*
Authors to whom correspondence should be addressed.
Animals 2025, 15(22), 3296; https://doi.org/10.3390/ani15223296 (registering DOI)
Submission received: 9 October 2025 / Revised: 9 November 2025 / Accepted: 10 November 2025 / Published: 15 November 2025
(This article belongs to the Special Issue Gut Microbiota in Aquatic Animals)

Simple Summary

Probiotics, which are beneficial microbes that support digestion and strengthen natural defences, offer a promising approach to support sustainable fish farming. In this study, bacteria naturally found in the gut of Nile tilapia were investigated to see if they could serve as probiotics. Two strains of bacteria were identified that could inhibit relevant fish pathogens and produce digestive enzymes. When these bacteria were added to the diet of the fish, it resulted in subtle shifts in intestinal microbial community composition. The probiotic-fed fish also displayed notable changes in the structure of their intestinal lining and in the production of mucus-secreting cells of the intestine and skin. These findings offer a positive contribution to tilapia probiotic research.

Abstract

The host microbiome is a promising source of probiotics for aquaculture species including Nile tilapia. In this study, the probiotic potential of autochthonous bacterial isolates from Nile tilapia and carp mid-intestines were screened in vitro. Two isolates (C61 and T70), closely related to Bacillus subtilis, exhibited antagonistic activity against multiple pathogen species and demonstrated multiple digestive enzyme activities. Their antagonistic activity in Aeromonas hydrophila assays remained even under simulated intestinal juice (SIJ) exposure. Subsequently, C61 (PT1) and T70 (PT2) were added to experimental diets at log 7 CFU/g of diet, and fed to Nile tilapia (5.32 ± 0.12 g) for 40 days. There were no significant differences observed in the growth performance across treatments. Despite limited Bacillus intestinal recovery levels, 16S rRNA gene metabarcoding revealed subtle shifts in the intestinal microbial community composition of the probiotic-fed groups. In addition, the PT1 group showed significantly longer mucosal fold length, elevated intestinal and skin goblet cell levels, and higher skin goblet cell coverage compared to the control. These results indicate the potential benefits of the isolates as functional feed additives for enhancing the mucosal health of Nile tilapia, but their benefits were likely achieved through transient activity given the low level of Bacillus recovery in the intestine.

1. Introduction

Although plant-based proteins and lipids are commonly employed as substitutes for fishmeal and fish oil, their efficacy is often limited by the presence of antinutritional factors (ANFs), which can adversely affect nutrient digestibility and absorption [1,2]. One approach to addressing this challenge involves the incorporation of commercial enzymes into plant-based diets to enhance digestion, improve feed efficiency, and promote the growth of farmed fish. However, the application of commercial enzymes as feed additives has been limited by economic constraints, primarily driven by high production costs and elevated market prices [3]. Another significant concern associated with aquaculture intensification is the heightened susceptibility to disease, which is often exacerbated by increased stocking densities, poor feed digestibility, and deteriorating water quality [4]. Probiotics are widely used functional feed additives in aquaculture, with reported modes of action that can address problems such as poor nutrient digestibility and disease resistance. As such, the capacity to produce extracellular digestive enzymes and the ability to antagonise and inhibit pathogen colonisation are among the focal criteria in the selection of probiotics for aquaculture application.
Autochthonous probiotics, derived from aquatic environments, have attracted research attention to alleviate constraints on host- and strain-specific differences encountered in aquaculture applications [5]. Autochthonous probiotics populate the host’s mucus and epithelial surfaces [6] and are expected to be well-adapted in their natural environment in the gastrointestinal tract (GIT) of fish [7]. As an established natural defence system, the host microbiome is considered as a reservoir of potential probiotic strains, especially for cultured fish that are usually predisposed to antigenic stimuli and may have developed robust innate and adaptive immune responses against aquatic pathogens and stressors [7]. In a previous study, dietary administration of autochthonous Bacillus spp. (B. velezensis, B. subtilis, and B. amyloliquefaciens), which showed antagonism against Streptococcus agalactiae in vitro, reduced mortalities in Nile tilapia following in vivo S. agalactiae challenge (30–63% vs. 87% in controls) [8]. These findings demonstrate the benefits of probiotic treatment in enhancing disease resistance.
Previous research has explored the use of enzyme-producing probiotics, particularly those capable of secreting extracellular enzymes that degrade common ANFs [1,3]. Phytic acid is the principal storage form of phosphorus in plant-derived materials [9]. Due to its strong chelating properties, which bind essential mineral ions and reduce their bioavailability, it is considered an antinutrient [10]. Monogastric animals, including fish, lack endogenous intestinal phytase necessary for the digestion of phytic acid [11]. Previous studies [11,12,13] have isolated and characterised autochthonous phytase-producing bacteria from fish GIT as a potential strategy for dietary phytase supplementation; however, their in vivo use has rarely been explored.
The present study aimed to isolate and characterise autochthonous bacterial strains from the mid-intestine of O. niloticus, with a specific focus on evaluating their probiotic potential for safe application in aquaculture. Selected candidates demonstrating promising probiotic traits were further assessed for their antagonistic efficacy against Aeromonas hydrophila and phytate-degrading activity under simulated gastrointestinal conditions, to better understand their functional relevance in enhancing nutrient bioavailability. The two most promising strains were incorporated into experimental diets and orally administered to O. niloticus to evaluate their effects on growth performance, feed efficiency, and mucosal health. These findings are expected to inform the targeted development of host-specific probiotics for use in precision aquafeed formulations.

2. Materials and Methods

2.1. Bacterial Isolation and Culture

Autochthonous bacteria were isolated from the mid-intestine of O. niloticus (1.96 ± 0.60 g) as described elsewhere [14]. Intestinal bacteria were also isolated from mirror carp, Cyprinus carpio (2.54 ± 0.07 g), from a previous experiment following the same protocol. Intestinal samples (100 mg) were homogenised in 900 µL of phosphate-buffered saline (PBS; Merck Life Science UK Limited, Dorset, UK) and were subjected to serial dilution. For microbial culture, 100 µL of diluted homogenate was plated onto tryptic soy agar (TSA; Merck Life Science UK Limited, Dorset, UK) plates and incubated at 25 °C for 24 h. Distinct colonies were subsequently sub-cultured using the streak dilution method and used for in vitro screening.

2.2. In Vitro Assays

The autochthonous bacterial isolates were tested following the in vitro screening protocol outlined in Supplementary Figure S1.

2.2.1. Pathogen Antagonism Assay

The pathogenic strains utilised in this study were obtained from the microbiology culture collection of the University of Plymouth. Detailed description of each pathogen with its respective culture conditions are provided in Supplementary Table S1.
Pathogen suspensions were prepared by suspending a single colony of each pathogen in sterile PBS and adjusting the optical density (OD600) to 0.1. Suspensions were evenly spread on agar plates with a sterile swab to create a uniform lawn. Probiotic candidates were cultured from single colonies in tryptic soy broth (TSB; Merck Life Science UK Limited, Dorset, UK) and incubated overnight at 25 °C (120 rpm). Wells (5 mm) were made in the agar using a sterile metal borer, and 25 µL of probiotic broth culture was pipetted into each well. Wells containing sterile TSB served as negative controls. Assay media and incubation conditions corresponded to the culture requirements of each pathogen (Supplementary Table S1). Plates were incubated for 24 h, after which zones of clearance were observed and recorded.

2.2.2. Haemolytic Activity

Sheep blood agar plates were prepared by supplementing sterile TSA with 5% (v/v) defibrinated sheep blood (TCS Biosciences Ltd.; Buckingham, UK) at 47 °C. Each isolate was streaked onto the blood agar plates and incubated at 25 °C for 24 h. Haemolytic activity was assessed [15] as β-haemolysis (clear zones surrounding colonies), α-haemolysis (greenish discoloration around colonies), or γ-haemolysis (no observable change or clearing around colonies).

2.2.3. Qualitative Screening for Extracellular Enzyme Activity

Probiotic candidate isolates were screened for phytase, xylanase, and tannase activity. To isolate and enumerate phytase-producing bacteria, a modified phytase-screening medium (MPSM) was used according to Roy et al. [12]. Bacterial isolates were streaked on the MPSM plates and were incubated at 30 °C for 7 d. The qualitative screening of phytase-producing bacterial isolates was performed [16] and zones of clearing around bacterial colonies were observed and recorded.
Bacterial isolates were subjected to qualitative screening for xylanase production [17]. To isolate xylanase-producing bacteria, isolates were streaked on xylan (XY) agar medium [18] and incubated at 30 °C for 24 h. Isolates cultured in XY plates were flooded with congo red solution (0.5% congo red; w/v) and 5% ethanol (v/v) for 5 min, followed by repeated decolorisation using 1 M of NaCl [19]. Positive xylanolytic activity was distinguished by the appearance of halo surrounding the bacterial colony against the red background.
To screen for tannase-producing bacteria, nutrient agar containing 1% (w/v) tannic acid solution was used [20]. Bacterial isolates were streaked on the nutrient agar plate and incubated at 37 °C for 48–72 h. The bacteria forming clear zones around the colonies were regarded to have extracellular tannase activity.

2.3. Probiotic Activity in Simulated Gastrointestinal Conditions

The best-performing probiotic candidate isolates from the initial in vitro assays (Phase 1; Supplementary Figure S1) were selected and further screened for their probiotic activity under simulated gastrointestinal conditions (Phase 2; Supplementary Figure S1). The assay was designed to simulate the gastric and intestinal pH of tilapia. Simulated gastric juice (SGJ, pH 1) and simulated intestinal juice (SIJ, pH 7) were prepared as described elsewhere [21].

2.3.1. Pathogen Antagonism Against A. hydrophila in SIJ

A. hydrophila lawns and probiotic cultures (OD600 = 1, ~108 CFU/mL) were prepared as in Section 2.2.1. Wells (4 mm) received (1) 20 µL of probiotic + 20 µL of NaCl, 0.5% w/v, (2) 20 µL of probiotic + 20 µL of filter-sterilised SIJ, (3) controls (20 µL of SIJ + 20 µL of NaCl, 0.5% w/v). Plates were incubated at 25 °C for 24 h, and inhibition zones were measured in triplicate [22,23].

2.3.2. Phytate Degradation Activity in Simulated Gastrointestinal Fluids

Crude cell-free enzyme extracts were prepared and stored at −20 °C [24]. To assess phytate degradation under simulated gastrointestinal conditions, 200 µL of extract was pre-incubated with 200 µL of SGJ or SIJ at 37 °C for 60 min [25]. Phytase activity was determined using sodium phytate in acetate buffer (pH 5.0), and reactions stopped with 20% (w/v) trichloroacetic acid (TCA) solution; released phosphate quantified at 405 nm against a potassium monophosphate standard [26,27]. Phytase activity was calculated by applying the Beer–Lambert law:
A = ε × l × c
where A = absorbance;
  • ε = molar absorptivity constant (µM−1cm−1);
  • l = path length (1 cm);
  • c = concentration (µM).
One unit of phytase (U) was defined as the amount of enzyme that produced 1 µmol of inorganic phosphorous per min at 50 °C. To determine the specific activity, total protein concentration of the crude enzyme extract was determined by using Bradford micro assay [28] and adjusting the total assay volume to 2 mL of bovine serum albumin (100 µg/mL), which was used as the standard. Specific activity was defined as U per mg of protein.

2.4. Bacterial Isolate Sequencing and Identification

16S rRNA gene sequence analysis was used for bacterial identification of the probiotic candidate isolates as described elsewhere [29]. Bacterial genomic DNA was extracted using the QIAamp Fast DNA Stool Mini Kit (Qiagen Ltd.-UK; Manchester, UK) followed by amplification using universal primers 27F (5′-GAGTTTGATCATGGCTCAG-3′) and 1492R (5′-GGTTACCTTGTTACGACTT-3′). The PCR reaction mixture comprised 12.5 µL of PCRBIO Ultra Mix (PCR Biosystems Ltd., London, UK), 10.5 µL of diethylpyrocarbonate (DEPC)-treated water (Thermo Fisher Scientific Inc.; Cheshire, UK), 1 µL of each primer, and 1 µL of template DNA. Thermal cycling conditions consisted of an initial denaturation at 95 °C for 5 min, followed by 32 cycles at 94 °C for 15 s, 55 °C for 15 s, and 72 °C for 30 s. The final extension was at 72 °C for 1 min. Purified DNA samples were submitted to the DNA Sequencing and Services facility at the University of Dundee. Resulting sequences were analysed using the Basic Local Alignment Search Tool (BLAST; https://blast.ncbi.nlm.nih.gov (accessed on 13 December 2022)) to identify closely related species, with percent identities exceeding 98%. For phylogenetic analysis, chromatogram files (.ab1) were edited in MEGA (v.11.0.13) to generate a consensus sequence, which was exported in FASTA format. Sequence similarity was determined using BLASTn against the NCBI GenBank nucleotide database. Closely related strain sequences were retrieved from GenBank and aligned with the isolate sequence using ClustalW in MEGA. A neighbour-joining phylogenetic tree was constructed based on the Kimura 2-parameter model, and 1000 bootstrap replicates were used to evaluate the robustness of the tree’s topology.

2.5. Probiotic Diet Preparation

The basal diet was formulated using Animal Feed Formulation Software (AFOS Cloud 4.16) to meet the known nutrient requirements of Nile tilapia [30,31] (Table 1). Probiotic diets were prepared with isolates C61 (PT1) and T70 (PT2). Cultures were grown in TSB, incubated overnight at 25 °C (120 rpm), centrifuged (4000× g, 10 min), washed twice with PBS, and resuspended. Suspensions were top-sprayed onto the pelleted basal diet and homogenised; controls received sterile PBS. The diets were left to dry at room temperature for 24 h and were top-dressed with sunflower oil at 1% (w/w) while mixing to ensure uniform coating. The prepared diets were air-dried at room temperature for 24–48 h. Probiotic levels were 1.03 × 10⁷ CFU/g (PT1) and 1.67 × 10⁷ CFU/g (PT2), confirmed by spread-plating on TSA. Representative colonies were identified as Bacillus subtilis (Section 2.3). Diet composition was analysed per [32] (Table 2).

2.6. Experimental Design and Feeding

The growth trial was conducted in a recirculating aquaculture system (RAS) of the Tropical Unit Aquarium at the University of Plymouth. The RAS was equipped with a Kaldnes (K1) biofilter (Evolution Aqua Ltd.; Wigan, UK) in conjunction with heavy aeration from a separate air pump. The water exchange rate had approximately a four-times-per-hour turnover for each tub, delivered by a Swelluk Premium 5000 Pump (40 W; 5000 lph rating; Swell UK Ltd., Cheshire, UK). Water temperature (27.25 ± 0.05 °C), dissolved oxygen (7.33 ± 0.29 mg/L), and pH (6.73 ± 0.30) were monitored daily, while ammonium (0 mg/L), nitrite (0 mg/L) and nitrate (>10 mg/L) were monitored weekly; and all were maintained within the acceptable range for the fish species.
O. niloticus were procured from University of Stirling and transported to the University of Plymouth aquaria. After acclimation, Nile tilapia fingerlings (5.32 ± 0.12 g) were distributed randomly into experimental tanks with capacities of 30 L, filled up to 13 L of water with a stocking density of 22 fish per tank. Experimental diets were randomly assigned among nine tanks with three replicates per treatment. All fish were weighed prior to day one of feeding and feed intake was set at 3–4% of biomass per day. Daily feed was allocated into four equal rations and feed intake was adjusted every week by batch weighing after a 24 h feed deprivation period.

2.7. Growth Performance, Feed Utilisation, and Carcass Analyses

After the 40-day feeding trial, fish were euthanised following UK Home Office schedule 1 procedures [33]. Growth performance and feed utilisation were evaluated as final weight (FW), net wet gain (NWG), specific growth rate (SGR), feed intake (FI), feed conversion ratio (FCR), protein efficiency ratio (PER), condition factor (CF), and % survival (Supplementary Equations (S1)–(S6)). All calculations were based on each replicate tank treatment. Whole fish (three per replicate tank) were used for carcass analyses to calculate ash, protein, and fat/lipid content [32].
Table 2. Proximate composition of the experimental diets.
ComponentTreatment
CONPT1PT2
Dry matter93.2 ± 0.093.2 ± 0.193.2 ± 0.0
Protein *43.5 ± 0.444.4 ± 0.444.1 ± 0.3
Lipid *4.9 ± 0.15.1 ± 0.24.9 ± 0.2
Ash *4.5 ± 0.34.7 ± 0.14.6 ± 0.2
NFE *a47.1 ± 0.645.9 ± 0.646.4 ± 0.3
GE (kJ/g) b20.3 ± 0.020.4 ± 0.020.3 ± 0.1
* Wet weight basis. a NFE, nitrogen-free extract; b dietary gross energy (GE) was estimated from the analysed dietary macronutrient composition and the corresponding energy equivalents: 17.2 kJ g1 for carbohydrates, 23.6 kJ g1 for crude protein, and 39.5 kJ g1 for lipids [34].

2.8. Histological and Electron Microscopy Analysis

For histological analysis, skin samples were obtained from the dorsal region, which is immediately above the lateral line and below the dorsal fin base, to ensure consistent sampling across individuals. Whole intestine was excised and the posterior segment (ca. 5 mm) of the intestine was collected. Skin and posterior intestine samples (n = 9 per treatment) were fixed in 10% formalin. Tissues were processed using a Leica TP1020 Auto Processor (Leica Microsystems Ltd.; Milton Keynes, UK) through graded IMS and embedded in paraffin; multiple consecutive tissues sections were cut at 4 µm (Leica RM2235, Leica Microsystems Ltd.; Milton Keynes, UK). Sections were mounted, dried overnight, and stained with Hematoxylin and Eosin (H&E) and Alcian blue van-Gieson (AB-vG). Sections were mounted with a coverslip and DPX and dried prior to imaging for morphometric analysis. The prepared slides were photographed using a Leica DMD 108 microimaging system (Leica Microsystems Ltd.; Milton Keynes, UK). H&E-stained samples were evaluated for mucosal fold length (MFL), lamina propria width (LPW), muscularis thickness (MT), and intraepithelial leukocyte (IEL) counts. ABvG-stained slides were analysed for goblet cell (GC) counts and coverage. Five mucosal folds were randomly selected for measurement from among those that were fully visible in the cross-section and representative of the overall intestinal morphology. Measurements were taken from folds distributed around the intestinal lumen to ensure that no single region of the section was overrepresented. Five intact mucosal folds per sample were used to measure MFL, LPW, IEL counts, and GC counts while MT per sample was determined from the mean of 10 measurements along random regions of the muscularis [35]. Image analysis was performed using the ImageJ 1.54d software (National Institutes of Health, Bethesda, MD, USA).
For scanning electron microscopy (SEM), SEM samples were rinsed with sodium cacodylate buffer (0.1 M, pH 7.2) and dehydrated using graded ethanol and hexamethyldisilazane (HMDS). Dried samples were mounted on aluminium stubs and gold-sputter-coated for SEM imaging. All electron micrographs were analysed with ImageJ 1.54d (National Institute of Health, USA) with ten representative micrographs analysed per sample [36].

2.9. Culture-Based Intestinal Microbiological Analysis

Each fish was dissected in aseptic conditions, and the mid-intestine (n = 9; 3 per replicate tank) was extracted for intestinal microbiological analysis. Mid-intestinal tissues including its contents (ca. 100 mg) were homogenised in 900 µL of PBS and subjected to 10-fold serial dilution up to 106. For total viable count (TVC) cultures, 100 µL of the diluted homogenate (103 to 106 dilutions) were spread onto the TSA plates and incubated at 25 °C for 24 h. For Bacillus agar cultures, 100 µL of the diluted homogenate (102 to 104 dilutions) were spread onto the Bacillus agar (ATCC Medium 455) [37] and incubated at 25 °C for 24 h. Based on colony morphology, colonies were counted from statistically viable plates to calculate CFU/g.

2.10. 16S rRNA Gene Metabarcoding Analysis

16S rRNA gene metabarcoding analysis was performed to examine the composition and structure of the microbial communities in the fish intestinal samples. Genomic DNA extractions from intestinal samples (n = 9; 3 per replicate tank) were performed using QIAamp PowerFecal Pro DNA kit (Qiagen Ltd.-UK; Manchester, UK), following the manufacturer’s protocol. Genomic DNA samples were sent to Novogene UK Company Ltd. (Cambridge, UK) for 16S rRNA gene metabarcoding of the V3–V4 region. Based on clean data, DADA2 was used to denoise and obtain initial ASVs (Amplicon Sequence Variants). Species annotation was performed using the QIIME2 software (QIIME2-202202) using Silva annotation database. Subsequent analysis of alpha diversity and beta diversity were all performed based on the output normalised data.

Diversity Indices

To analyse the diversity, richness, and uniformity of the microbial communities within the group, alpha diversity was calculated from Goods coverage, Chao1, Shannon, and Simpson indices in QIIME2. To evaluate the complexity of the community composition and compare the differences between groups, beta diversity was calculated based on weighted and unweighted unifrac distances in QIIME2. A cluster tree was constructed by the unweighted pair-group method with arithmetic mean (UPGMA), which is based on the weighted unifrac distance matrix.

2.11. Statistical Analyses

The collected data were checked for normality using Shapiro–Wilk’s test and Levene’s test of equality of variances was used to test for the homogeneity of variances. For growth performance, histology, and microbiology data with normal distribution, one-way ANOVA was used to calculate the levels of significant differences between more than two groups. Tukey post hoc test was conducted to compare between means at p ≤ 0.05. When the data violated the assumption of normality and homogeneity of variances, the Kruskal–Wallis test was conducted as an alternative to one-way ANOVA. For probiotic activity in simulated gastrointestinal conditions, the Mann–Whitney U test was used as a non-parametric test to compare means between two unrelated groups. Paired T-test was used to compare means of the same group at different time points. Significant difference was accepted at p ≤ 0.05. All data analysis was performed using SPSS v.28.0.1.1.

3. Results

3.1. In Vitro Assays

A total of 150 probiotic candidate isolates were successfully cultured and isolated from the intestinal contents of C. carpio, while 113 probiotic candidates were isolated from the O. niloticus intestines. These isolates were initially screened for antagonism against A. hydrophila and Streptococcus iniae.
The 31 best-performing isolates that demonstrated antagonism to both (A. hydrophila and S. iniae) or one of the pathogens were tested against three further fish pathogens (Vibrio anguillarum, Vibrio parahaemolyticus, and Yersinia ruckeri). These 31 isolates were also assessed for their haemolytic activity and extracellular enzyme (xylanase, phytase, and tannase) activity. The complete results of these assays for each of the 31 isolates are shown in Table 3.

3.2. 16S rRNA Gene Sequence Analysis

Table 3 shows the results of 16S bacterial rRNA gene sequencing with percent identities and accession numbers of closely related species for each probiotic candidate isolate. BLAST search results revealed that out of the 31 isolates, 27 were identified as Bacillus species (C16, C22, C24, C27, C29, C39, C54, C61, C80, C122, C123, C140, C141, C146, T30, T32, T56, T66, T67, T68, T70, T71, T72, T103, T105, T112, T113), one as Pseudomonas mosselii (C72), one as Enterobacter sp. (C150), one as Plesiomonas shigelloides (T65), and one as Gottfriedia acidiceleris (T69).
From the results of the initial in vitro assays (Phase 1, Supplementary Figure S1), isolates C61 and T70 were selected as the two best-performing isolates. These two isolates were α haemolytic, displayed antagonism to more pathogens, and exhibited extracellular enzyme activity to more enzymes than the other isolates.
The 16S rRNA gene sequence of isolate C61 showed >99% similarity to both the Bacillus tequilensis strain 10b (NR104919.1) and Bacillus subtilis type strains in BLASTn analysis. In the neighbour-joining phylogenetic tree (Figure 1a), isolate C61 clustered with B. tequilensis (bootstrap value = 36) and grouped within the Bacillus subtilis species complex. The B. subtilis type strains formed a separate, moderately supported cluster (54–64%), while other Bacillus species such as B. spizizenii and B. rugosus formed distinct, well-supported lineages (>65%). Based on high sequence similarity and its phylogenetic position, isolate C61 was identified as a Bacillus sp. closely related to the B. subtilisB. tequilensis group.
Isolate T70 showed >99% similarity to Bacillus subtilis type strains in BLASTn analysis. In the neighbour-joining phylogenetic tree (Figure 1b), isolate T70 clustered tightly with B. subtilis strains DSM 10, IAM 12118, JCM 1465, NBRC 13719, and BCRC 10255, with bootstrap support of 63%. The close grouping of T70 within the B. subtilis clade and its high sequence similarity indicate that the isolate is most likely a strain of Bacillus subtilis or a closely related member of the B. subtilis species complex.
The two isolates were subjected to further assays under simulated gastrointestinal conditions (Phase 2, Supplementary Figure S1).

3.3. Probiotic Activity in Simulated Gastrointestinal Conditions

3.3.1. Pathogen Antagonism in SIJ

Isolates C61 and T70 were tested for pathogen antagonism against A. hydrophila under SIJ exposure. Table 4 shows the results of the assay for each probiotic candidate isolate. The degree of pathogen antagonistic activity of C61 with or without SIJ exposure was not significantly different to that of T70. The pathogen antagonism of C61 isolate did not significantly differ when exposed to SIJ. Meanwhile, the degree of pathogen antagonism of T70 was significantly reduced under SIJ exposure (p = 0.020).

3.3.2. Phytate Degradation Activity in Simulated Gastrointestinal Fluids

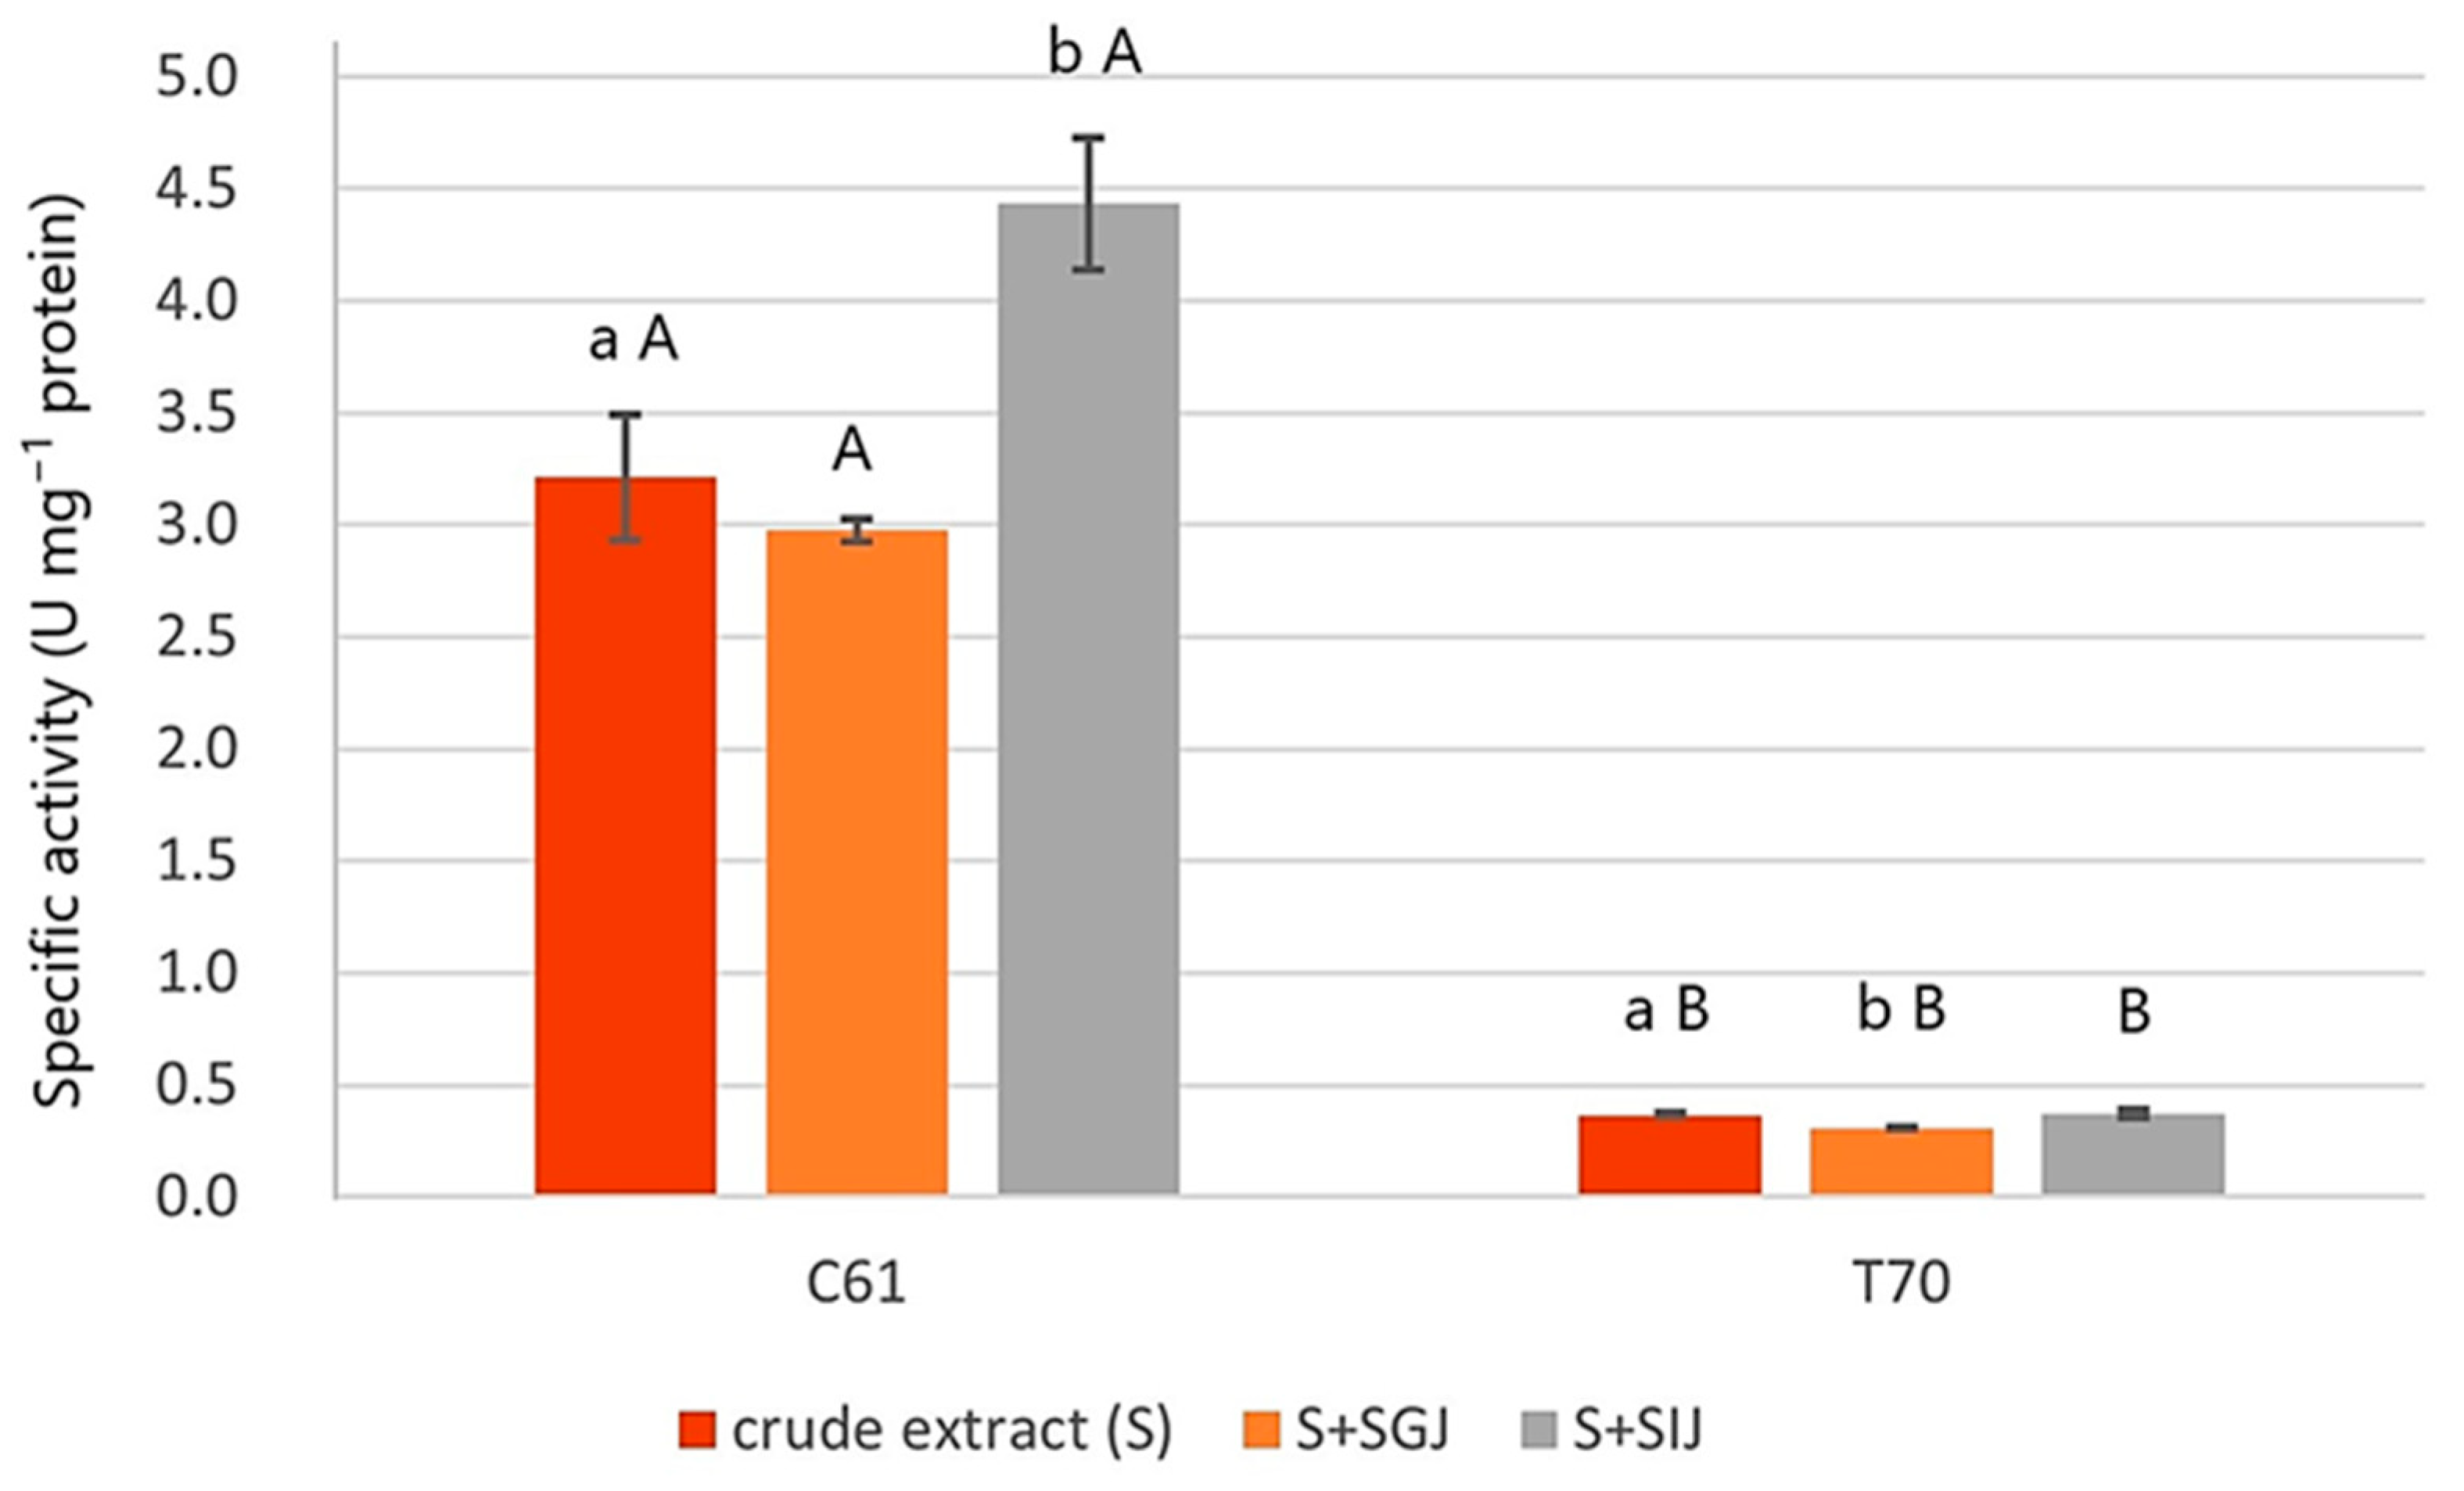
Figure 2 shows the phytase-specific activity of the crude enzyme extracts from C61 and T70 probiotic candidate isolates with and without exposure to SGJ and SIJ. The specific activity of C61 crude extract (S) was significantly higher than T70 (p = 0.050). Moreover, C61 crude extract had a significantly higher specific activity than T70 under both SGJ (p = 0.043) and SIJ (p = 0.046) exposure. These results also reveal the effect of SGJ and SIJ exposure on the phytase-specific activity of the crude enzyme extract from each probiotic candidate isolate. C61crude extract (S) had a significantly higher specific activity with SIJ exposure (p = 0.008) than without, while the specific activity of T70 crude extract significantly decreased under SGJ exposure (p = 0.026).

3.4. Growth Performance, Feed Utilisation, and Carcass Composition

All experimental groups showed reasonable growth performance as revealed by the assessed growth parameters after the feeding trial (Table 5). There were no significant differences found between the treatment groups. Moreover, there were no significant differences observed in the fish carcass composition across all groups (Table 6).

3.5. Histological Analysis

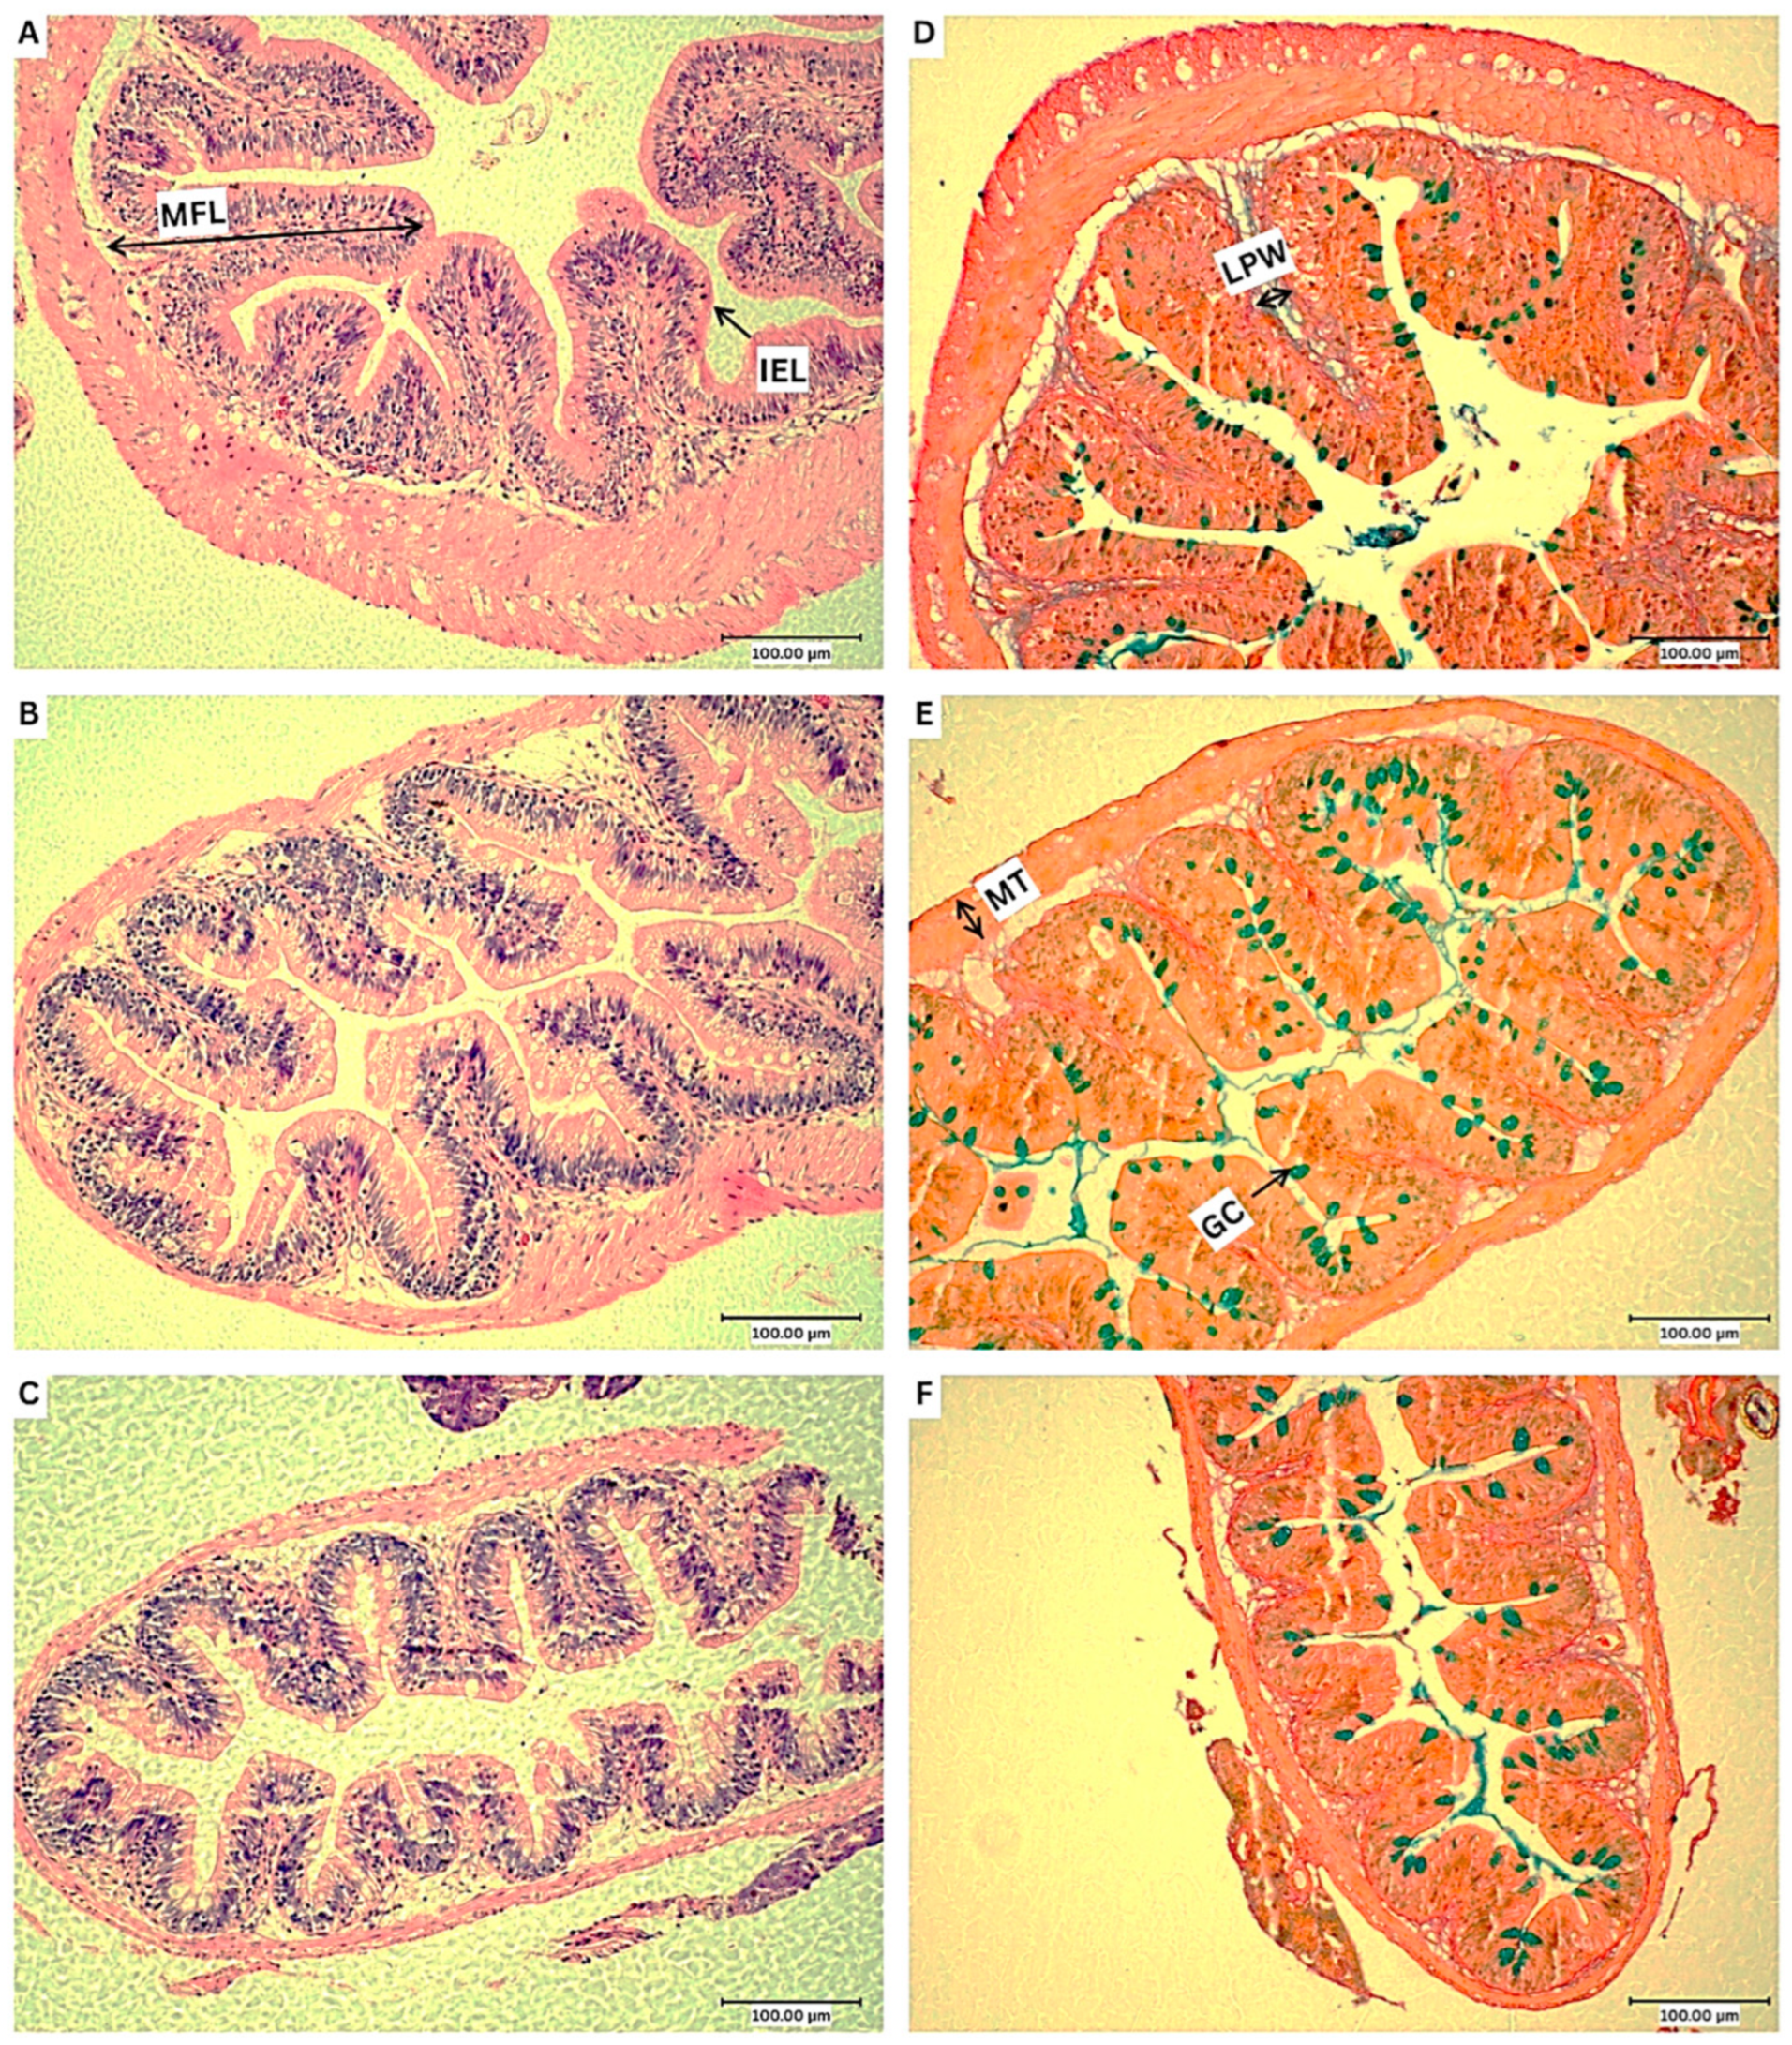
Histological analysis of the posterior intestine revealed intact epithelial lining with no signs of lesions, necrosis, or cellular detachment, indicating the absence of pathological damage in all treatment groups. Figure 3 shows the representative photomicrographs of the posterior intestine for each treatment group. Additionally, representative electron micrographs of the posterior intestine from SEM are presented in Figure 4. Table 7 presents the morphometrics data of the posterior intestine of Nile tilapia fed with experimental diets. The mucosal fold length of the PT1 group was significantly higher compared to the control (p = 0.006) and PT2 (p = 0.009)-fed groups. The muscularis thickness of the PT2 group was significantly lower than the control (p = 0.043) and PT1 (p = 0.020) groups. The goblet cell count was significantly higher in the PT1 group (p = 0.017) compared to the control regime.
Figure 5 shows the representative photomicrographs of skin histology for each treatment group. As presented in Figure 6, skin goblet cell density (p = 0.030) and coverage (p = 0.033) of the PT1 group were significantly higher compared to the control.

3.6. Intestinal Microbiological Analysis

The culture-based approach revealed no significant differences on the total viable counts of cultivable allochthonous bacteria present in the mid-intestine of fish across the treatments (Table 8). Presumptive Bacillus spp. levels were not significantly different across the groups.

3.7. Intestinal Microbiota Metabarcoding

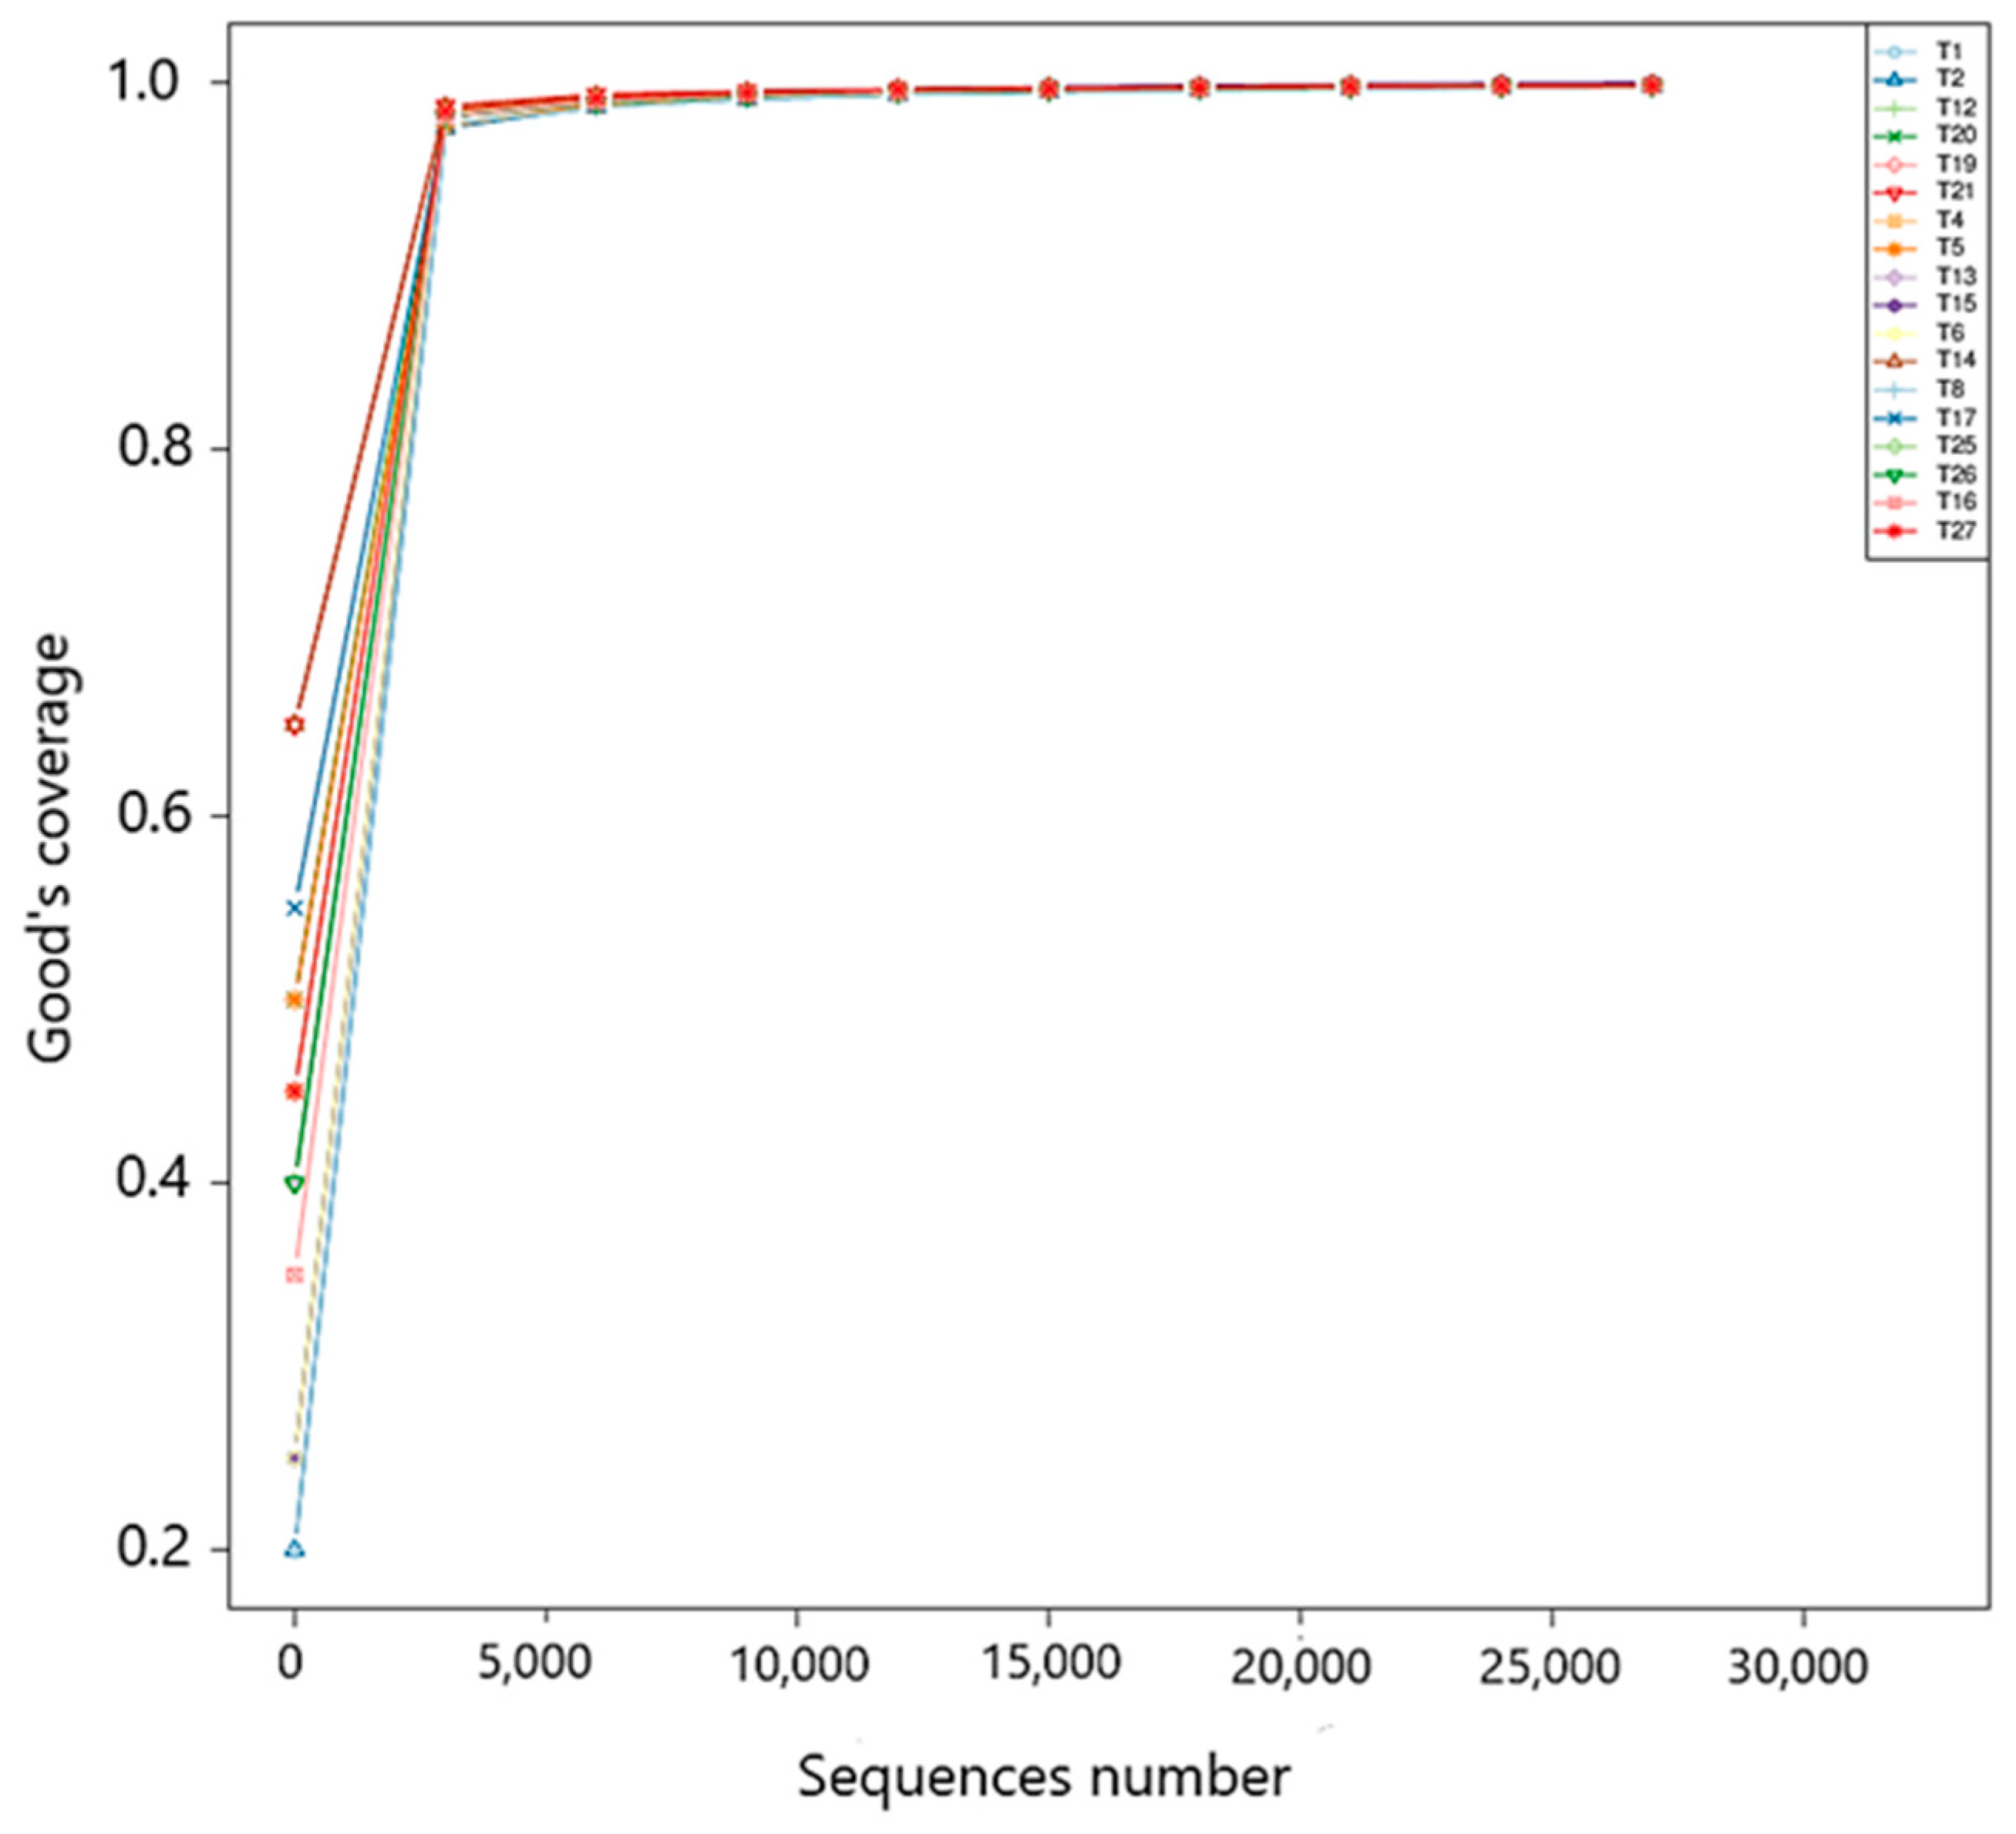
Out of 18 intestinal samples (n = 6 per treatment) from Nile tilapia fed with experimental diets, a total of 1,855,247 paired-end raw reads were obtained by 16S rRNA gene metabarcoding of the V3–V4 region. After data filtering to reveal clean tags, chimeric sequences were detected and removed to obtain 1,333,458 effective tags used for downstream analysis. The average number of effective tags from control group were 74,567, 72,198 from PT1 and 75,477 from PT2. After noise reduction using DADA2, ASVs were obtained, and Figure 7 presents the rarefaction curve of the Good’s coverage for each sample. The curve for each sample plateaued with all values close to one, indicating that the sequencing depth was sufficient to reflect the biodiversity of the samples.
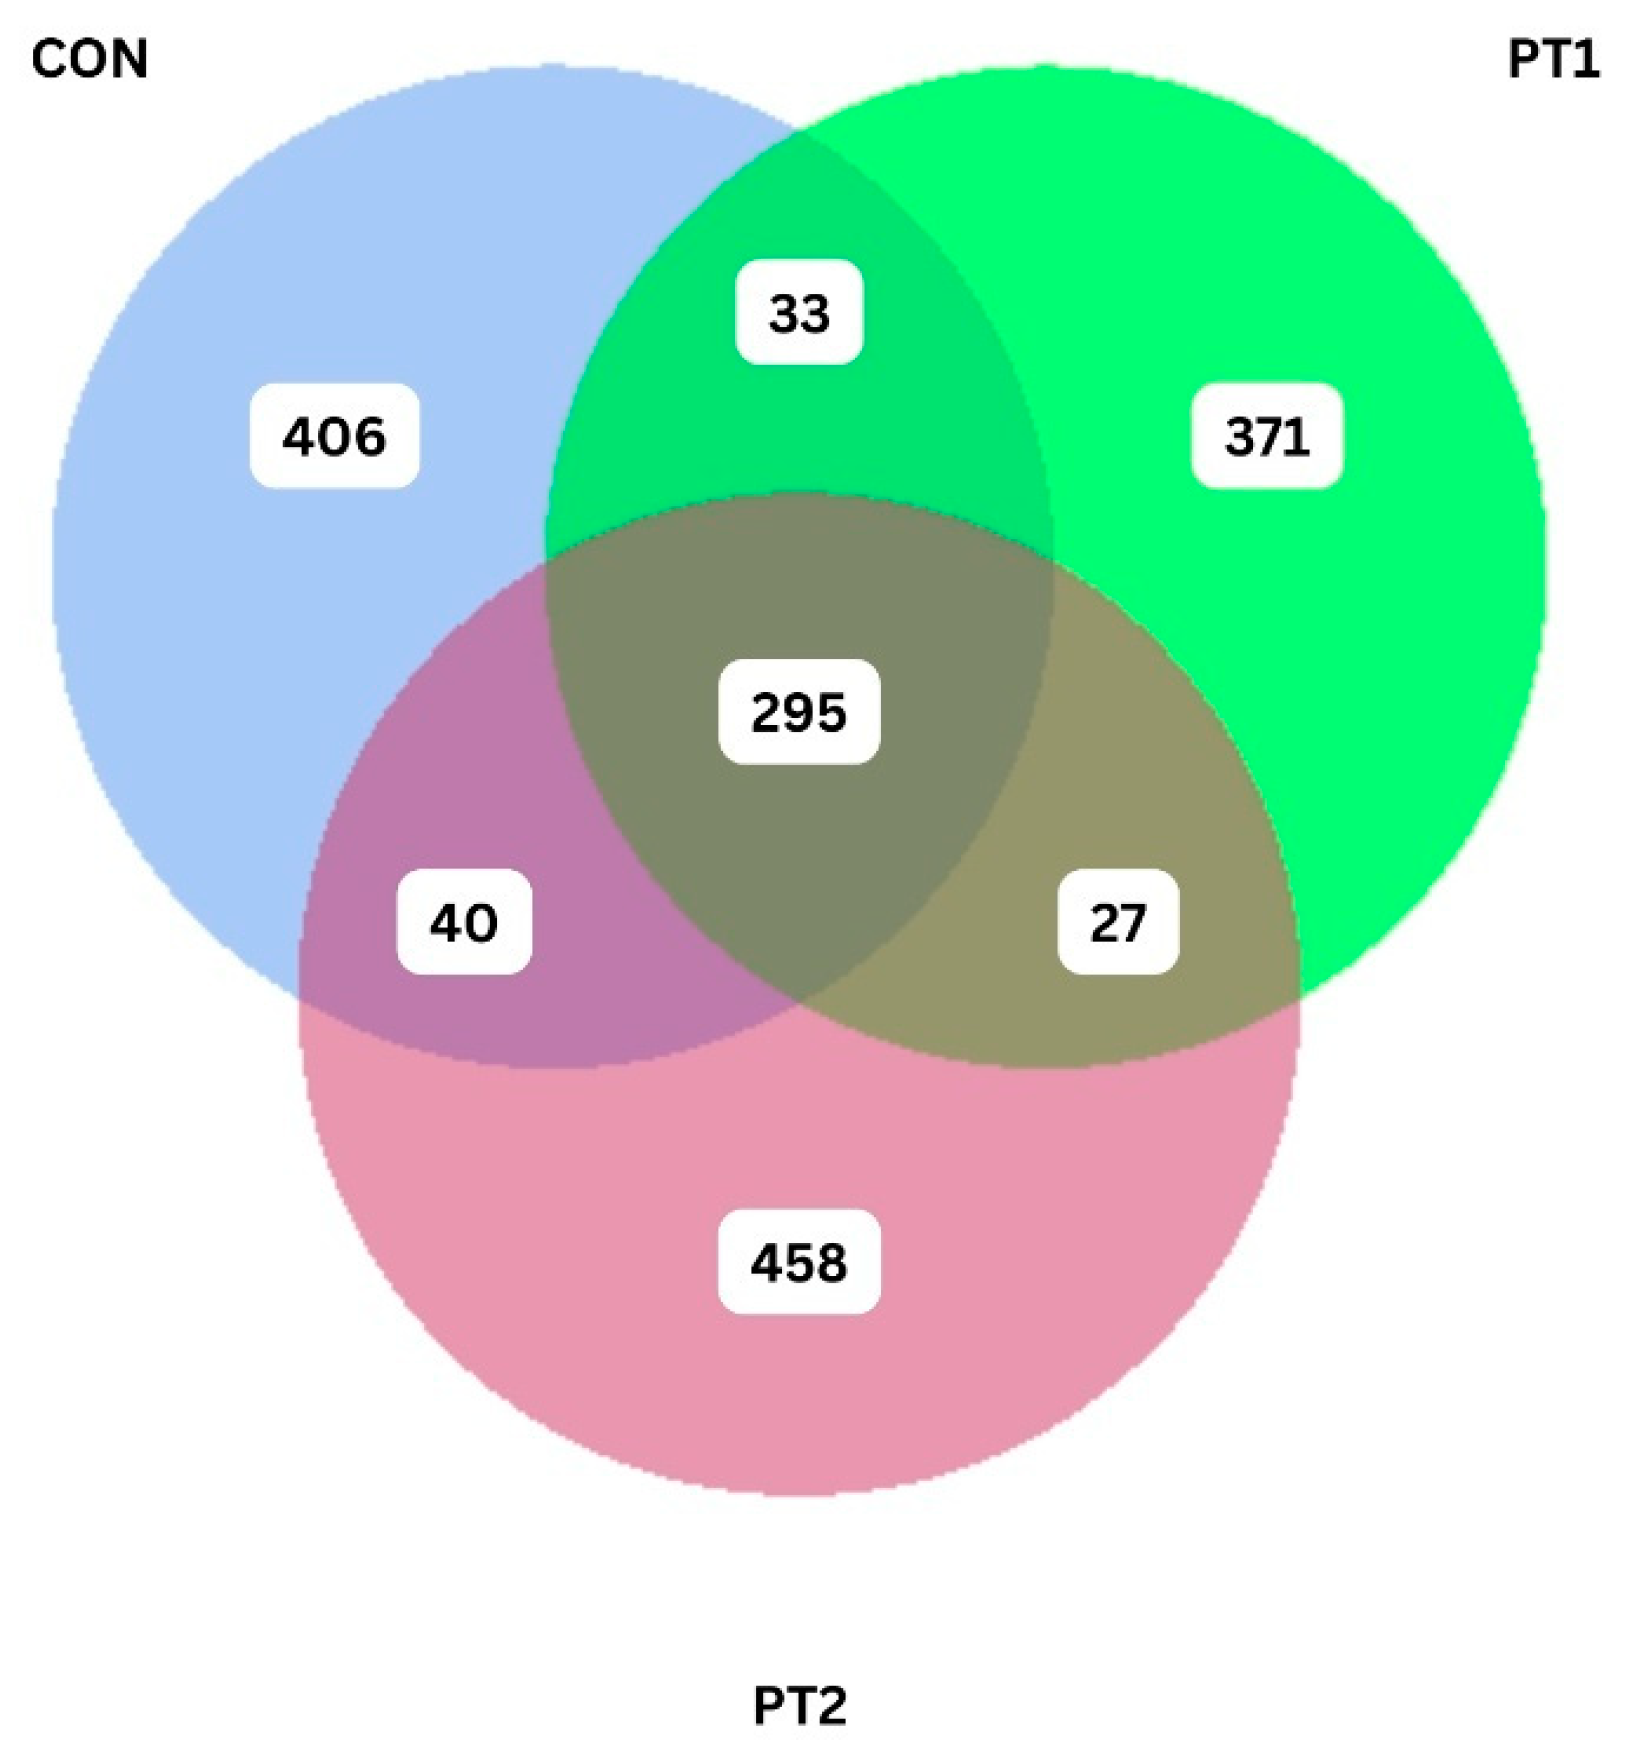
Figure 8 shows the Venn diagram of the ASV generated from each treatment. The control group had a total of 406 unique ASVs, sharing 33 and 40 ASVs to PT1 and PT2 group, respectively. PT2 had 458 unique ASVs, higher than the control group and the PT1 group with only 371.

3.7.1. Alpha Diversity Analysis

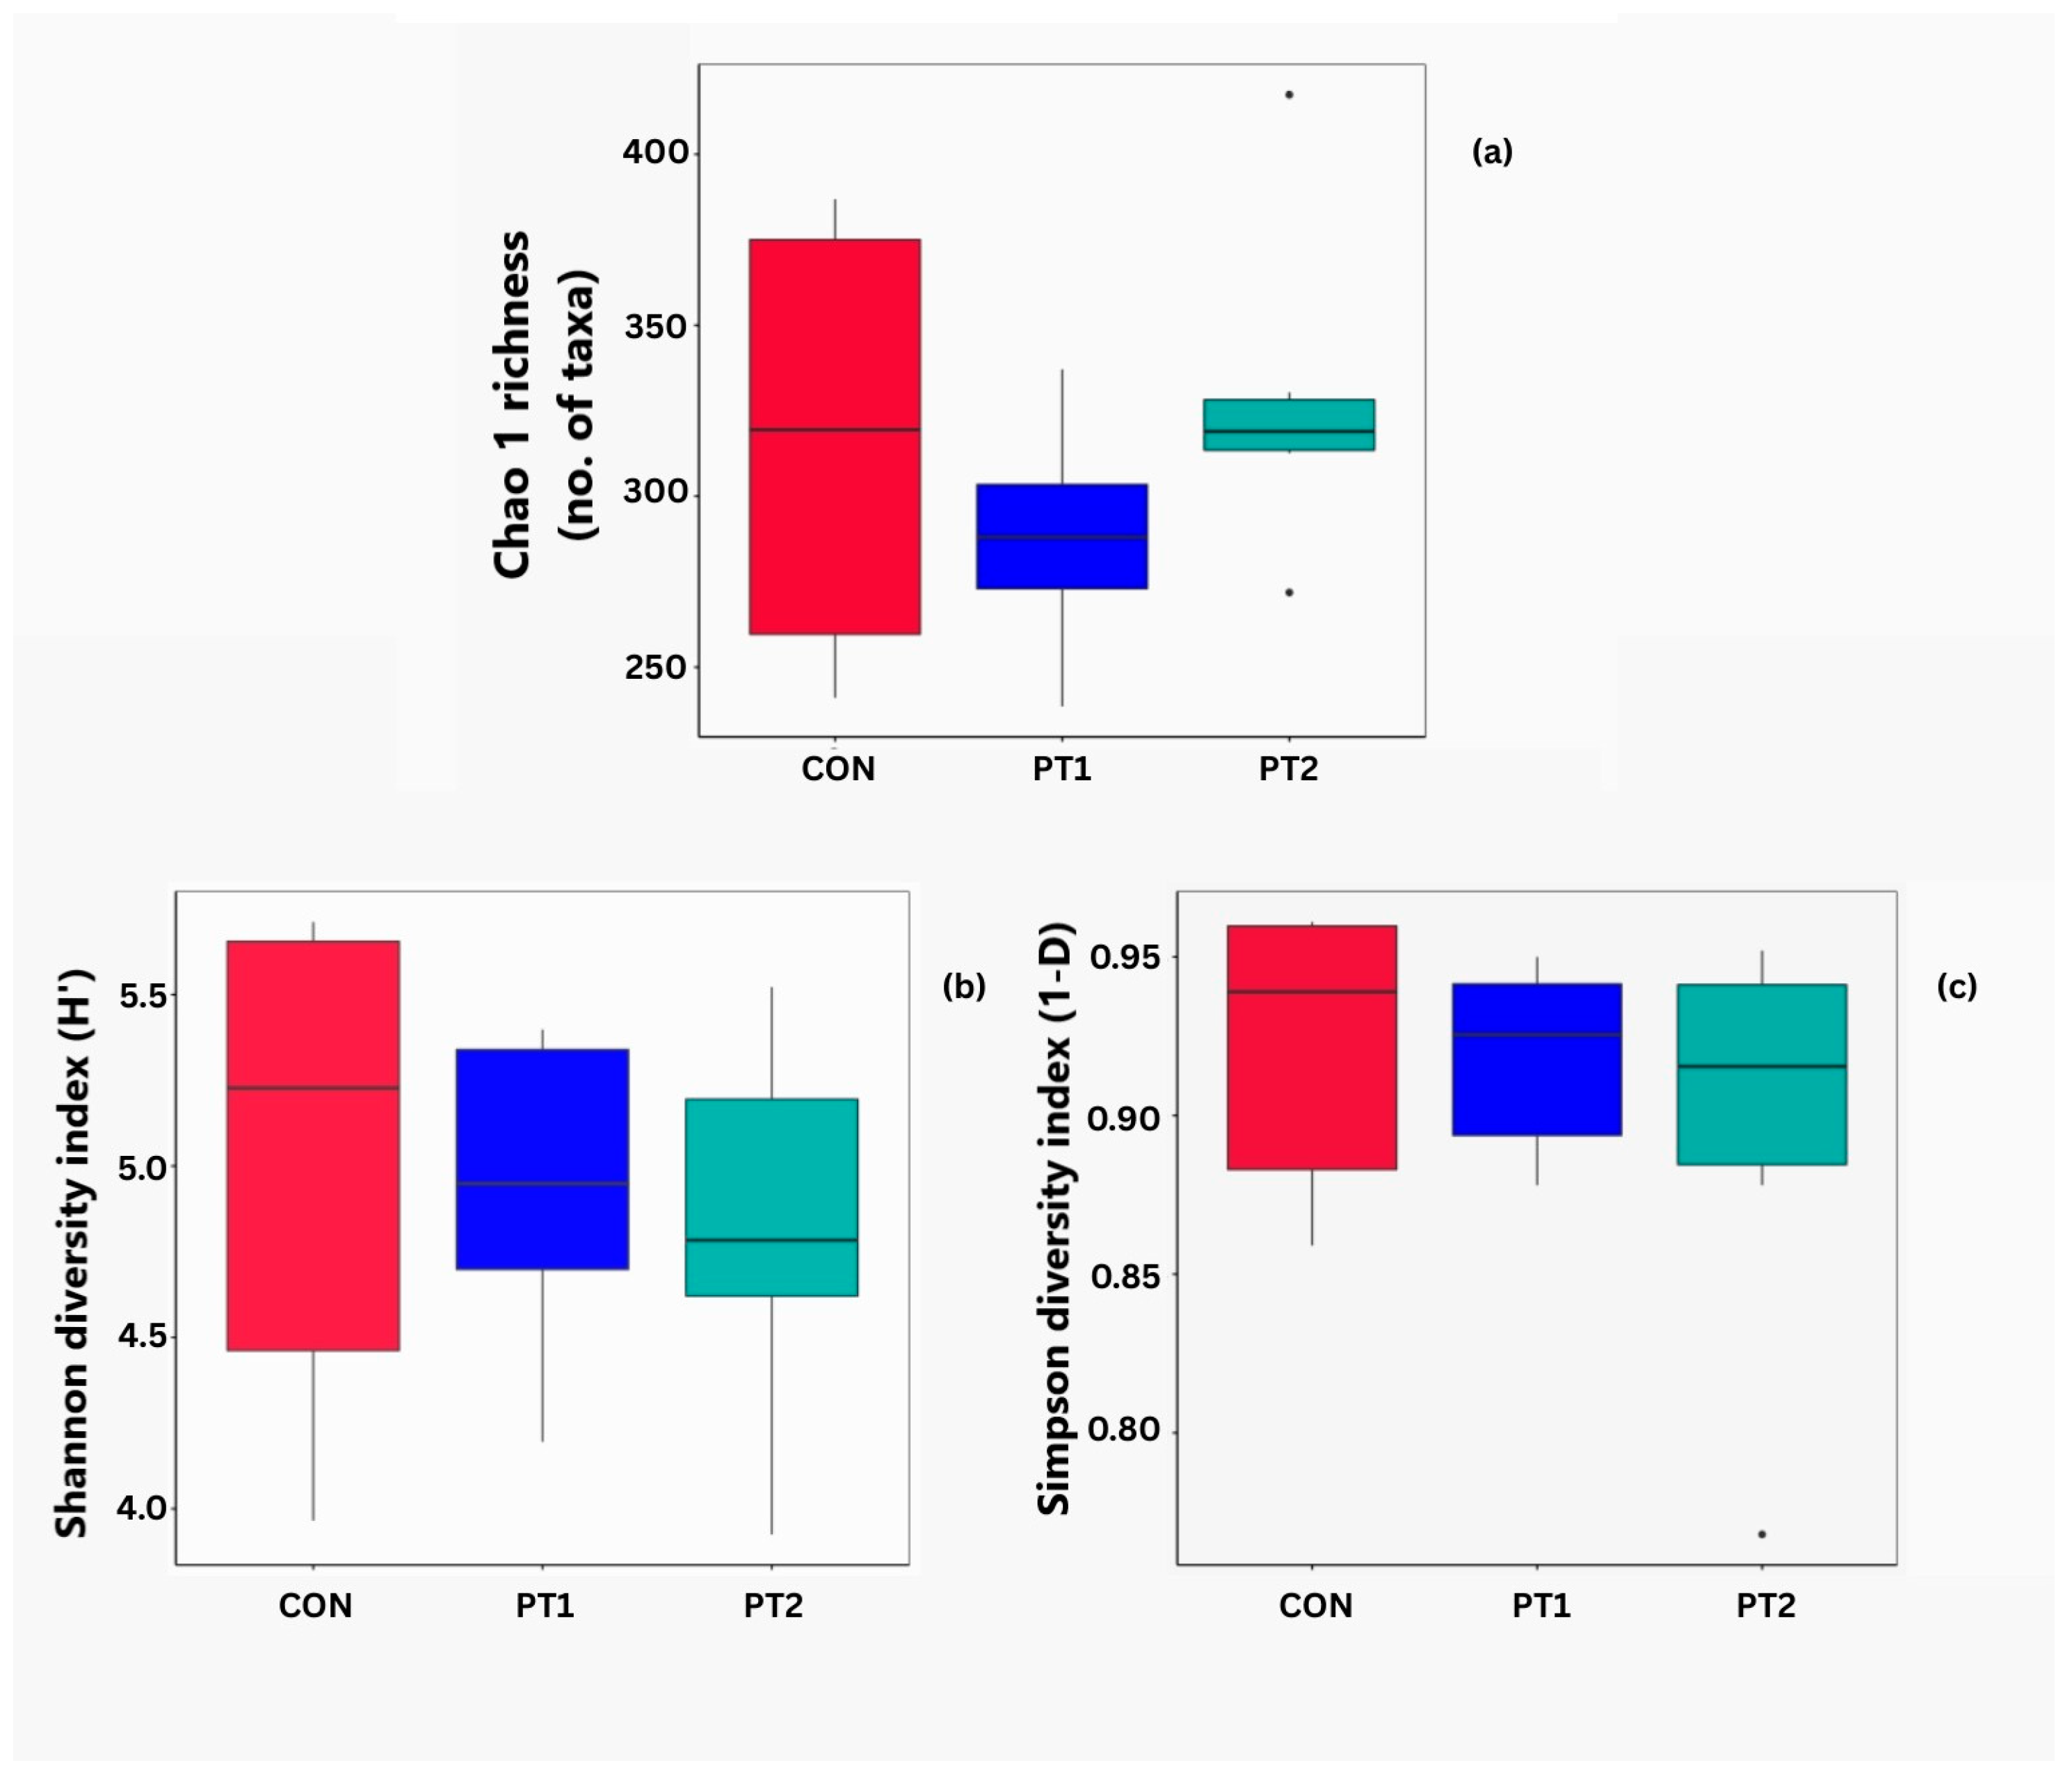
The alpha diversity indices of the intestinal microbiota of Nile tilapia fed with the experimental diets are shown in Figure 9. Chao1, Shannon, and Simpson indices were not significantly different across all groups (Figure 9a, Figure 9b, and Figure 9c, respectively).

3.7.2. Beta Diversity Analysis

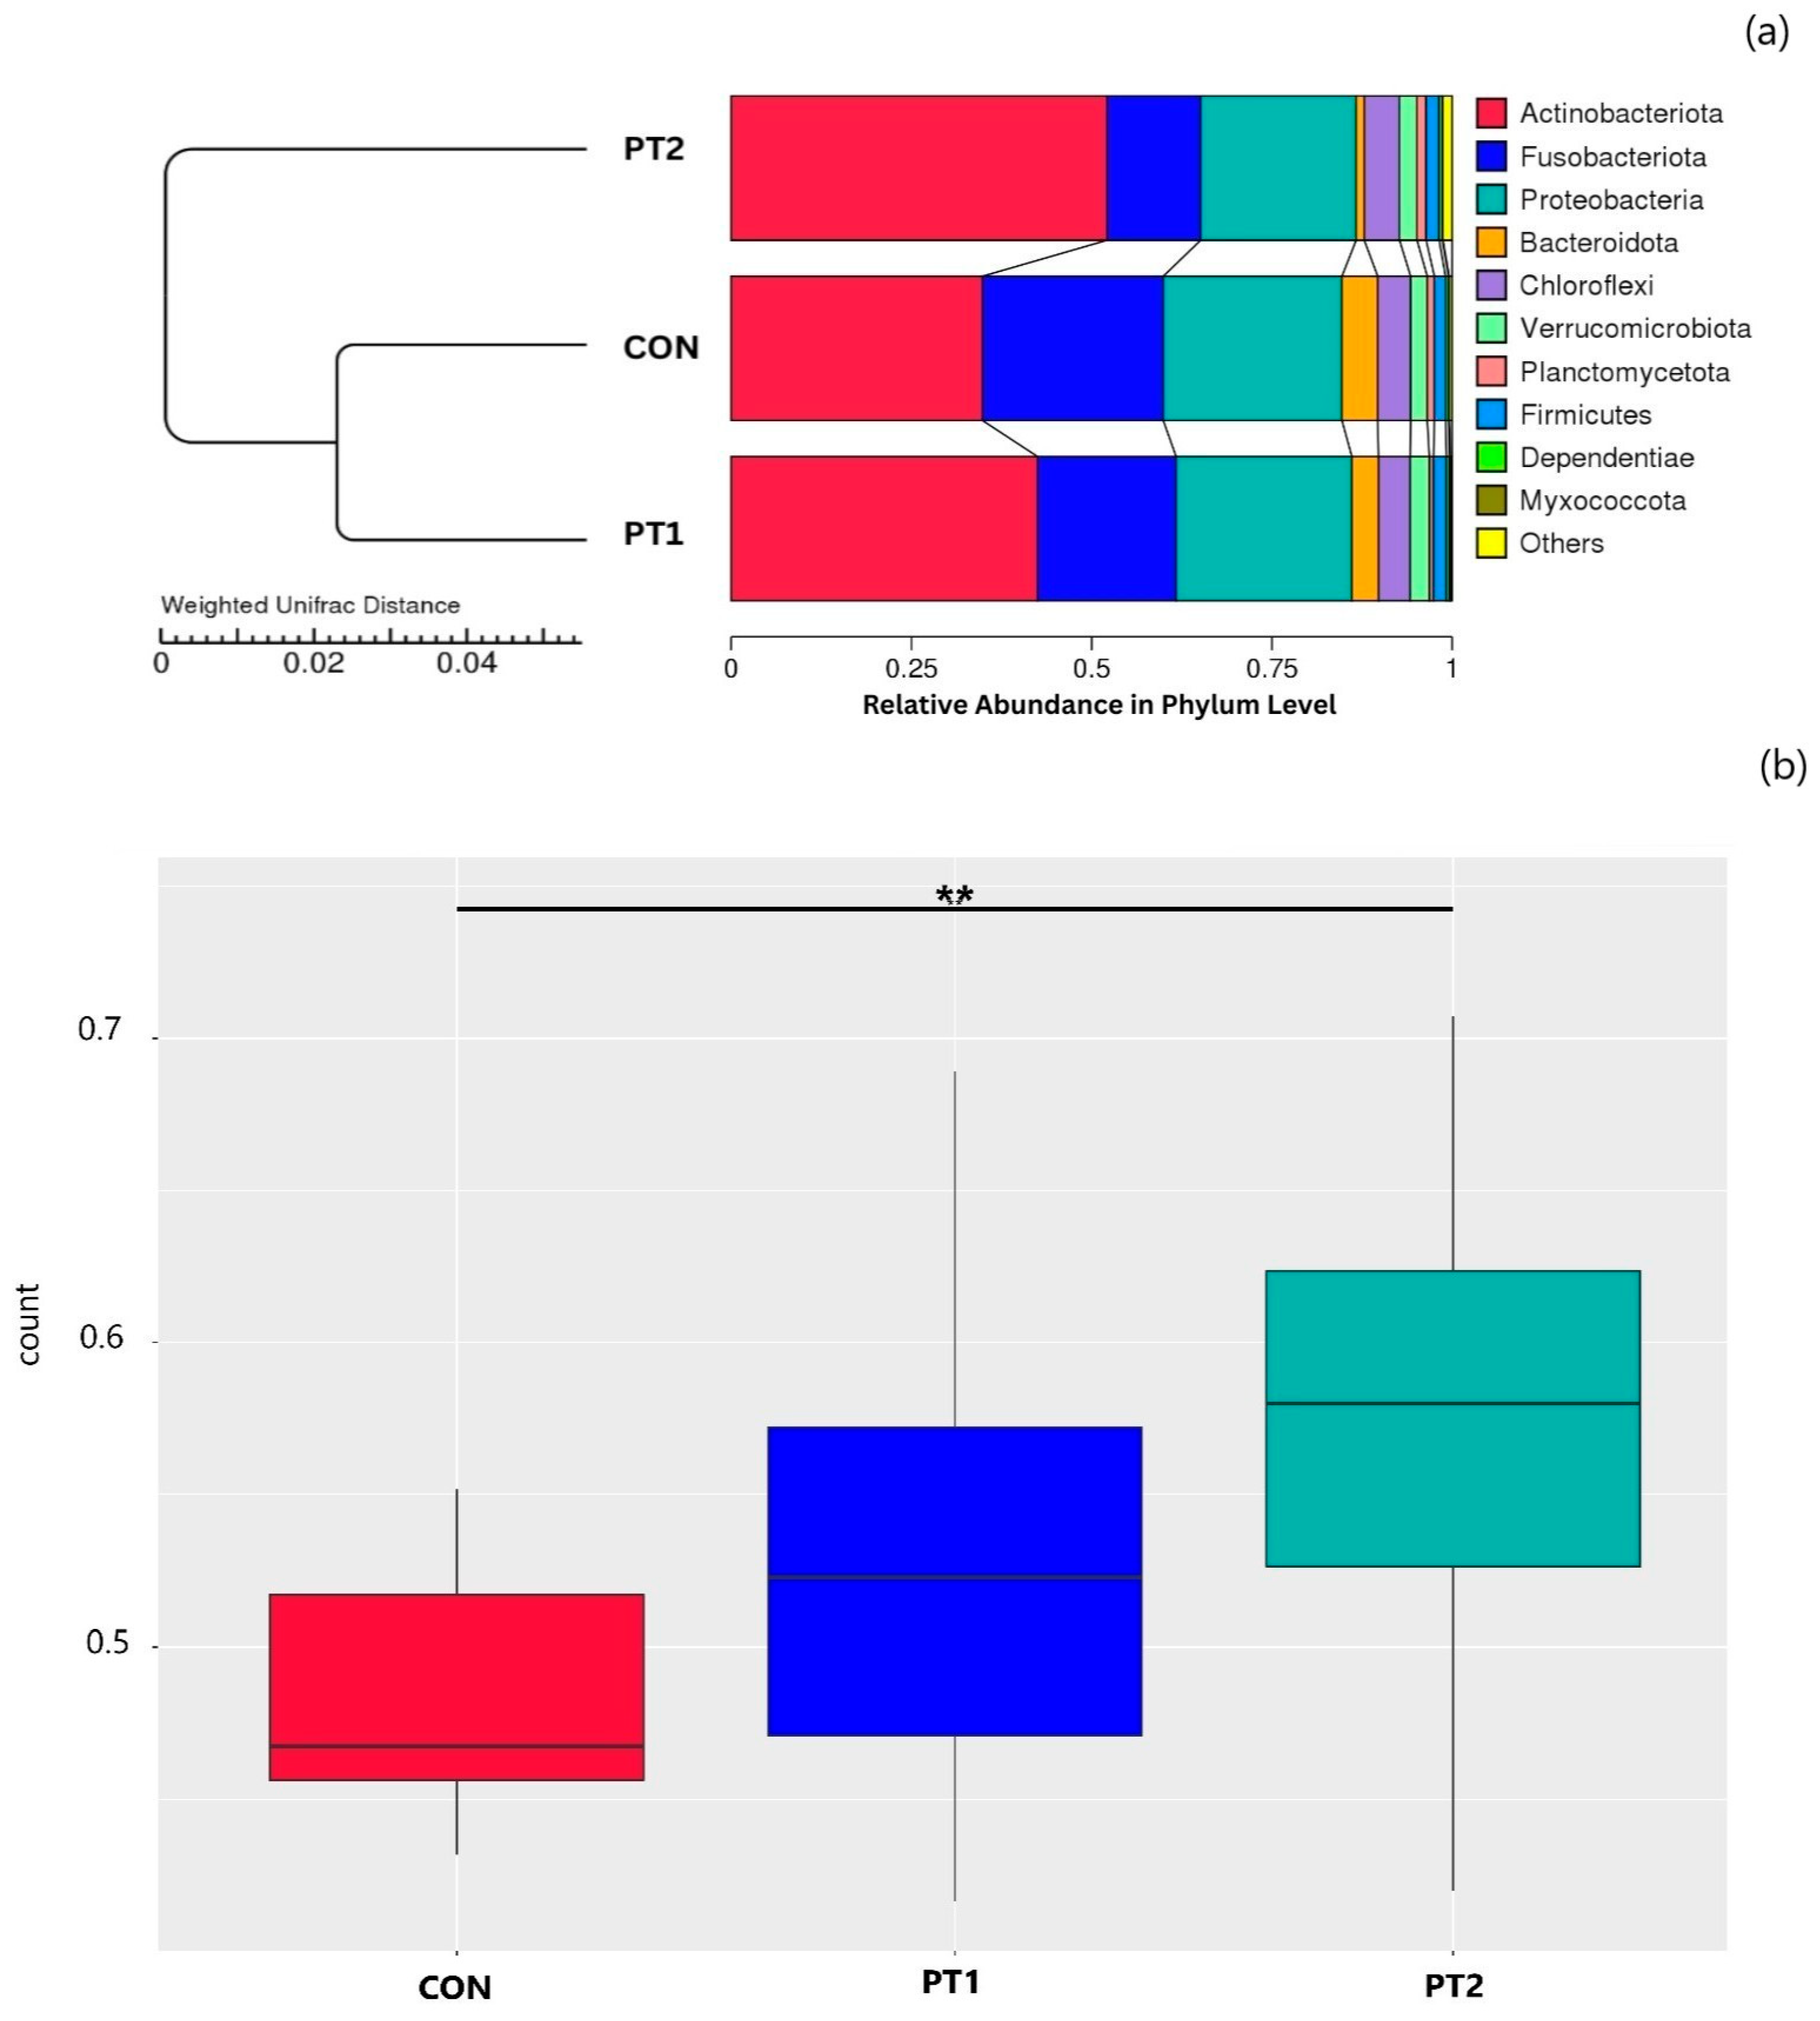
To describe variation in beta diversity, the dissimilarity coefficient between experimental groups was measured using weighted and unweighted UniFrac distances. To examine the similarity of the intestinal microbiota among the treatment groups, the unweighted pair-group method with arithmetic mean (UPGMA) method was used. As shown in the UPGMA cluster tree based on weighted UniFrac distance (Figure 10a), the control group was more similar to the PT1 group than the PT2 group. Based on the unweighted UniFrac distance beta diversity, there was a significant dissimilarity between the control and PT2 groups (Figure 10b).
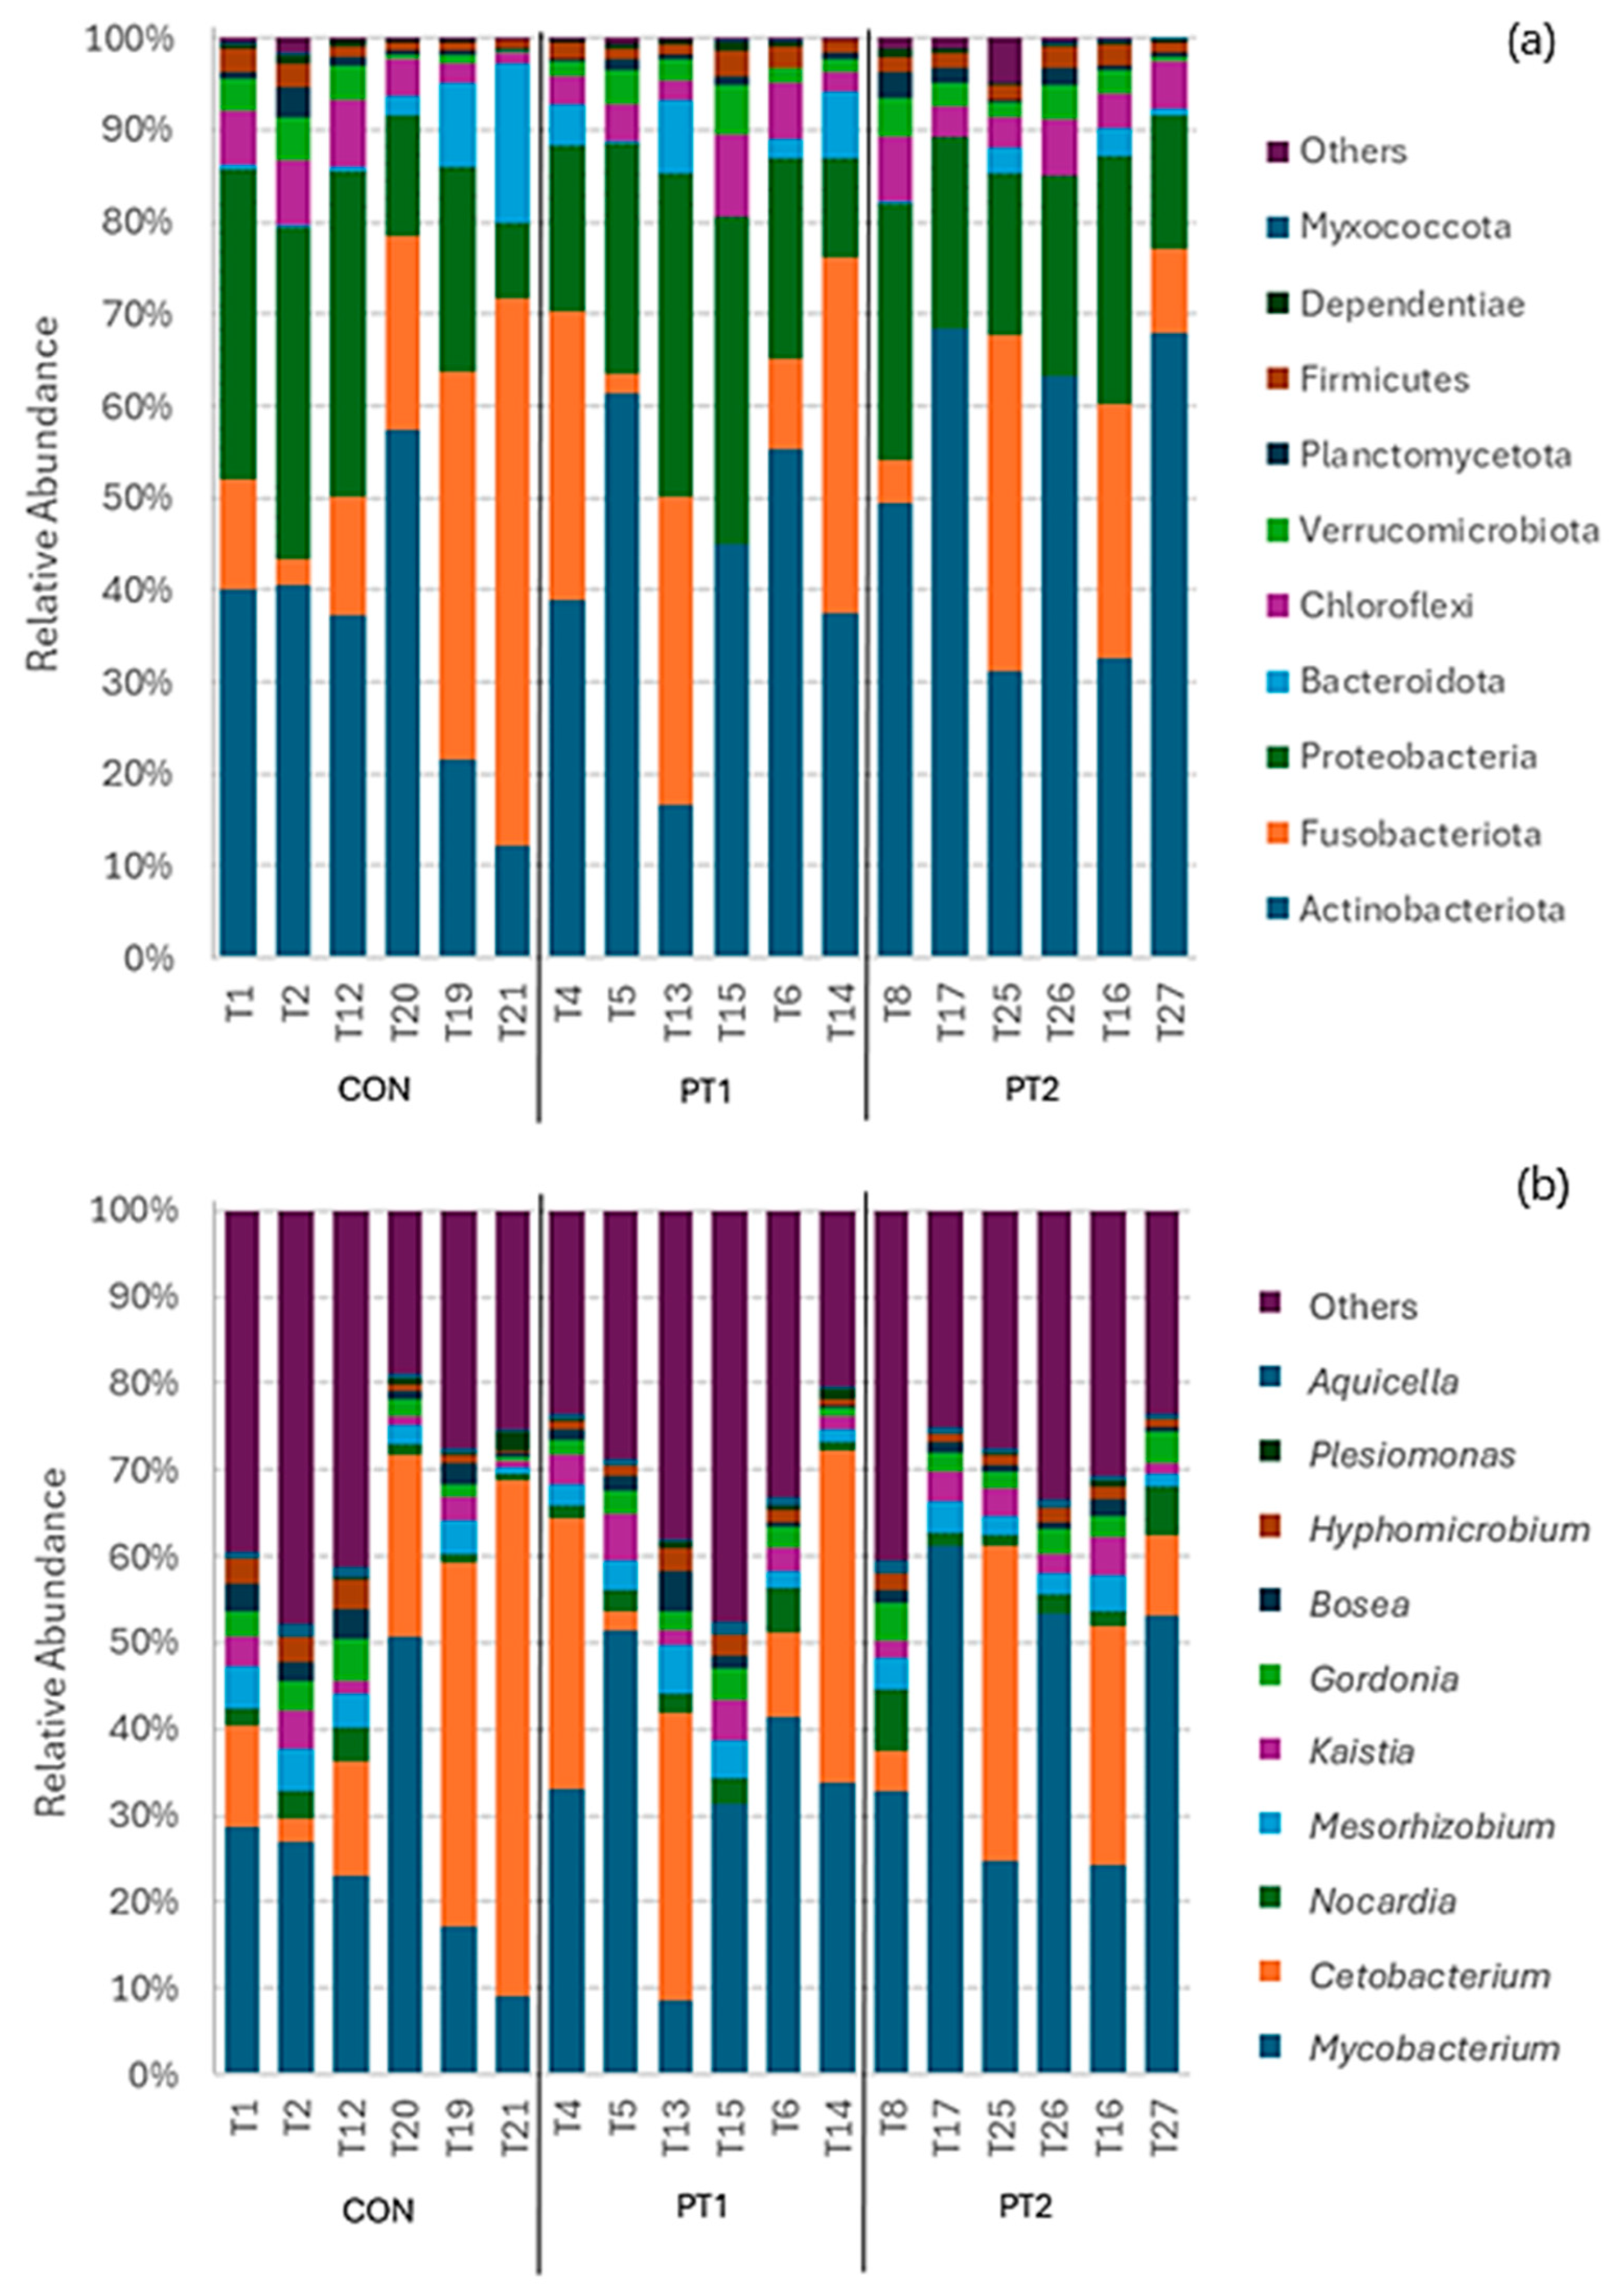
Figure 11 shows the relative abundance of the intestinal microbiota in different taxonomic levels. At the phylum level, the top 10 most abundant phyla were Actinobacteria, Fusobacteriota, Proteobacteria, Bacteroidota, Chloroflexi, Verrucomicrobiota, Planctomycetota, Firmicutes, Dependentiae, and Myxococcota (Figure 11a). At the genus level, the top 10 most abundant genera included Mycobacterium, Cetobacterium, Nocardia, Mesorhizobium, Kaistia, Gordonia, Bosea, Hyphomicrobium, Plesiomonas, and Aquicella (Figure 11b).
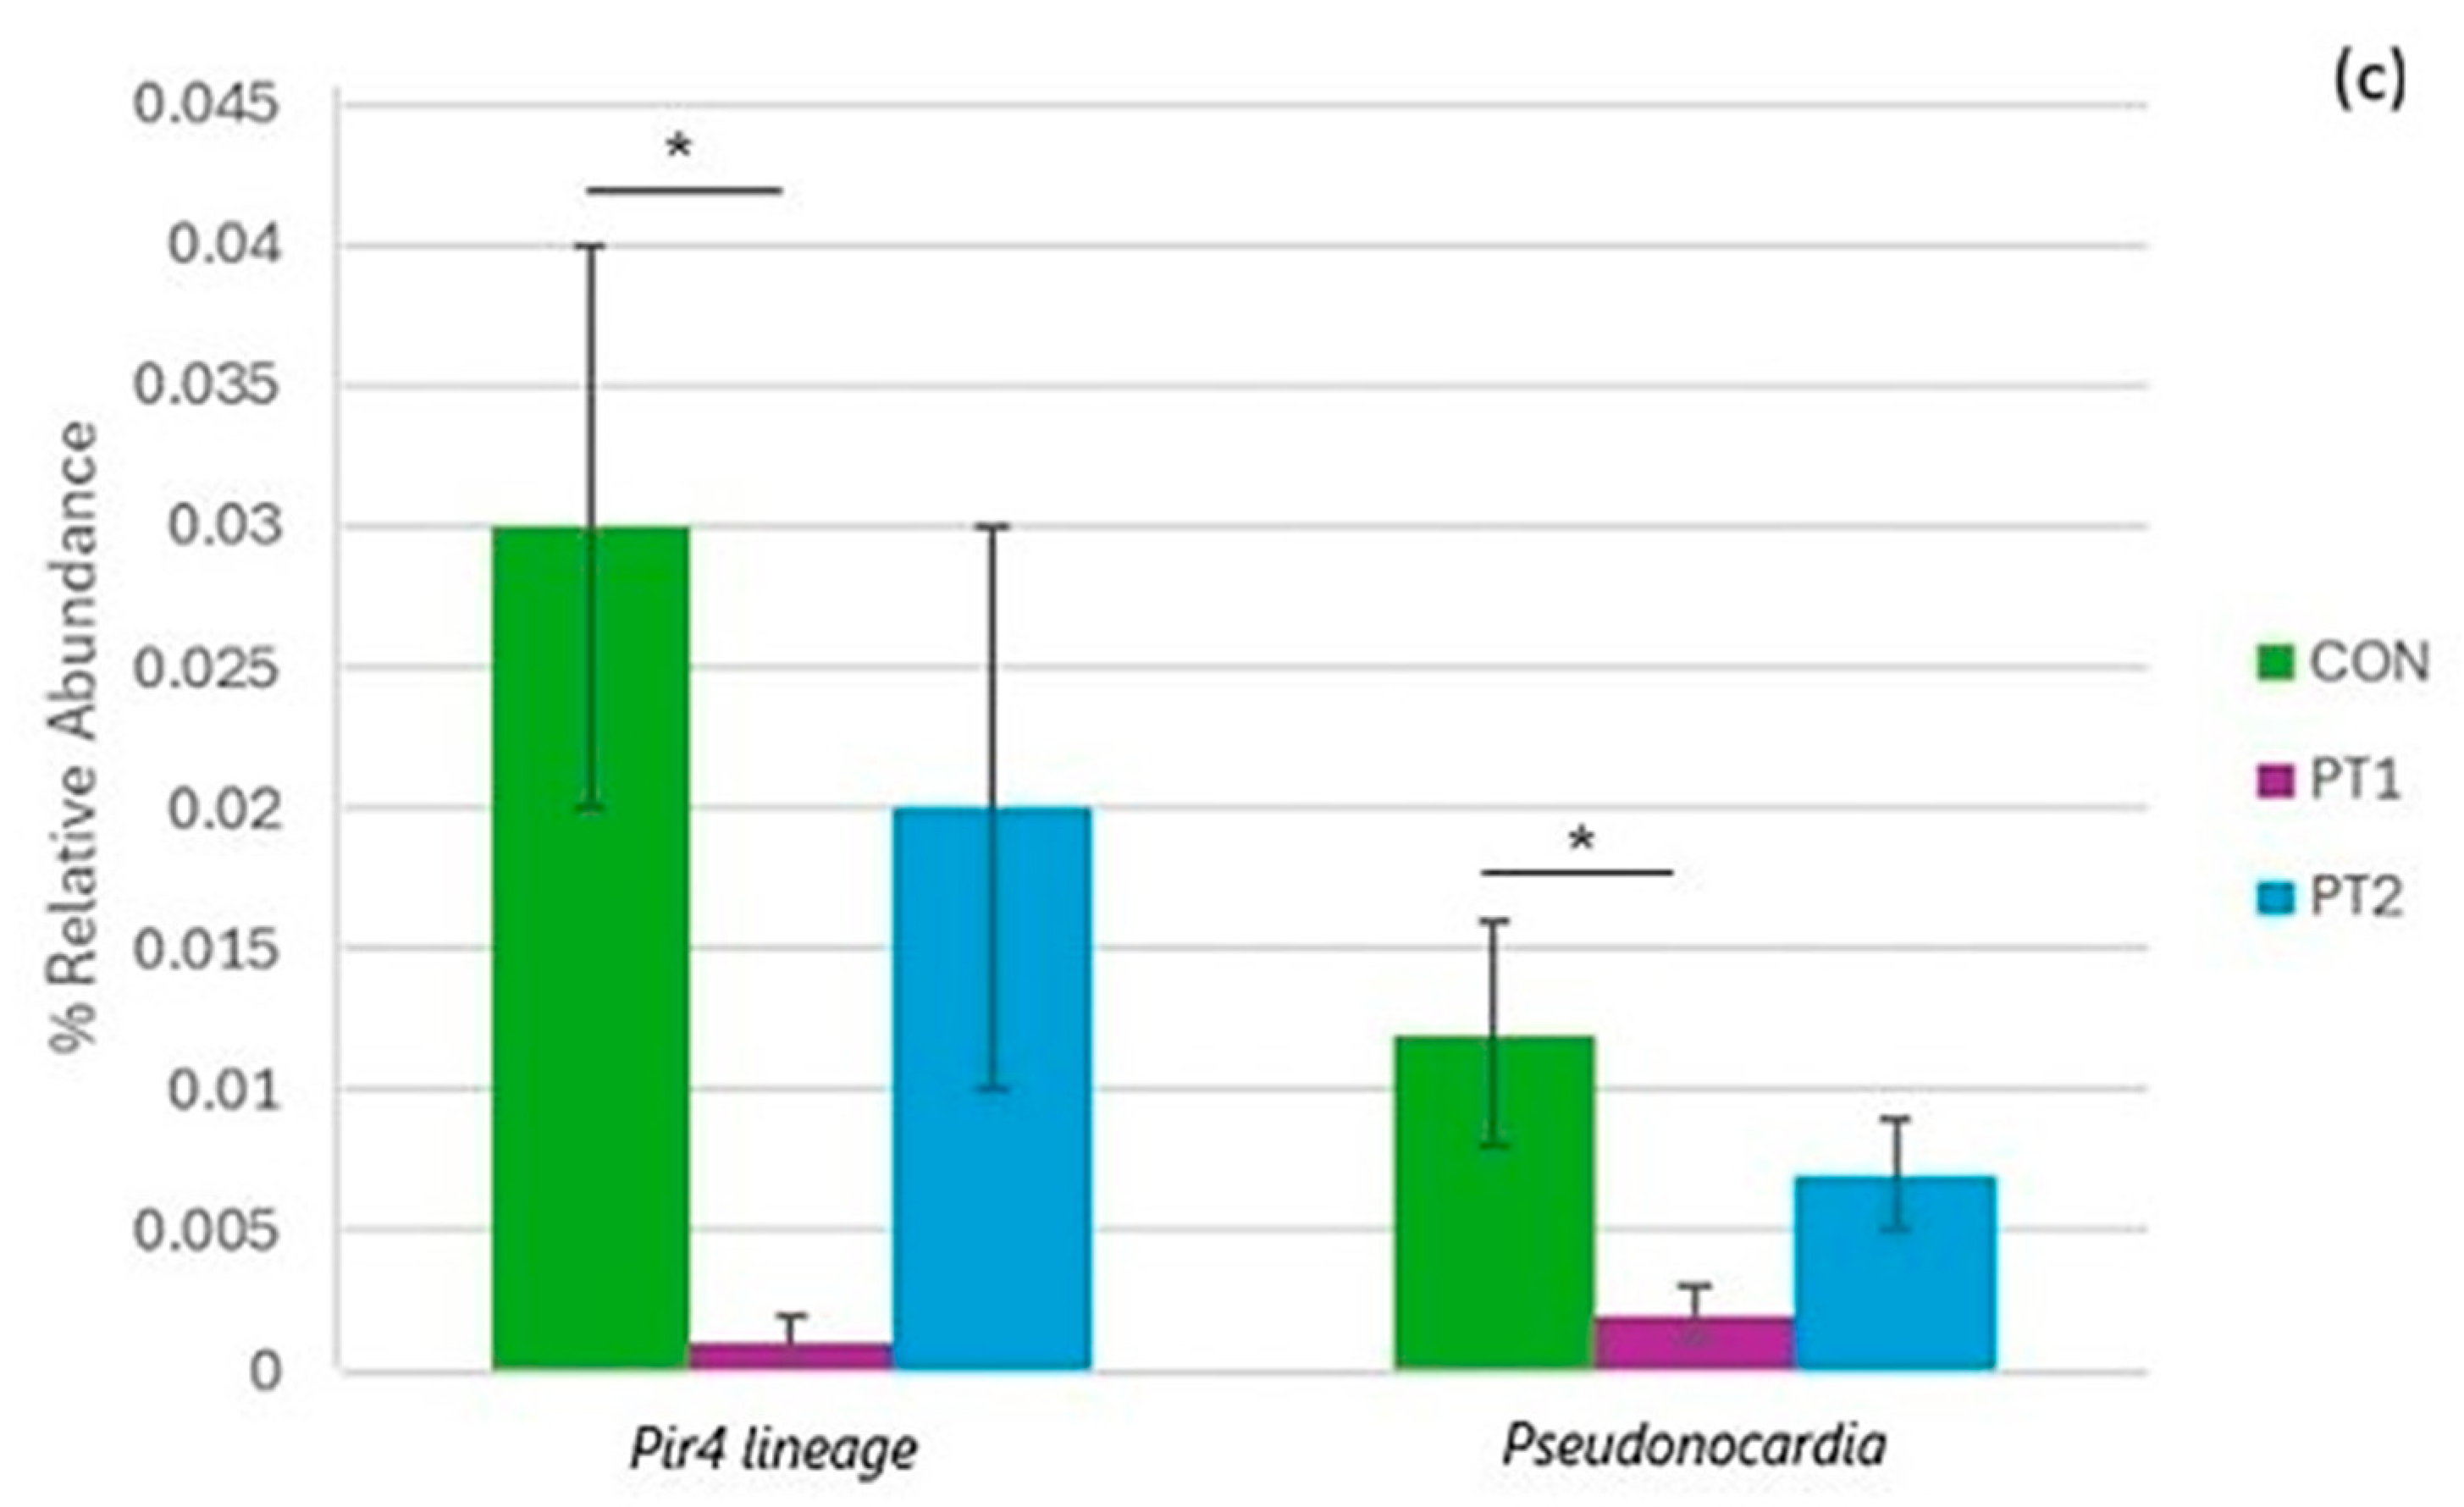
Further analysis of other relevant taxa at the genus level revealed significant variation between groups. Results showed that the relative abundance of Pir4 lineage in the control group was significantly higher compared to the PT1 group (p = 0.022). Moreover, Pseudonocardia relative abundance in the control was significantly higher compared to the PT1 group (p = 0.036) (Figure 11c). There were no significant differences between the treatment groups for the relative abundance of other taxa.

4. Discussion

4.1. In Vitro Screening

Disease susceptibility is often heightened in intensive fish farming systems, and this is further aggravated by environmental stressors [38]. This situation in fish farms is often exacerbated by pathogenic bacteria that commonly occur as opportunistic pathogens in already immunocompromised hosts [39]. This study conducted an in vitro screening for pathogen antagonism with the probiotic candidate isolates from Nile tilapia and mirror carp. The antagonistic activity of the isolates was tested against A. hydrophila, S. iniae, V. anguillarum, V. parahaemolyticus, and Y. ruckeri with the aim of isolating probiotic candidates for application in aquaculture. The results revealed that isolate C61 (closely related to B. subtilisB. tequilensis group) can antagonise four out of the five pathogens tested. Seven more Bacillus sp. isolates (C27, C80, C122, C123, C140, C141, and T70) displayed antagonism against three out of the five pathogens tested. The pathogen-inhibitory intestinal bacterial community of freshwater teleosts was previously reported to be dominated by Bacillus species [40,41]. In previous reports, Bacillus spp. were found to inhibit pathogen colonisation via competitive exclusion and B. subtilis, in particular, can inhibit pathogens in vivo in both its vegetative form and as spores [42]. In line with the results of the present study, autochthonous Bacillus spp. isolated from the intestine of Nile tilapia [43], common carp [44], and other carp species [45,46] have been reported to exhibit antagonism against A. hydrophila and V. parahaemolyticus [47].
The genus Aeromonas contains several species that are pathogenic to freshwater fish and are considered as important pathogens in tilapia culture systems [38,39]. A. hydrophila is one of the most prevalent bacterial pathogens in tilapia culture and is reported to cause high mortalities in both wild and cultured fish [39]. Previous research on the infection route of A. hydrophila identified the gills and skin as the main portals of entry in freshwater fish species [48,49]. There are also studies that propose the fish intestine as an important infection route for A. hydrophila [49,50]. Therefore, dietary probiotics with capacity to antagonise pathogenic bacteria within the intestinal environment would be beneficial to enhance the protective barrier and prevent translocation of pathogenic bacteria across the intestinal barrier. The present study further evaluated the pathogen antagonistic activity of the two best-performing probiotic candidate isolates under SIJ. Isolate C61 retained 96% of its pathogen antagonism against A. hydrophila under SIJ exposure. For T70, the isolate retained 86% of its antagonistic activity under SIJ conditions. These results demonstrate the capacity of the two probiotic candidates to exhibit pathogen antagonistic activity in simulated intestinal conditions.
Apart from pathogen-inhibitory capacity, numerous members of the Bacillus genus in the fish intestinal microbiota were reported to produce digestive enzymes, including xylanase, tannase, and phytase as discussed in the review of Soltani et al. [51]. Comparable results were revealed in the current study evidenced by Bacillus spp. isolates exhibiting extracellular enzyme activity for two and all three enzymes tested. Out of the Bacillus spp. isolates that displayed extracellular enzyme activity for all three enzymes tested, five were closely related to Bacillus subtilis (C24, C123, C146, T67, and T70). In previous works, B. subtilis subsp. spizizenii isolated from the intestine of Indian major carp has demonstrated xylanase production [52], while tannase-producing B. subtilis was also isolated from Nile tilapia intestine [53].
Thermotolerance and broad pH stability are two of the most critical requirements for enzyme supplements in animal feed including phytases [54]. These two factors mainly determine the biochemical characteristics of the enzyme, their stability during feed processing and passage through the GIT of the animal [55]. In the current study, crude enzyme extracts from probiotic candidate isolates C61 and T70, both closely related to B. subtilis, were exposed to simulated gastrointestinal fluids. To the author’s knowledge, this is the first report of phytase-specific activity of B. subtilis strains under simulated gastrointestinal conditions. The phytase-specific activity of the crude enzyme extract from isolate C61 was at 3.21 U mg−1 protein, which was significantly higher than that of isolate T70 (0.37 U mg−1 protein). The specific activity from the crude enzyme of isolate C61 is comparable to the results of other previous studies on B. subtilis strains’ phytase-specific activity [56,57]. Under SIJ exposure, the specific activity of isolate C61 crude enzyme extract was significantly higher than without SIJ exposure. These findings demonstrate the potential of isolate C61 as a phytase-producing probiotic supplement in fish diets. As a strain of B. subtilis with an innate capacity to produce spores and withstand wide ranges of temperature and pH [42], isolate C61 may have the advantage of enhancing phytase activity in the anterior part of the intestine, which is the main site of nutrient absorption in fish.

4.2. In Vivo Trial

In the present study, the growth performance and feed utilisation of Nile tilapia fed with probiotic-supplemented diets were evaluated. After the 40-day feeding trial, there were no significant differences observed on the zootechnical parameters across all groups. This corresponds with a number of previous studies that investigated the effects of host-derived [58] Bacillus probiotic supplementation [59,60,61,62,63] on the growth performance of Nile tilapia. In contrast, dietary supplementation of host-derived Bacillus spp. (B. velezensis, B. subtilis, and B. amyloliquefaciens) at a dose of 1 × 10⁸ CFU/g in single and combined administration (1:1:1) resulted in significantly higher FW and weight gain (WG) and significantly lower FCR than the control diet-fed Nile tilapia after four weeks [8]. Intestinal autochthonous B. megaterium at a dose of 108 CFU/g was supplemented in Nile tilapia diets for eight weeks. The probiotic-fed group exhibited significantly higher FW, WG, SGR, and FCR compared to the control group [5]. In another study using host-derived B. subtilis (1 × 10⁶ and 1 × 10⁸ CFU/g) diet supplementation, FW, WG, SGR, and FCR were significantly enhanced in Nile tilapia with fed probiotic diets compared to the control after 60 days [64]. These varied effects of dietary Bacillus supplementation on Nile tilapia growth performance revealed the multifaceted mechanism of these probiotics. A plethora of factors including the probiotic strain, dose, host species, life stage, system conditions, and experimental duration among others should be carefully considered when designing a growth trial.
In the current study, the total viable counts of presumptive Bacillus spp. in Nile tilapia mid-intestine were examined after the feeding trial via culture-based techniques and there were no significant differences found across groups. This is consistent with the results from 16S rRNA gene metabarcoding analysis of the intestinal microbiota with no significant changes on the relative abundance of Bacillus genus across treatments (i.e., control, 0.58%; PT1, 0.59%; PT2, 0.77%). This is similar to the findings of an earlier study where Nile tilapia diets were supplemented with Bacillus velezensis MT9 (106 CFU/g) for 90 days. The results showed that Bacillus remained at low relative abundance in the intestine, ranging from 0.06 to 0.14% in the control group and 0.01 to 0.31% in the probiotic-fed group [65]. Another study did not observe significant differences in the total intestinal Bacillus CFU counts between the control (6.41 log CFU/g) and the treatment group (5.86 log CFU/g) after a 28-day feeding trial with Bacillus subtilis probiotic supplementation (1.34 × 10⁷ CFU/g) [66]. In relation to the present study, the low level of Bacillus spp. detected in the intestine across experimental groups may reflect that the intestinal microbiome under these conditions appears to have a competitively limiting or possibly even excluding effect. This suggests that even when adding additional populations, the Bacillus population does not appear to be able to expand to form a larger proportion of the community. This may also be evident in some wild Nile tilapia populations where Bacillus, despite being identified as a member of the core microbiota, were detected at relatively low abundance (0.01–0.3%) in the midgut region [67]. In an earlier study [68], Calsporin®, a B. subtilis probiotic (1010 CFU/g) product, was used as feed additive in koi carp; however, B. subtilis was not detected in the intestine of any of the groups using 16S rDNA-V3 PCR-DGGE after 35 days of feeding. Nonetheless, the probiotic-fed group exhibited significant improvement on growth performance (FW, WG, FCR) compared to the control, which warrants further investigation whether intestinal colonisation is a requirement for probiotics to elicit beneficial effects to the host. More importantly, future studies should focus on the impact of probiotic persistence in the gastrointestinal tract, which may be primarily influenced by their metabolic activities and mode of action.
The results of the 16S rRNA gene metabarcoding of the intestinal microbiota revealed that probiotic supplementation did not significantly affect the total number of ASVs or alpha diversity indices, indicating that overall species richness and within-sample diversity remained stable across treatments. Moreover, the relative abundance of dominant phyla and genera did not change significantly, suggesting that core microbial communities were maintained across groups. Previous studies have reported the impacts of dietary probiotics on the alpha and beta diversity of the intestinal microbiota of Nile tilapia [69,70]. On the contrary, a meta-analysis evaluation reported no differentiation patterns in the alpha and beta diversity metrics in tilapia gut microbiota as an effect of dietary probiotics and other feed additives [71]. In the current study, beta diversity analysis (unweighted UniFrac) showed a significant dissimilarity between the PT2 and control groups, suggesting that the presence/absence of certain microbial lineages was altered in response to probiotic inclusion. Consistently, the UPGMA tree based on weighted UniFrac distances indicated that the control and PT1 groups clustered closely together, while PT2 formed a distinct branch, reflecting greater divergence and compositional shifts in both the identity and abundance of taxa. These results are in line with the previous findings [72] on the effects of host-associated Rummeliibacillus sp. and Microbacterium sp. dietary supplementation (1 × 10⁸ CFU/g) in the intestinal microbial community of olive flounder. Beta diversity reported using principal coordinate analysis (PCoA) of unweighted Unifrac metrics revealed notable differences between the intestinal microbiota of probiotic and control groups [72]. Beta diversity metrics estimate the community distance or similarity across samples [72] and were reported to be more sensitive than alpha diversity indices in observing differences in microbial community composition [73].
Metabarcoding analysis of the intestinal microbiota of Nile tilapia after the feeding trial revealed the most abundant phyla across all groups. This includes Actinobacteria, Fusobacteriota, Proteobacteriota, Bacteroidota, Verrumicrobiota and Firmicutes, which were also reported previously as the most common phyla in the intestinal microbiome of cichlids and tilapia [69,74,75]. Actinobacteria were reported to produce metabolites for aquatic pathogen inhibition [76], while Firmicutes abundance revealed negative correlation with pathogenic bacterial population in the intestinal surfaces [77]. An examination of the intestinal microbiota in farmed Nile tilapia revealed Proteobacteria, Fusobacteriota, and Firmicutes to be among the predominantly abundant phyla with predicted KEGG functions on carbohydrate and amino acid metabolism as well as signal transduction [78]. Moreover, phyla Bacteroidota and Verrumicrobiota were previously suggested to facilitate polysaccharide hydrolysis, carbohydrate fermentation, and short chain fatty acid production that can enhance intestinal barrier integrity [79,80].
In the present study, the genus Cetobacterium was reported as the second most relatively abundant genus in the intestinal microbial community of Nile tilapia juvenile fed with experimental diets. Previous studies have revealed that Cetobacterium belongs to the core microbial communities of tilapia intestines and are among the most dominant taxa [81,82,83]. Cetobacterium somerae strains were previously reported to produce Vitamin B12 [84]. In the current study, the relative abundance of genus Plesiomonas was detected at 0.20–0.46% in the intestinal microbiota of Nile tilapia juveniles fed with experimental diets. Members of the Plesiomonas genus are considered as potential pathogens in freshwater fish but were also detected as predominant in the microbiome in tilapia [3,85]. Other potentially pathogenic genera were detected across groups such as Mesorhizobium, Nocardia, Gordonia, and Kaistia. Martínez–Lara et al. [86] first reported the association of Gordonia in granulomatosis in fish. Some species of Mycobacterium, such as Mycobacterium marinum, cause mycobacteriosis and significant mortality in tilapia [87,88]. However, as with other diseases, Mycobacterium pathology depends on the species and susceptibility of the host [89]. Mycobacterium was one of the most abundant genera across all groups (26–42%) in the current study and this is consistent with previous reports [81,82,83]. Giatsis et al. [90] studied the impact of rearing environment (active suspension and recirculating aquaculture systems) on the gut microbiota of tilapia larvae and found Mycobacterium llatzerense present at high relative abundance (12–19%) in all gut samples. In another study on adult O. mossambicus, Mycobacterium was detected at above 25% relative abundance in the intestine of tilapia collected from a natural lake, suggesting its persistence in the gut during later growth stages in specific environments [91]. Importantly, in the current study, Mycobacterium relative abundance did not differ significantly among treatments, indicating that probiotic supplementation did not increase or suppress this group. No clinical signs of mycobacteriosis (e.g., skin lesions, nodules, emaciation) were observed in any fish in the present study.
In less common taxa, the relative abundance of genus Pir4 lineage was revealed to be significantly higher in the control compared to the PT1-fed group. Pir4 lineage is an uncultured member of family Pirellulaceae; hence, its characterisation is largely unknown. Pir4 lineage is closely related to genus Pirellula and thrive in low-oxygen habitats such as in soil [92], as well as in freshwater [93] and marine environments [94]. In Nile tilapia, significantly higher relative abundance of Pirellula was observed in the intestine of fish fed with high plant-based diet [95], as well as in shrimp biofloc supplemented with non-starch polysaccharide (NSP) [96]. Another less common taxa, Pseudonocardia, displayed statistically higher relative abundance in the intestine of the control-fed group compared to PT1. As ubiquitous soil bacteria, some species of Pseudonocardia can establish a symbiotic relationship with fungus-farming leaf-cutter ants [97] and have been an important subject for bioprospecting due to their anti-fungal properties [98]. Given the limited Bacillus recovery levels in the PT1-fed group, the significant reduction in these less common genera may reflect either a direct response to the transient metabolic or antagonistic activity of the Bacillus strains (e.g., production of inhibitory metabolites, nutrient competition, or localised changes in gut conditions) or an indirect, secondary response to shifts in other microbial taxa activities/metabolites or host-mediated effects. This suggests that even minimal, undetectable, or nonviable populations of Bacillus cells or spores within the fish gastrointestinal tract may still exert measurable influences on the host microbiota [65,99].
Probiotics can influence the histology of the intestine by altering tissue morphology, organisation, and cell differentiation in the intestinal lining [100]. Previous works on Bacillus spp. probiotics have documented its modulation of intestinal morphology in Nile tilapia [5,100,101,102]. In the current study, the mucosal fold length of the PT1-fed group was significantly longer than the control and PT2 group. Meanwhile, the intestinal goblet cell counts of the PT1-fed group was significantly higher than the control. These results were in line with previous reports where host-derived Bacillus probiotic (Bacillus velezensis, B. subtilis, and Bacillus amyloliquefaciens; 1 × 10⁸ CFU/mL) supplementation in Nile tilapia diets resulted in significant increase in mucosal fold height and goblet cell counts after four weeks of feeding [74]. In another study, significantly higher mucosal fold length was observed in Nile tilapia fed with autochthonous B. subtilis-supplemented diet (1 × 10⁸ CFU/g) for eight weeks [101]. These findings indicate that PT1 treatment can enhance the absorptive surface area of Nile tilapia intestine by increasing the mucosal fold length and mucus production from goblet cells.
Fish are in constant exposure to its aquatic environment and mucosal surfaces act as the first line of defence against external assault and potentially invading pathogens. The skin and intestinal epithelia represent key components of the mucosa-associated lymphoid tissue (MALT), which forms an integral part of the fish mucosal immune system [99]. In the current research, PT1 group exhibited significantly higher intestinal goblet cell counts and skin goblet cell coverage and density compared to the control group. Goblet cells secrete mucus that act as a protective overlay and a transport medium between the lumen and epithelial cells [103]. Commensal microbiota in the intestinal surfaces rely on mucus and undigested dietary carbohydrates for energy source and binding sites, developing a symbiotic interaction with the host [104]. Probiotics can enhance the production of mucus by stimulating goblet cells, thereby strengthening the mucosal barrier, protecting the gut from pathogens, and supporting overall intestinal health [100]. In line with the results of this study, Bacillus spp. probiotic supplementation in tilapia diets were reported to significantly elevate the number of intestinal goblet cells, implying a higher capacity to produce mucus [64,74,105,106,107,108]. Other previous research on probiotics revealed its influence on intestinal goblet cell counts and density [109,110,111,112]. The intestinal microbiota may influence goblet cell activities and modulate mucus production either by releasing bioactive compounds locally, or by triggering immune cells of the systemic immunity [113]. There is increasing evidence of the intestinal microbiota as regulators of the gut–skin axis with a balanced gut microbiome contributing to skin homeostasis [114], although there are limited published reports on the effects of dietary probiotics on fish skin goblet cell counts. A previous study on Poecilopsis gracilis demonstrated significant increase in skin mucus protein after feeding with a probiotic-enriched diet (Artemia nauplii enriched with Lactobacillus casei, 0.7 × 10⁸ CFU/mL) for 11 weeks compared to the control [115]. Increased protein content is indicative of enhanced mucus production, suggesting the probiotic effect of L. casei on skin mucosal immune defence [116]. In tilapia aquaculture, feed additives capable of stimulating goblet cell proliferation and mucus secretion in the skin could be highly desirable, since they can strengthen the first line of defence against pathogens, like A. hydrophila that utilises the skin as a primary infection route.
The effects of PT1 treatment on the intestinal and skin histology of Nile tilapia after the feeding trial were particularly noteworthy, especially since both culture-based and molecular analyses showed limited recovery of Bacillus in the intestine. It is also worth mentioning that PT1 treatment displayed significant increase in intestinal goblet counts but not coverage compared to the control-fed group, implying that there were higher number of goblet cells with smaller cell size. This may suggest the subtle effects of the probiotic treatment in increasing goblet cell turnover while maintaining mucosal homeostasis. With limited Bacillus recovery in the intestine, it is possible that the probiotic elicited a transient effect during gut transit. Such outcomes are consistent with the recognised transient-action mechanisms of Bacillus probiotics, whereby functional activity can modulate community composition and host physiology without stable colonisation [65,68]. A postbiotic effect may also be a plausible mechanism of action supported by previous studies on inactivated bacterial cellular components and their capacity to stimulate goblet cell dynamics and mucus production at mucosal sites [113,116,117]. These results are consistent with transient or postbiotic activity, as proposed for other Bacillus probiotics; and future studies focused on inactivated/postbiotic components (e.g., peptidoglycan, endospores, etc.) are necessary to better understand their mechanistic effects.
It is also worth noting that PT2 treatment resulted in significantly reduced muscularis thickness of the posterior intestine compared to the control and PT1 groups. Whilst the nominal doses of both probiotics in the diet was log 7 CFU g−1, the actual dose was marginally different, with PT2 containing 0.21 log10 units higher CFU g−1. This minor difference might have contributed to the different outcomes observed for each probiotic to some degree. The muscularis is composed of circular and longitudinal smooth muscle layers that determine intestinal motility [118]. Decrease in muscularis thickness may reduce peristaltic tone and mechanical strain for the intestine, leading to lesser contractile effort [119]. Reduced peristaltic activity may prolong luminal residence time, providing more ecological niches and temporal opportunities for microbial diversification. This may be the potential explanation for the significant dissimilarity in the beta diversity of microbial communities in the mid-intestine of PT2 compared to the control. An interactive host–microbiota adaptation may also explain the feedback effect of microbial restructuring on gut morphology.

5. Conclusions

In summary, the majority of the cultivable autochthonous probiotic candidates isolated from the intestines of Nile tilapia and mirror carp were members of the Bacillus genus and have demonstrated pathogen antagonism and extracellular enzyme activity in vitro. The two best-performing B. subtilis strains were subjected to further in vitro assays and exhibited promising probiotic properties (A. hydrophila antagonism and phytase-specific activity) under simulated gastrointestinal conditions. These findings highlight the potential of the probiotic candidates for enhancing nutrient digestibility and disease resistance. Dietary administration of both candidate probiotics did not result in any adverse effect on growth and intestinal health, which highlights their safe application. Despite the lack of growth benefits, both probiotic candidates influenced the intestinal microbial diversity and elicited subtle shifts in microbial community composition. PT1 treatment demonstrated benefits by significantly increasing mucosal fold length and goblet cell counts in the intestine, as well as the skin goblet cell density and coverage of Nile tilapia. Future research should assess how dietary supplementation with these candidate probiotics influences the immune fate of mucosal tissues, including the gut, gill, and skin, and evaluate functional outcomes such as pathogen resistance and immune cell activity to clarify their immunomodulatory potential. Furthermore, future studies should focus on growth optimisation and disease resistance validation to determine the more suitable probiotic candidate for industrial application.

Supplementary Materials

The following supporting information can be downloaded at https://www.mdpi.com/article/10.3390/ani15223296/s1; Figure S1: In vitro screening protocol in selecting the probiotic candidate isolates from mirror carp and Nile tilapia; Table S1: Selected pathogens and culture conditions; Equation (S1): net weight gain; Equation (S2): specific growth rate; Equation (S3): feed conversion ratio; Equation (S4): protein efficiency ratio; Equation (S5): condition factor; Equation (S6): % survival.

Author Contributions

Conceptualization, S.T.A., M.R. and D.L.M.; methodology, S.T.A., S.M., S.G.O.-O., T.A.M., B.E., M.E., M.R. and D.L.M.; formal analysis, S.T.A.; investigation, S.T.A.; resources, M.R. and D.L.M.; writing—original draft preparation, S.T.A.; writing—review and editing, M.R. and D.L.M.; visualisation, S.T.A.; supervision, D.L.M.; funding acquisition, S.T.A., M.R. and D.L.M. All authors have read and agreed to the published version of the manuscript.

Funding

This research was funded by the Department of Science and Technology-Science Education Institute (DOST-SEI) of the Republic of the Philippines under the Foreign Graduate Scholarship.

Institutional Review Board Statement

All experimental procedures involving fish were carried out in accordance with the ethical guidelines approved by the Animal Welfare and Ethical Review Body (AWERB) of the University of Plymouth (Ethical Reference Number: ETHICS-45-2020-v2; 09/05/22).

Informed Consent Statement

Not applicable.

Data Availability Statement

The 16S rRNA gene sequencing data generated in this study have been deposited and are openly available in the NCBI Sequence Read Archive (SRA) under the accession number PRJNA1336401 and are accessible via the following link: https://www.ncbi.nlm.nih.gov/sra/PRJNA1336401 (accessed on 9 October 2025). All other data are available upon request from corresponding authors.

Acknowledgments

The authors would like to acknowledge Nicola Pontefract, Victor Kuri, Sarah Jamieson, Andrew Atfield, Nicholas Crocker, Victoria Cammack, Natalie Sweet, Will Vevers, Joceline Triner, and Glenn Harper for their academic and technical assistance.

Conflicts of Interest

The authors declare no conflicts of interest. The funders had no role in the design of the study; in the collection, analyses, or interpretation of data; in the writing of the manuscript; or in the decision to publish the results.

References

  1. Francis, G.; Makkar, H.P.S.; Becker, K. Antinutritional factors present in plant-derived alternate fish feed ingredients and their effects in fish. Aquaculture 2001, 199, 197–227. [Google Scholar] [CrossRef]
  2. Tacon, A.G.J.; Metian, M. Feed matters: Satisfying the feed demand of aquaculture. Rev. Fish. Sci. Aquac. 2015, 23, 1–10. [Google Scholar] [CrossRef]
  3. Wu, P.-S.; Liu, C.-H.; Hu, S.-Y. Probiotic Bacillus safensis NPUST1 Administration Improves Growth Performance, Gut Microbiota, and Innate Immunity against Streptococcus iniae in Nile tilapia (Oreochromis niloticus). Microorganisms 2021, 9, 2494. [Google Scholar] [CrossRef] [PubMed]
  4. Herath, S.S.; Satoh, S. Environmental impact of phosphorus and nitrogen from aquaculture. In Feed and Feeding Practices in Aquaculture; Davis, D.A., Ed.; Elsevier: Cambridge, UK, 2015; Volume 287, pp. 369–386. [Google Scholar]
  5. Huang, X.; He, H.; Li, Z.; Liu, C.; Jiang, B.; Huang, Y.; Su, Y.; Li, W. Screening and effects of intestinal probiotics on growth performance, gut health, immunity, and disease resistance of Nile tilapia (Oreochromis niloticus) against Streptococcus agalactiae. Fish Shellfish Immunol. 2024, 151, 109668. [Google Scholar] [CrossRef]
  6. Merrifield, D.; Ringø, E. Aquaculture Nutrition: Gut Health, Probiotics and Prebiotics; John Wiley & Sons, Ltd.: West Sussex, UK, 2014. [Google Scholar]
  7. Lazado, C.C.; Caipang, C.M.A.; Estante, E.G. Prospects of host-associated microorganisms in fish and penaeids as probiotics with immunomodulatory functions. Fish Shellfish Immunol. 2015, 45, 2–12. [Google Scholar] [CrossRef]
  8. Kuebutornye, F.K.A.; Tang, J.; Cai, J.; Yu, H.; Wang, Z.; Abarike, E.D.; Lu, Y.; Li, Y.; Afriyie, G. In vivo assessment of the probiotic potentials of three host-associated Bacillus species on growth performance, health status and disease resistance of Oreochromis niloticus against Streptococcus agalactiae. Aquaculture 2020, 527, 735440. [Google Scholar] [CrossRef]
  9. Singh, B.; Kunze, G.; Satyanarayana, T. Developments in biochemical aspects and biotechnological applications of microbial phytases. Biotechnol. Mol. Biol. Rev. 2011, 6, 69–87. [Google Scholar]
  10. Noureddini, H.; Dang, J. Degradation of Phytates in Distillers’ Grains and Corn Gluten Feed by Aspergillus niger Phytase. Appl. Biochem. Biotechnol. 2008, 159, 11–23. [Google Scholar] [CrossRef]
  11. Khan, A.; Ghosh, K. Characterization and identification of gut-associated phytase-producing bacteria in some freshwater fish cultured in ponds. Acta Ichthyol. Et Piscat. 2012, 42, 37–45. [Google Scholar] [CrossRef]
  12. Roy, T.; Mondal, S.; Ray, A.K. Phytase-producing bacteria in the digestive tracts of some freshwater fish. Aquac. Res. 2009, 40, 344–353. [Google Scholar] [CrossRef]
  13. Dan, S.K.; Nandi, A.; Banerjee, G.; Ghosh, P.; Ray, A.K. Purification and Characterization of Extracellular Phytase from Bacillus licheniformis Isolated from Fish Gut. Proc. Natl. Acad. Sci. India Sec. B Biol. Sci. 2015, 85, 751–758. [Google Scholar] [CrossRef]
  14. Merrifield, D.L.; Dimitroglou, A.; Bradley, G.; Baker, R.T.M.; Davies, S.J. Soybean meal alters autochthonous microbial populations, microvilli morphology and compromises intestinal enterocyte integrity of rainbow trout, Oncorhynchus mykiss (Walbaum). J. Fish Dis. 2009, 32, 755–766. [Google Scholar] [CrossRef]
  15. do Vale Pereira, G.; da Cunha, D.G.; Pedreira Mourino, J.L.; Rodiles, A.; Jaramillo-Torres, A.; Merrifield, D.L. Characterization of microbiota in Arapaima gigas intestine and isolation of potential probiotic bacteria. J. Appl. Microbiol. 2017, 123, 1298–1311. [Google Scholar] [CrossRef]
  16. Yanke, L.J.; Bae, H.D.; Selinger, L.B.; Cheng, K.J. Phytase activity of anaerobic ruminal bacteria. Microbiology 1998, 144, 1565–1573. [Google Scholar] [CrossRef]
  17. Banerjee, S.; Mukherjee, A.; Dutta, D. Non—Starch Polysaccharide Degrading Gut Bacteria in Indian Major Carps and Exotic Carps. Jordan J. Biol. Sci. 2016, 9, 69–78. [Google Scholar] [CrossRef]
  18. Dutta, D.; Ghosh, K. Screening of extracellular enzyme-producing and pathogen inhibitory gut bacteria as putative probiotics in mrigal, Cirrhinus mrigala (Hamilton, 1822). Int. J. Fish. Aquat. Stud. 2015, 2, 310–318. [Google Scholar]
  19. Ninawe, S.; Lal, R.; Kuhad, R.C. Isolation of Three Xylanase-Producing Strains of Actinomycetes and Their Identification Using Molecular Methods. Curr. Microbiol. 2006, 53, 178–182. [Google Scholar] [CrossRef] [PubMed]
  20. Kumar, M.; Rana, S.; Beniwal, V.; Salar, R.K. Optimization of tannase production by a novel Klebsiella pneumoniae KP715242 using central composite design. Biotechnol. Rep. 2015, 7, 128–134. [Google Scholar] [CrossRef] [PubMed]
  21. Kos, B.; Šušković, J.; Goreta, J.; Matošić, S. Effect of protectors on the viability of Lactobacillus acidophilus M92 in simulated gastrointestinal conditions. Food Technol. Biotechnol. 2000, 38, 121–127. [Google Scholar]
  22. Clinical and Laboratory Standards Institute. Performance Standards for Antimicrobial Disk Susceptibility Tests, 10th ed.; Approved Standard, (CLSI document M02-A10); Clinical and Laboratory Standards Institute: Wayne, PA, USA, 2009. [Google Scholar]
  23. European Committee on Antimicrobial Susceptibility Testing. EUCAST Disk Diffusion Test Manual (Version 13.0, January 2025). Available online: https://www.eucast.org (accessed on 6 September 2025).
  24. Trivedi, S.; Husain, I.; Sharma, A. Purification and characterization of phytase from Bacillus subtilis P6: Evaluation for probiotic potential for possible application in animal feed. Food Front. 2021, 3, 194–205. [Google Scholar] [CrossRef]
  25. González-Córdova, A.F.; Beltrán-Barrientos, L.M.; Santiago-López, L.; Garcia, H.S.; Vallejo-Cordoba, B.; Hernandez-Mendoza, A. Phytate-degrading activity of probiotic bacteria exposed to simulated gastrointestinal fluids. LWT 2016, 73, 67–73. [Google Scholar] [CrossRef]
  26. Palacios, M.C.; Haros, M.; Rosell, C.M.; Sanz, Y. Characterization of an acid phosphatase from Lactobacillus pentosus: Regulation and biochemical properties. J. Appl. Microbiol. 2005, 98, 229–237. [Google Scholar] [CrossRef]
  27. Heinonen, J.K.; Lahti, R.J. A new and convenient colorimetric determination of inorganic orthophosphate and its application to the assay of inorganic pyrophosphatase. Anal. Biochem. 1981, 113, 313–317. [Google Scholar] [CrossRef]
  28. Bradford, M.M. A rapid and sensitive method for the quantitation of microgram quantities of protein utilizing the principle of protein-dye binding. Anal. Biochem. 1976, 72, 248–254. [Google Scholar] [CrossRef] [PubMed]
  29. Merrifield, D.L.; Burnard, D.; Bradley, G.; Davies, S.J.; Baker, R.T.M. Microbial community diversity associated with the intestinal mucosa of farmed rainbow trout (Oncoryhnchus mykiss Walbaum). Aquac. Res. 2009, 40, 1064–1072. [Google Scholar] [CrossRef]
  30. National Research Council (NRC). Nutrient Requirements of Fish; National Academy Press: Washington, DC, USA, 2011.
  31. Nutrition Specification Database (ASNS), Version 10.0. International Aquafeed Formulation Database. Available online: https://app.iaffd.com/asns (accessed on 22 April 2025).
  32. AOAC. Official Methods of Analysis of AOAC International, 16th ed.; Association of Official Analytical Chemists: Washington, DC, USA, 1995. [Google Scholar]
  33. Home Office. Guidance on the Operation of the Animals (Scientific Procedures) Act 1986. 2014. Available online: https://www.gov.uk/government/publications/operation-of-aspa (accessed on 6 September 2025).
  34. Konnert, G.D.P.; Gerrits, W.J.J.; Gussekloo, S.W.S.; Schrama, J.W. Balancing protein and energy in Nile tilapia feeds: A meta-analysis. Rev. Aquac. 2022, 14, 1757–1778. [Google Scholar] [CrossRef]
  35. Rawling, M.; Leclercq, E.; Foey, A.; Castex, M.; Merrifield, D. A novel dietary multi-strain yeast fraction modulates intestinal toll-like-receptor signalling and mucosal responses of rainbow trout (Oncorhynchus mykiss). PLoS ONE 2021, 16, e0245021. [Google Scholar] [CrossRef]
  36. Dimitroglou, A.; Merrifield, D.L.; Spring, P.; Sweetman, J.; Moate, R.; Davies, S.J. Effects of mannan oligosaccharide (MOS) supplementation on growth performance, feed utilisation, intestinal histology and gut microbiota of gilthead sea bream (Sparus aurata). Aquaculture 2010, 300, 182–188. [Google Scholar] [CrossRef]
  37. Atlas, R.M. Handbook of Microbiological Media, 2nd ed.; Parks, L.C., Ed.; CRC Press: Boca Raton, FL, USA, 1997. [Google Scholar]
  38. Zaheen, Z.; Farooq War, A.; Ali, S.; Yatoo, A.M.; Ali Md, N.; Bilal Ahmad, S.; Rehman, M.; Paray, B.A. Common bacterial infections affecting freshwater fish fauna and impact of pollution and water quality characteristics on bacterial. In Bacterial Fish Diseases; Hamid Dar, G., Ahmad Bhat, R., Qadri, H., Al-Ghamdy, K., Hakeem, K.R., Eds.; Academic Press: London, UK, 2022; pp. 113–145. [Google Scholar]
  39. Haenen, O.L.M.; Dong, H.T.; Hoai, T.D.; Crumlish, M.; Karunasagar, I.; Barkham, T.; Chen, S.L.; Zadoks, R.; Kiermeier, A.; Wang, B.; et al. Bacterial diseases of tilapia, their zoonotic potential and risk of antimicrobial resistance. Rev. Aquac. 2022, 15 (Suppl. S1), 154–185. [Google Scholar] [CrossRef]
  40. Ghosh, K.; Roy, M.; Kar, N.; Ringo, E. Gastrointestinal Bacteria in Rohu, Labeo Rohita (Actinopterygii: Cypriniformes: Cyprinidae): Scanning Electron Microscopy and Bacteriological Study. Acta Ichthyol. Et Piscat. 2010, 40, 129–135. [Google Scholar] [CrossRef]
  41. Ghosh, K.; Mukherjee, A.; Dutta, D.; Banerjee, S.; Breines, E.M.; Hareide, E.; Ringø, E. Endosymbiotic pathogen-inhibitory gut bacteria in three Indian Major Carps under polyculture system: A step toward making a probiotics consortium. Aquac. Fish. 2021, 6, 192–204. [Google Scholar] [CrossRef]
  42. Nayak, S.K. Multifaceted applications of probiotic Bacillus species in aquaculture with special reference to Bacillus subtilis. Rev. Aquac. 2021, 13, 862–906. [Google Scholar] [CrossRef]
  43. Del’Duca, A.; Evangelista Cesar, D.; Galuppo Diniz, C.; Abreu, P.C. Evaluation of the presence and efficiency of potential probiotic bacteria in the gut of tilapia (Oreochromis niloticus) using the fluorescent in situ hybridization technique. Aquaculture 2013, 388–391, 115–121. [Google Scholar] [CrossRef]
  44. Kang, M.; Su, X.; Yun, L.; Shen, Y.; Feng, J.; Yang, G.; Meng, X.; Zhang, J.; Chang, X. Evaluation of probiotic characteristics and whole genome analysis of Bacillus velezensis R-71003 isolated from the intestine of common carp (Cyprinus carpio L.) for its use as a probiotic in aquaculture. Aquac. Rep. 2022, 25, 101254. [Google Scholar] [CrossRef]
  45. Mukherjee, A.; Dutta, D.; Banerjee, S.; Ringø, E.; Breines, E.M.; Hareide, E.; Chandra, G.; Ghosh, K. Potential probiotics from Indian major carp, Cirrhinus mrigala. Characterization, pathogen inhibitory activity, partial characterization of bacteriocin and production of exoenzymes. Res. Veter Sci. 2016, 108, 76–84. [Google Scholar] [CrossRef] [PubMed]
  46. Kavitha, M.; Raja, M.; Perumal, P. Evaluation of probiotic potential of Bacillus spp. isolated from the digestive tract of freshwater fish Labeo calbasu (Hamilton, 1822). Aquac. Rep. 2018, 11, 59–69. [Google Scholar] [CrossRef]
  47. Khan, I.R.; Kamilya, D.; Choudhury, T.G.; Tripathy, P.S.; Rathore, G. Deciphering the Probiotic Potential of Bacillus amyloliquefaciens COFCAU_P1 Isolated from the Intestine of Labeo rohita Through In Vitro and Genetic Assessment. Probiotics Antimicrob. Proteins 2021, 13, 1572–1584. [Google Scholar] [CrossRef] [PubMed]
  48. Chu, W.-H.; Lu, C.-P. In vivo fish models for visualizing Aeromonas hydrophila invasion pathway using GFP as a biomarker. Aquaculture 2008, 277, 152–155. [Google Scholar] [CrossRef]
  49. Pridgeon, J.W.; Klesius, P.H. Virulence of Aeromonas hydrophila to channel catfish Ictaluras punctatus fingerlings in the presence and absence of bacterial extracellular products. Dis. Aquat. Org. 2011, 95, 209–215. [Google Scholar] [CrossRef]
  50. Zhang, X.-J.; Yang, W.; Zhang, D.; Li, T.; Gong, X.; Li, A. Does the gastrointestinal tract serve as the infectious route of Aeromonas hydrophila in crucian carp (Carassius carassius)? Aquac. Res. 2013, 46, 141–154. [Google Scholar] [CrossRef]
  51. Soltani, M.; Ghosh, K.; Hoseinifar, S.H.; Kumar, V.; Lymbery, A.J.; Roy, S.; Ringø, E. Genus Bacillus, promising probiotics in aquaculture: Aquatic animal origin, bio-active components, bioremediation and efficacy in fish and shellfish. Rev. Fish. Sci. Aquac. 2019, 27, 331–379. [Google Scholar] [CrossRef]
  52. Mukherjee, A.; Ghosh, K. Antagonism against fish pathogens by cellular components and verification of probiotic properties in autochthonous bacteria isolated from the gut of an Indian major carp, Catla catla (Hamilton). Aquac. Res. 2014, 47, 2243–2255. [Google Scholar] [CrossRef]
  53. Talukdar, S.; Ringø, E.; Ghosh, K. Extracellular tannase-producing bacteria detected in the digestive tracts of freshwater fishes (Actinopterygii: Cyprinidae and Cichlidae). Acta Ichthyol. Piscat. 2016, 46, 201–210. [Google Scholar] [CrossRef]
  54. Konietzny, U.; Greiner, R. Bacterial phytase: Potential application, in vivo function and regulation of its synthesis. Braz. J. Microbiol. 2004, 35, 12–18. [Google Scholar] [CrossRef]
  55. Simon, O.; Igbasan, F. In vitro properties of phytases from various microbial origins. Int. J. Food Sci. Technol. 2002, 37, 813–822. [Google Scholar] [CrossRef]
  56. Farhat, A.; Chouayekh, H.; Ben Farhat, M.; Bouchaala, K.; Bejar, S. Gene Cloning and Characterization of a Thermostable Phytase from Bacillus subtilis US417 and Assessment of its Potential as a Feed Additive in Comparison with a Commercial Enzyme. Mol. Biotechnol. 2008, 40, 127–135. [Google Scholar] [CrossRef]
  57. Hong, S.W.; Chu, I.S.; Chung, K.S. Purification and Biochemical Characterization of Thermostable Phytase from Newly Isolated Bacillus subtilis CF92. J. Korean Soc. Appl. Biol. Chem. 2011, 54, 89–94. [Google Scholar] [CrossRef]
  58. Sookchaiyaporn, N.; Srisapoome, P.; Unajak, S.; Areechon, N. Efficacy of Bacillus Spp. Isolated from Nile Tilapia Oreochromis niloticus Linn. On Its Growth and Immunity, and Control of Pathogenic Bacteria. Fish. Sci. 2020, 86, 353–365. [Google Scholar] [CrossRef]
  59. Addo, S.; Carrias, A.A.; Williams, M.A.; Liles, M.R.; Terhune, J.S.; Davis, D.R. Effects of Bacillus subtilis Strains on Growth, Immune Parameters, and Streptococcus iniae Susceptibility in Nile Tilapia, Oreochromis niloticus. J. World Aquac. Soc. 2017, 48, 257–267. [Google Scholar] [CrossRef]
  60. Adeoye, A.A.; Yomla, R.; Jaramillo-Torres, A.; Rodiles, A.; Merrifield, D.L.; Davies, S.J. Combined Effects of Exogenous Enzymes and Probiotic on Nile Tilapia (Oreochromis niloticus) Growth, Intestinal Morphology and Microbiome. Aquaculture 2016, 463, 61–70. [Google Scholar] [CrossRef]
  61. Waiyamitra, P.; Zoral, M.A.; Saengtienchai, A.; Luengnaruemitchai, A.; Decamp, O.; Gorgoglione, B.; Surachetpong, W. Probiotics Modulate Tilapia Resistance and Immune Response against Tilapia Lake Virus Infection. Pathogens 2020, 9, 919. [Google Scholar] [CrossRef]
  62. Xia, Y.; Wang, M.; Gao, F.; Lu, M.; Chen, G. Effects of Dietary Probiotic Supplementation on the Growth, Gut Health and Disease Resistance of Juvenile Nile Tilapia (Oreochromis niloticus). Anim. Nutr. 2020, 6, 69–79. [Google Scholar] [CrossRef]
  63. Panase, A.; Thirabunyanon, M.; Promya, J.; Chitmanat, C. Influences of Bacillus subtilis and Fructooligosaccharide on Growth Performances, Immune Responses, and Disease Resistance of Nile Tilapia, Oreochromis niloticus. Front. Vet. Sci. 2023, 9, 1094681. [Google Scholar] [CrossRef]
  64. Büyükdeveci, E.M.; Cengizler, İ.; Balcázar, J.L.; Demirkale, İ. Effects of Two Host-Associated Probiotics Bacillus mojavensis B191 and Bacillus subtilis MRS11 on Growth Performance, Intestinal Morphology, Expression of Immune-Related Genes and Disease Resistance of Nile Tilapia (Oreochromis niloticus) against Streptococcus iniae. Dev. Comp. Immunol. 2023, 138, 104553. [Google Scholar] [CrossRef]
  65. Calcagnile, M.; Quarta, E.; Sicuro, A.; Pecoraro, L.; Schiavone, R.; Tredici, S.M.; Talà, A.; Corallo, A.; Verri, T.; Stabili, L.; et al. Effect of Bacillus velezensis MT9 on Nile Tilapia (Oreochromis niloticus) Intestinal Microbiota. Microb. Ecol. 2025, 88, 37. [Google Scholar] [CrossRef] [PubMed]
  66. Guimarães, M.C.; Dias, D.d.C.; Araujo, F.v.A.P.; Ishikawa, C.M.; Tachibana, L. Probiotic Bacillus subtilis and Lactobacillus plantarum in Diet of Nile Tilapia. Bol. Do Inst. De Pesca 2019, 45, 252. [Google Scholar] [CrossRef]
  67. Bereded, N.K.; Curto, M.; Domig, K.J.; Abebe, G.B.; Fanta, S.W.; Waidbacher, H.; Meimberg, H. Metabarcoding Analyses of Gut Microbiota of Nile Tilapia (Oreochromis niloticus) from Lake Awassa and Lake Chamo, Ethiopia. Microorganisms 2020, 8, 1040. [Google Scholar] [CrossRef] [PubMed]
  68. He, S.; Liu, W.; Zhou, Z.; Mao, W. Evaluation of Probiotic Strain Bacillus Subtilis C-3102 as a Feed Supplement for Koi Carp (Cyprinus carpio). J. Aquac. Res. Dev. 2011, S1, 005. [Google Scholar] [CrossRef]
  69. Standen, B.T.; Rodiles, A.; Peggs, D.L.; Davies, S.J.; Santos, G.A.; Merrifield, D.L. Modulation of the Intestinal Microbiota and Morphology of Tilapia, Oreochromis niloticus, Following the Application of a Multi-Species Probiotic. Appl. Microbiol. Biotechnol. 2015, 99, 8403–8417. [Google Scholar] [CrossRef]
  70. Li, H.; Zhou, Y.; Ling, H.; Luo, L.; Qi, D.; Feng, L. The Effect of Dietary Supplementation with Clostridium butyricum on the Growth Performance, Immunity, Intestinal Microbiota and Disease Resistance of Tilapia (Oreochromis niloticus). PLoS ONE 2019, 14, e0223428. [Google Scholar] [CrossRef]
  71. Martinez-Porchas, M.; Preciado-Álvarez, A.; Vargas-Albores, F.; Gracia-Valenzuela, M.H.; Cicala, F.; Martinez-Cordova, L.R.; Medina-Félix, D.; Garibay-Valdez, E. Microbiota Plasticity in Tilapia Gut Revealed by Meta-Analysis Evaluating the Effect of Probiotics, Prebiotics, and Biofloc. PeerJ 2023, 11, e16213. [Google Scholar] [CrossRef]
  72. Lee, S.-J.; Kim, S.H.; Noh, D.-I.; Lee, Y.-S.; Kim, T.-R.; Hasan, T.; Lee, E.-W.; Jang, W.J. Combination of Host-Associated Rummeliibacillus sp. And Microbacterium sp. Positively Modulated the Growth, Feed Utilization, and Intestinal Microbial Population of Olive Flounder (Paralichthys olivaceus). Biology 2023, 12, 1443. [Google Scholar] [CrossRef]
  73. Kers, J.G.; Saccenti, E. The Power of Microbiome Studies: Some Considerations on Which Alpha and Beta Metrics to Use and How to Report Results. Front. Microbiol. 2022, 12, 796025. [Google Scholar] [CrossRef]
  74. Kuebutornye, F.K.A.; Wang, Z.; Lu, Y.; Abarike, E.D.; Sakyi, M.E.; Li, Y.; Xie, C.X.; Hlordzi, V. Effects of Three Host-Associated Bacillus Species on Mucosal Immunity and Gut Health of Nile Tilapia, Oreochromis niloticus and Its Resistance against Aeromonas Hydrophila Infection. Fish Shellfish Immunol. 2020, 97, 83–95. [Google Scholar] [CrossRef]
  75. Guan, M.; Guan, J.; Zhang, H.; Peng, D.; Wen, X.; Zhang, X.; Pan, Q. Effect of Moringa oleifera, Bacillus amyloliquefaciens, and Their Combination on Growth Performance, Digestive Enzymes, Immunity, and Microbiota in Nile Tilapia (Oreochromis niloticus). Aquac. Nutr. 2024, 2024, 1755727. [Google Scholar] [CrossRef] [PubMed]
  76. Das, S.; Ward, L.R.; Burke, C. Prospects of Using Marine Actinobacteria as Probiotics in Aquaculture. Appl. Microbiol. Biotechnol. 2008, 81, 419–429. [Google Scholar] [CrossRef] [PubMed]
  77. Mulder, I.; Schmidt, B.E.; Stokes, C.R.; Lewis, M.; Bailey, M.; Aminov, R.; Prosser, J.I.; Gill, B.P.; Pluske, J.R.; Mayer, C.-D.; et al. Environmentally-Acquired Bacteria Influence Microbial Diversity and Natural Innate Immune Responses at Gut Surfaces. BMC Biol. 2009, 7, 79. [Google Scholar] [CrossRef] [PubMed]
  78. Wu, Z.; Zhang, Q.; Lin, Y.; Hao, J.; Wang, S.; Zhang, J.; Li, A. Taxonomic and Functional Characteristics of the Gill and Gastrointestinal Microbiota and Its Correlation with Intestinal Metabolites in NEW GIFT Strain of Farmed Adult Nile Tilapia (Oreochromis niloticus). Microorganisms 2021, 9, 617. [Google Scholar] [CrossRef]
  79. Cardman, Z.; Arnosti, C.; Durbin, A.; Ziervogel, K.; Cox, C.; Steen, A.D.; Teske, A. Verrucomicrobia Are Candidates for Polysaccharide-Degrading Bacterioplankton in an Arctic Fjord of Svalbard. Appl. Environ. Microbiol. 2014, 80, 3749–3756. [Google Scholar] [CrossRef]
  80. Monk, J.M.; Lepp, D.; Wu, W.; Graf, D.; McGillis, L.H.; Hussain, A.; Carey, C.; Robinson, L.E.; Liu, R.; Tsao, R.; et al. Chickpea-Supplemented Diet Alters the Gut Microbiome and Enhances Gut Barrier Integrity in C57Bl/6 Male Mice. J. Funct. Foods 2017, 38, 663–674. [Google Scholar] [CrossRef]
  81. Li, L.; Song, J.; Peng, C.; Yang, Z.; Wang, L.; Lin, J.; Li, L.; Huang, Z.; Gong, B. Co-Occurrence Network of Microbes Linking Growth and Immunity Parameters with the Gut Microbiota in Nile Tilapia (Oreochromis niloticus) after Feeding with Fermented Soybean Meal. Aquac. Rep. 2022, 26, 101280. [Google Scholar] [CrossRef]
  82. Chen, J.; Li, Q.; Tan, C.; Xie, L.; Yang, X.; Zhang, Q.; Deng, X. Effects of Enrofloxacin’s Exposure on the Gut Microbiota of Tilapia Fish (Oreochromis niloticus). Comp. Biochem. Physiol. Part D Genom. Proteom. 2023, 46, 101077. [Google Scholar] [CrossRef]
  83. Huavas, J.; Heyse, J.; Props, R.; Delamare-Deboutteville, J.; Shelley, C. Microbiomes of Tilapia Culture Systems: Composition, Affecting Factors, and Future Perspectives. Aquac. Res. 2024, 2024, 5511461. [Google Scholar] [CrossRef]
  84. Tsuchiya, C.; Sakata, T.; Sugita, H. Novel Ecological Niche of Cetobacterium somerae, an Anaerobic Bacterium in the Intestinal Tracts of Freshwater Fish. Lett. Appl. Microbiol. 2008, 46, 43–48. [Google Scholar] [CrossRef]
  85. Yu, L.; Qiao, N.; Li, T.; Yu, R.; Zhai, Q.; Tian, F.; Zhang, H.; Chen, W. Dietary Supplementation with Probiotics Regulates Gut Microbiota Structure and Function in Nile Tilapia Exposed to Aluminum. PeerJ 2019, 7, e6963. [Google Scholar] [CrossRef] [PubMed]
  86. Martínez-Lara, P.; Hernández-López, J.; Garibay-Valdez, E.; Medina-Félix, D.; Martínez-Porchas, M.; Coronado-Molina, D.; Ortiz-Luna, R.J.; Puerto, J.H.; Gracia-Valenzuela, M.H. Microbiota Attached to and Encapsulated by Granulomas Dissected from Tilapia Spleen: A Case Report. Aquac. Fish Fish. 2022, 3, 96–101. [Google Scholar] [CrossRef]
  87. Sonda-Santos, K.; Lara-Flores, M. Detection of Mycobacterium Spp. By Polymerase Chain Reaction in Nile Tilapia (Oreochromis niloticus) in Campeche, Mexico. Afr. J. Microbiol. Res. 2012, 6, 2785–2787. [Google Scholar] [CrossRef]
  88. Lara-Flores, M.; Aguirre-Guzman, G.; Balan-Zetina, S.B.; Sonda-Santos, K.Y.; Zapata, A.A. Identification of Mycobacterium Agent Isolated from Tissues of Nile tilapia (Oreochromis niloticus). Turk. J. Fish. Aquat. Sci. 2014, 14, 575–580. [Google Scholar] [CrossRef] [PubMed]
  89. Deng, Y.; Verdegem, M.C.J.; Eding, E.; Kokou, F. Effect of Rearing Systems and Dietary Probiotic Supplementation on the Growth and Gut Microbiota of Nile Tilapia (Oreochromis niloticus) Larvae. Aquaculture 2022, 546, 737297. [Google Scholar] [CrossRef]
  90. Giatsis, C.; Sipkema, D.; Smidt, H.; Heilig, H.; Benvenuti, G.; Verreth, J.; Verdegem, M. The Impact of Rearing Environment on the Development of Gut Microbiota in Tilapia Larvae. Sci. Rep. 2015, 5, 18206. [Google Scholar] [CrossRef]
  91. Gaikwad, S.S.; Shouche, Y.S.; Gade, W.N. Deep Sequencing Reveals Highly Variable Gut Microbial Composition of Invasive Fish Mossambicus Tilapia (Oreochromis mossambicus) Collected from Two Different Habitats. Indian J. Microbiol. 2017, 57, 235–240. [Google Scholar] [CrossRef] [PubMed]
  92. Li, H.; Hill, N.; Wallace, J. A Perennial Living Mulch System Fosters a More Diverse and Balanced Soil Bacterial Community. PLoS ONE 2023, 18, e0290608. [Google Scholar] [CrossRef]
  93. Ruiz, A.; Scicchitano, D.; Palladino, G.; Nanetti, E.; Candela, M.; Furones, D.; Sanahuja, I.; Carbó, R.; Gisbert, E.; Andree, K.B. Microbiome Study of a Coupled Aquaponic System: Unveiling the Independency of Bacterial Communities and Their Beneficial Influences among Different Compartments. Sci. Rep. 2023, 13, 19704. [Google Scholar] [CrossRef] [PubMed]
  94. Brown, B.R.P.; Nunez, J.C.B.; Rand, D.M. Characterizing the Cirri and Gut Microbiomes of the Intertidal Barnacle Semibalanus Balanoides. Anim. Microbiome 2020, 2, 41. [Google Scholar] [CrossRef]
  95. Wang, M.; Fan, Z.; Zhang, Z.; Yi, M.; Liu, Z.; Ke, X.; Gao, F.; Cao, J.; Lu, M. Effects of Diet on the Gut Microbial Communities of Nile Tilapia (Oreochromis niloticus) across Their Different Life Stages. Front. Mar. Sci. 2022, 9, 926132. [Google Scholar] [CrossRef]
  96. Vinasyiam, A.; Verdegem, M.C.; Ekasari, J.; Schrama, J.W.; Kokou, F. Prokaryotic and Eukaryotic Microbial Community Dynamics in Biofloc Systems Supplemented with Non-Starch Polysaccharides. Aquaculture 2024, 594, 741396. [Google Scholar] [CrossRef]
  97. Riahi, H.S.; Heidarieh, P.; Fatahi-Bafghi, M. Genus Pseudonocardia: What We Know about Its Biological Properties, Abilities and Current Application in Biotechnology. J. Appl. Microbiol. 2021, 132, 890–906. [Google Scholar] [CrossRef]
  98. Wang, L.; Gao, C.; Yang, L.; Wang, C.; Wang, B.; Wang, H.; Shu, Y.; Yan, Y. The Growth-Promoting and Lipid-Lowering Effects of Berberine Are Associated with the Regulation of Intestinal Bacteria and Bile Acid Profiles in Yellow Catfish (Pelteobagrus Fulvidraco). Aquac. Rep. 2023, 33, 101848. [Google Scholar] [CrossRef]
  99. Pontefract, N.; Sykes, L.; Rawling, M.; Merrifield, D.L. Prebiotic and Probiotic Applications in Fish and Crustaceans. In Feed and Feeding for Fish and Shellfish; Kumar, V., Ed.; Academic Press: London, UK, 2025; pp. 213–247. [Google Scholar] [CrossRef]
  100. Ntakirutimana, R.; Syanya, F.J.; Mwangi, P. Exploring the Impact of Probiotics on the Gut Ecosystem and Morpho-Histology in Fish: Current Knowledge of Tilapia. Asian J. Fish. Aquat. Res. 2023, 25, 93–112. [Google Scholar] [CrossRef]
  101. Chen, X.; Zhang, Z.; Fernandes, J.M.O.; Gao, Y.; Yin, P.; Liu, Y.; Tian, L.; Xie, S.; Niu, J. Beneficial Effects on Growth, Haematic Indicators, Immune Status, Antioxidant Function and Gut Health in Juvenile Nile Tilapia (Oreochromis niloticus) by Dietary Administration of a Multi-Strain Probiotic. Aquac. Nutr. 2020, 26, 1369–1382. [Google Scholar] [CrossRef]
  102. Won, S.; Hamidoghli, A.; Choi, W.; Park, Y.; Jang, W.J.; Kong, I.-S.; Bai, S.C. Effects of Bacillus subtilis WB60 and Lactococcus lactis on Growth, Immune Responses, Histology and Gene Expression in Nile Tilapia, Oreochromis niloticus. Microorganisms 2020, 8, 67. [Google Scholar] [CrossRef]
  103. Smirnov, A.; Perez, R.; Amit-Romach, E.; Sklan, D.; Uni, Z. Mucin Dynamics and Microbial Populations in Chicken Small Intestine Are Changed by Dietary Probiotic and Antibiotic Growth Promoter Supplementation. J. Nutr. 2005, 135, 187–192. [Google Scholar] [CrossRef]
  104. Kim, Y.S.; Ho, S.B. Intestinal Goblet Cells and Mucins in Health and Disease: Recent Insights and Progress. Curr. Gastroenterol. Rep. 2010, 12, 319–330. [Google Scholar] [CrossRef]
  105. Selim, K.M.; Reda, R.M. Improvement of Immunity and Disease Resistance in the Nile Tilapia, Oreochromis niloticus, by Dietary Supplementation with Bacillus amyloliquefaciens. Fish Shellfish Immunol. 2015, 44, 496–503. [Google Scholar] [CrossRef]
  106. Elsabagh, M.; Mohamed, R.; Moustafa, E.M.; Hamza, A.; Farrag, F.; Decamp, O.; Dawood, M.A.; Eltholth, M. Assessing the Impact of Bacillus strains Mixture Probiotic on Water Quality, Growth Performance, Blood Profile and Intestinal Morphology of Nile Tilapia, Oreochromis niloticus. Aquac. Nutr. 2018, 24, 1613–1622. [Google Scholar] [CrossRef]
  107. Ghalwash, H.R.; Salah, A.S.; El-Nokrashy, A.M.; Abozeid, A.M.; Zaki, V.H.; Mohamed, R.A. Dietary Supplementation with Bacillus species Improves Growth, Intestinal Histomorphology, Innate Immunity, Antioxidative Status and Expression of Growth and Appetite-Regulating Genes of Nile Tilapia Fingerlings. Aquac. Res. 2021, 53, 1378–1394. [Google Scholar] [CrossRef]
  108. Hassaan, M.S.; Mohammady, E.Y.; Soaudy, M.R.; Elashry, M.A.; Moustafa, M.M.; Wassel, M.A.; El-Garhy, H.A.; El-Haroun, E.R.; Elsaied, H.E. Synergistic Effects of Bacillus pumilus and Exogenous Protease on Nile Tilapia (Oreochromis niloticus) Growth, Gut Microbes, Immune Response and Gene Expression Fed Plant Protein Diet. Anim. Feed Sci. Technol. 2021, 275, 114892. [Google Scholar] [CrossRef]
  109. Al-Hisnawi, A.; Rodiles, A.; Rawling, M.D.; Castex, M.; Waines, P.; Gioacchini, G.; Carnevali, O.; Merrifield, D.L. Dietary Probiotic Pediococcus acidilactici MA18/5M Modulates the Intestinal Microbiota and Stimulates Intestinal Immunity in Rainbow Trout (Oncorhynchus mykiss). J. World Aquac. Soc. 2019, 50, 1133–1151. [Google Scholar] [CrossRef]
  110. Jaramillo-Torres, A.; Rawling, M.D.; Rodiles, A.; Mikalsen, H.E.; Johansen, L.-H.; Tinsley, J.; Forberg, T.; Aasum, E.; Castex, M.; Merrifield, D.L. Influence of Dietary Supplementation of Probiotic Pediococcus acidilactici MA18/5M during the Transition from Freshwater to Seawater on Intestinal Health and Microbiota of Atlantic Salmon (Salmo salar L.). Front. Microbiol. 2019, 10, 2243. [Google Scholar] [CrossRef]
  111. Yang, G.; Cao, H.; Jiang, W.; Hu, B.; Jian, S.; Wen, C.; Kajbaf, K.; Kumar, V.; Tao, Z.; Peng, M. Dietary Supplementation of Bacillus cereus as Probiotics in Pengze Crucian Carp (Carassius auratus Var. Pengze): Effects on Growth Performance, Fillet Quality, Serum Biochemical Parameters and Intestinal Histology. Aquac. Res. 2019, 50, 2207–2217. [Google Scholar] [CrossRef]
  112. Haque, M.M.; Hasan, N.A.; Eltholth, M.M.; Saha, P.; Mely, S.S.; Rahman, T.; Murray, F.J. Assessing the Impacts of In-Feed Probiotic on the Growth Performance and Health Condition of Pangasius (Pangasianodon hypophthalmus) in a Farm Trial. Aquac. Rep. 2021, 20, 100699. [Google Scholar] [CrossRef]
  113. Rawling, M.; Schiavone, M.; Mugnier, A.; Leclercq, E.; Merrifield, D.; Foey, A.; Apper, E. Modulation of Zebrafish (Danio rerio) Intestinal Mucosal Barrier Function Fed Different Postbiotics and a Probiotic from Lactobacilli. Microorganisms 2023, 11, 2900. [Google Scholar] [CrossRef]
  114. Salem, I.; Ramser, A.; Isham, N.; Ghannoum, M.A. The Gut Microbiome as a Major Regulator of the Gut-Skin Axis. Front. Microbiol. 2018, 9, 1459. [Google Scholar] [CrossRef]
  115. Dawood, M.A.O.; Koshio, S.; Ishikawa, M.; Yokoyama, S. Interaction Effects of Dietary Supplementation of Heat-Killed Lactobacillus plantarum and β-Glucan on Growth Performance, Digestibility and Immune Response of Juvenile Red Sea Bream, Pagrus major. Fish Shellfish Immunol. 2015, 45, 33–42. [Google Scholar] [CrossRef]
  116. Hernández, L.H.H.; Barrera, T.C.; Mejía, J.C.; Mejía, G.C.; del Carmen, M.; Dosta, M.; de Lara Andrade, R.; Sotres, J.A.M. Effects of the Commercial Probiotic Lactobacillus casei on the Growth, Protein Content of Skin Mucus and Stress Resistance of Juveniles of the Porthole Livebearer Poecilopsis gracilis (Poecilidae). Aquac. Nutr. 2009, 16, 407–411. [Google Scholar] [CrossRef]
  117. Rodríguez-Estrada, U.; Satoh, S.; Haga, Y.; Fushimi, H.; Sweetman, J. Effects of Inactivated Enterococcus faecalis and Mannan Oligosaccharide and Their Combination on Growth, Immunity, and Disease Protection in Rainbow Trout. J. Appl. Aquac. 2013, 25, 416–428. [Google Scholar] [CrossRef]
  118. Flores, E.M.; Nguyen, A.T.; Odem, M.A.; Eisenhoffer, G.T.; Krachler, A.M. The Zebrafish as a Model for Gastrointestinal Tract–Microbe Interactions. Cell. Microbiol. 2020, 22, e13152. [Google Scholar] [CrossRef] [PubMed]
  119. Gonçalves, M.; Lopes, C.; Silva, P. Comparative Histological Description of the Intestine in Platyfish (Xiphophorus maculatus) and Swordtail Fish (Xiphophorus helleri). Tissue Cell 2024, 87, 102306. [Google Scholar] [CrossRef]
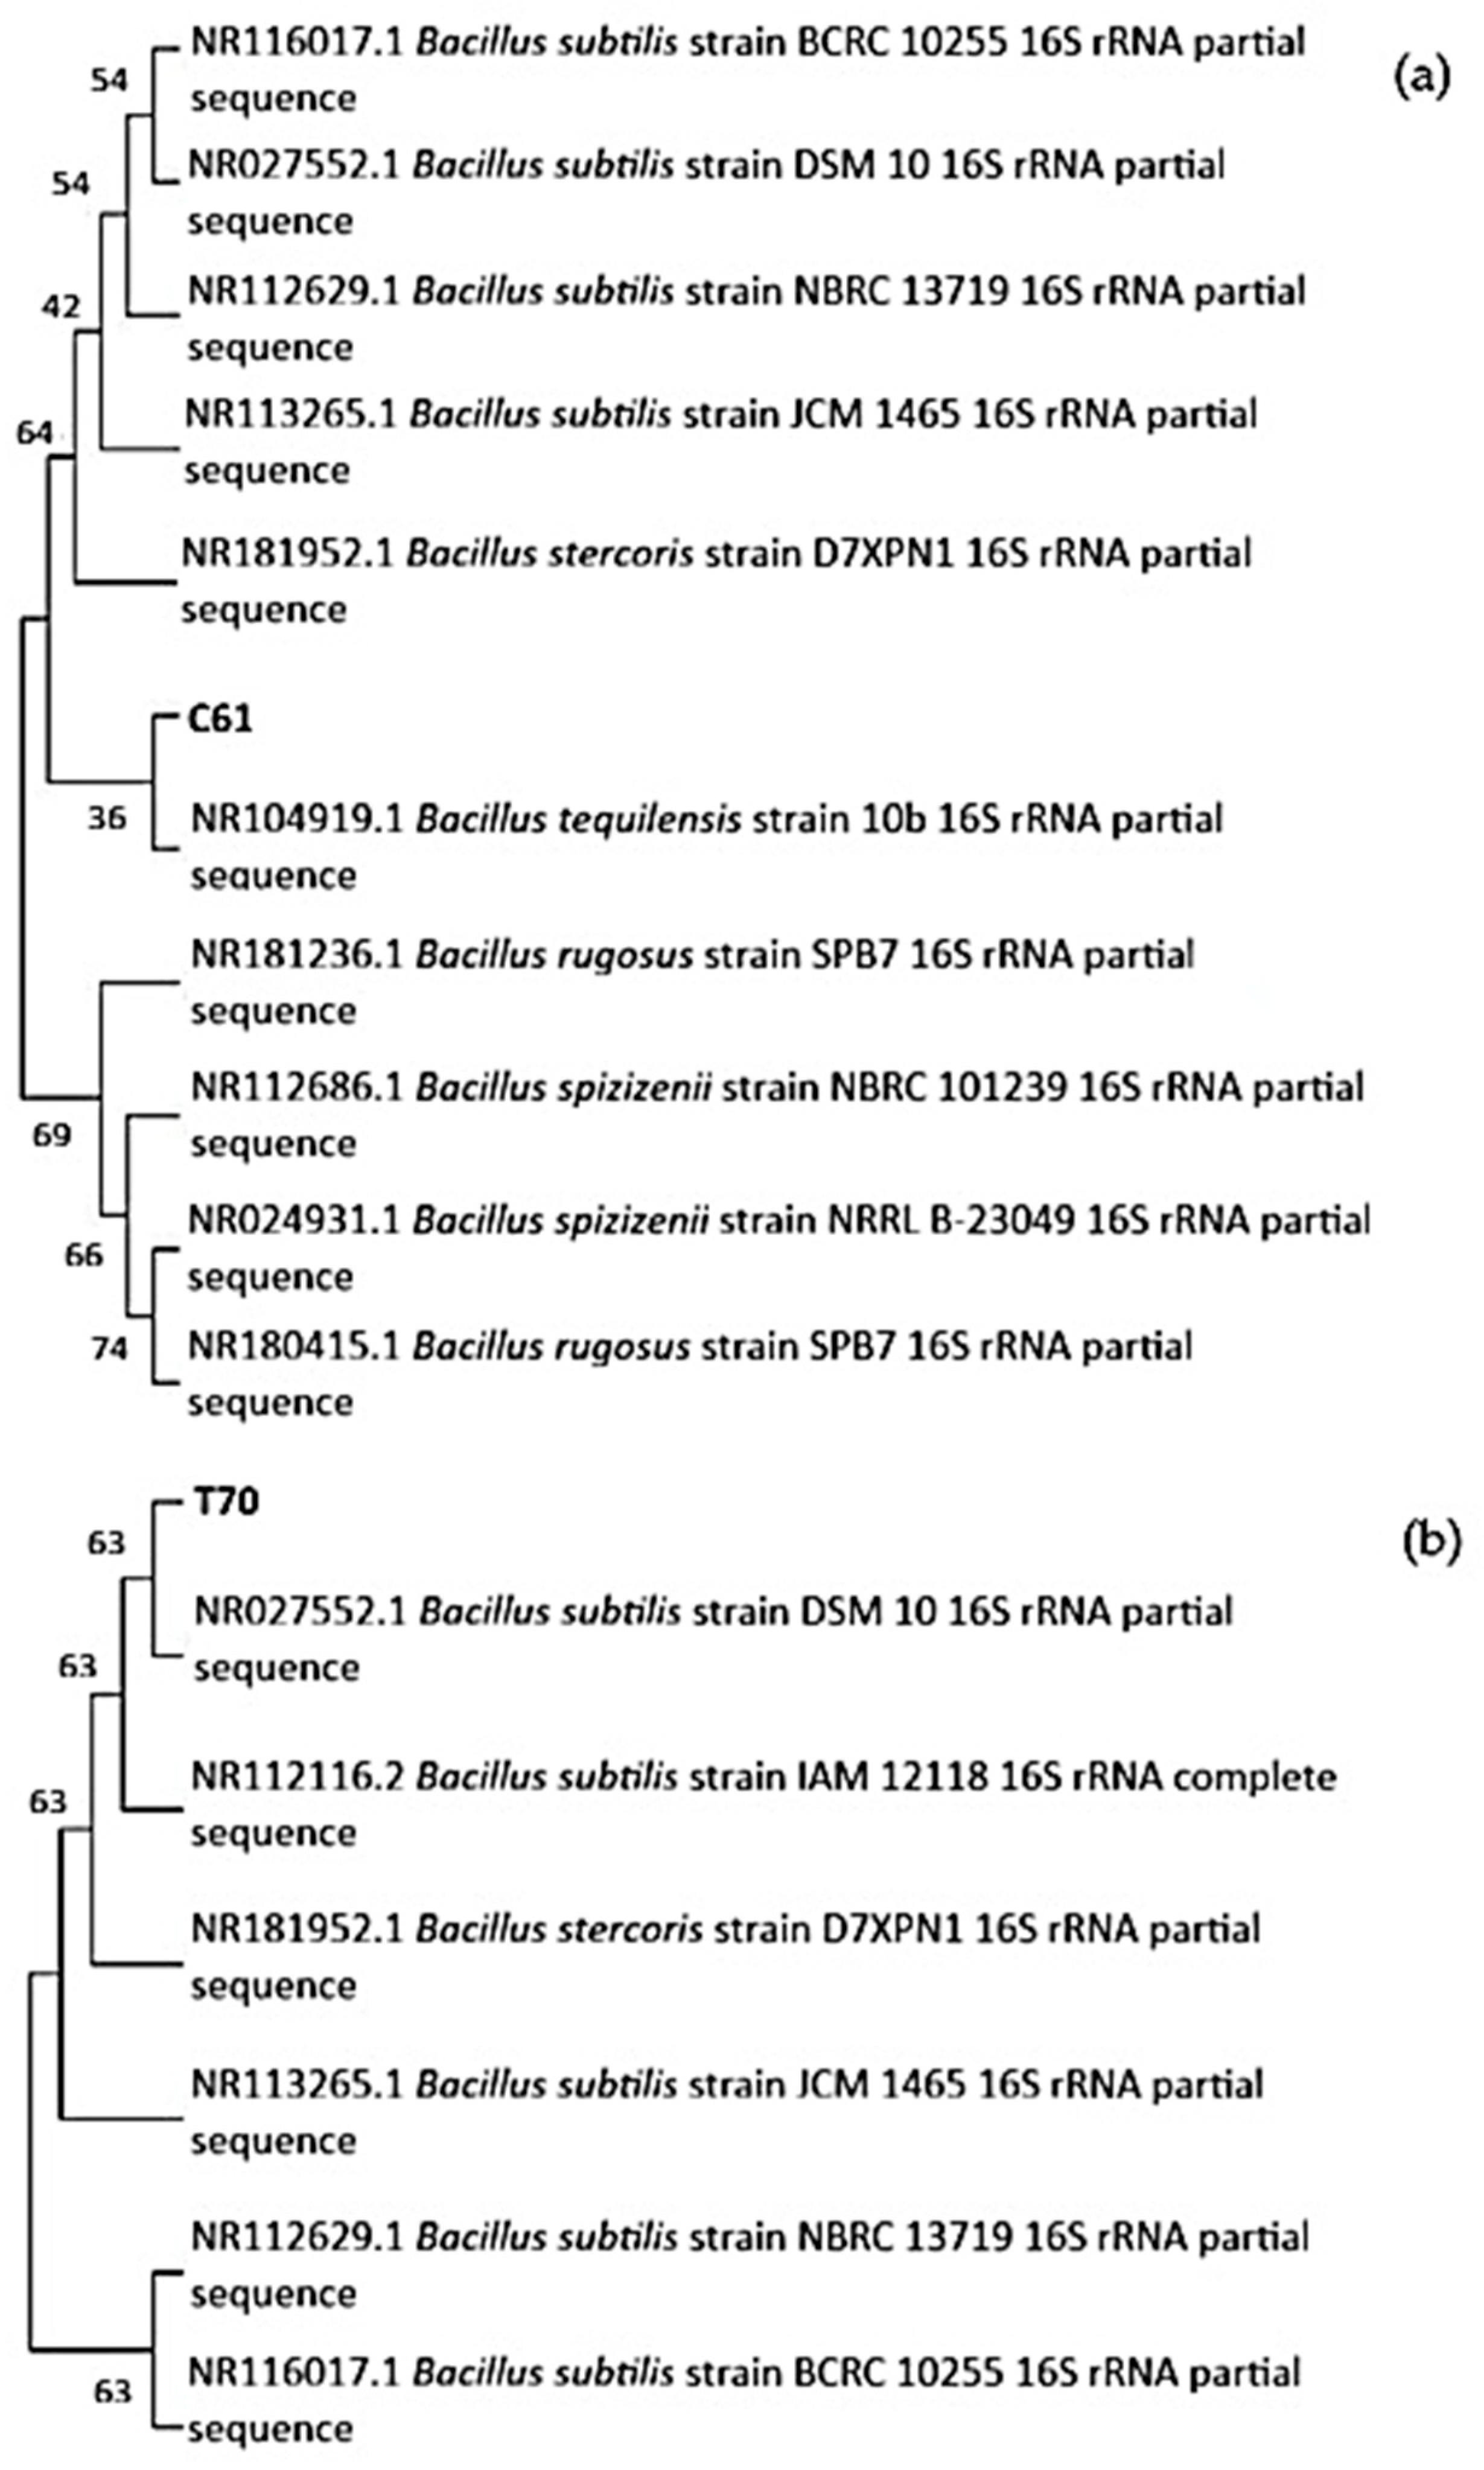
Figure 1. Neighbour-joining phylogenetic tree based on 16S rRNA gene sequences showing the relationship of isolate C61 (a)/T70 (b) and reference Bacillus species. The tree was constructed in MEGA using the Kimura 2-parameter model with 1000 bootstrap replicates. Bootstrap values are shown at branch nodes.
Animals 15 03296 g001
Figure 2. Phytase specific activity of C61 and T70 crude enzyme extract with and without SGJ and SIJ exposure. U mg−1 protein was defined as the amount of enzyme that produced 1 µmol of inorganic phosphorous per min at 50 °C per mg of protein. Data are expressed as mean ± SD (n = 3). Different lowercase letters on different bar colours denote significant difference; different uppercase letters on the same bar colours indicate significant difference (p ≤ 0.05).
Animals 15 03296 g002
Figure 3. Representative photomicrographs from the histological analysis of the posterior intestine of O. niloticus-fed experimental diets. (A,D) control; (B,E) PT1; (C,F) PT2; H & E staining (AC) and AB/vG staining (DF). MFL, mucosal fold length; IEL, intraepithelial leukocyte; LPW, lamina propria width; MT, muscularis thickness; GC, goblet cell. Scale bars: 100 μm.
Animals 15 03296 g003
Figure 4. Representative electron micrographs from the posterior intestine of O. niloticus-fed experimental diets. (A) Control; (B) PT1; (C) PT2. Scale bars: 1 μm.
Animals 15 03296 g004
Figure 5. Representative photomicrographs from the skin histological analysis of O. niloticus-fed experimental diets. (A) Control; (B) PT1; (C) PT2. (AC); AB/vG staining. GC, goblet cell. Scale bars: 100 μm.
Animals 15 03296 g005
Figure 6. Skin goblet cell density (a) and coverage (%) (b) of O. niloticus-fed experimental diets. Boxes depict the interquartile range with the median indicated by the central line; whiskers extend to the most extreme data points, excluding outliers. Individual data points are plotted as dots, and the diamond represents the group mean. Asterisks (*) between columns indicate significant difference (p ≤ 0.05). GC, goblet cell.
Animals 15 03296 g006
Figure 7. Good’s coverage rarefaction curve generated from sequences and ASVs obtained from each sample.
Animals 15 03296 g007
Figure 8. Unique and shared ASVs of the intestinal microbiota of Nile tilapia fed with experimental diets. CON, control; PT1, probiotic treatment 1; PT2, probiotic treatment 2.
Animals 15 03296 g008
Figure 9. Alpha diversity of the intestinal microbiota shown in Chao1 (a), Shannon (b), and Simpson (c) indices. CON, control; PT1, probiotic treatment 1; PT2, probiotic treatment 2.
Animals 15 03296 g009
Figure 10. UPGMA cluster tree based on weighted Unifrac distance (a); beta diversity analysis based on unweighted UniFrac distance (b). Asterisks (**) between columns indicate significant difference (p ≤ 0.01). CON, control; PT1, probiotic treatment 1; PT2, probiotic treatment 2.
Animals 15 03296 g010
Figure 11. Relative abundance of the intestinal microbiota at phylum (a) and genus (b,c) levels. Values are expressed as mean ± standard error of the mean. Asterisks (*) between columns indicate significant difference (p ≤ 0.05). CON, control; PT1, probiotic treatment 1; PT2, probiotic treatment 2.
Animals 15 03296 g011aAnimals 15 03296 g011b
Table 1. Diet formulation of experimental diets.
Ingredient
(g/100 g of Diet)
Treatment
CONPT1PT2
PT1 concentration *--7--
PT2 concentration *----7
Soybean meal a38.038.038.0
Sunflower meal b25.025.025.0
Corn gluten meal a21.721.721.7
Cornstarch8.78.78.7
Sunflower oil3.23.23.2
Fish meal c1.01.01.0
Fish oil0.50.50.5
Lysine HCl0.50.50.5
Vitamin and mineral premix d0.50.50.5
CMC-binder0.50.50.5
Gelatin0.50.50.5
* Probiotic concentration is expressed as log CFU/g. Values are expressed as mean ± standard deviation (SD). a SKT. b Biomar. c Coppens. d Premier nutrition vitamin/mineral premix (contains 121 g kg−1 of calcium, 5.2 g kg−1 of phosphorous, 15.6 g kg−1 of magnesium, 250 mg kg−1 of copper (as cupric sulphate), 7.0 g kg−1 of Vit E (as alpha-tocopherol acetate), 1.0 μg kg−1 of Vit A, 0.1 μg kg−1 of Vit D3, and 787 g kg−1 of ash).
Table 3. Identification and characterisation of 31 autochthonous probiotic candidates isolated from mirror carp and Nile tilapia.
Isolate No.Related SpeciesIdentity (%)AccessionPathogen AntagonismHaemolytic ActivityExtracellular Enzyme Activity
AHSIVAVPYRXylanasePhytaseTannase
C16uncultured Bacilli bacterium98.75%MH375377.1++β++
C22Bacillus sp.99.89%OL679725.1; OL679711.1++α++
C24Bacillus sp.99.89%MT427735.1
OL679725.1; OL679711.1
++β+++
C27Bacillus subtilis100.00%MZ352777.1+++α++
C29Bacillus sp.100.00%OL679725.1; OL679711.1++α+++
C39Bacillus subtilis99.51%KF535143.1; GU193980.1++α++
C54Bacillus subtilis87.85%FR849706.1++α+
C61Bacillus tequilensis and Bacillus subtilis strains>99%NR104919.1++++α++
C72Pseudomonas mosselii99.72%MT598025.1++++no growth+++
C80Bacillus subtilis99.83%OP904234.1+++β++
C122Bacillus subtilis99.07%MT538257.1+++β++
C123Bacillus subtilis99.30%KX426654.1; KX426653.1+++β+++
C140Bacillus sp.99.89%OL679725.1; OL679711.1+++β++
C141Bacillus velezensis99.91%OP060623.1+++β++
C146Bacillus subtilis99.90%CP026662.1++β+++
C150Enterobacter sp. 18A1399.82%AP019634.1+γ+++
T30Bacillus stercoris99.76%MN704462.1+β+++
T32Bacillus subtilis96.86%MN631028.1+β+
T56Bacillus subtilis subsp. subtilis96.47%CP032855.1++β ++
T65Plesiomonas shigelloides94.15%CP050969.1; LT575468.1; KU517709.1+γ no growth no growth no growth
T66Bacillus subtilis98.43%OM980686.1+α ++
T67Bacillus subtilis95.73%MN894000.1++β +++
T68Bacillus subtilis100.00%OP942174.1++α ++
T69Gottfriedia acidiceleris99.66%MF101038.1+ no growth
T70Bacillus subtilis99.70%NR027552.1+++α+++
T71Bacillus thuringiensis99.56%KX822158.1+β no growth no growth no growth
T72Bacillus subtilis98.06%KX426661.1+α ++
T103Bacillus sp. 99.35%OL679725.1; OL679711.1+α ++
T105Bacillus tequilensis99.49%MK296524.1+α +++
T112Bacillus subtilis95.42%ON243943.1+α ++
T113Bacillus tequilensis95.73%JX979116.1++---α ++-
AH, A. hydrophila; SI, S. iniae; VA, V. anguillarum; VP, V. parahaemolyticus; YR, Y. ruckeri; + (inhibition/positive); − (non inhibition/negative); α, alpha haemolysis; β, beta haemolysis; γ, gamma haemolysis.
Table 4. Pathogen antagonism of isolates C61 and T70 against A. hydrophila with and without SIJ exposure.
IsolateZone of Inhibition (mm)
Without SIJ ExposureWith SIJ Exposure
C6115.33 ± 0.5814.67 ± 0.58
T7016.33 ± 0.58 a14.00 ± 1.00 b
Values are expressed as mean ± SD (n = 3). Superscript letters in the same row indicate significant difference (p ≤ 0.05).
Table 5. Growth performance of Nile tilapia fed with probiotic-supplemented diets.
ParameterTreatment
CONPT1PT2
IW (g fish−1)5.4 ± 0.05.2 ± 0.25.4 ± 0.0
FW (g fish−1)11.8 ± 0.511.8 ± 0.512.5 ± 0.6
NWG (g fish−1)6.4 ± 0.56.5 ± 0.47.1 ± 0.6
SGR (% day−1)1.9 ± 0.11.9 ± 0.12.0 ± 0.1
FI (g fish−1)9.3 ± 0.49.5 ± 1.09.7 ± 0.4
FCR (g g−1)1.5 ± 0.11.5 ± 0.11.4 ± 0.1
PER1.5 ± 0.11.5 ± 0.11.6 ± 0.1
CF1.7 ± 0.11.7 ± 0.01.7 ± 0.0
% Survival98.5 ± 2.695.5 ± 7.997.0 ± 5.3
Values are expressed as mean ± SD. CON, control; PT1, probiotic treatment 1; PT2, probiotic treatment 2; IW, initial weight; FW, final weight; NWG, net weight gain; SGR, specific growth rate; FI, feed intake; FCR, feed conversion ratio; PER, protein efficiency ratio; CF, condition factor.
Table 6. Carcass composition of Nile tilapia fed with probiotic-supplemented diets.
Component (%)Treatment
CONPT1PT2
Moisture73.6 ± 0.974.4 ± 1.274.4 ± 0.8
Protein57.4 ± 0.958.0 ± 3.159.0 ± 0.5
Lipid25.9 ± 2.724.9 ± 3.423.6 ± 1.1
Ash10.6 ± 0.810.4 ± 0.910.6 ± 0.4
% Moisture is reported on a wet weight basis, while % protein, % lipid, and % ash are expressed on a dry matter basis. Values are expressed as mean ± SD. CON, control; PT1, probiotic treatment 1; PT2, probiotic treatment 2.
Table 7. Posterior intestine morphometrics of Nile tilapia fed with probiotic-supplemented diets.
ParameterTreatment
CONPT1PT2
Mucosal fold length (µm)120.6 ± 29.5 a166.0 ± 27.5 b123.0 ± 27.1 a
Lamina propia width (µm)22.1 ± 5.621.0 ± 8.218.3 ± 4.0
Muscularis thickness (µm)21.7 ± 11.3 a22.5 ± 9.5 a11.3 ± 3.3 b
Goblet cell count (n/70 µm)5.6 ± 2.6 a9.3 ± 2.4 b8.1 ± 2.8 ab
% Goblet cell coverage
(n/70 µm)
5.5 ± 4.56.8 ± 3.46.7 ± 2.8
IEL count (n/70 µm)25.8 ± 2.729.5 ± 11.132.6 ± 10.1
Microvilli density (AU)30.1 ± 6.324.1 ± 12.327.7 ± 11.7
Values are expressed as mean ± SD (n = 9). Different letters in the same row indicate significant difference (p ≤ 0.05). CON, control; PT1, probiotic treatment 1; PT2, probiotic treatment 2; IELs, intraepithelial leukocytes.
Table 8. Total viable counts (log CFU/g) of total cultivable allochthonous and presumptive Bacillus spp. in the mid-intestine of Nile tilapia fed with probiotic-supplemented diets.
Treatment
CONPT1PT2
allochthonous7.0 ± 0.46.9 ± 0.47.1 ± 0.2
Bacillus spp.5.4 ± 0.35.5 ± 0.44.9 ± 0.7
Values are expressed as mean ± SD (n = 9). CON, control; PT1, probiotic treatment 1; PT2, probiotic treatment 2.
Disclaimer/Publisher’s Note: The statements, opinions and data contained in all publications are solely those of the individual author(s) and contributor(s) and not of MDPI and/or the editor(s). MDPI and/or the editor(s) disclaim responsibility for any injury to people or property resulting from any ideas, methods, instructions or products referred to in the content.