Simple Summary
Consumers, veterinarians, and farmers are increasingly concerned about animal welfare on dairy farms. Thus, invasive procedures should be avoided along the production flux and also during additional procedures, such as performing welfare measurements. In this study, we investigated whether routinely collected milk composition data could serve as an indicator of cows’ health and well-being. Data from 37 commercial farms were analysed, combining milk composition with direct assessments of health, behaviour, and housing conditions. Our findings indicated that specific milk components, such as the fat-to-protein ratio, energy-related metabolites, and udder health indicators, were significantly associated with markers of favourable or unfavourable welfare. Farms with healthier and more content cows tended to produce milk with a better fat-to-protein balance and lower evidence of disease. Conversely, farms with welfare challenges such as lameness, mastitis, or poor hygiene exhibited distinctive milk profiles. These results demonstrated that routine milk testing, already an integral part of herd management, can provide a simple and non-invasive means of monitoring animal welfare. Using milk characteristics to explore the cows’ health and welfare, farmers and advisors can make quicker, evidence-based decisions that benefit both the animals and society.
Abstract
Animal welfare is increasingly recognised as a core component of sustainable dairy production, yet objective assessment at the herd level remains challenging. This study evaluated whether milk biomarkers can serve as non-invasive indicators of cow welfare. Thirty-seven dairy farms were assessed using the Welfare Quality® protocol and various milk analysis parameters. As a first line of results, Spearman correlations revealed strong associations between milk biomarkers and welfare indicators. For example, a higher fat-to-protein ratio was linked to better feeding, lower prevalence of hunger, and improved human–animal relationships. In contrast, elevated somatic cell count and differential somatic cell count were associated with mastitis, lameness, dirtiness, and reduced emotional well-being. Using Principal Component Analysis (PCA), three dimensions were identified, health–hygiene, socio-behavioural, and metabolic stress, explaining 44.7% of variance. K-means clustering distinguished three herd profiles: feeding–metabolic balance, behavioural–comfort, and clinical–hygiene risk. These findings demonstrated that routine milk biomarkers provide integrated, non-invasive information on herd health, behaviour and, comfort. Incorporating routine milk analysis into welfare assessments can support the early detection of issues, facilitate evidence-based decision-making, and promote sustainable dairy management.
1. Introduction
Milk is an ideal matrix for cattle welfare monitoring because it is easily sampled and reflects the interplay of diet, metabolism, and udder health. Its biochemical, cellular, and spectral biomarkers provide insight into the physiological condition, metabolic balance, and immune response, key components of overall welfare [1]. Produced by mammary epithelial cells, milk contains fat, protein, lactose, minerals, enzymes, cells, and metabolites influenced by genetics, diet, physiology, and disease [2,3]. Strong blood–milk correlations support the use of milk traits as indicators of systemic status, particularly during the transition period [4].
Among metabolic indicators, the fat-to-protein ratio (FPR) is a well-established marker of energy balance. Elevated values indicate lipomobilisation and risk of ketosis, while low ratios suggest subacute ruminal acidosis [5,6]. FPR reliably reflects metabolic disorders [7] and correlates negatively with energy balance, especially in the postpartum period [5]. It also responds to environmental stressors, such as heat [8,9], and differs between farms with contrasting welfare standards [10].
β-hydroxybutyrate (BHB), the main ketone body, directly indicates lipolysis and hepatic ketogenesis. Elevated milk or blood BHB is associated with reduced feed intake, impaired immunity, and postpartum disorders [11,12]. Despite variations with lactation stage, MIR-predicted BHB enables accurate herd-level monitoring [13,14,15], and metabolomic studies confirm its role as a marker of metabolic disease and mastitis risk [16].
Milk urea nitrogen (MUN) reflects protein–energy synchrony and nitrogen utilisation efficiency, varying with diet and energy intake [17,18]. While mainly a nutritional indicator, it also relates to reproduction and nitrogen losses [19,20,21], though interpretation depends on the environment and lactation stage [17,18].
Udder health, a key welfare component, is routinely assessed using somatic cell count (SCC) and differential SCC (DSCC), which provide detailed immune profiling [22]. Combined SCC-DSCC monitoring enhances mastitis detection and accounts for parity and lactation stage [23,24,25,26]. DSCC correlates strongly with milk quality and udder health, confirming its value in herd monitoring [27,28].
Lactose concentration indicates udder integrity, decreasing during mastitis or epithelial damage [29,30]. It is associated with lower SCC and better metabolic status [8,31,32], while pathogen-specific mastitis and inflammation reduce lactose content and yield [33,34]. Behavioural studies further link lactose levels to emotional states, highlighting its potential as a physiological and welfare marker [35].
Microbiological traits, including total bacterial count (TBC), mainly reflect hygiene. Although their correlations with welfare indices are weak [36,37], herd-level variation is related to management and housing [38]. Routinely collected herd data (RHD), such as production or fertility, have been proposed as welfare proxies [39,40,41] but cannot replace animal-based measures; milk yield alone inconsistently reflects welfare [42].
Despite extensive research on single biomarkers, their combined ability to reflect herd-level welfare, including feeding, housing, health, and behaviour, remains underexplored. Advances in mid-infrared spectroscopy, in-line sensors, and data science now allow for the integration of metabolic, inflammatory, and hygiene signals with animal-based measures [14,43]. Therefore, this study aimed to (1) investigate the relationships between milk biomarkers and animal-based welfare indicators; (2) identify multivariate patterns integrating health, metabolism, and behaviour; and (3) evaluate whether these patterns can classify farms into distinct welfare categories.
Unlike previous studies that investigated individual production or health traits, the present work integrates multiple milk biomarkers with animal-based welfare indicators using a multivariate approach at the herd level, offering a novel framework for precision welfare assessment.
2. Materials and Methods
2.1. Study Population
The study was conducted between April 2023 and December 2024 on 37 commercial dairy farms in Transylvania, Romania, comprising a total of 3377 lactating cows. Herd size ranged from 13 to 340 animals, predominantly Holstein Friesian (78%) and Romanian Spotted (22%) breeds, and encompassed a diversity of housing and management systems, including free-stall (26) and tie-stall (11) configurations, with variable access to pasture and/or outdoor loafing areas (OLAs). The farms were recruited with the assistance of breeders’ associations and field veterinarians. Initially, 54 farms were identified; however, some owners later declined participation (11 farms). Inclusion criteria were commercial dairy herds with ≥10 lactating cows; willingness of the farm owner to participate; and accessibility for repeated welfare and milk sampling. Farms with incomplete welfare or milk records were excluded from the analysis (6 farms). As the study period spanned multiple seasons, potential seasonal variations (e.g., access to pasture, heat stress) were inherently included in the dataset. A particular strength of this study was the collection methodology of all cow-based parameters, which were sampled individually.
2.2. Welfare Assessment
Animal welfare was assessed twice, at one-month intervals, using the Welfare Quality® protocol for dairy cattle [44]. For each farm, the results from the two evaluations were averaged to obtain a final composite welfare score. The protocol integrates both resource- and animal-based indicators to provide a comprehensive assessment of feeding, housing, health and behaviour, covering four principles (good feeding, good housing, good health, and appropriate behaviour) subdivided into 12 criteria (absence of prolonged hunger and thirst, comfort around resting, ease of movement, absence of injuries, absence of disease, absence of pain induced by management procedures, social and other behavioural expressions, human–animal relationship, and positive emotional state) and further into multiple measures.
The individual data collection for 3377 lactating cows included measures such as the identification of very lean cows, lying behaviour evaluation (duration of lying down movements, lying down with collisions, lying position), cleanliness scores (dirty lower legs, dirty udder, dirty flanks and upper legs), avoidance distance tests, recording of social interactions (butts and displacements), and the clinical signs of health issues (nasal discharge, increased respiratory rate, ocular discharge, diarrhoea, vulvar discharge, coughing, and integument alterations, such as hairless patches, lesions/swellings). Lameness was assessed individually as well (scoring each cow as non-lame, moderately lame, or severely lame), and using qualitative behaviour assessment (QBA), each cow was scored on the protocol’s pre-established terms (active, relaxed, fearful, agitated, calm, content, indifferent, frustrated, friendly, bored, playful, positively occupied, lively, inquisitive, irritable, uneasy, sociable, apathetic, happy, and distressed) [44]. By consulting farm records, the prevalence of mastitis, dystocia, downer cows, and mortality was registered for each facility. The detailed assessment methodology is described in the Welfare Quality® Assessment protocol for cattle [38]. For the calculation of the criteria and principle scores, the Welfare Quality® scoring system software was used [45].
All the procedures involving animals were carried out in accordance with the ethical guidelines of the Romanian National Animal Protection Law [46].
2.3. Milk Sampling and Laboratory Analysis
To ensure direct comparability between welfare status and milk quality, individual milk samples were collected from all lactating cows on each farm at the time of welfare assessment. Sampling was performed during the morning milking. The collection of samples (a total of 6754) and their analysis were carried out twice, at one-month intervals, in parallel with the two welfare assessments. For each farm, the results obtained from all cows were averaged to yield a single monthly value for each milk quality parameter. The two monthly means were then averaged to generate a final farm-level result.
The variables included compositional traits, such as fat, protein, casein, and lactose contents, from which the fat-to-protein ratio (FPR) was calculated. The milk yield was expressed as the average quantity of milk obtained per cow per milking. In addition, metabolic biomarkers including urea, acetone, and β-hydroxybutyrate (BHB) were measured to capture aspects of protein–energy balance and ketone body production. Udder health was assessed using somatic cell count (SCC) and differential somatic cell count (DSCC), whereas hygienic quality was evaluated using total plate count (TPC).
All physical–chemical parameters, as well as SCC and DSCC, were determined using a CombiFoss™ 7 FT analyser (Foss Electric, Hillerød, Denmark), whereas TPC was quantified with a BactoScan™ FC analyser (Foss Electric, Hillerød, Denmark). All laboratory determinations were performed in an ISO/IEC 17025-accredited laboratory (RENAR, Bucharest, Romania), following the International Organisation for Standardisation (ISO) procedures.
2.4. Statistical Analysis
All statistical analyses were conducted in R software (version 4.5.1, R Core Team, Vienna, Austria) using the packages tidyverse, psych, cluster, factoextra, pheatmap, mclust, writexl, and ggplot2. Descriptive statistics were computed for all variables to summarise central tendencies and variation across farms. Pairwise associations between milk biomarkers, production parameters, and welfare indicators were assessed using Spearman’s rank correlation, a robust method for non-normal distributions. To reduce the risk of type I errors, p-values were adjusted for multiple testing using the false discovery rate (FDR) method. Post hoc power estimation indicated that the achieved power exceeded 0.90 for moderate correlations (rs ≥ 0.40; α = 0.05, two-tailed, n = 37 herds).
Before Principal Component Analysis (PCA) and K-means clustering, all variables were standardised to z-scores to ensure comparability across different measurement scales. PCA was used to reduce dimensionality and identify latent multivariate patterns. The Kaiser–Meyer–Olkin (KMO) measure indicated sampling adequacy (>0.6), and Bartlett’s test was significant (p < 0.001), confirming sufficient inter-variable correlations to justify the use of PCA. PCA loadings, explained variance, and component scores were extracted, then biplots were generated to visualise relationships between variables and farms.
Cluster analysis was performed using two complementary approaches. First, K-means clustering was applied to the standardised dataset to classify farms with similar milk composition and welfare profiles. The optimal number of clusters (k) was determined using the Silhouette coefficient, Calinski–Harabasz index, and Gap statistic. Second, hierarchical agglomerative clustering (Ward’s linkage, Euclidean distance) grouped variables to identify domains of co-varying biomarkers and welfare indicators, visualised as a clustered heatmap.
3. Results
3.1. Descriptive Data
3.1.1. Milk Biomarkers and Production
A comprehensive overview of milk composition, metabolic status, udder health, and production performance across the 37 studied farms is presented in Table 1.

Table 1.
Milk biomarkers, udder health indicators, and production traits (mean ± SD; median and min-max).
3.1.2. Welfare Indicators
The results of the welfare assessment are shown in Table 2, Table 3 and Table 4. The assessment of the 37 farms using the Welfare Quality® protocol revealed considerable variation across principles, criteria, and measures.
Table 2.
Descriptive statistics for welfare principle and criteria scores in 37 dairy farms.
Table 3.
Descriptive statistics for the animal-based measures in 37 dairy farms.
Table 4.
Descriptive statistics for each descriptor of the qualitative behaviour assessment in 37 dairy farms.
“Good feeding” and “Good housing” principles (Table 2) showed moderate scores, with issues related to body condition and housing hygiene (Table 3). The “Good health” principle achieved the lowest values due to the high prevalence of mastitis, diarrhoea, and integument alterations (Table 3). Appropriate behaviour presented heterogeneous outcomes, with well-expressed social behaviours but limited exploratory and play behaviours.
The Qualitative Behaviour Assessment (Table 4) indicated predominantly positive emotional states, although variability was observed between farms.
3.2. Associations Between Milk Biomarkers and Animal-Based Welfare Parameters
Table 5 presents the significant correlations found between milk biomarkers and welfare outcomes.
Table 5.
Significant Spearman correlations between milk biomarkers and animal-based welfare parameters after FDR adjustment (FDR ≤ 0.05).
Higher FPR was linked to improved feeding, lower disease prevalence, and better human–animal relationships, while elevated BHB was associated with poorer comfort and more injuries. Milk yield correlated positively with housing and health and negatively with mortality and dirtiness. SCC and DSCC were consistently linked to mastitis, lameness, and negative emotional states, whereas higher lactose concentrations were associated with good health and inquisitive, calm behaviour. As shown in Table 5, the correlations found were, in most cases, moderate (rs between 0.44 and 0.57).
3.3. Multivariate Structure
Principal Component Analysis (PCA) was applied to explore the multivariate structure of welfare indicators, milk biomarkers, and production traits across the 37 farms. The scree plot and eigenvalue distribution supported retention of the first three components, which together explained 44.7% of the total variance (PC1 = 24.2%, PC2 = 11.8%, PC3 = 8.7%) (see Figure S1 in the Supplementary Material). Although the cumulative variance did not reach the conventional 60–70% threshold typically considered sufficient for robust factor interpretation, the retained dimensions nevertheless revealed biologically meaningful patterns.
Because loadings ≥ |0.30| are usually considered relevant for interpretation [47], we initially used this threshold but adopted a more inclusive criterion (≥|0.10|) given the exploratory nature of the study and the relatively low variance explained per component. This approach allowed identification of subtle but biologically relevant associations while acknowledging the hypothesis-generating character of the analysis. PC1 (24.2% variance explained) represented a broad welfare-health gradient. Negative loadings were associated with favourable conditions, including “Good health”, “Good housing”, “Good feeding”, and positive emotional states (calm, content, happy). Positive loadings reflected adverse welfare outcomes such as elevated SCC and DSCC, mastitis prevalence, lameness, integumentary alterations, cow dirtiness, diarrhoea, nasal discharge, mortality, and increased lying down collisions. This component captured the contrast between herds with adequate metabolic balance, udder health, and emotional well-being versus those with disease burden, hygiene problems, and reduced comfort. These findings were consistent with the Spearman correlations, where SCC and DSCC were strongly associated with disease, lameness, and hygiene deficits. PC2 (11.8% variance explained) described a socio-behavioural and relational axis. Positive loadings included FPR, fat percentage, good human–animal relationship, “Good feeding”, “Appropriate behaviour”, and positive QBA states (lively, active, content, relaxed, playful). Negative loadings reflected poor housing, comfort deficits, injuries, diarrhoea, and negative emotional states (fearful, agitated, irritable, and distressed). The variable “cows that can be touched” loaded strongly on the positive side, linking metabolic balance (FPR) with better human–animal interaction quality. This axis differentiated herds with good stockmanship, balanced feeding, and positive affective states from those with housing deficits and signs of behavioural distress.
Figure 1 shows the PCA correlation circle (PC1 vs. PC2), which graphically represents these relationships by illustrating how milk biomarkers, production traits, and welfare indicators contribute to the first two principal components. Vectors pointing in the same direction indicate positive associations, those in opposite directions indicate negative associations, and vector length reflects the strength of the contribution to PC1 and PC2.

Figure 1.
PCA correlation circle (PC1 vs. PC2) showing the contribution of milk biomarkers, production traits, and welfare indicators to the first two components. Vector direction indicates association, and length indicates contribution strength. The colours of the vectors are green = health and housing-related welfare indicators, red = emotional/affective indicators, and orange = milk biomarkers.
PC3 (8.7% variance explained) captured a bipolar dimension reflecting a trade-off between metabolic stress and positive welfare factors. Positive loadings were driven by BHB, acetone, milk fat, integument alterations, dirty legs, and ambivalent behavioural traits (playful, fearful, and agitated). Negative loadings reflected good human–animal relationships, expression of social behaviours, absence of disease and injuries, and positive affective states (calm, friendly). This dimension distinguished herds experiencing metabolic stress and hygiene problems from those with better health, improved stockmanship, and calmer social dynamics. These results reinforced the Spearman findings linking BHB with injuries, resting discomfort, and dystocia while highlighting the complementary value of behavioural and relational indicators. In summary, the PCA highlighted three biologically relevant dimensions: health and hygiene (PC1), socio-behavioural dynamics (PC2), and metabolic stress (PC3) that together explained nearly half of the variance in the dataset. These axes confirmed that welfare status in dairy herds results from the interplay between metabolic balance, udder health, housing, and behavioural expression.
K-means clustering was performed on the standardised dataset to identify groups of farms with similar milk composition, production traits, and welfare profiles. The optimal number of clusters (k) was evaluated using three complementary methods: the Calinski–Harabasz index (Figure S2A, see the Supplementary Material), average silhouette width (Figure S2B in the Supplementary Material), and the gap statistic (Figure S2C in the Supplementary Material). Both the Calinski–Harabasz and silhouette indices indicated that k = 2 provided the most compact and well-separated solution, whereas the gap statistic suggested a more granular structure with k = 6. To ensure biological relevance and practical interpretability, a three-cluster solution (k = 3) was selected as a compromise, balancing statistical separation with the need to capture intermediate management–welfare profiles.
K-means clustering confirmed the PCA tendencies by partitioning farms into three coherent groups. Cluster 1 was the feeding–metabolic profile, characterised by high FPR, “Good feeding”, and “Appropriate behaviour”, suggesting that favourable protein–energy balance was associated with improved welfare outcomes. Cluster 2 was the behavioural–comfort profile, dominated by QBA descriptors (happy, lively, content, relaxed, sociable), “Good housing”, “Good health”, lactose, and milk yield, reflecting optimal cow comfort and behavioural expression. Cluster 3 was the clinical–hygiene risk profile, defined by SCC, DSCC, mastitis, diarrhoea, nasal discharge, dirtiness scores, and mortality, representing herds with compromised udder health and hygiene challenges.
The distribution of farms in the PCA space, coloured according to K-means cluster assignment, is shown in Figure 2. Clear spatial separation between clusters was observed. Farms in Cluster 1 (red) were located around the origin and aligned with average feeding and production parameters; farms in Cluster 2 (green) were positioned toward the positive PC1 axis, associated with better welfare and behavioural scores; and farms in Cluster 3 (blue) occupied the negative PC1 axis, overlapping with indicators of udder health challenges and hygiene issues.
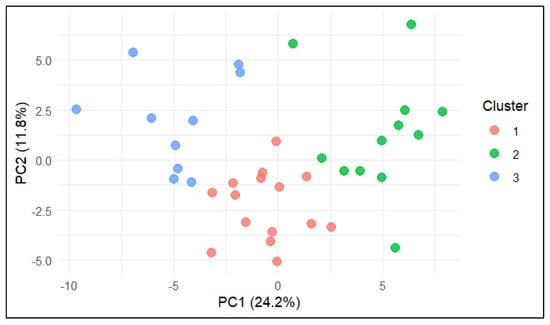
Figure 2.
PCA biplot (PC1 vs. PC2) with farms coloured according to K-means cluster assignment. Cluster 1 = feeding–metabolic profile, Cluster 2 = behavioural–comfort profile, Cluster 3 = clinical–hygiene risk profile.
To complement the farm-level typologies identified by PCA and K-means, a hierarchical agglomerative clustering of variables was performed using Ward’s linkage and Euclidean distance. This analysis grouped milk biomarkers, production traits, and welfare indicators into three biologically meaningful domains, revealing how these variables co-varied across the 37 farms (Figure 3). The first domain represented a metabolic–nutritional profile, including FPR, milk fat, protein, and milk yield, capturing feeding balance and production level. The second domain reflected a behavioural–comfort profile, characterised by QBA descriptors, “Good housing”, “Good health”, and absence of injuries, indicating improved cow comfort and positive emotional states. The third domain represented a clinical–hygiene risk profile, grouping SCC, DSCC, mastitis, diarrhoea, dirtiness scores, and mortality, signalling farms with compromised udder health and hygiene issues.
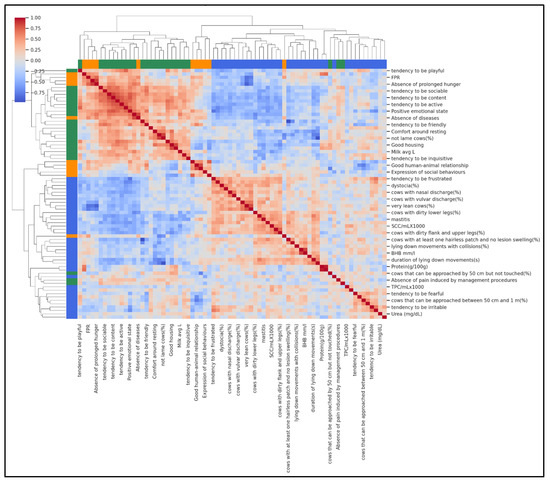
Figure 3.
Hierarchical clustering heatmap showing how variables group together based on their similarity across farms. Each row represents one variable, and the branching tree (dendrogram) shows which variables are most closely related. Colours indicate the three main domains: green for metabolic–nutritional (feeding balance and milk traits), orange for behavioural–comfort variables (housing, comfort, positive behaviours), and blue for clinical–hygiene variables (udder health, dirtiness, mortality). Variables on the same branch share similar patterns, meaning that farms with high values for one variable often have high (or low) values for the others in the same group.
Figure 3 shows the clustered heatmap with colour gradients representing pairwise correlations between variables (red = positive, blue = negative). The clear clustering pattern visually confirms that metabolic, behavioural, and health–hygiene variables tend to vary together, providing an integrated view of herd welfare profiles.
4. Discussion
This study explored whether routinely collected milk biomarkers can act as non-invasive indicators of dairy cow welfare. By integrating compositional, metabolic, and udder health traits with animal-based measures (ABMs) from the Welfare Quality® protocol, consistent associations and multivariate patterns were identified, which provide new insights into how milk reflects the interplay of nutrition, housing, health, and behaviour. These findings strengthen the growing interest in using milk composition as a real-time diagnostic tool for welfare assessment in dairy systems [43,48].
4.1. Descriptive Patterns of Welfare and Milk Quality
The descriptive analysis of welfare indicators revealed considerable heterogeneity among the 37 dairy farms between principles and criteria, confirming that the dairy cows’ welfare level was strongly influenced by variations in management, infrastructure, and husbandry practices. “Good feeding” scores indicated that water availability was generally sufficient, but body condition was suboptimal on many farms, with more than 60% of cows classified as very lean in some cases. This suggests variability in the adequacy of nutritional management and feeding strategies, consistent with earlier studies showing that underfeeding remains a persistent welfare concern in small and medium-sized Eastern European dairy systems [49,50]. “Good housing” varied markedly across farms. Poor comfort around resting, evidenced by the high prevalence of dirty body regions, reflected deficiencies in bedding usage and stall design. This was in agreement with evidence linking hygiene-related body soiling to higher mastitis incidence and compromised udder health [38,51]. Conversely, high “Ease of movement” scores in many farms confirmed that adequate space and design can positively influence welfare.
The lowest results were obtained for the “Good health” principle, with considerable variation in lameness and mastitis prevalence. While severe lameness was relatively infrequent, moderate lameness affected more than 10% of cows, in agreement with previous European studies reporting locomotor disorders as a persistent welfare and economic issue [52,53]. The results on behaviour and emotional state highlighted notable differences in human–animal relationships and social behaviour expression. High scores for positive social interactions and QBA descriptors such as “calm,” “playful,” and “positively occupied” in some farms demonstrated the potential for welfare improvements through adequate management. However, the presence of negative descriptors in other farms indicated deficiencies in environmental conditions or human–animal interactions. These findings support previous research showing the direct impact of management factors on affective state and cattle behaviour [54].
Regarding milk composition, the main parameters (fat, protein, casein, and lactose) were within the physiological ranges, indicating relatively balanced nutrition and metabolic stability at the population level. However, the variability in milk urea levels suggested significant differences in protein balance and nitrogen utilisation across farms. Similar findings have been reported in recent studies linking excess MUN with reduced reproductive performance and environmental nitrogen losses [10,18]. Indicators of udder health revealed substantial variations between the studied farms. Elevated SCC and DSCC values in some herds pointed to subclinical mastitis and inflammatory challenges. These findings confirmed the value of combining SCC and DSCC in routine monitoring, as recent studies highlight DSCC as a sensitive predictor of udder inflammation and milk quality losses [27,28]. The large dispersion of TPC underscored the role of hygiene and equipment sanitation, with evidence showing that poor hygienic practices increase variability in both SCC and bacterial counts [38]. Milk yield per cow showed wide variation, likely reflecting genetic potential, nutrition, and housing conditions. Importantly, bulk tank studies demonstrate that higher-yielding herds often display better welfare indicators and improved udder hygiene [10], supporting the observed associations between productivity and welfare outcomes.
4.2. Associations Between Biomarkers and Welfare Indicators
This study revealed biologically meaningful associations between routinely collected milk biomarkers and animal-based welfare parameters, confirming their potential as non-invasive welfare indicators.
- Fat-to-protein ratio (FPR) and β-hydroxybutyrate (BHB): indicators of metabolic balance
Spearman correlations revealed that FPR was strongly associated with favourable welfare outcomes, including improved feeding, reduced prevalence of very lean cows and diarrhoea, and better human–animal interactions. These findings support earlier evidence that FPR reflects nutritional balance and energy status [55] and also align with recent studies linking balanced FPR with improved welfare and bulk milk quality [10]. The strong negative associations between FPR and lean body condition, diarrhoea, and mortality highlighted its value for capturing both metabolic adequacy and welfare resilience [5,7]. Within its physiological range, FPR indicates adequate energy supply relative to protein intake, thereby reducing the risk of negative energy balance and metabolic stress [6,56]. Our findings were in line with studies showing that optimal FPR is associated with enhanced rumination, locomotion, and behavioural signs of comfort [7,57], suggesting that FPR reflects not only metabolic status but also the capacity of cows to express positive affective states.
Higher BHB levels were associated with lower comfort around resting scores and increased integumentary lesions, dystocia, and injuries. These relationships reflect the physiological strain of negative energy balance [13,14]. Similarly, previous studies link elevated BHB to ketosis, displaced abomasum, and reduced body condition [58]. Notably, our results indicated that elevated BHB not only signals metabolic imbalance but also manifests in welfare outcomes observable at the herd level, such as reduced comfort and impaired behavioural expression. Together, FPR and BHB form a robust two-component system for measuring metabolic resilience and identifying herds at risk of multiple welfare challenges early in lactation [15,43].
- Indicators of udder health (SCC, DSCC, and lactose): connecting udder inflammation to welfare status
Both SCC and DSCC demonstrated wide-ranging associations with welfare outcomes. High SCC values were linked to mastitis, lameness, and dirtiness, while high DSCC was negatively related to positive QBA descriptors such as calmness, happiness, and sociability. These findings confirm the recognised role of SCC as a marker of intramammary infection [22,23] and highlight DSCC as a more sensitive tool for detecting subclinical udder infections [25,26]. Our results confirm that herds with elevated SCC/DSCC experienced wider welfare impairments, supporting evidence that mastitis exerts cumulative and prolonged negative effects on milk yield and lactose content [30].
The determined lactose values exhibited an inverse correlation with SCC and mastitis, consistent with the literature describing its decline during epithelial injury [30]. The positive association of lactose with “Good health”, absence of disease, and favourable emotional states (active, relaxed, lively) reinforced its value as a cost-effective, non-invasive biomarker for herd health and cow welfare [31,32]. More recently, lactose concentration has been directly correlated with calmer behavioural states and improved welfare, showing its role as both a physiological and behavioural indicator [35].
Together, SCC, DSCC, and lactose provide a comprehensive view of udder health by combining information on inflammatory burden, immune status, and secretory capacity, thereby improving the accuracy of welfare monitoring.
- Milk yield and total plate count (TPC): indicators of productivity and hygiene
Higher milk yield was positively associated with good housing, good health, comfort while resting, and ease of movement, whereas lower milk yield correlated with udder dirtiness, skin alterations, and moderate lameness. These results suggest that especially the high-yielding herds benefit from superior comfort and housing conditions [42,59]. Milk yield also showed positive correlations with behavioural indicators, such as calmness, contentment, and liveliness, indicating that productivity and welfare can be complementary outcomes of good management [39].
Although TPC did not show statistically significant correlations after FDR correction, its numerical associations with poor hygiene indicators (udder dirtiness, lying down collisions, ocular discharge) suggest that it remains a valuable metric for assessing milking hygiene [25]. Bulk tank TPC values exceeding 100,000 CFU/mL are widely recognised as evidence of deficiencies in teat preparation, bedding hygiene, or equipment maintenance [36]. While not a direct welfare indicator, TPC remains an important management parameter with indirect welfare implications.
- Milk urea nitrogen (MUN): a nutritional management metric
MUN did not show strong associations with welfare indicators but displayed a tendency to covariate with irritability and emotional reactivity, maintaining its potential to indicate protein–energy imbalance. High MUN commonly reflects excess rumen-degradable protein relative to fermentable energy [17,18], whereas very low MUN signals protein deficiency, which may compromise microbial protein synthesis [19]. These findings confirm that MUN is best interpreted as a nutritional management tool rather than a direct welfare indicator. Nonetheless, optimising MUN remains important for improving fertility, feed efficiency, and reducing nitrogen emissions [23,60].
Our results demonstrated that FPR, BHB, SCC, DSCC, lactose, and milk yield collectively offer a biologically meaningful, non-invasive framework for the dairy cows’ welfare assessment. These findings support the already present initiative of development of decision support tools that integrate biomarker data with housing, management, and behavioural monitoring to create early warning systems for welfare decline [10,43]. The strong associations observed between milk biomarkers and health, nutritional, and metabolic parameters are consistent with Glatz-Hoppe et al. [61], who reported that routine milk testing can predict the metabolic status and disease risk at the herd level. These findings also align with Linstädt et al. [62], whose systematic review confirmed the validity and practical applicability of ABMs and advocated their integration into standardised welfare protocols.
4.3. Multivariate Insights: PCA and Clustering
The PCA revealed three biologically meaningful axes: a health–hygiene axis (PC1), a socio-behavioural axis (PC2), and a metabolic stress axis (PC3). These results align with multivariate frameworks showing that welfare emerges from complex interactions between metabolic, clinical, and behavioural domains [40]. PC1 underscored the role of SCC and DSCC as key drivers of health-related welfare deficits, consistent with recent findings linking these markers to both mastitis and reduced milk quality [27,28]. PC2 highlighted the influence of stockmanship and behavioural expression, with positive affective states associated with balanced nutrition and good human–animal relationships [35,63]. PC3 captured the welfare costs of metabolic imbalance, confirming associations between BHB, hygiene deficits, and altered emotional reactivity [16,54].
Cluster analyses supported these dimensions, identifying three farm typologies: feeding–metabolic, behavioural–comfort, and clinical–hygiene risk. Such profiles mirror those reported in large-scale welfare monitoring projects [52,64] and in recent studies comparing bulk milk quality across welfare levels [10]. Hierarchical clustering further confirmed that milk biomarkers, behavioural indicators, and clinical traits co-vary, supporting the use of integrated monitoring frameworks [10,38].
Together, these multivariate results demonstrated that welfare cannot be explained by single parameters but emerges from interconnected biological and behavioural domains. Integrating milk biomarkers with animal-based indicators, therefore, offers a powerful contribution to modern precision livestock farming, enabling early detection of risks and benchmarking of herd welfare.
5. Conclusions
This study shows that routine milk biomarkers can serve as robust, non-invasive indicators of dairy cow welfare. Variability in metabolic traits, udder health, and hygiene was consistently linked to animal-based outcomes such as feeding status, comfort, disease, human–animal interactions, and emotional expression. Multivariate analyses further identified three coherent welfare domains (metabolic–nutritional balance, behavioural–comfort, and clinical–hygiene risk) that distinguished farm profiles. By integrating milk analysis into welfare monitoring, farmers and advisors can detect problems earlier, make evidence-based decisions, and strengthen both the sustainability and social acceptability of dairy production.
6. Limitations
This study has several limitations. The sample included 37 farms from a single geographical region of Romania, which may limit generalisation to other breeds, systems, or climates. The cross-sectional design identified associations but did not establish causal relationships between milk biomarkers and welfare outcomes. Longitudinal studies are needed to explore temporal dynamics. Although the Welfare Quality® protocol is comprehensive, it may not fully capture all behavioural or environmental dimensions. In addition, the relatively low variance explained by PCA suggests that unmeasured factors such as genetics, microclimates, or management practice also contributed. Although individual factors such as breed, lactation stage, parity, and diet were not directly controlled or explicitly modelled, their effects were inherently accounted for through herd-level averaging, as the unit of analysis was the farm.
7. Implications for Practice and Future Research
Despite its limitations, this study highlighted the value of milk biomarkers as integrative, non-invasive indicators of dairy cow welfare. Collecting milk individually from cows proved especially valuable, as it revealed within-herd variability that is often masked in bulk tank analyses. Incorporating routine milk analysis into monitoring frameworks could help farmers and veterinarians detect welfare risks earlier, reduce reliance on invasive or costly assessments, and support evidence-based management decisions. The combination of metabolic indicators (FPR, BHB, urea), udder health traits (SCC, DSCC, lactose), and hygiene measures (TPC) offers a multidimensional perspective that complements direct animal-based observations. From a practical standpoint, the adoption of in-line sensors and mid-infrared spectroscopy would allow continuous monitoring at both herd and individual levels, enabling faster responses to emerging welfare challenges. For future research, larger and more diverse datasets are needed to validate these associations across production systems, climates, and breeds. Longitudinal studies could clarify causal pathways linking metabolic imbalance, immune function, and behaviour. Moreover, integrating milk biomarkers with digital tools, such as behavioural sensors and machine learning algorithms, may facilitate predictive modelling of welfare risk. Embedding such approaches into certification schemes and policy frameworks could strengthen sustainable and socially acceptable milk production, ensuring benefits for farmers, animals, and consumers alike.
Supplementary Materials
The following supporting information can be downloaded at: https://www.mdpi.com/article/10.3390/ani15213202/s1, Figure S1: Scree plot from Principal Component Analysis (PCA). Eigenvalues are plotted against the number of components, showing the proportion of variance explained; Figure S2A: Evaluation of the optimal number of clusters for K-means analysis: Calinski–Harabasz index; Figure S2B: Evaluation of the optimal number of clusters for K-means analysis: average silhouette width; Figure S2C: Evaluation of the optimal number of clusters for K-means analysis: gap statistic.
Author Contributions
Conceptualisation, D.E.B. and S.P.; methodology, D.E.B., F.I.B., M.C. and S.P.; validation, D.E.B., A.B.P., S.M.M., E.A.L. and S.P.; formal analysis, E.A.L. and S.P.; investigation, D.E.B., F.I.B., M.C., A.B.P., S.M.M., E.A.L. and S.P.; data curation, D.E.B., M.C. and S.M.M.; writing—original draft preparation, D.E.B., E.A.L. and S.P.; writing—review and editing, D.E.B., F.I.B., A.B.P., E.A.L. and S.P.; supervision, S.P. All authors have read and agreed to the published version of the manuscript.
Funding
This research received no external funding.
Institutional Review Board Statement
Ethical review and approval were waived for this study because the animal welfare assessment protocol does not imply touching the animals, nor does it cause any stress to them. All procedures involving animals were conducted in accordance with the Romanian National Animal Protection Law (Law no. 138/2022) and EU Directive 2010/63/EU.
Informed Consent Statement
Written informed consent was obtained from the owner of the animals involved in this study.
Data Availability Statement
The original contributions presented in this study are included in the article/Supplementary Material. Further inquiries can be directed to the corresponding authors.
Conflicts of Interest
The authors declare no conflicts of interest.
References
- Biomarkers Definitions Working Group. Biomarkers and Surrogate Endpoints: Preferred Definitions and Conceptual Framework. Clin. Pharmacol. Ther. 2001, 69, 89–95. [Google Scholar] [CrossRef] [PubMed]
- Djokovic, R.; Cincovic, M.; Ilic, Z.; Kurcubic, V.; Andjelic, B.; Petrovic, M.; Lalic, N.; Jasovic, B. Relationships Between Contents of Biochemical Metabolites in Blood and Milk in Dairy Cows During Transition and Mid Lactation. Int. J. Appl. Res. Vet. Med. 2019, 17, 1–9. [Google Scholar]
- Liu, P.; He, B.X.; Yang, X.L.; Hou, X.L.; Han, J.B.; Han, Y.H.; Nie, P.; Deng, H.F.; Du, X.H. Bioactivity Evaluation of Certain Hepatic Enzymes in Blood Plasma and Milk of Holstein Cows. Pak. Vet. J. 2012, 32, 601–604. [Google Scholar]
- Andjelić, B.; Djoković, R.; Cincović, M.; Bogosavljević-Bošković, S.; Petrović, M.; Mladenović, J.; Čukić, A. Relationships between Milk and Blood Biochemical Parameters and Metabolic Status in Dairy Cows during Lactation. Metabolites 2022, 12, 733. [Google Scholar] [CrossRef]
- Cabezas-Garcia, E.H.; Gordon, A.W.; Mulligan, F.J.; Ferris, C.P. Revisiting the Relationships between Fat-to-Protein Ratio in Milk and Energy Balance in Dairy Cows of Different Parities, and at Different Stages of Lactation. Animals 2021, 11, 3256. [Google Scholar] [CrossRef]
- Zschiesche, M.; Mensching, A.; Sharifi, A.R.; Hummel, J. The Milk Fat-to-Protein Ratio as Indicator for Ruminal pH Parameters in Dairy Cows: A Meta-Analysis. Dairy 2020, 1, 259–268. [Google Scholar] [CrossRef]
- Antanaitis, R.; Džermeikaitė, K.; Januškevičius, V.; Šimonytė, I.; Baumgartner, W. In-Line Registered Milk Fat-to-Protein Ratio for the Assessment of Metabolic Status in Dairy Cows. Animals 2023, 13, 3293. [Google Scholar] [CrossRef]
- Antanaitis, R.; Džermeikaitė, K.; Krištolaitytė, J.; Ribelytė, I.; Bespalovaitė, A.; Bulvičiūtė, D.; Tolkačiovaitė, K.; Baumgartner, W. Impact of Heat Stress on the In-Line Registered Milk Fat-to-Protein Ratio and Metabolic Profile in Dairy Cows. Agriculture 2024, 14, 203. [Google Scholar] [CrossRef]
- Boonkum, W.; Teawyoneyong, W.; Chankitisakul, V.; Duangjinda, M.; Buaban, S. Impact of Heat Stress on Milk Yield, Milk Fat-to-Protein Ratio, and Conception Rate in Thai–Holstein Dairy Cattle: A Phenotypic and Genetic Perspective. Animals 2024, 14, 3026. [Google Scholar] [CrossRef]
- Sabbadin, S.; Magro, S.; Costa, A.; Lorenzi, V.; Fusi, F.; Bertocchi, L.; De Marchi, M. Bulk Milk Quality Differs across Welfare Levels in Italian Dairy Cattle Farms with Different Housing Systems. Ital. J. Anim. Sci. 2025, 24, 910–922. [Google Scholar] [CrossRef]
- Benedet, A.; Manuelian, C.L.; Zidi, A.; Penasa, M.; De Marchi, M. Invited review: β-hydroxybutyrate concentration in blood and milk and its associations with cow performance. Animal 2019, 13, 1676–1689. [Google Scholar] [CrossRef]
- Gross, J.J.; Bruckmaier, R.M. Review: Metabolic challenges in lactating dairy cows and their assessment via established and novel indicators in milk. Animal 2019, 13, s75–s81. [Google Scholar] [CrossRef] [PubMed]
- Renaud, D.L.; Kelton, D.F.; Duffield, T.F. Validation of a Test-Day Milk Test for β-Hydroxybutyrate for Identifying Cows with Hyperketonemia. J. Dairy Sci. 2019, 102, 1589–1593. [Google Scholar] [CrossRef] [PubMed]
- De Jong, E.; Rijpert-Duvivier, A.; Veldman, H.; Steeneveld, W.; Jorritsma, R. Milk β-Hydroxybutyrate Metrics and Its Consequences for Surveillance of Hyperketonaemia on Commercial Dairy Farms. Front. Vet. Sci. 2023, 10, 1272162. [Google Scholar] [CrossRef]
- Pralle, R.S.; White, H.M. Symposium Review: Big Data, Big Predictions: Utilizing Milk Fourier-Transform Infrared and Genomics to Improve Hyperketonemia Management. J. Dairy Sci. 2020, 103, 3867–3873. [Google Scholar] [CrossRef] [PubMed]
- Du, C.; Zhao, X.; Zhang, S.; Chu, C.; Zhang, X.; Teng, Z. Milk metabolite profiling of dairy cows as influenced by mastitis. Front. Vet. Sci. 2024, 11, 1475397. [Google Scholar] [CrossRef]
- Aguilar, M.; Hanigan, M.D.; Tucker, H.A.; Jones, B.L.; Garbade, S.K.; McGilliard, M.L.; Stallings, C.C.; Knowlton, K.F.; James, R.E. Cow and Herd Variation in Milk Urea Nitrogen Concentrations in Lactating Dairy Cattle. J. Dairy Sci. 2012, 95, 7261–7268. [Google Scholar] [CrossRef]
- Spek, J.W.; Dijkstra, J.; van Duinkerken, G.; Bannink, A. A Review of Factors Influencing Milk Urea Concentration and Its Relationship with Urinary Urea Excretion in Lactating Dairy Cattle. J. Agric. Sci. 2013, 151, 407–423. [Google Scholar] [CrossRef]
- Munyaneza, N.; Niyukuri, J.; Hachimi, Y.E. Milk Urea Nitrogen as an Indicator of Nitrogen Metabolism Efficiency in Dairy Cows: A Review. Theriogenol. Insight 2017, 7, 145–159. [Google Scholar] [CrossRef]
- Webb, E.C.; de Bruyn, E. Effects of Milk Urea Nitrogen (MUN) and Climatological Factors on Reproduction Efficiency of Holstein Friesian and Jersey Cows in the Subtropics. Animals 2021, 11, 3068. [Google Scholar] [CrossRef]
- Afshar, O.; Mohammadi, M.; Ghavi Hossein-Zadeh, N.; Salimi, A. Influence of Different Concentrations of Milk Urea Nitrogen on the Reproductive Performance of Holstein Cows. Trop. Anim. Health Prod. 2024, 56, 374. [Google Scholar] [CrossRef]
- Damm, M.; Holm, C.; Blaabjerg, M.; Bro, M.N.; Schwarz, D. Differential Somatic Cell Count—A Novel Method for Routine Mastitis Screening in the Frame of Dairy Herd Improvement Testing Programs. J. Dairy Sci. 2017, 100, 4926–4940. [Google Scholar] [CrossRef]
- Kirkeby, C.; Toft, N.; Schwarz, D.; Farre, M.; Nielsen, S.S.; Zervens, L.; Hechinger, S.; Halasa, T. Differential Somatic Cell Count as an Additional Indicator for Intramammary Infections in Dairy Cows. J. Dairy Sci. 2020, 103, 1759–1775. [Google Scholar] [CrossRef]
- Kirkeby, C.; Schwarz, D.; Denwood, M.; Farre, M.; Nielsen, S.S.; Gussmann, M.; Toft, N.; Halasa, T. Dynamics of Somatic Cell Count (SCC) and Differential SCC during and following Intramammary Infections. J. Dairy Sci. 2021, 104, 3427–3438. [Google Scholar] [CrossRef]
- Zecconi, A.; Vairani, D.; Cipolla, M.; Rizzi, N.; Zanini, L. Assessment of Subclinical Mastitis Diagnostic Accuracy by Differential Cell Count in Individual Cow Milk. Ital. J. Anim. Sci. 2019, 18, 460–465. [Google Scholar] [CrossRef]
- Zecconi, A.; Meroni, G.; Sora, V.; Mattina, R.; Cipolla, M.; Zanini, L. Total and Differential Cell Counts as a Tool to Identify Intramammary Infections in Cows after Calving. Animals 2021, 11, 727. [Google Scholar] [CrossRef] [PubMed]
- Pegolo, S.; Giannuzzi, D.; Bisutti, V.; Tessari, R.; Gelain, M.E.; Gallo, L.; Schiavon, S.; Tagliapietra, F.; Trevisi, E.; Ajmone Marsan, P.; et al. Associations between differential somatic cell count and milk yield, quality, and technological characteristics in Holstein cows. J. Dairy Sci. 2021, 104, 4822–4836. [Google Scholar] [CrossRef]
- Fonseca, L.F.L.; Kurban, G.; Roy, J.-P.; Santschi, D.E.; Molgat, J.-F.; Dufour, S. Usefulness of differential somatic cell count for udder health. J. Dairy Sci. 2025, in press. [Google Scholar] [CrossRef]
- Costa, A.; Lopez-Villalobos, N.; Sneddon, N.W.; Shalloo, L.; Franzoi, M.; De Marchi, M.; Penasa, M. Invited Review: Milk Lactose—Current Status and Future Challenges in Dairy Cattle. J. Dairy Sci. 2019, 102, 5883–5898. [Google Scholar] [CrossRef]
- Costa, A.; Bovenhuis, H.; Egger-Danner, C.; Fuerst-Waltl, B.; Boutinaud, M.; Guinard-Flament, J.; Obritzhauser, W.; Visentin, G.; Penasa, M. Mastitis Has a Cumulative and Lasting Effect on Milk Yield and Lactose Content in Dairy Cows. J. Dairy Sci. 2025, 108, 635–650. [Google Scholar] [CrossRef]
- Antanaitis, R.; Juozaitienė, V.; Jonike, V.; Baumgartner, W.; Paulauskas, A. Milk Lactose as a Biomarker of Subclinical Mastitis in Dairy Cows. Animals 2021, 11, 1736. [Google Scholar] [CrossRef]
- Televičius, M.; Juozaitiene, V.; Malašauskienė, D.; Antanaitis, R.; Rutkauskas, A.; Urbutis, M.; Baumgartner, W. Inline Milk Lactose Concentration as Biomarker of the Health Status and Reproductive Success in Dairy Cows. Agriculture 2021, 11, 38. [Google Scholar] [CrossRef]
- Kayano, M.; Itoh, M.; Kusaba, N.; Hayashiguchi, O.; Kida, K.; Tanaka, Y.; Kawamoto, K.; Gröhn, Y.T. Associations of the First Occurrence of Pathogen-Specific Clinical Mastitis with Milk Yield and Milk Composition in Dairy Cows. J. Dairy Res. 2018, 85, 309–316. [Google Scholar] [CrossRef] [PubMed]
- Džermeikaitė, K.; Krištolaitytė, J.; Anskienė, L.; Girdauskaitė, A.; Arlauskaitė, S.; Šertvytytė, G.; Lembovičiūtė, G.; Baumgartner, W.; Antanaitis, R. Milk Lactose and Inflammatory Marker Changes: Early Indicators of Metabolic and Inflammatory Stress in Early Lactation Dairy Cattle. Agriculture 2025, 15, 1205. [Google Scholar] [CrossRef]
- Antanaitis, R.; Džermeikaitė, K.; Krištolaitytė, J.; Girdauskaitė, A.; Arlauskaitė, S.; Tolkačiovaitė, K.; Baumgartner, W. The relation between milk lactose concentration and cow behaviour. Animals 2024, 14, 836. [Google Scholar] [CrossRef] [PubMed]
- Velthuis, A.G.J.; van Asseldonk, M.A.P.M. Process Audits versus Product Quality Monitoring of Bulk Milk. J. Dairy Sci. 2011, 94, 235–249. [Google Scholar] [CrossRef]
- Ginestreti, J.; Strano, R.M.; Lorenzi, V.; Fusi, F.; Angelucci, A.; Ferrara, G.; Galletti, G.; Bergagna, S.; Bolzoni, G.; Zanardi, G.; et al. Bulk Tank Milk Quality Data Is Unlikely to Give Useful Information about Dairy Cow Welfare at Herd Level. J. Dairy Res. 2020, 87, 208–211. [Google Scholar] [CrossRef]
- Stocco, G.; Penasa, M.; Cassandro, M.; De Marchi, M. Herd and animal factors affecting variability of somatic cell and bacterial counts in dairy cows. Animals 2022, 12, 45. [Google Scholar] [CrossRef]
- de Vries, M.; Bokkers, E.A.M.; van Schaik, G.; Engel, B.; Dijkstra, T.; de Boer, I.J.M. Exploring the Value of Routinely Collected Herd Data for Estimating Dairy Cattle Welfare. J. Dairy Sci. 2014, 97, 715–730. [Google Scholar] [CrossRef]
- de Vries, M.; Bokkers, E.A.M.; van Schaik, G.; Engel, B.; Dijkstra, T.; de Boer, I.J.M. Improving the Time Efficiency of Identifying Dairy Herds with Poorer Welfare in a Population. J. Dairy Sci. 2016, 99, 8282–8296. [Google Scholar] [CrossRef]
- Otten, N.D.; Rousing, T.; Houe, H.; Thomsen, P.T.; Sørensen, J.T. Comparison of Animal Welfare Indices in Dairy Herds Based on Different Sources of Data. Anim. Welf. 2016, 25, 207–215. [Google Scholar] [CrossRef]
- Coignard, M.; Guatteo, R.; Veissier, I.; Lehébel, A.; Hoogveld, C.; Mounier, L.; Bareille, N. Does Milk Yield Reflect the Level of Welfare in Dairy Herds? Vet. J. 2014, 199, 184–187. [Google Scholar] [CrossRef] [PubMed]
- Heirbaut, S.; Jing, X.P.; Stefańska, B.; Pruszyńska-Oszmałek, E.; Ampe, B.; Umstätter, C.; Vandaele, L.; Fievez, V. Combination of Milk Variables and On-Farm Data as an Improved Diagnostic Tool for Metabolic Status Evaluation in Dairy Cattle During the Transition Period. J. Dairy Sci. 2024, 107, 489–507. [Google Scholar] [CrossRef] [PubMed]
- Welfare Quality®. Welfare Quality® Assessment Protocol for Cattle; Welfare Quality Consortium: Lelystad, The Netherlands, 2009. [Google Scholar]
- INRAE. Welfare Quality® Scoring System. Available online: https://www1.clermont.inrae.fr/wq/?simu=on (accessed on 7 March 2025).
- The Parliament of Romania. Law no 138/2022 for amending supplementing Law no 205/2004 regarding the protection of animals. Monit. Of. 2022, 484, 2022. [Google Scholar]
- Jolliffe, I.T. Principal Component Analysis, 2nd ed.; Springer: New York, NY, USA, 2002. [Google Scholar]
- de Almeida, A.M.; Zachut, M.; Hernández-Castellano, L.E.; Šperanda, M.; Gabai, G.; Mobasheri, A. Biomarkers of Fitness and Welfare in Dairy Animals: Healthy Living. J. Dairy Res. 2019, 86, 379–387. [Google Scholar] [CrossRef]
- Kirchner, M.K.; Ferris, C.; Abecia, L.; Yanez-Ruiz, D.R.; Pop, S.; Voicu, I.; Dragomir, C.; Winckler, C. Welfare state of dairy cows in three European low-input and organic systems. Org. Agric. 2014, 4, 309–311. [Google Scholar] [CrossRef]
- Popescu, S.; Lazar, E.A.; Blaga Petrean, A.; Mitrănescu, E.; Hegedus, C.; Neagu, D. The main welfare issues of dairy cows in small farms from Romania. Rev. Rom. Med. Vet. 2024, 34, 53–58. [Google Scholar]
- Nielsen, B.H. Dirty cows: Influence of housing on the occurrence of cow cleanliness problems. Animal 2009, 3, 185–191. [Google Scholar] [CrossRef]
- Whay, H.R.; Main, D.C.J.; Green, L.E.; Webster, A.J.F. Assessment of the welfare of dairy cattle using animal-based measurements: Direct observations and investigation of farm records. Vet. Rec. 2003, 153, 197–202. [Google Scholar] [CrossRef]
- Bruijnis, M.R.; Hogeveen, H.; Stassen, E.N. Assessing economic consequences of foot disorders in dairy cattle using a dynamic stochastic simulation model. J. Dairy Sci. 2012, 95, 4862–4874. [Google Scholar] [CrossRef]
- Boissy, A.; Manteuffel, G.; Jensen, M.B.; Moe, R.O.; Spruijt, B.; Keeling, L.J.; Winckler, C.; Forkman, B.; Dimitrov, I.; Langbein, J.; et al. Assessment of positive emotions in animals to improve their welfare. Physiol. Behav. 2007, 92, 375–397. [Google Scholar] [CrossRef] [PubMed]
- Buttchereit, N.; Stamer, E.; Junge, W.; Thaller, G. Evaluation of five lactation curve models fitted for fat: Protein ratio of milk and daily energy balance. J. Dairy Sci. 2010, 93, 1702–1712. [Google Scholar] [CrossRef] [PubMed]
- Džermeikaitė, K.; Krištolaitytė, J.; Sutkevičienė, N.; Vilkonienė, T.; Vaičiulienė, G.; Rekešiūtė, A.; Girdauskaitė, A.; Arlauskaitė, S.; Bajcsy, Á.C.; Antanaitis, R. Relationships Among In-Line Milk Fat-to-Protein Ratio, Metabolic Profile, and Inflammatory Biomarkers During Early Stage of Lactation in Dairy Cows. Vet. Sci. 2025, 12, 187. [Google Scholar] [CrossRef] [PubMed]
- Toni, F.; Vincenti, L.; Grigoletto, L.; Ricci, A.; Schukken, Y.H. Early Lactation Ratio of Fat and Protein Percentage in Milk Is Associated with Health, Milk Production, and Survival. J. Dairy Sci. 2011, 94, 1772–1783. [Google Scholar] [CrossRef]
- Koeck, A.; Jamrozik, J.; Schenkel, F.S.; Moore, R.K.; Lefebvre, D.M.; Kelton, D.F.; Miglior, F. Genetic Analysis of Milk β-Hydroxybutyrate and Its Association with Fat-to-Protein Ratio, Body Condition Score, Clinical Ketosis, and Displaced Abomasum in Early First Lactation of Canadian Holsteins. J. Dairy Sci. 2014, 97, 7286–7292. [Google Scholar] [CrossRef]
- Beaver, A.; Proudfoot, K.L.; von Keyserlingk, M.A. Symposium Review: Considerations for the Future of Dairy Cattle Housing: An Animal Welfare Perspective. J. Dairy Sci. 2020, 103, 5746–5758. [Google Scholar] [CrossRef]
- Broderick, G.A.; Clayton, M.K. A Statistical Evaluation of Animal and Nutritional Factors Influencing Concentrations of Milk Urea Nitrogen. J. Dairy Sci. 1997, 80, 2964–2971. [Google Scholar] [CrossRef]
- Glatz-Hoppe, J.; Boldt, A.; Spiekers, H.; Mohr, E.; Losand, B. Relationship between Milk Constituents from Milk Testing and Health, Feeding, and Metabolic Data of Dairy Cows. J. Dairy Sci. 2020, 103, 10175–10194. [Google Scholar] [CrossRef]
- Linstädt, J.; Thöne-Reineke, C.; Merle, R. Animal-Based Welfare Indicators for Dairy Cows and Their Validity and Practicality: A Systematic Review of the Existing Literature. Front. Vet. Sci. 2024, 11, 1429097. [Google Scholar] [CrossRef]
- Hemsworth, P.H.; Coleman, G.J. Human–Livestock Interactions: The Stockperson and the Productivity and Welfare of Intensively Farmed Animals; CABI: Wallingford, UK, 2011. [Google Scholar] [CrossRef]
- EFSA (European Food Safety Authority). Scientific report on the effects of farming systems on dairy cow welfare disease. EFSA J. 2009, 1143, 1143r. [Google Scholar] [CrossRef]


Disclaimer/Publisher’s Note: The statements, opinions and data contained in all publications are solely those of the individual author(s) and contributor(s) and not of MDPI and/or the editor(s). MDPI and/or the editor(s) disclaim responsibility for any injury to people or property resulting from any ideas, methods, instructions or products referred to in the content. |
© 2025 by the authors. Licensee MDPI, Basel, Switzerland. This article is an open access article distributed under the terms and conditions of the Creative Commons Attribution (CC BY) license (https://creativecommons.org/licenses/by/4.0/).