Article

Whole-Genome Resequencing Identifies Candidate Genes for Tail Fat Deposition in Sheep

1
Biomedical Research Center, Northwest Minzu University, Lanzhou 730030, China
2
College of Veterinary Medicine, Gansu Agricultural University, Lanzhou 730070, China
3
College of Life Science and Engineering, Northwest Minzu University, Lanzhou 730030, China
4
Gansu Food Inspection Institute, Lanzhou 730030, China
5
Experiment Teaching Department, Northwest Minzu University, Lanzhou 730030, China
*
Authors to whom correspondence should be addressed.
Animals 2025, 15(20), 3046; https://doi.org/10.3390/ani15203046
Submission received: 12 August 2025 / Revised: 1 October 2025 / Accepted: 14 October 2025 / Published: 20 October 2025

Abstract

Simple Summary

It is evident that caudal fat deposition demonstrates considerable interbreed variation. The Lanzhou fat-tailed sheep, a Chinese indigenous long-fat-tailed breed, has experienced a precipitous decline in population due to urbanization and market-driven preference for lean meat. In contrast, the Hu sheep exhibits a short-fat-tailed phenotype. Even though a considerable number of studies have investigated selection signatures associated with ovine tail morphology, genomic research on long-fat-tailed breeds remains limited. In order to address this gap, whole-genome resequencing was employed in combination with FST, XP-EHH, and XP-CLR analyses. This was undertaken in order to identify selection signatures that differentiate long- and short-fat-tailed breeds. The present study has revealed DAB1 and GPC5 to be shared candidate genes, thus demonstrating their synergistic involvement in lipid metabolism regulation across both breeds.

Abstract

Excessive adipose tissue accumulation in sheep disrupts insulin signaling, inducing insulin resistance, and alters energy partitioning mechanisms. These changes adversely affect both ovine health and production efficiency. This study employed whole-genome resequencing to conduct selection signal analysis in long-fat-tailed (Lanzhou fat-tailed sheep) and short-fat-tailed (Hu sheep) breeds, investigating the genetic basis underlying divergent lipid metabolism-related traits between these distinct tail phenotypes. Fifteen healthy adult individuals, each from long-fat-tailed (Lanzhou Large-tailed sheep) and short-fat-tailed (Hu sheep) breeds, underwent whole-genome resequencing. Whole-genome resequencing analyses via FST, XP-CLR, and XP-EHH identified 75 significantly selected regions (p < 0.01), revealing eight key candidate genes (DAB1, DPP10, EPHA6, GPC5, KLF12, PAK7, PTPN3, TENM3). Subsequent functional enrichment analysis demonstrated significant enrichment of DAB1 and GPC5 in lipid metabolic processes (GO:0006629). Employing whole-genome resequencing-based selection signal analysis in long-fat-tailed (Lanzhou Large-tailed sheep) and short-fat-tailed (Hu sheep) breeds, this study identified two key lipid metabolism-associated genes (DAB1 and GPC5). These findings provide critical insights for conserving genetic resources and informing molecular breeding strategies targeting divergent tail phenotypes.

1. Introduction

In China, indigenous sheep breeds are classified into five categories based on tail morphology: short thin-tailed, long thin-tailed, short fat-tailed, long fat-tailed, and fat-rumped varieties [1,2,3]. Thin-tailed sheep represent the ancestral type, with fat-tailed breeds emerging later through natural and artificial selection [4,5,6]. Fat tails serve as energy reservoirs during periods of nutritional stress, particularly in arid or cold climates [1,5,6]. Historically, tail fat provided a critical food source, though modern dietary trends have reduced its desirability [7]. Additionally, excessive fat storage is now seen as metabolically costly in commercial sheep farming, reducing feed efficiency and potentially interfering with reproduction due to physical impediments during mating [8].
In indigenous Ethiopian sheep, there is a positive correlation between tail width and girth, and fat accumulation, indicating that breeds with longer tails and shorter tails tend to exhibit higher fat deposition levels [9,10,11]. Scholars have made significant advancements in multi-omics technology concerning sheep tail fat deposition. Genomic studies have identified crucial genes and quantitative trait loci (QTLs) linked to this process. Specifically, PDGF-D polymorphisms influence tail fat development by modulating transcription factor binding [1], while SREBF1/SREBF2 play a dominant role in lipid synthesis [12]. Additionally, IL-6 stimulates lipolysis via the TNF/MAPK signaling pathway [13], and SNPs of TRAPPC9 and BAIAP2 genes are associated with lipid storage efficiency [14,15]. Recent multi-omics studies have identified key genes and regulatory pathways (e.g., PPAR, AMPK/HIF-1) influencing tail fat deposition, including both protein-coding and non-coding RNAs [3,5,7,13,15,16,17].
The Lanzhou fat-tailed sheep (LLS), indigenous to Lanzhou City and adjacent loess plateau gully regions in Gansu Province, represents a distinctive Chinese long-fat-tailed breed. Its caudal adipose tissue constitutes 15–20% of body mass, serving as a critical energy reservoir [16,17]. The decline of the population size of LLS may be related to the decline of genetic diversity. It is therefore evident that genomic research provides a scientific basis for the protection of LLS, and that this in turn helps to formulate targeted conservation measures. Hu sheep (HS), an indigenous Chinese breed primarily distributed in the Taihu Lake basin of the Yangtze River Delta, is classified as a short-fat-tailed sheep variety [18]. Contemporary Chinese sheep production systems increasingly employ HS as the dam line in strategic crossbreeding with exotic meat breeds. As the preferred genotype for intensive commercial hybridization systems, HS contributes significantly to genetic improvement and productivity in China’s meat sheep sector.
Whole-genome resequencing (WGR) is a molecular biology technique considered efficient and accurate [19,20]. Research shows that systematically applied FST, XP-EHH, and XP-CLR analyses, thereby revealing genetic variations and selection signals associated with wool traits in long-fat-tailed sheep. The findings of the present study provide a valuable framework for the genetic improvement of ovine species [21]. Research shows that investigated the population genetic structure and selection signatures in long-fat-tailed sheep using FST and XP-CLR analyses. Integration of XP-EHH was utilized to assess genetic diversity in genomic regions, elucidating molecular mechanisms underlying adaptation to extreme environments in this breed [22]. Divergent selection between coarse-wool and fine-wool sheep breeds was assessed via XP-EHH, and targeted genes that significantly influence wool quality were identified, notably PRX (peroxidase) and TCF3 (hair follicle stem cell regulator) [23]. While genomic selection analyses have been widely applied in cattle and wool sheep, their use in understanding tail fat regulation in sheep remains limited. To address this, the study performed whole-genome resequencing on LLS and HS. Using FST, XP-EHH, and XP-CLR analyses, we identified genomic regions under selection in long- versus short-fat-tailed breeds. This approach sheds light on the gene regulatory mechanisms underlying fat deposition in fat-tailed sheep, providing a theoretical foundation and technical support for conserving genetic resources, improving breeds, and advancing molecular breeding.

2. Materials and Methods

2.1. Sample Collection

This study selected 15 healthy adult LLS, from the Taiji Town, Sanmatai Breeding Farm, Yongjing County, Gansu Province, China) and 15 HS (Hunan sheep, from the Purebred Hunan Sheep Breeding Farm, Minqin County, Gansu Province, China) sheep (Table 1). Blood was collected from the jugular vein of each sheep (2 mL), added to EDTA and stored at −20 °C for genomic DNA extraction. All animal experiments were approved by the Ethical Committee of Experimental Animal Center of Biomedical Research Center of Northwest Minzu University in compliance with the National Guidelines for Experimental Animal Welfare (Approval No. xbmu—sm—2025100, 11 August 2025).

2.2. DNA Extraction and Sequencing Library Construction

Total DNA was extracted from blood using a genomic DNA extraction kit (NMG0161, Naming Magnetism, Wuhan, China). The purity and concentration of the DNA were assessed with a Qubit 3.0 fluorometer (Invitrogen, Carlsbad, CA, USA). The integrity of the genomic DNA was evaluated through agarose gel electrophoresis. Sequencing was conducted by Wuhan Aiki Baike Biotechnology Co., Ltd. (Wuhan, China), utilizing the Illumina HiSeq 2500 platform (Illumina, San Diego, CA, USA) with a PE125 sequencing strategy at a depth of 10x. The raw sequencing reads were stored in FASTQ file format for subsequent analysis.

2.3. Quality Control and Comparison

The filtering steps were as follows: (1) reads containing junctions were removed, retaining only the remaining reads; (2) reads with an N proportion exceeding 10% were eliminated; (3) low-quality reads were discarded, defined as those where the number of bases with a quality value of Q ≤ 20 constituted more than 50% of the entire read. High-quality sequencing data were aligned to the sheep reference genome using the MEN algorithm of BWA (version 0.7.15), with the alignment parameter set to -k 32 -M. The alignment results in SAM format were converted to BAM format using SAMtools (Version: 1.3.1). Coverage was subsequently calculated using Bedtools (version 2.25.0) after marking duplicate reads with Picard (version 2.18.7) (http://sourceforge.net/projects/picard/ (accessed on 1 July 2025)). Variants were functionally annotated using ANNOVAR software 86 (version release of 16 April 2018). To enhance the accuracy of data analysis, raw SNPs were filtered, and the high-quality SNP markers that passed the filtering criteria were utilized for selection signal analysis. The filtering criteria included the removal of marker loci with a deletion rate greater than 20% and a minimum allele frequency (MAF) of no less than 5%.

2.4. Selection Signal Analysis

Selection signal analysis was conducted using three methods: FST, XP-CLR, and XP-EHH. Differences in allele frequencies between populations were calculated using the FST method, which identified regions subjected to selection among populations. Selection signals within populations were detected using the XP-CLR and XP-EHH methods to screen for gene regions under selection. XP-CLR is a linkage disequilibrium-based method for detecting selection signals that identifies genomic regions under selection by comparing differences in allele frequencies and linkage disequilibrium patterns across different populations. XP-EHH, on the other hand, is an extended haplotype-based method for detecting selection signals, which identifies gene regions under positive selection by analyzing the distribution of haplotypes within a population.

2.5. Detection and Annotation of Candidate Genes

The FST values calculated were statistically analyzed and Manhattan distribution plots were drawn. The top 1% SNPs were selected as selected loci. The selected loci were annotated using NCBI (National Center for Biotechnology Information) database and CSIRO database Ovis aries 3.1 genome database. The core SNP of the selection signal generation region was taken as the center, and the upstream and downstream were extended by 50 kb as the selection region, and the genes falling in this selection region were defined as the “candidate genes” of the selection signal. Analyzing the basic information of candidate genes, including gene location, encoded protein, involved biological process and molecular function, lays a foundation for further study of gene function and mechanism.

2.6. Candidate Gene Enrichment Analysis

Using DAVID v6.8 (Database for Annotation, Visualisation and Integrated Discovery https://davidbioinformatics.nih.gov/home.jsp (accessed on 17 October 2025) database, the candidate genes were subjected to GO (Gene-Ontology) functional enrichment analysis. GO (Gene Ontology) function enrichment analysis and KEGG (Kyoto Encyclopedia of Genes and Genomes) pathway analysis were performed on the candidate genes using DAVID v6.8 (Database for Annotation, Visualisation and Integrated Discovery) database. The GO functional enrichment analysis mainly includes three levels: molecular function, biological process and cellular component.

3. Results

3.1. Overview of Sequencing Data

In this study, the DNA samples of 15 LLS and 15 HS were sequenced and quality controlled. First, low-quality paired ends were removed, resulting in high-quality paired end reads from 30 samples with a mass of 97.85% for Q20 and 93.26% for Q30 bases (Table S1). A total of 414,823,855 SNPs were identified from the genome of 30 samples with an average sequencing depth of 10× for further analysis. After DNA sample sequencing and quality control in the early stage, 3294097496 and 4175193938 clean reads were obtained in the resequencing results of 15 LLS and 15 HS, respectively, for later mutation detection. After a series of alignment, mutation detection and quality control, 1,043,070 SNPs were identified on 26 autosomes +1 sex chromosome for further genomic genetic analysis.

3.2. Population Genetic Analysis

We conducted population genetic analysis of two groups (HS and LLS) using high-quality SNP data to understand the genetic relationships and differences between these groups. The PCA (principal component analysis) plot (Figure 1) shows that PC1 and PC2 explain 4.9% and 4.6% of the genetic variation, respectively. The plot illustrates the clustering of the two groups, with their distribution in genetic space being relatively close; among them, the HS and LLS groups form distinct clusters.

3.3. Identification of Signatures of Selection Between Long-Fat-Tailed and Short-Fat-Tailed Sheep Breeds Using FST Analysis

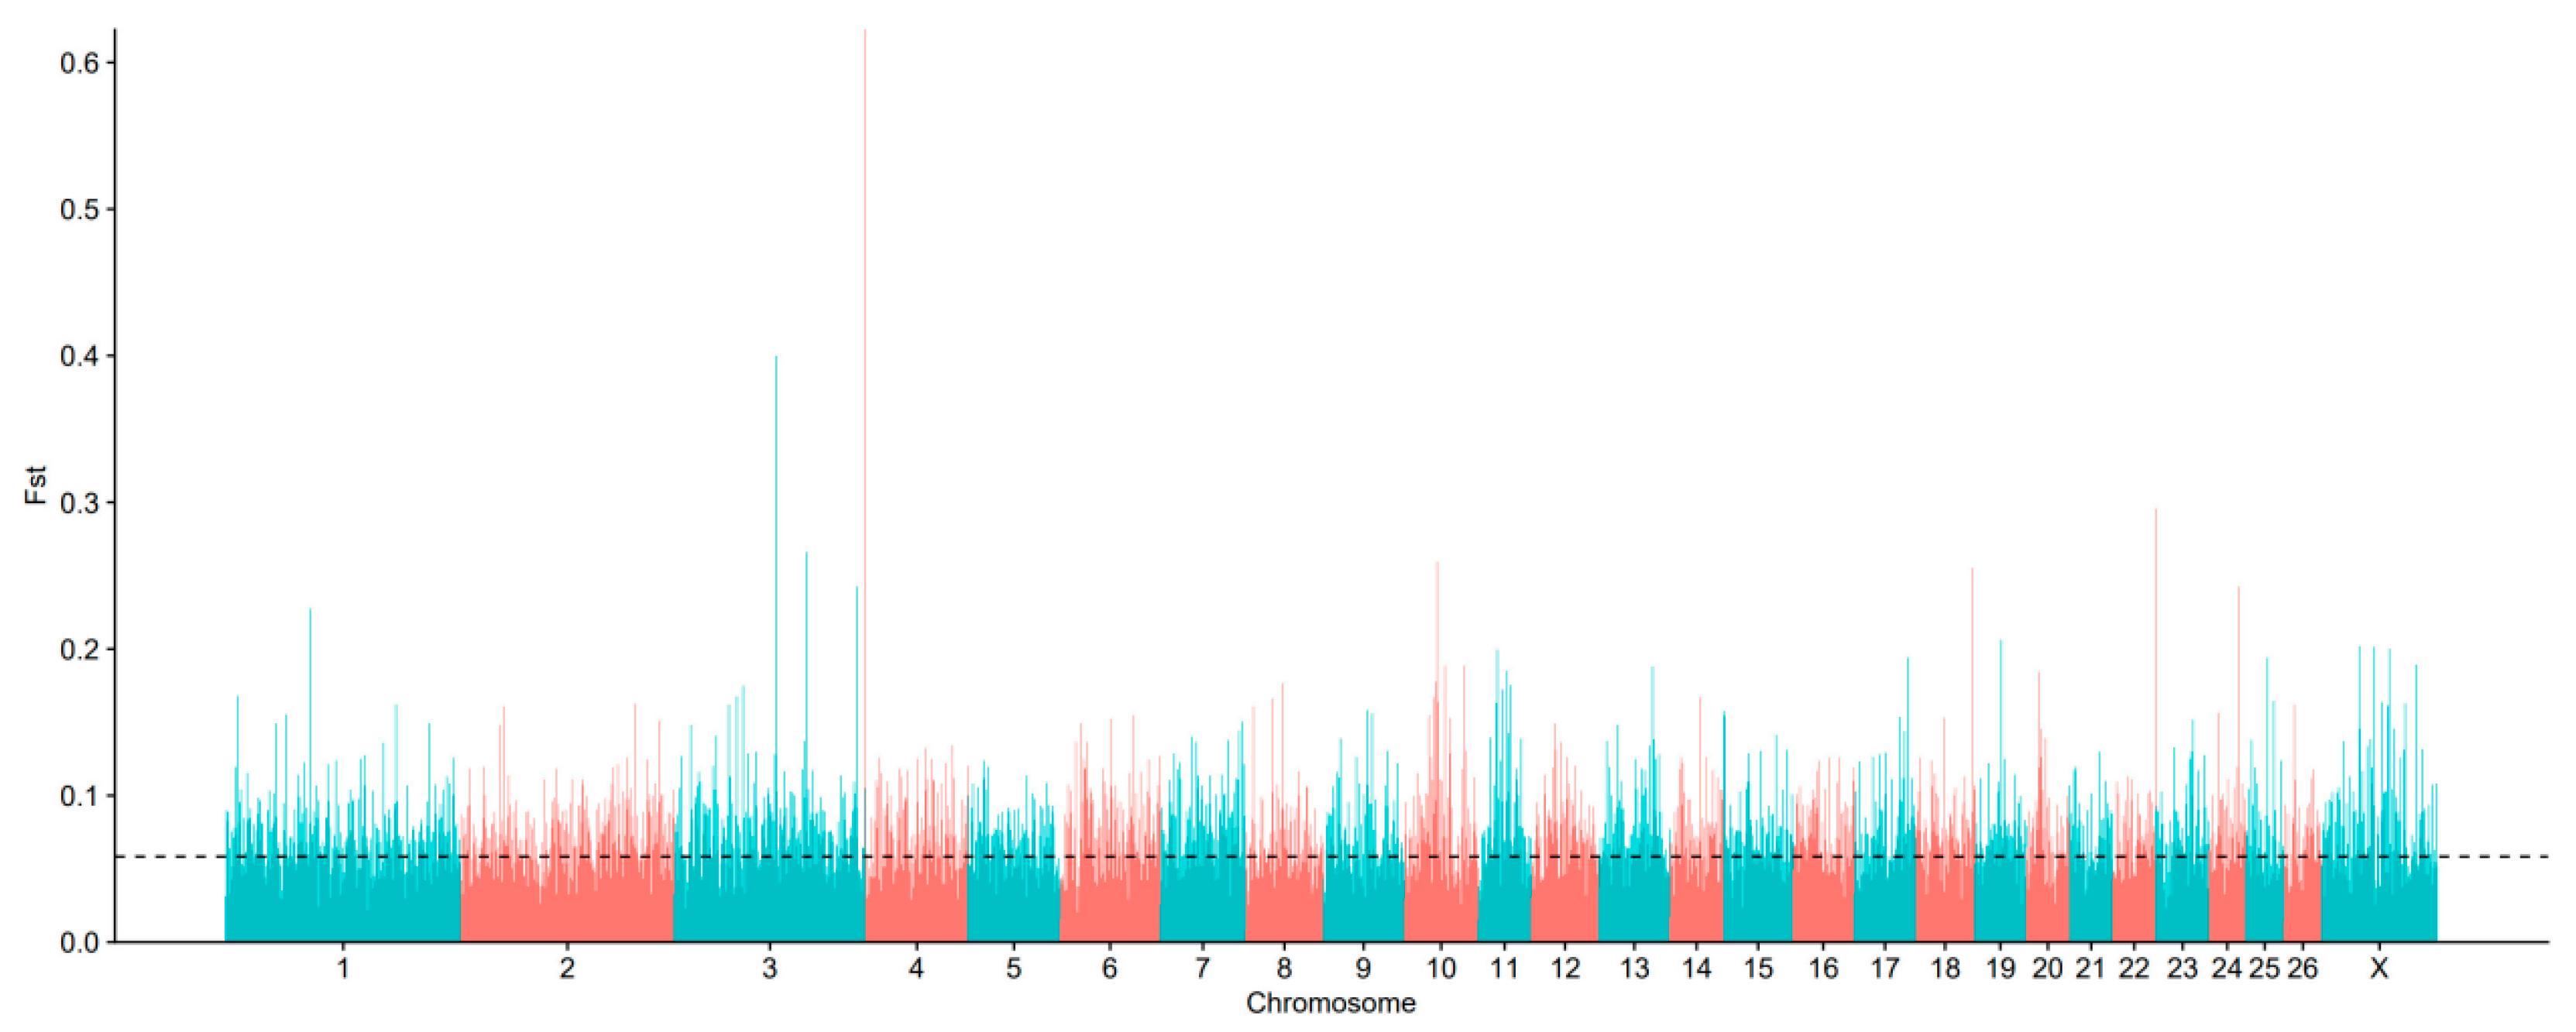
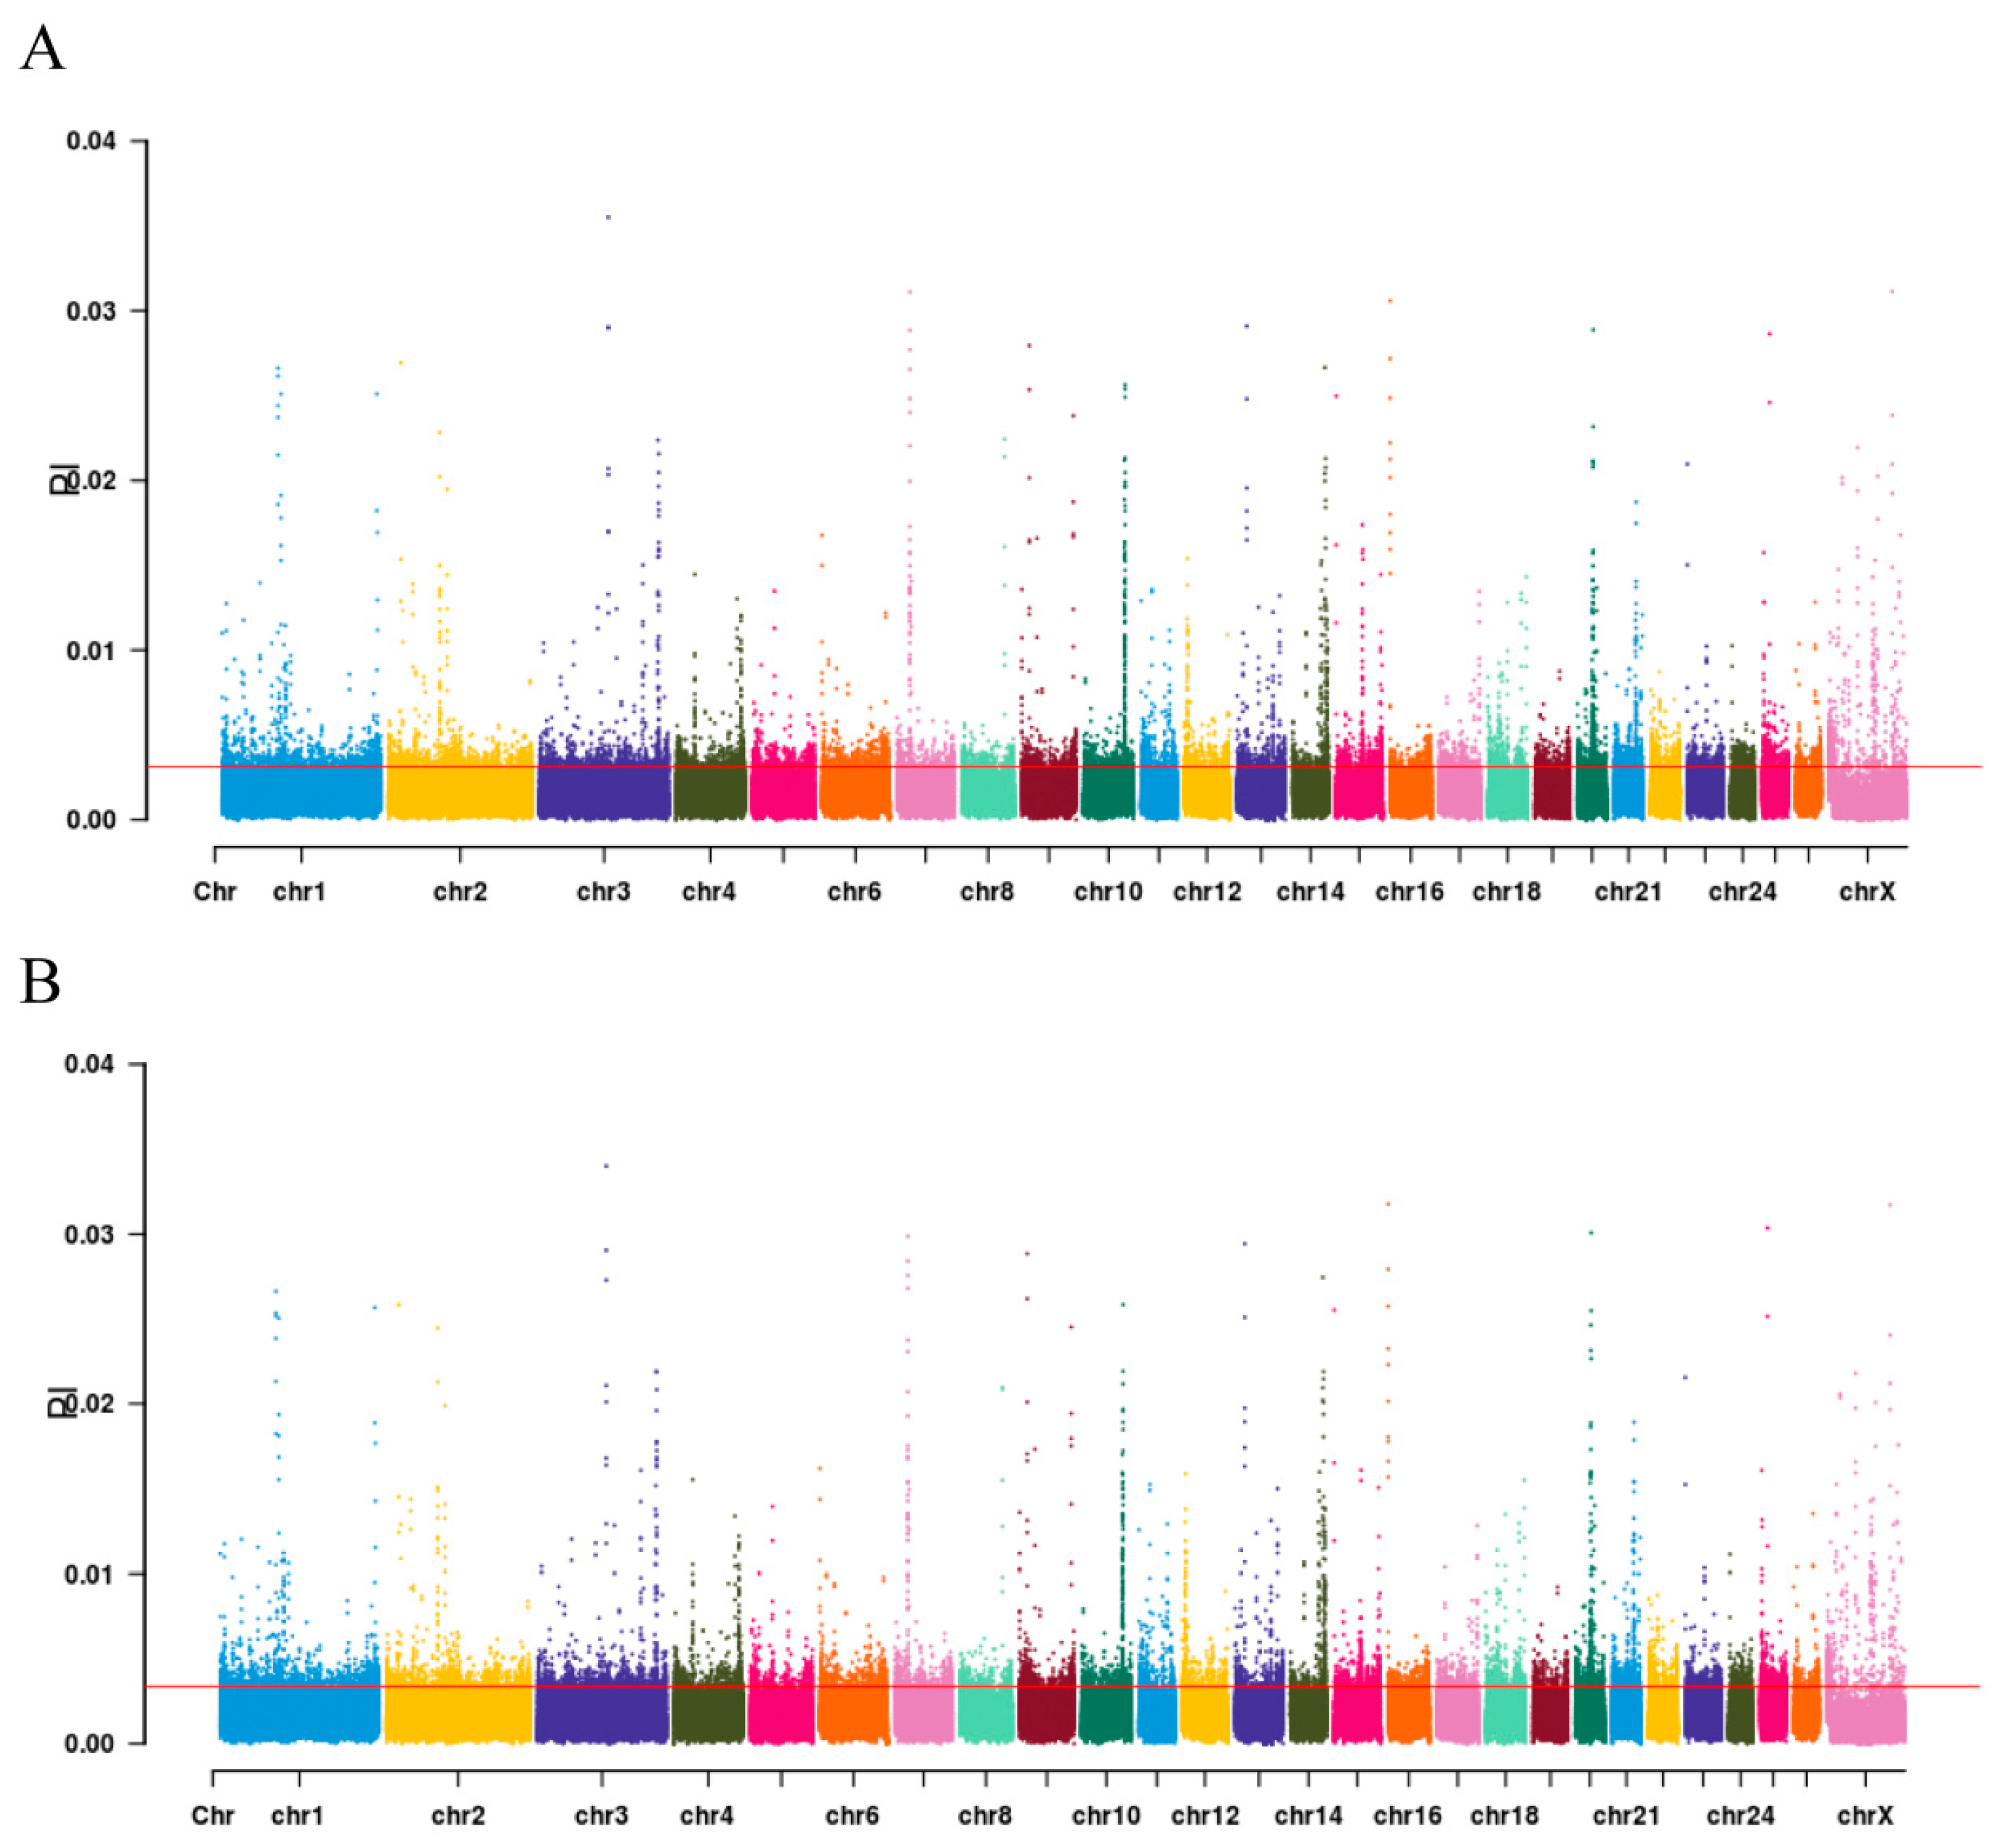
The objective of this study was to identify candidate genomic regions under selection for caudal fat deposition across divergent fat-tailed sheep phenotypes. To this end, this study employed FST-based selection scans, using the top 5% of FST values as the significance threshold. A total of 78,359,989 single-nucleotide polymorphisms (SNPs) were identified within genomic bins displaying significant population structure differentiation (FST) between LLS and HS populations. As illustrated in Figure 2, the genome-wide distribution of FST values demonstrates significant heterogeneity in FST frequency patterns across chromosomes. The highest FST frequencies were observed on chromosomes 1, 3, 4, 10, 18, 22, and 24, suggesting elevated homozygosity at allelic sites in these regions and potential strong positive selection. Selection peaks on chromosome 1, 3, 4, 10, 18, 22, and 24 coincide with genes implicated in adipogenesis in prior sheep studies. A selection peak on chromosome 1 encompasses the GLIS1 gene, a pro-adipogenic transcription factor that may promote preadipocyte accumulation and differentiation, thereby influencing caudal fat deposition. This finding aligns with the marked genetic differentiation observed between fat-tailed and thin-tailed sheep populations. Another prominent peak on chromosome 10 contains genes such as TBX15 and VRTN, which are associated with tail morphology and fat deposition. Genome-wide association studies (GWAS) have confirmed their significant links to tail phenotype traits in sheep. Additionally, selection signals on chromosomes 18 and 22 overlap with genes including JAZF1 and MC4R, both known to play important roles in lipid metabolism. JAZF1 modulates lipid deposition by regulating the expression of lipogenic enzymes such as FAS and ACC, while MC4R is involved in energy balance and adiposity. These results correspond closely with known quantitative trait loci (QTL) for traits such as “carcass fat percentage” on chromosomes 10 and 18, supporting the conserved and critical function of these genes in the genetic architecture of ovine tail fat. Biologically, many of these genes are implicated in core adipogenic pathways such as PPAR signaling and ECM-receptor interactions. For instance, both GLIS1 and JAZF1 contribute to enhanced caudal adiposity by regulating preadipocyte differentiation and lipid droplet formation. Cross-population comparisons with other sheep breeds, such as Mongolian sheep and Small-tailed Han sheep, further indicate that these selection signals are recurrent in fat-tailed populations, underscoring their potential as key genetic markers for tail fat deposition across diverse breeds. Figure 3 presents the results of the π-value analysis, which identified 3540 SNPs within the top 5% threshold. After annotation, 2654 candidate genes were obtained. The genes that are related to lipid metabolism include the following ALOX5 (Arachidonate 5-Lipoxygenase), ALDH1A2 (Aldehyde Dehydrogenase 1 Family Member A2), AHR (Aryl Hydrocarbon Receptor), APOA4 (Apolipoprotein A4), SREBF1 (Sterol Regulatory Element Binding Transcription Factor 1), LRRC16A (Leucine Rich Repeat Containing 16A), etc.

3.4. Identification of Signatures of Selection Between Long-Fat-Tailed and Short-Fat-Tailed Sheep Breeds Using XP-EHH Analysis

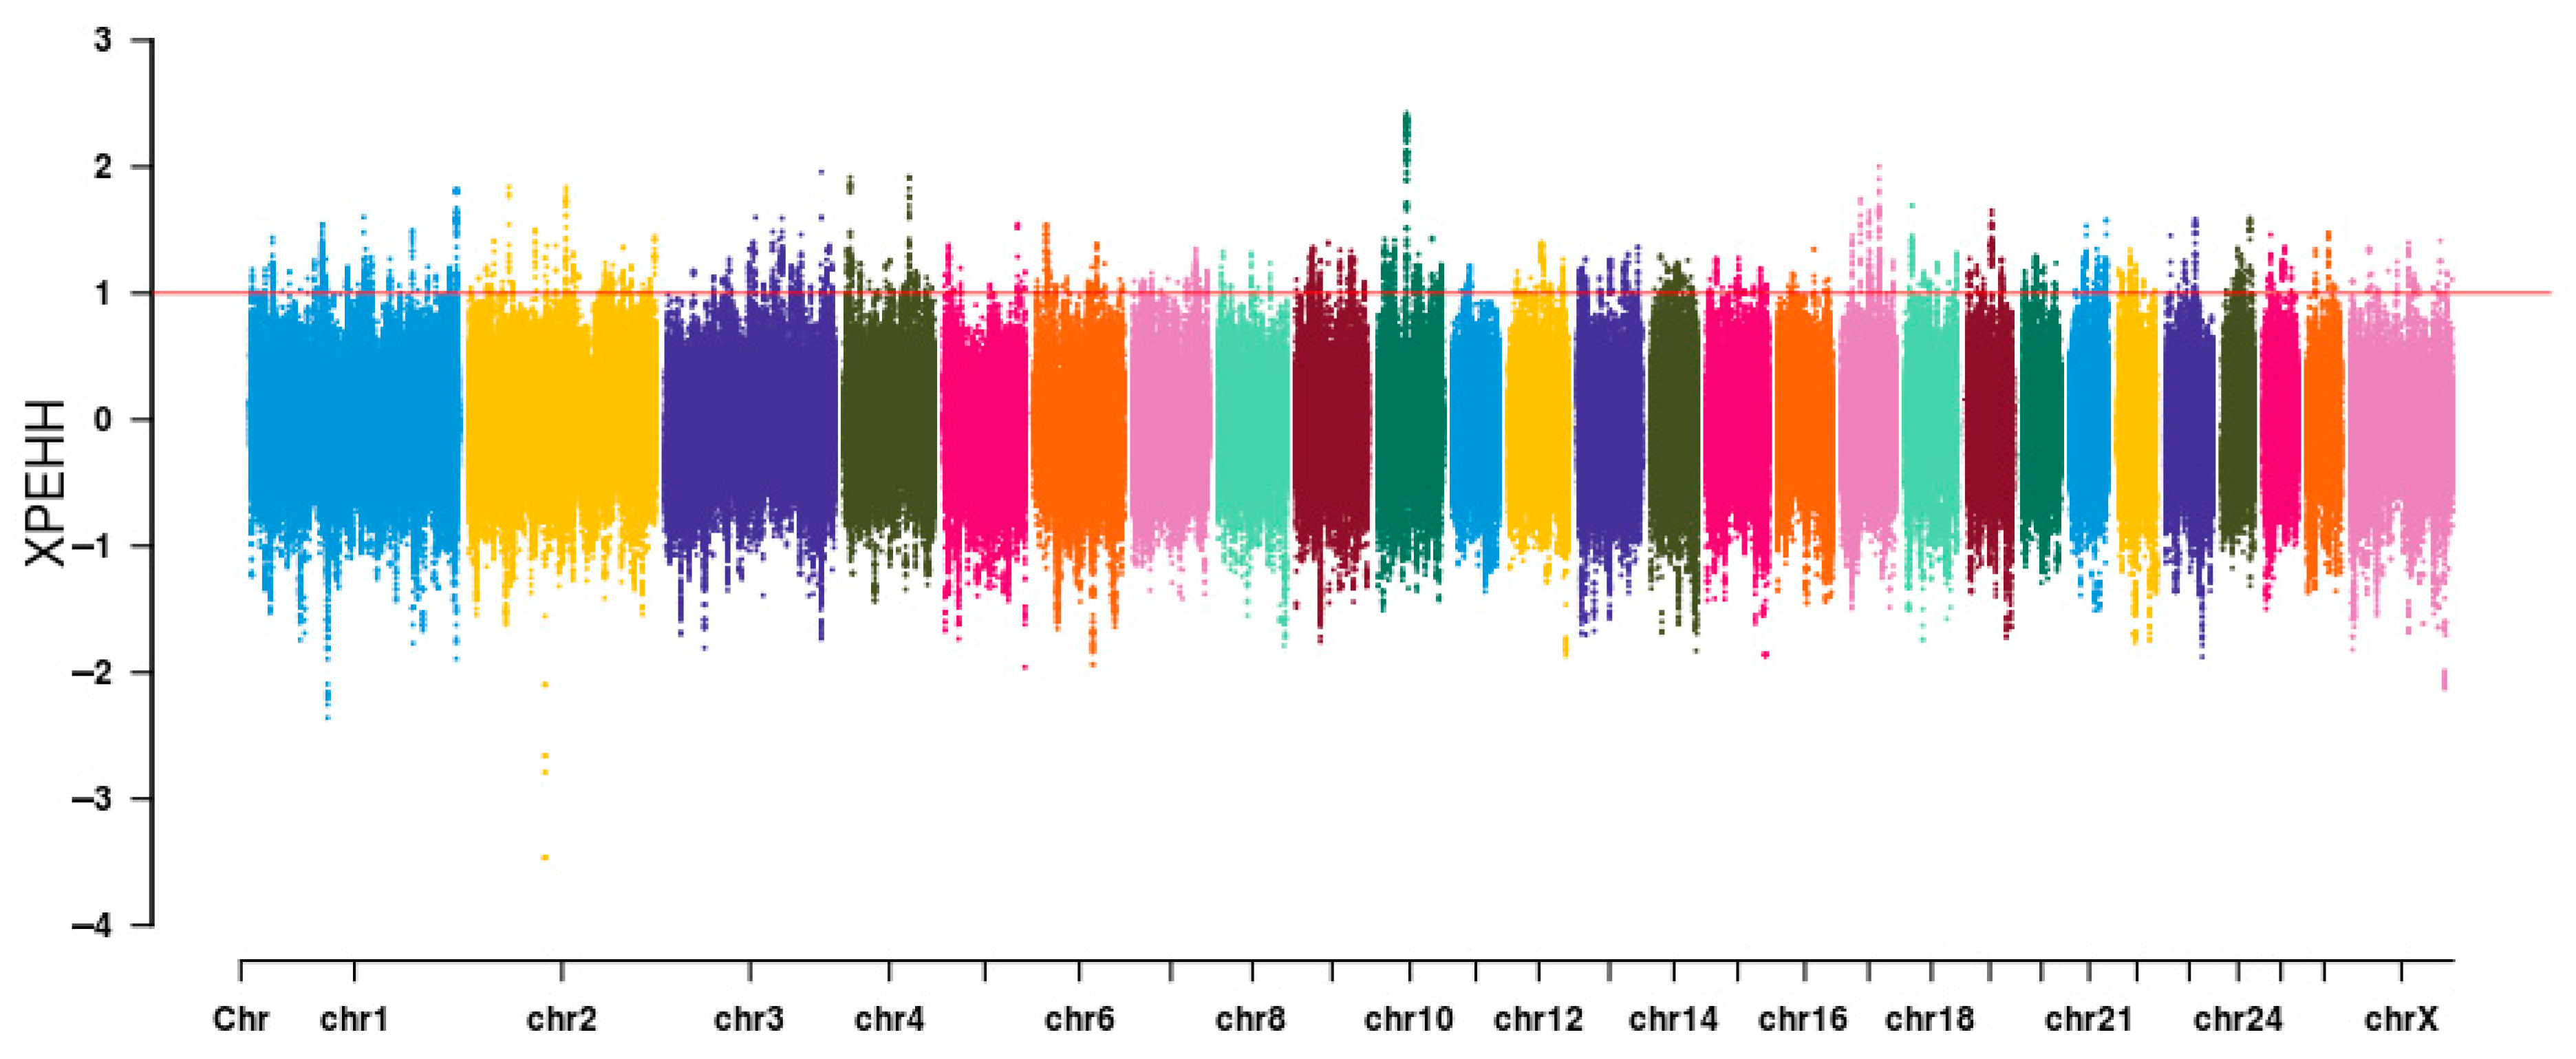
A comparative analysis was performed on the XP-EHH between the LLS and HS groups, which resulted in the identification of genomic regions that were associated with caudal fat deposition. Utilizing LLS as the test population and HS as the reference population, the selection signal analysis revealed distinct genomic signatures, as illustrated in Figure 4. SNPs with XP-EHH > 1 were designated as putatively selected variants, thereby identifying 4985 significant loci. After annotation, 231 candidate genes were obtained. The genes that are related to lipid metabolism include the following ABCB11 (ATP Binding Cassette Subfamily B Member 11), CASR (Calcium Sensing Receptor), TSHR (Thyroid Stimulating Hormone Receptor), SORBS1 (Sorbin and SH3 Domain Containing 1), CALCR (Calcitonin Receptor), GPR39 (G Protein-Coupled Receptor 39), etc. (Table 2).

3.5. Identification of Signatures of Selection Between Long-Fat-Tailed and Short-Fat-Tailed Sheep Breeds Using XP-CLR Analysis

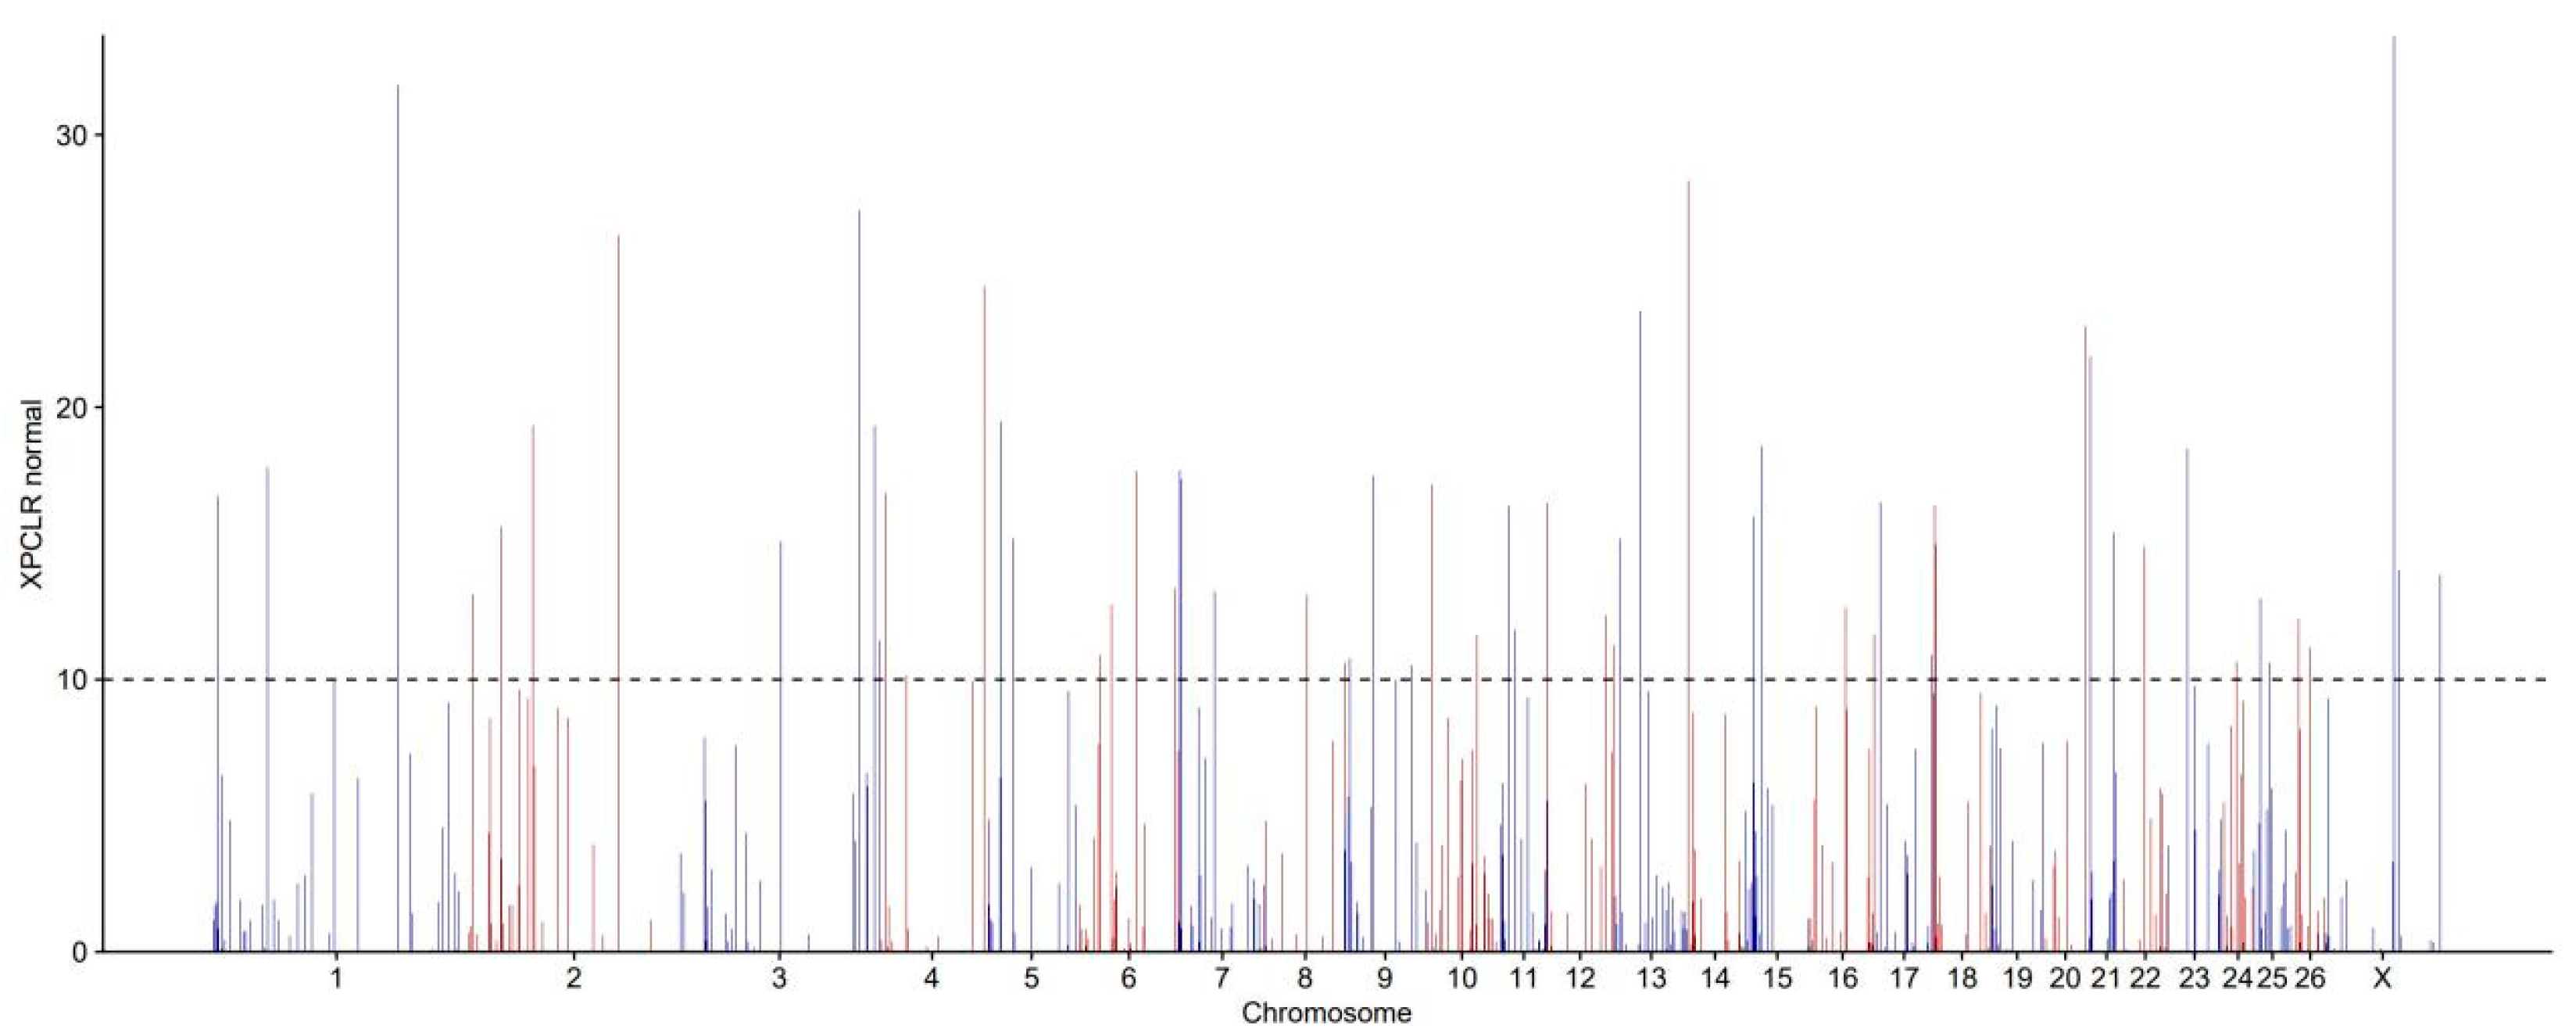
The employment of XP-CLR analysis of LLS and HS groups resulted in the identification of 648 sliding windows that were deemed to be under putative selection. As illustrated in Figure 5, the genome-wide distribution of maximum XP-CLR values per window across both populations is presented. Of the sliding windows analyzed, 41 windows with XP-CLR values greater than 10 were designated as putative candidate regions under positive selection (see Table 3). After annotation, 191 candidate genes were obtained. The genes that are related to lipid metabolism include the following ADCY2 (Adenylyl Cyclase 2), ITGA11 (Integrin Alpha 11), ACACA (Acetyl-CoA Carboxylase Alpha), PTPRD (Protein Tyrosine Phosphatase Receptor Type D), GPC5 (Glypican 5), etc.

3.6. Enrichment Analysis

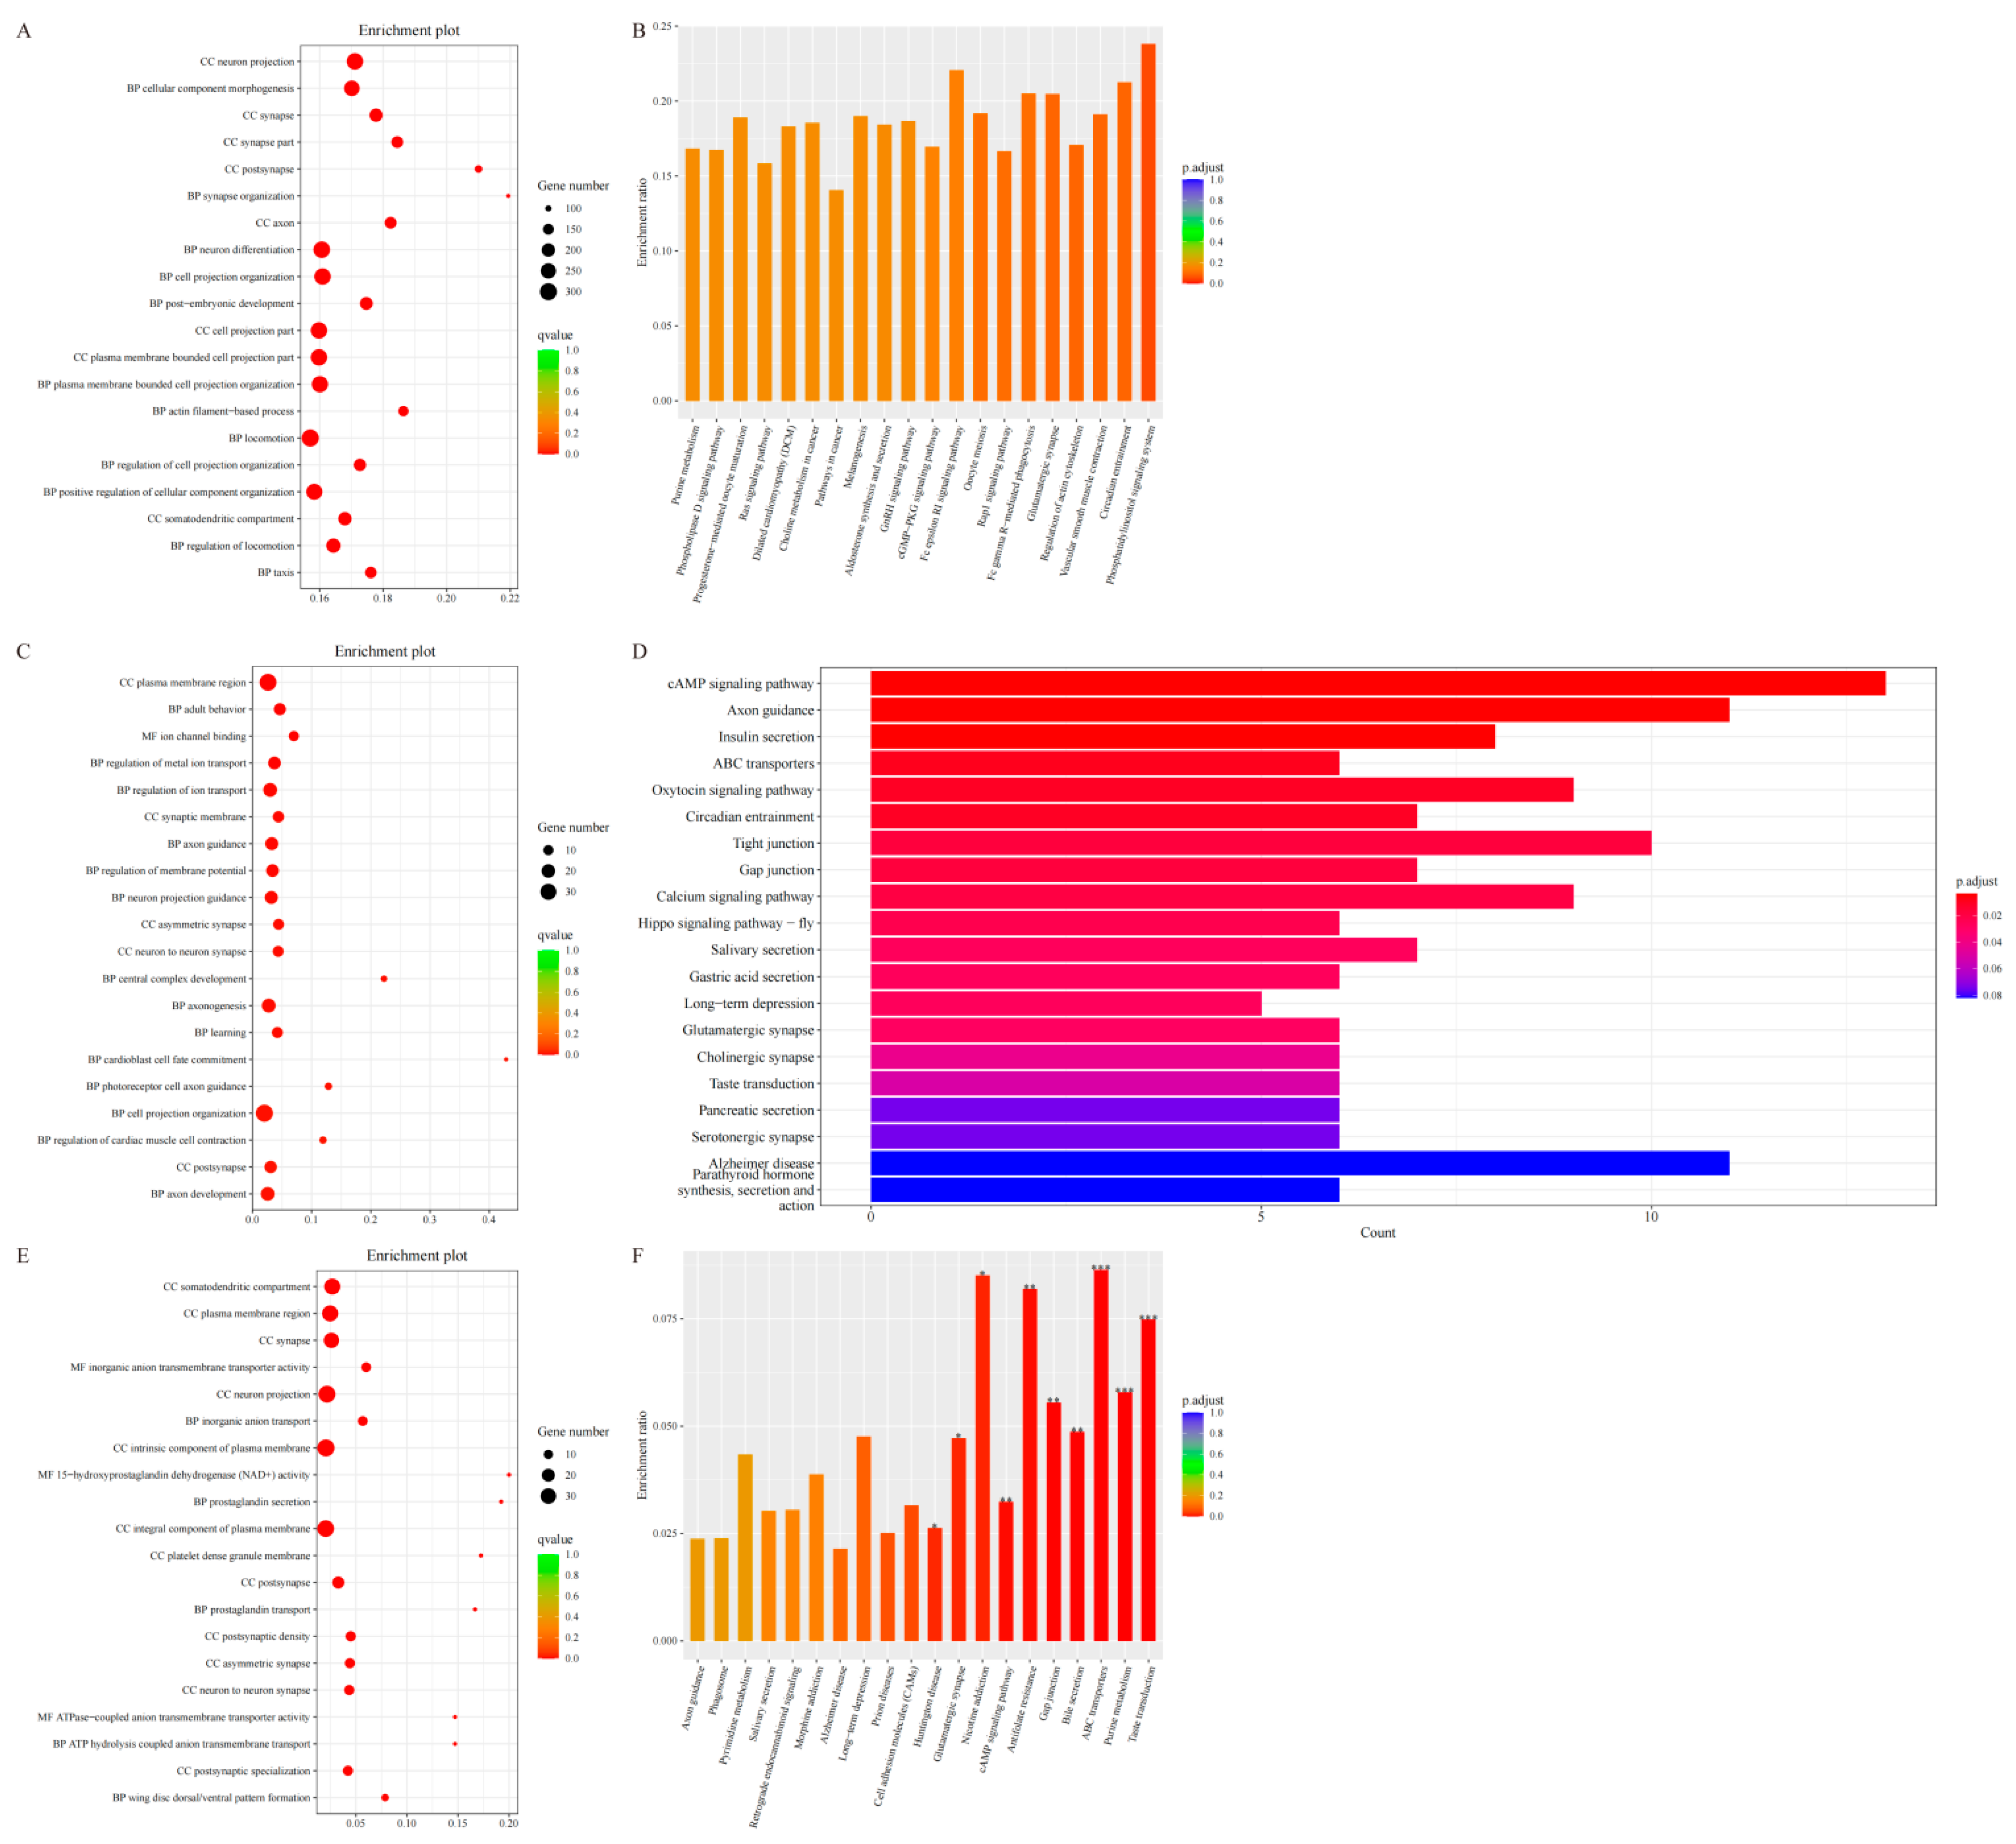
Significant enrichment analysis of the candidate genes in the LLS group identified 8662 Gene Ontology (GO) biological processes (BP), 1094 cellular components (CC), and 1827 molecular functions (MF) (Figure 6A), as well as 331 Kyoto Encyclopedia of Genes and Genomes (KEGG) pathways (Figure 6B). Integrating the GO and KEGG results subsequently revealed 35 pathways related to metabolism and lipid metabolism. These pathways encompass glycerolipid metabolism, cholesterol metabolism, fatty acid biosynthesis, and the AMPK signaling pathway. In the HS group, candidate genes were significantly enriched in 8786 biological processes (BP), 1052 cellular components (CC), and 1778 molecular functions (MF) (Figure 6C). KEGG enrichment analysis identified 333 significant pathways (Figure 6D). A subsequent investigation into the subject using functional enrichment analysis, based on GO and KEGG terms, identified 35 metabolic pathways associated with lipid metabolism. Of these, the AMPK signaling pathway was the most significantly enriched.
The FST analysis of the LLS-HS comparison identified 2654 genes under selection for enrichment analysis. These genes were significantly enriched across 29 molecular function (MF) categories, 310 biological process (BP) categories, and 65 cellular component (CC) categories (Figure 7A; Table S2). Prominent enrichments associated with lipid metabolism included the GO terms ‘lipid metabolic process’ (GO:0006629), ‘cellular lipid metabolic process’ (GO:0044255), ‘regulation of lipid biosynthesis’ (GO:0046889) and ‘regulation of lipid metabolic process’ (GO:0019216) (Figure 7B). Using XP-EHH analysis, we detected significant enrichment of candidate genes in 662 molecular functions, 3828 biological processes, and 468 cellular components (Figure 7C; Table S2). Prominent enrichments in lipid metabolism pathways included the peroxisome proliferator-activated receptor (PPAR) signaling pathway, bile secretion, linoleic acid metabolism, and adipocytokine signaling pathway (Figure 7D). Using the XP-CLR method, we identified candidate genes that were significantly enriched in 21 molecular functions, 31 biological processes, and 24 cellular components (Figure 7E; Table S2). Further KEGG analysis demonstrated the enrichment of these selected genes in 565 pathways, with a particular focus on lipid metabolism pathways, such as cAMP signaling, PPAR signaling, PI3K-Akt signaling, TGF-β signaling, AMPK signaling, and Wnt/β-catenin signaling (Figure 7F).

3.7. Shared Gene

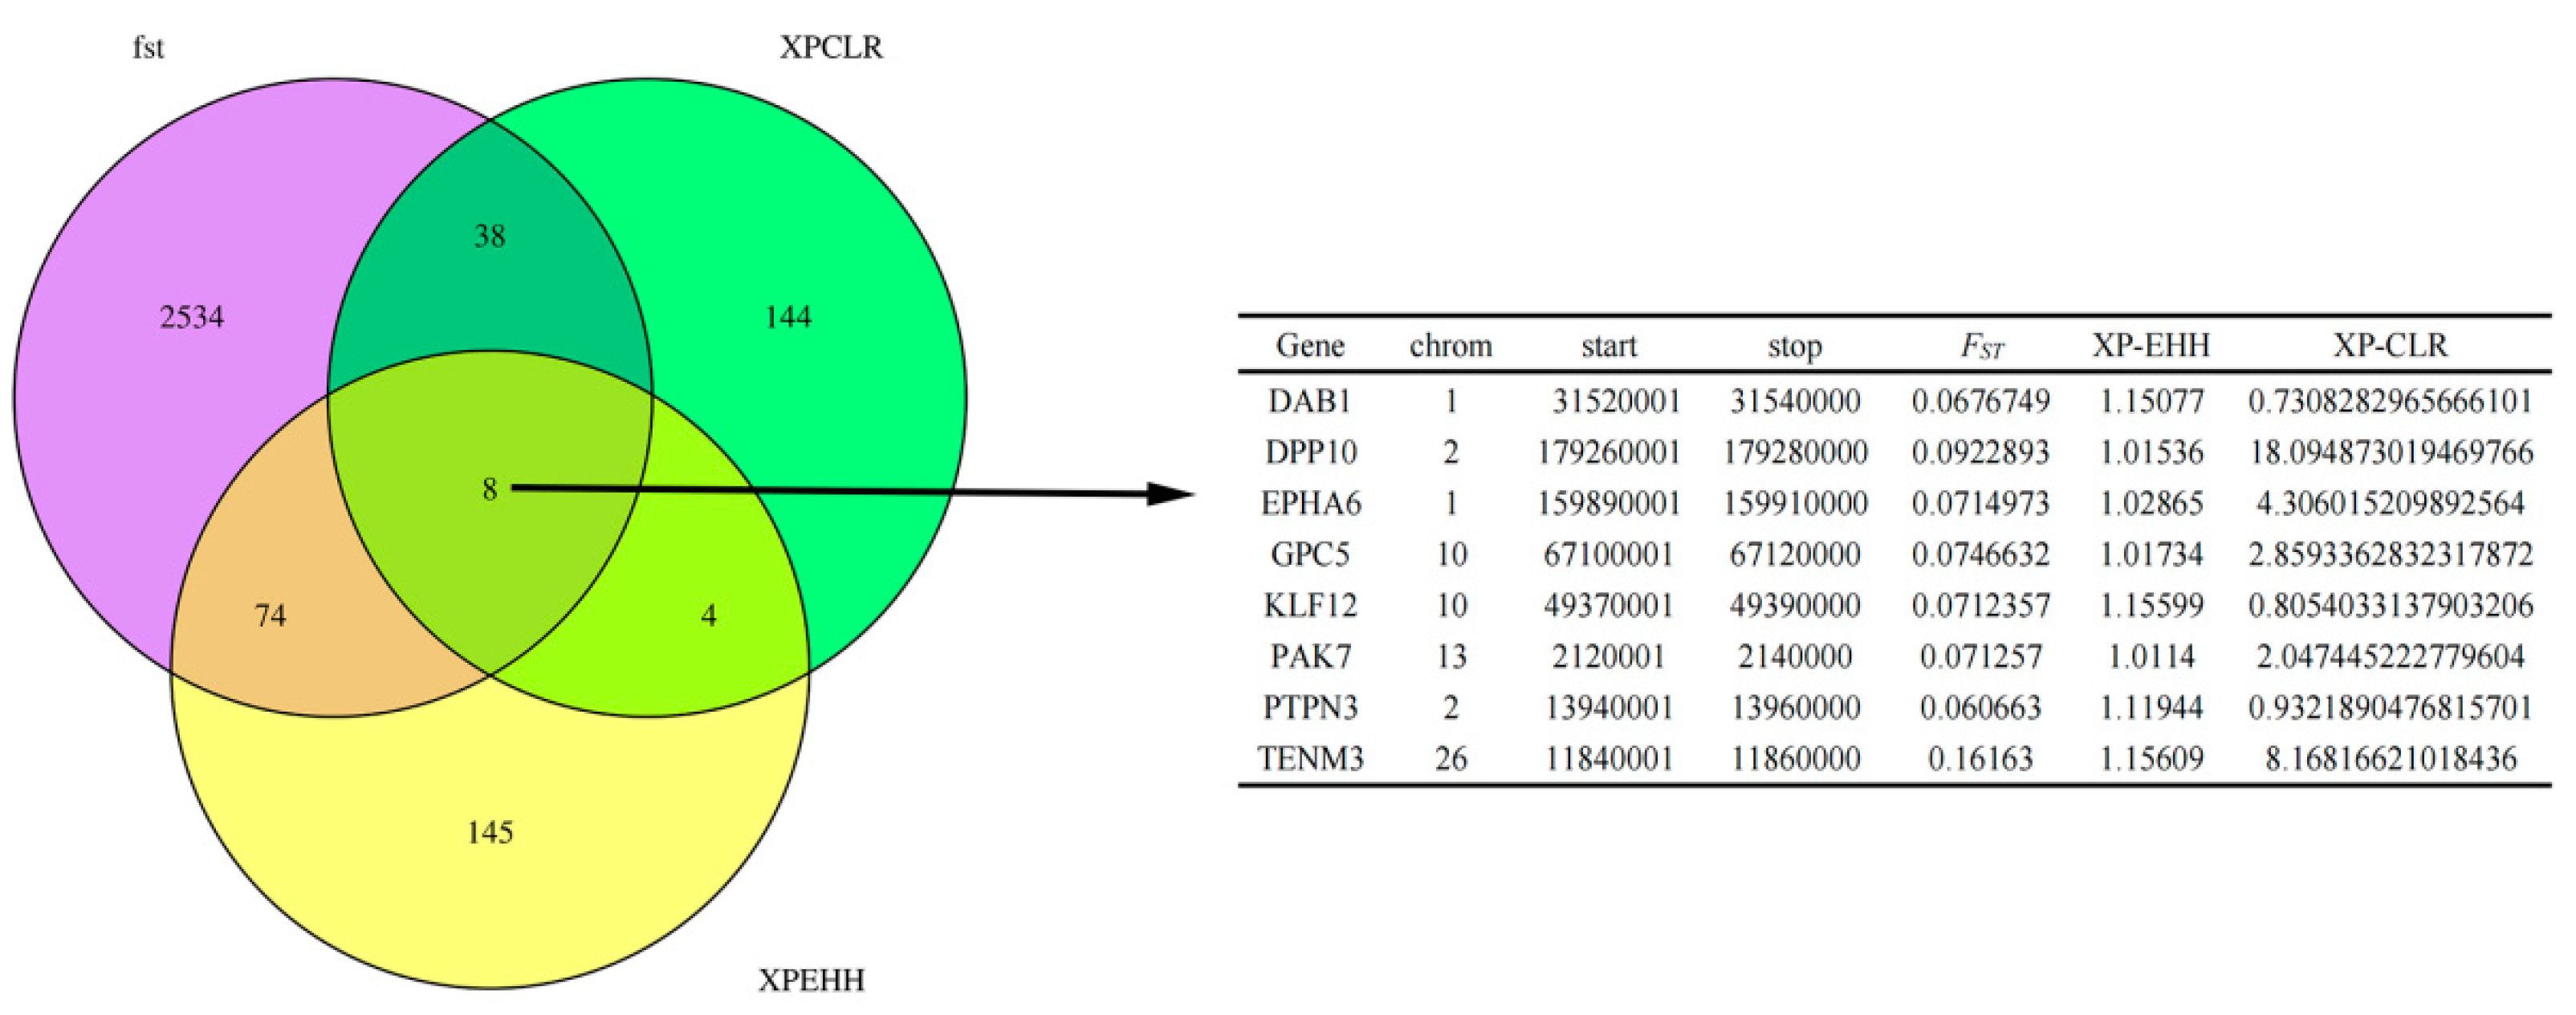
A Venn diagram analysis of the selection-related genomic regions identified in the LLS and HS populations, using the FST, XP-EHH, and XP-CLR methods, revealed substantial overlap. Specifically, 46 candidate genes were shared between FST and XP-CLR, while 82 were shared between FST and XP-EHH. There was minimal overlap between XP-EHH and XP-CLR, with only 12 genes shared between the two methods. Eight candidate genes were common to all three methods: DAB1 (Disabled 1 Adaptor Protein), DPP10 (Dipeptidyl Peptidase 10), EPHA6 (EPH Receptor A6), GPC5 (Glypican 5), KLF12 (Kruppel-Like Factor 12), PAK7 (p21-Activated Kinase 7), PTPN3 (Protein Tyrosine Phosphatase Non-Receptor Type 3), and TENM3 (Tenascin-M Like 3) (Figure 8). DAB1 promotes the differentiation of preadipocytes into mature adipocytes by activating the P13K-AKT pathway, which phosphorylates and inhibits GSK3β (glycogen synthase kinase 3β), thereby relieving GSK3β-mediated suppression of PPARγ—a master regulator of adipogenesis. Moreover, DAB1 suppresses the NF-κB signaling pathway, reducing the secretion of pro-inflammatory cytokines such as TNF-α and IL-6 in adipose tissue, thus preventing inflammation-driven aberrant lipid accumulation. DPP10 binds to β-adrenergic receptors on adipocyte membranes, inhibiting epinephrine-induced cAMP-PKA signaling. This suppression reduces phosphorylation of HSL (hormone-sensitive lipase), a key enzyme in triglyceride hydrolysis. Consequently, lipolysis is impaired, promoting triglyceride storage. Overexpression of DPP10 in human adipocytes has been shown to reduce lipolysis rates by 25–30%. EPHA6, upon binding its ligand Ephrin-A1, activates the Ras-MAPK pathway and facilitates directed migration of preadipocytes. Its expression is negatively correlated with wool fiber diameter; individuals with higher EPHA6 expression produce finer wool fibers. GPC5 expression influences energy partitioning in sheep: high expression promotes the conversion of excess energy into caudal fat under high-calorie diets, whereas low expression favors muscle growth. This makes GPC5 a potential molecular marker for selecting between fat- and meat-oriented breeding strategies. KLF12 is more highly expressed in visceral fat than in caudal fat and may inhibit visceral lipid synthesis, preventing excessive ectopic fat deposition. PAK7 is expressed in the liver, muscle, and adipose tissues of sheep, and its expression level is positively correlated with daily weight gain. Studies of Tan sheep showed that individuals with high PAK7 expression exhibited 15–20% higher average daily gain and improved feed efficiency. Under different nutritional regimens, PTPN3 expression is upregulated in ovine adipose tissue during high-energy intake, possibly attenuating insulin signaling to prevent excessive fat deposition. Conversely, aberrant PTPN3 expression is associated with insulin resistance and reduced caudal fat accumulation. TENM3 is highly expressed in the outer root sheath of sheep hair follicles. It regulates extracellular matrix (ECM) remodeling, influencing hair shaft growth and structure. In Merino sheep, TENM3 expression is positively correlated with wool fiber strength, with higher expression resulting in greater resistance to breakage. Identified genes such as PPARγ and GPC5 can serve as targets for marker-assisted selection to preserve fat-tail traits in LLS.

4. Discussion

Through whole-genome resequencing analysis, substantial genetic divergence was revealed between Lanzhou Fat-Tailed sheep and Hu sheep. Selection signature analyses—including FST, XP-EHH, and XP-CLR, detected signals of selection across multiple genomic regions associated with biological processes such as growth and development, metabolic regulation, and immune response [24,25]. For instance, putatively selected genes related to lipid metabolism and meat quality (e.g., those involved in AMPK and PPAR signaling pathways) were identified in LLS, consistent with its dual-purpose meat-and-fat characteristics [26]. In contrast, HS exhibited significant selection signals near genes influencing reproductive performance (e.g., BMPR1B), supporting its genetic propensity for high fecundity. These findings illuminate the genetic mechanisms underlying environmental adaptation and trait selection in distinct sheep breeds [27].
While PCA was performed, the limited sample size (n = 15 per group) constrained robust population structure inference. Therefore, some detected selection signals may be influenced by residual population stratification or genetic drift. These limitations are acknowledged and will be addressed in future studies using larger cohorts and replication analyses.
Population genetic analyses revealed significant selection signals in the DAB1 gene region between Lanzhou Fat-Tailed sheep and Hu sheep. DAB1, a key adaptor protein in the Reelin signaling pathway, mediates neuronal migration termination through tyrosine phosphorylation and regulates cortical laminar organization and synaptogenesis. Its functions are primarily associated with neural development, with no established direct link to fat deposition [27,28]. GPC5, a heparan sulfate proteoglycan, negatively regulates adipogenesis by competitively binding Wnt3a and inhibiting β-catenin nuclear translocation [29]. In Lanzhou Fat-Tailed sheep, methylation analysis showed hypermethylation in exonic regions of GPC5, potentially reducing its expression by inhibiting transcriptional elongation and thereby promoting fat deposition [30]. KLF12 acts as a key negative regulator of adipogenesis by directly binding to the PPARγ promoter and suppressing its transcription. PAK7, a member of the p21-activated kinase family, promotes cell invasion in gastric and osteosarcoma contexts via the Rac1/Cdc42 pathway. Although no direct association with fat deposition has been reported, hypomethylation in the PAK7 promoter region may enhance its transcriptional activity. Notably, a high observed heterozygosity (Ho = 0.692) at this locus in the Hu sheep population suggests balancing selection, potentially related to reproductive or immune adaptation [31,32].
Cross-population selection analysis (FST/XP-EHH/XP-CLR) revealed eight genes to be shared by Lanzhou fat-tailed sheep and Hu sheep. Functional enrichment analysis (GO/KEGG) revealed that DAB1 and GPC5 exhibit unique synergistic potential in regulating lipid metabolism by modulating lipid synthase activity, adipogenic differentiation pathways, and fatty acid metabolism gene networks simultaneously.
The phosphotyrosine-binding (PTB) domain of the DAB1 gene specifically recognizes the head group of phosphatidylinositol 4,5-bisphosphate (PtdIns(4,5)P2) via its positively charged surface region and interacts with receptors such as ApoER2 and VLDLR, thereby participating in phosphorylation events within the Reelin signaling pathway [33,34,35]. Mutations in the lipid-binding site of this domain markedly impair DAB1 localization to the plasma membrane and inhibit activation of the downstream PI3K/Akt pathway [33,34]. Transcriptomic studies in fat-tailed sheep breeds have identified DAB1 as a candidate gene linked to lipid metabolism, potentially promoting adipogenesis through the PI3K/AKT signaling pathway, with a likely role in regulating caudal fat deposition [36]. Impaired membrane localization of mutated DAB1 suppresses PI3K/AKT signaling and disrupts lipid metabolism. Upon phosphorylation, DAB1 activates PI3K, leading to Akt activation, which enhances lipogenic enzyme activity via GSK3β inhibition, thereby promoting lipid storage [33,37,38]. Furthermore, DAB1 regulates cell migration through the Crk/C3G/Rap1 pathway, which may influence the positioning and differentiation of adipocyte precursors and contribute to the development and morphological patterning of caudal adipose tissue [33,39]. In summary, DAB1 is regarded as a key lipid metabolism-associated gene in sheep, particularly in the regulation of tail fat phenotypes in fat-tailed breeds [36].
GPC5, a heparan sulfate proteoglycan (HSPG), competitively binds to Wnt3a and inhibits β-catenin nuclear translocation, thereby downregulating the expression of adipogenic genes such as PPARγ and C/EBPα and ultimately suppressing adipocyte differentiation [40,41]. In ovine caudal adipose tissue, elevated GPC5 expression is closely associated with PPARγ signaling enrichment and may influence lipid deposition by modulating PPARγ target genes such as FABP4 and ADIPOQ, suggesting a potential regulatory role in tail fat accumulation [6,42,43]. Furthermore, GPC5 may contribute to lipid droplet stability and suppress lipolysis by influencing the function of Perilipin family proteins, including Plin5. Plin5 inhibits lipolysis by binding to the ATGL/CGI-58 complex, thereby reducing free fatty acid release and alleviating lipotoxicity, which helps maintain adipose tissue homeostasis [44,45]. Notably, GPC5 expression is significantly higher in the adipose tissue of Guangling Large-Tailed sheep compared to thin-tailed breeds and is associated with the ECM-receptor interaction pathway, suggesting its potential role in promoting adipocyte hypertrophy through extracellular matrix remodeling and thereby influencing caudal fat development and morphology [44,46]. In summary, GPC5 plays a critical role in ovine adipogenesis and tail fat phenotype regulation, primarily through suppressing Wnt signaling and modulating lipid metabolic processes.
In terms of regulating lipid metabolism, DAB1 primarily drives lipid synthesis via the Reelin-PI3K pathway, while GPC5 modulates adipocyte homeostasis by regulating ion channels. Lanzhou fat-tailed sheep exhibit an increased capacity for lipid storage, which is due to elevated DAB1 expression and enhanced GPC5 activity. This metabolic adaptation is evident in the form of >36% unsaturated fatty acid content in tail adipose tissue. In contrast, Hu sheep exhibit a different metabolic profile characterized by GPC5 polymorphisms that favor immunometabolic trade-offs, prioritizing basal physiological maintenance over lipid accumulation [42]. Divergent tail morphogenesis is manifested through breed-specific molecular regulation. For example, Lanzhou fat-tailed sheep develop elongated tails via DAB1/GPC5-mediated adipocyte hyperplasia/hypertrophy, resulting in adipocytes that are 40–50% larger than those of Hu sheep. In contrast, Hu sheep’s compact tails arise from GPC5 polymorphism-induced membrane inhibition and reductions in DAB1 phosphorylation that predispose to lipolysis [47].

5. Conclusions

The present study employed selection signature analysis to investigate the genetic basis of divergent caudal fat deposition between Lanzhou Fat-Tailed and Hu sheep. A total of eight candidate genes under selection were identified, with DAB1 and GPC5 proving to be promising candidate targets associated with caudal lipid metabolism. However, limitations such as the small sample size and lack of gene expression validation should be addressed in future studies to confirm the functional relevance of these candidate genes. These findings provide crucial insights for the conservation and utilization of genetic resources in indigenous Chinese breeds of livestock. Next steps will include validation via gene expression or CRISPR functional studies.

Supplementary Materials

The following supporting information can be downloaded at: https://www.mdpi.com/article/10.3390/ani15203046/s1, Table S1: Summary statistics of whole-genome resequencing datasets from LLS and HS.

Author Contributions

All authors contributed to the conception and design of this research. Material preparation, Data Curation, X.Z., Y.L., Y.Z., P.G., Y.C., H.X., X.C., Q.L., X.M., D.Z. and J.B.; Writing—original draft preparation, X.Z.; all authors commented on previous versions of the manuscript. All authors have read and agreed to the published version of the manuscript.

Funding

This study was supported by the Fundamental Research Funds for the Central Universities (No. 31920230063); the Science and Technology Program of Gansu Province (21JR11RA018); the Gansu Higher Education Industry Support Program Project (2023CYZC-08); and The Program for Young Talent of SEAC [(2022)366].

Institutional Review Board Statement

All experimental procedures were conducted following the guidelines set by the Ministry of Science and Technology of the People’s Republic of China. This study was approved by the Animal Ethics Committee of Northwest Minzu University (11 August 2025).

Informed Consent Statement

Not applicable.

Data Availability Statement

All data generated during the current study is included in this manuscript.

Conflicts of Interest

The authors declare no conflicts of interest.

References

  1. Li, Q.; Lu, Z.; Jin, M.; Fei, X.; Quan, K.; Liu, Y.; Ma, L.; Chu, M.; Wang, H.; Wei, C. Verification and Analysis of Sheep Tail Type-Associated PDGF-D Gene Polymorphisms. Animals 2020, 10, 89. [Google Scholar] [CrossRef]
  2. Lu, Z.; Liu, J.; Han, J.; Yang, B. Association Between BMP2 Functional Polymorphisms and Sheep Tail Type. Animals 2020, 10, 739. [Google Scholar] [CrossRef]
  3. Fei, X.; Jin, M.; Wang, Y.; Li, T.; Lu, Z.; Yuan, Z.; Wang, H.; Lu, J.; Quan, K.; Di, R.; et al. Transcriptome reveals key microRNAs involved in fat deposition between different tail sheep breeds. PLoS ONE 2022, 17, e0264804. [Google Scholar] [CrossRef]
  4. Hosseini, S.F.; Bakhtiarizadeh, M.R.; Salehi, A. Meta-analysis of RNA-Seq datasets highlights novel genes/pathways involved in fat deposition in fat-tail of sheep. Res. Sq. 2022. [Google Scholar] [CrossRef]
  5. Wang, F.; Shao, J.; He, S.; Guo, Y.; Pan, X.; Wang, Y.; Nanaei, H.A.; Chen, L.; Li, R.; Xu, H.; et al. Allele-specific expression and splicing provide insight into the phenotypic differences between thin- and fat-tailed sheep breeds. J. Genet. Genom. 2022, 49, 583–586. [Google Scholar] [CrossRef]
  6. Li, B.; Qiao, L.; An, L.; Wang, W.; Liu, J.; Ren, Y.; Pan, Y.; Jing, J.; Liu, W. Transcriptome analysis of adipose tissues from two fat-tailed sheep breeds reveals key genes involved in fat deposition. BMC Genom. 2018, 19, 338. [Google Scholar] [CrossRef] [PubMed]
  7. Zhang, W.; Xu, M.; Wang, J.; Wang, S.; Wang, X.; Yang, J.; Gao, L.; Gan, S. Comparative Transcriptome Analysis of Key Genes and Pathways Activated in Response to Fat Deposition in Two Sheep Breeds With Distinct Tail Phenotype. Front. Genet. 2021, 12, 639030. [Google Scholar] [CrossRef]
  8. Kalds, P.; Zhou, S.; Gao, Y.; Cai, B.; Huang, S.; Chen, Y.; Wang, X. Genetics of the phenotypic evolution in sheep: A molecular look at diversity-driving genes. Genet. Sel. Evol. 2022, 54, 61. [Google Scholar] [CrossRef]
  9. Deribe, B.; Beyene, D.; Dagne, K.; Getachew, T.; Gizaw, S.; Abebe, A. Morphological diversity of northeastern fat-tailed and northwestern thin-tailed indigenous sheep breeds of Ethiopia. Heliyon 2021, 7, e07472. [Google Scholar] [CrossRef] [PubMed]
  10. Mastrangelo, S.; Bahbahani, H.; Moioli, B.; Ahbara, A.; Al Abri, M.; Almathen, F.; Da Silva, A.; Belabdi, I.; Portolano, B.; Mwacharo, J.M.; et al. Novel and known signals of selection for fat deposition in domestic sheep breeds from Africa and Eurasia. PLoS ONE 2019, 14, e0209632. [Google Scholar] [CrossRef] [PubMed]
  11. Amane, A.; Belay, G.; Nasser, Y.; Kyalo, M.; Dessie, T.; Kebede, A.; Getachew, T.; Entfellner, J.-B.D.; Edea, Z.; Hanotte, O.; et al. Genome-wide insights of Ethiopian indigenous sheep populations reveal the population structure related to tail morphology and phylogeography. Genes Genom. 2020, 42, 1169–1178. [Google Scholar] [CrossRef]
  12. Horton, J.D.; Goldstein, J.L.; Brown, M.S. SREBPs: Activators of the complete program of cholesterol and fatty acid synthesis in the liver. J. Clin. Investig. 2002, 109, 1125–1131. [Google Scholar] [CrossRef]
  13. Farhadi, S.; Ghias, J.S.; Hasanpur, K.; Mohammadi, S.A.; Ebrahimie, E. Molecular mechanisms of fat deposition: IL-6 is a hub gene in fat lipolysis, comparing thin-tailed with fat-tailed sheep breeds. Arch. Anim. Breed. 2021, 64, 53–68. [Google Scholar] [CrossRef] [PubMed]
  14. Han, J.; Guo, T.; Yue, Y.; Lu, Z.; Liu, J.; Yuan, C.; Niu, C.; Yang, M.; Yang, B. Quantitative proteomic analysis identified differentially expressed proteins with tail/rump fat deposition in Chinese thin- and fat-tailed lambs. PLoS ONE 2021, 16, e0246279. [Google Scholar] [CrossRef]
  15. Ma, L.; Zhang, M.; Jin, Y.; Erdenee, S.; Hu, L.; Chen, H.; Cai, Y.; Lan, X. Comparative Transcriptome Profiling of mRNA and lncRNA Related to Tail Adipose Tissues of Sheep. Front. Genet. 2018, 9, 365. [Google Scholar] [CrossRef]
  16. Caiye, Z.; Song, S.; Li, M.; Huang, X.; Luo, Y.; Fang, S. Genome-wide DNA methylation analysis reveals different methylation patterns in Chinese indigenous sheep with different type of tail. Front. Vet. Sci. 2023, 10, 1125262. [Google Scholar] [CrossRef]
  17. Wu, M.; Zhao, H.; Tang, X.; Li, Q.; Yi, X.; Liu, S.; Sun, X. Novel InDels of GHR, GHRH, GHRHR and Their Association with Growth Traits in Seven Chinese Sheep Breeds. Animals 2020, 10, 1883. [Google Scholar] [CrossRef] [PubMed]
  18. Zhang, Z.; He, X.; Liu, Q.; Tang, J.; Di, R.; Chu, M. TGIF1 and SF1 polymorphisms are associated with litter size in Small Tail Han sheep. Reprod. Domest. Anim. 2020, 55, 1145–1153. [Google Scholar] [CrossRef] [PubMed]
  19. Li, H.; Handsaker, B.; Wysoker, A.; Fennell, T.; Ruan, J.; Homer, N. The Sequence Alignment/Map format and SAMtools. Bioinformatics 2009, 25, 2078–2079. [Google Scholar] [CrossRef]
  20. Vitti, J.J.; Grossman, S.R.; Sabeti, P.C. Detecting natural selection in genomic data. Annu. Rev. Genet. 2013, 47, 97–120. [Google Scholar] [CrossRef] [PubMed]
  21. Sun, X.; Guo, J.; Li, R.; Zhang, H.; Zhang, Y.; Liu, G.E.; Emu, Q.; Zhang, H. Whole-Genome Resequencing Reveals Genetic Diversity and Wool Trait-Related Genes in Liangshan Semi-Fine-Wool Sheep. Animals 2024, 14, 444. [Google Scholar] [CrossRef]
  22. Xu, Y.-X.; Wang, B.; Jing, J.-N.; Ma, R.; Luo, Y.-H.; Li, X.; Yan, Z.; Liu, Y.-J.; Gao, L.; Ren, Y.-L.; et al. Whole-body adipose tissue multi-omic analyses in sheep reveal molecular mechanisms underlying local adaptation to extreme environments. Commun. Biol. 2023, 6, 159. [Google Scholar] [CrossRef] [PubMed]
  23. Lei, Z.; Sun, W.; Guo, T.; Li, J.; Zhu, S.; Lu, Z.; Qiao, G.; Han, M.; Zhao, H.; Yang, B.; et al. Genome-Wide Selective Signatures Reveal Candidate Genes Associated with Hair Follicle Development and Wool Shedding in Sheep. Genes 2021, 12, 1924. [Google Scholar] [CrossRef]
  24. Zhang, D.; Cheng, J.; Li, X.; Huang, K.; Yuan, L.; Zhao, Y.; Xu, D.; Zhang, Y.; Zhao, L.; Yang, X.; et al. Comprehensive multi-tissue epigenome atlas in sheep: A resource for complex traits, domestication, and breeding. Imeta 2024, 3, e254. [Google Scholar] [CrossRef]
  25. Balfourier, F.; Bouchet, S.; Robert, S.; De Oliveira, R.; Rimbert, H.; Kitt, J.; Choulet, F. Worldwide phylogeography and history of wheat genetic diversity. Sci. Adv. 2019, 5, eaav0536. [Google Scholar] [CrossRef]
  26. Liu, J.; Shi, Y.; Mo, D.; Luo, L.; Xu, S.; Lv, F. The goat pan-genome reveals patterns of gene loss during domestication. J. Anim. Sci. Biotechnol. 2024, 15, 132. [Google Scholar] [CrossRef] [PubMed]
  27. Trujillo, I.; de la Rosa, R.; Rallo, L.; Belaj, A. Selection of RAPD markers for olive (Olea europaea L.) cultivars identification. Acta Hortic. 1999, 474, 495–498. [Google Scholar] [CrossRef]
  28. Guzelsoy, G.; Akkaya, C.; Atak, D.; Dunn, C.D.; Kabakcioglu, A.; Ozlu, N.; Ince-Dunn, G. Terminal neuron localization to the upper cortical plate is controlled by the transcription factor NEUROD2. Sci. Rep. 2019, 9, 19697. [Google Scholar] [CrossRef]
  29. Jerng, H.H.; Qian, Y.; Pfaffinger, P.J. Modulation of Kv4.2 channel expression and gating by dipeptidyl peptidase 10 (DPP10). Biophys. J. 2004, 87, 2380–2396. [Google Scholar] [CrossRef]
  30. Howell, B.W.; Herrick, T.M.; Cooper, J.A. Reelin-induced tyrosine [corrected] phosphorylation of disabled 1 during neuronal positioning. Genes Dev. 1999, 13, 643–648. [Google Scholar] [CrossRef]
  31. Qi, S.Y.; Riviere, P.J.; Trojnar, J.; Junien, J.-L.; Akinsanya, K.O. Cloning and characterization of dipeptidyl peptidase 10, a new member of an emerging subgroup of serine proteases. Biochem. J. 2003, 373 Pt 1, 179–189. [Google Scholar] [CrossRef]
  32. Li, H.-L.; Qu, Y.-J.; Lu, Y.C.; Bondarenko, V.E.; Wang, S.; Skerrett, I.M.; Morales, M.J. DPP10 is an inactivation modulatory protein of Kv4.3 and Kv1.4. Am. J. Physiol. Cell Physiol. 2006, 291, C966–C976. [Google Scholar] [CrossRef] [PubMed]
  33. Xu, M.; Arnaud, L.; Cooper, J.A. Both the phosphoinositide and receptor binding activities of Dab1 are required for Reelin-stimulated Dab1 tyrosine phosphorylation. Brain Res. Mol. Brain Res. 2005, 139, 300–305. [Google Scholar] [CrossRef]
  34. Stolt, P.C.; Chen, Y.; Liu, P.; Bock, H.H.; Blacklow, S.C.; Herz, J. Phosphoinositide binding by the disabled-1 PTB domain is necessary for membrane localization and Reelin signal transduction. J. Biol. Chem. 2005, 280, 9671–9677. [Google Scholar] [CrossRef]
  35. Huang, Y.; Shah, V.; Keshvara, L. The role of the PTB domain in regulation of DAB1 phosphorylation. Biochemistry 2007, 21, A241. [Google Scholar] [CrossRef]
  36. Qiao, L.; Zhao, B.; Liu, X.; Liu, J.; Yang, K.; Pan, Y.; Liu, W. TPT1 promotes the adipogenic differentiation of stromal vascular fractions via the PI3K/AKT pathway and FOXO1 in sheep. J. Appl. Anim. Res. 2023, 51, 388–396. [Google Scholar] [CrossRef]
  37. Bock, H.H.; Jossin, Y.; Liu, P.; Förster, E.; May, P.; Goffinet, A.M.; Herz, J. Phosphatidylinositol 3-kinase interacts with the adaptor protein Dab1 in response to Reelin signaling and is required for normal cortical lamination. J. Biol. Chem. 2003, 278, 38772–38779. [Google Scholar] [CrossRef] [PubMed]
  38. Lei, Z.; Wei, D.; Tang, L.; Wang, S.; Pan, C.; Ma, Y.; Ma, Y. SGK1 Affects the Phosphorylation of FOXO1/FOXO3 Promoting Bovine Fat Deposition via the PI3K/Akt Signaling Pathway. Res. Sq. 2022. [Google Scholar] [CrossRef]
  39. Stolt, P.C.; Jeon, H.; Song, H.K.; Herz, J.; Eck, M.J.; Blacklow, S.C. Origins of peptide selectivity and phosphoinositide binding revealed by structures of disabled-1 PTB domain complexes. Structure 2003, 11, 569–579. [Google Scholar] [CrossRef]
  40. Wang, S.; Qiu, M.; Xia, W.; Xu, Y.; Mao, Q.; Wang, J.; Dong, G.; Xu, L.; Yang, X.; Yin, R. Glypican-5 suppresses Epithelial-Mesenchymal Transition of the lung adenocarcinoma by competitively binding to Wnt3a. Oncotarget 2016, 7, 79736–79746. [Google Scholar] [CrossRef]
  41. Yuan, S.; Yu, Z.; Liu, Q.; Zhang, M.; Xiang, Y.; Wu, N.; Wu, L.; Hu, Z.; Xu, B.; Cai, T.; et al. GPC5, a novel epigenetically silenced tumor suppressor, inhibits tumor growth by suppressing Wnt/β-catenin signaling in lung adenocarcinoma. Oncogene 2016, 35, 6120–6131. [Google Scholar] [CrossRef]
  42. Wang, X.; Zhou, G.; Xu, X.; Geng, R.; Zhou, J.; Yang, Y.; Yang, Z.; Chen, Y. Transcriptome profile analysis of adipose tissues from fat and short-tailed sheep. Gene 2014, 549, 252–257. [Google Scholar] [CrossRef]
  43. Hosseini, S.F.; Bakhtiarizadeh, M.R.; Salehi, A. Meta-analysis of RNA-Seq datasets highlights novel genes/pathways involved in fat deposition in fat-tail of sheep. Front. Vet. Sci. 2023, 10, 1159921. [Google Scholar] [CrossRef]
  44. Wang, C.; Zhao, Y.; Gao, X.; Li, L.; Yuan, Y.; Liu, F.; Zhang, L.; Wu, J.; Hu, P.; Zhang, X.; et al. Perilipin 5 improves hepatic lipotoxicity by inhibiting lipolysis. Hepatology 2015, 61, 870–882. [Google Scholar] [CrossRef] [PubMed]
  45. Wang, H.; Bell, M.; Sreenevasan, U.; Hu, H.; Liu, J.; Dalen, K.; Londos, C.; Yamaguchi, T.; Rizzo, M.A.; Coleman, R.; et al. Unique regulation of adipose triglyceride lipase (ATGL) by perilipin 5, a lipid droplet-associated protein. J. Biol. Chem. 2011, 286, 15707–15715. [Google Scholar] [CrossRef] [PubMed]
  46. Lin, J.; Chen, A. Perilipin 5 restores the formation of lipid droplets in activated hepatic stellate cells and inhibits their activation. Lab. Investig. 2016, 96, 791–806. [Google Scholar] [CrossRef]
  47. Gao, J.; Li, W.; Willis-Owen, S.A.; Jiang, L.; Ma, Y.; Tian, X.; Moffatt, M.; Cookson, W.; Lin, Y.; Zhang, Y. Polymorphisms of PHF11 and DPP10 are associated with asthma and related traits in a Chinese population. Respiration 2010, 79, 17–24. [Google Scholar] [CrossRef] [PubMed]
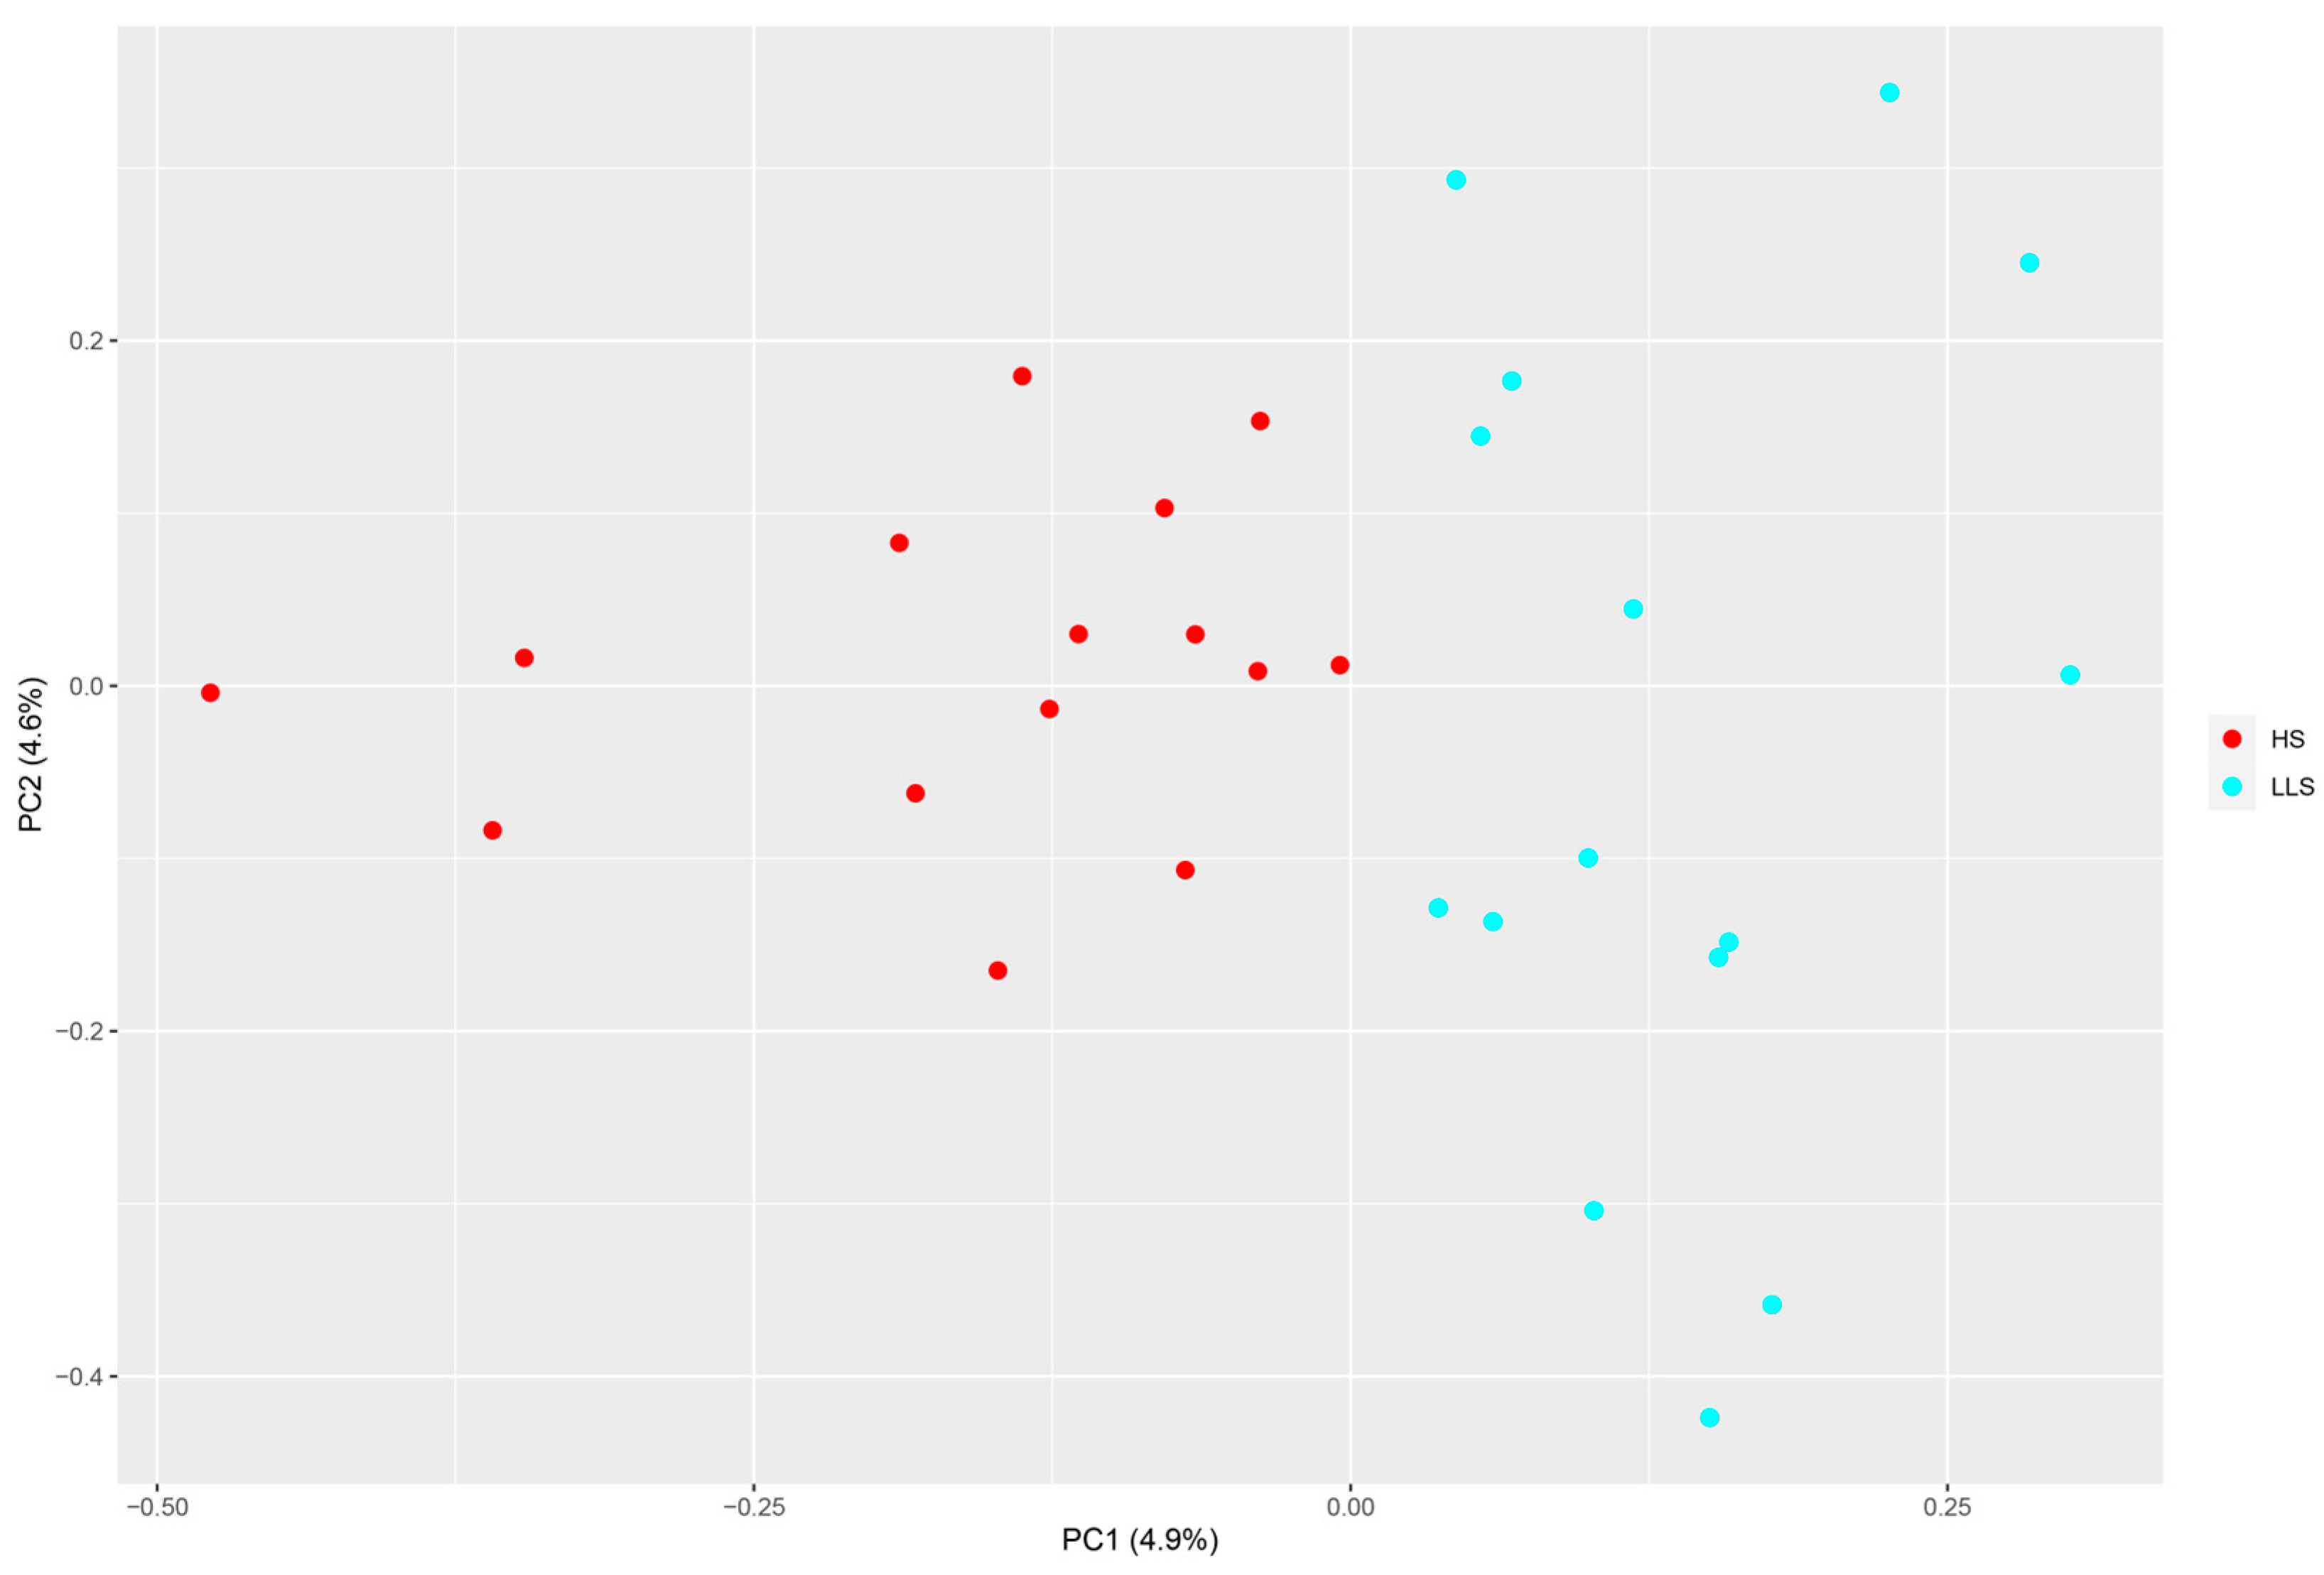
Figure 1. Analysis of the genetic structure of the population: principal component analysis (PCA) (red color represents a Hu sheep population, and blue color represents a Lanzhou fat-tailed sheep population).
Animals 15 03046 g001
Figure 2. Selection signal analysis. genome-wide distribution of FST (LLS vs. HS). Note: The X-axis is indicative of chromosomal position, whilst the Y-axis denotes FST values. The black dashed line indicates the top 1% significance threshold. Red and blue are used to distinguish chromosomes; for each set interval, the FST value of different chromosomes.
Animals 15 03046 g002
Figure 3. Selection signal analysis. A. π-value results for HS; B. π-value results for LLS. Note: Manhattan plot showing the selected regions of the introduced breeds according to FST method. The solid red line denotes the top 1% significance threshold, and the data points above the dotted line are the selected regions. Different colors are also used to distinguish chromosomes.
Animals 15 03046 g003
Figure 4. Distribution of selection signals on the autosomes of LLS and HS. Note: Manhattan plot showing the selected regions based on XP-EHH methods between the long-fat-tailed breeds and short-fat-tailed breeds. The X-axis is indicative of chromosomal position, whilst the Y-axis denotes XP-EHH values. The red dashed line indicates the XP-EHH > 1 significance threshold. Different colors are also used to distinguish chromosomes.
Animals 15 03046 g004
Figure 5. Selection signal analysis. genome-wide distribution of XP-CLR (LLS vs. HS). Note: The X-axis is indicative of chromosomal position, whilst the Y-axis denotes XP-CLR values. The dashed line indicates the XP-CLR > 10 significance threshold. Different colors are also used to distinguish chromosomes.
Animals 15 03046 g005
Figure 6. GO enrichment and KEGG enrichment results. (A) HS in the first 20 GO enrichment results; (B) HS in the KEGG enrichment results; (C) LLS in the first 20 GO enrichment results; (D) LLS in the KEGG enrichment results.
Animals 15 03046 g006
Figure 7. GO enrichment and KEGG enrichment results. (A) GO enrichment results of genes screened in the top 20 using the FST method (LLS vs. HS); (B) KEGG enrichment results of genes screened in the top 20 using the FST method (LLS vs. HS); (C) GO enrichment results of genes screened in the top 20 using the XP-EHH method (LLS vs. HS); (D) GO enrichment results of genes screened in the top 20 using the XP-EHH method screened genes in KEGG enrichment results (LLS vs. HS); (E) GO enrichment results of genes screened in the top 20 using the XP-CLR method (LLS vs. HS); (F) KEGG enrichment results of genes screened using the XP-CLR method (LLS vs. HS).
Animals 15 03046 g007
Figure 8. Share the results of gene enrichment analyses. Note: Venn diagram showing the overlapped genes from the FST, XP-EHH, and XP-CLR analyses.
Animals 15 03046 g008
Table 1. Sample information.
SampleAbbreviationSizeTypePhoto
Lanzhou fat-tailed sheepLLS15bloodAnimals 15 03046 i001
Hu sheepHS15bloodAnimals 15 03046 i002
Table 2. Candidate regions under positive selection identified in the genomes of LLS and HS.
ChromosomesN_VariantsBin_StartBin_EndGene
chr12349995000199970000LOC101114737
chr3337119610001119630000
chr3153119650001119670000
chr3128119660001119680000
chr3248119670001119690000
chr3212154030001154050000
chr3206213100001213120000
chr3206213110001213130000
chr4195160001180000
chr4121170001190000
chr484180001200000
chr463190001210000
chr442200001220000
chr103233857000138590000
chr103553858000138600000
chr103343859000138610000
chr102903860000138620000
chr103283861000138630000
chr103983862000138640000
chr181496646000166480000TRNAE-UUC-84, LOC101104530
chr182126647000166490000LOC105603275, LOC105603310
chr182416648000166500000LOC105603275, LOC105603310, LOC106990142
chr181886649000166510000LOC105603275, LOC106990142
chr192423175000131770000MITF
chr2215078000150800000
chr243243512000135140000COL26A1
chr242253513000135150000COL26A1
chrX1454322000143240000ZNF674
chrX1476001000160030000TEX11
chrX1527920000179220000FATE1, CNGA2
Table 3. Candidate regions subject to positive selection on the genome of HS over LLS identified by XP-CLR test.
ChromosomesStartStopXP-CLRChromosomesStartStopXP-CLR
120550400120550600021.2861259500159700014.876
1120550300120550500012.20612653940016539600011.191
1592810015928300011.9061259400159600010.862
13687001368900011.21612742710017427300010.209
217912300117912500018.09513293030012930500019.179
2827930018279500013.294137107001710900012.393
320042200120042400015.01716381150013811700010.056
321714100121714300010.660183797001379900019.272
6672380016724000024.500184993001499500017.599
611011100111011300018.562183556001355800011.217
6402890014029100017.72318558970015589900011.204
6273720012737400015.12720475880014759000016.284
6256640012566600010.685216528001653000012.379
611396700111396900010.32122230010012300300014.462
72631001263300016.66822230050012300700012.506
74248001425000016.38423240970012409900011.478
7411070014110900012.502258859001886100011.271
8469590014696100012.301268807001880900012.374
107466001746800014.83926217570012175900011.324
10574890015749100010.097X767360017673800021.189
11151450011514700011.448
Disclaimer/Publisher’s Note: The statements, opinions and data contained in all publications are solely those of the individual author(s) and contributor(s) and not of MDPI and/or the editor(s). MDPI and/or the editor(s) disclaim responsibility for any injury to people or property resulting from any ideas, methods, instructions or products referred to in the content.