Article

LvSlc12A2 Is a Negative Growth Regulator in Whiteleg Shrimp, Litopenaeus vannamei

1
State Key Laboratory of Mariculture Biobreeding and Sustainable Goods, Yellow Sea Fisheries Research Institute, Chinese Academy of Fishery Sciences, Qingdao 266071, China
2
Jiangsu Key Laboratory of Marine Biotechnology, Jiangsu Ocean University, Lianyungang 222005, China
3
The Jiangsu Provincial Infrastructure for Conservation and Utilization of Agricultural Germplasm, Nanjing 210014, China
4
BLUP Aquabreed Co., Ltd., Weifang 261312, China
5
Ministry of Education Key Laboratory of Marine Genetics and Breeding, College of Marine Science, Ocean University of China, Qingdao 266003, China
*
Author to whom correspondence should be addressed.
Animals 2025, 15(17), 2467; https://doi.org/10.3390/ani15172467
Submission received: 29 June 2025 / Revised: 15 August 2025 / Accepted: 20 August 2025 / Published: 22 August 2025
(This article belongs to the Section Aquatic Animals)

Simple Summary

The LvSlc12A2 gene plays an important role in osmotic regulation, cell volume regulation, and neural signal transduction, though its role in the growth and development of crustaceans remains unclear. In a previous transcriptome analysis, we found that LvSlc12A2 was significantly differentially expressed in the fast- and slow-growing families of whiteleg shrimp, Litopenaeus vannamei. Therefore, we postulate that this gene may also be closely related to the regulation of growth and development in L. vannamei. Our results showed that LvSlc12A2 can synergize with LvMstn and LvMIH genes in function, and participate in the growth regulation of L. vannamei through negative regulatory mechanisms. LvSlc12A2 antagonized the LvAqp gene and regulated the growth of L. vannamei by participating in osmotic pressure regulation in gill tissues. Our study, showing that LvSlc12A2 is a negative regulator of L. vannamei growth, offers a novel genetic target for aquaculture breeding strategies.

Abstract

Litopenaeus vannamei, commonly known as the Pacific white shrimp, is one of the most economically significant species in global aquaculture, valued for its rapid growth and adaptability. However, the mechanisms regulating its growth, especially under high-density farming and environmental stress, remain poorly understood. Previous study predicted that LvSlc12A2 was involved in growth regulation. To further reveal the function of this gene in the growth regulation of the whiteleg shrimp, in this study, we explore its function using RT-qPCR, RNA interference, overexpression, and tissue in situ hybridization. RT-qPCR results showed that LvSlc12A2 was highly expressed in gills (about 62%), followed by the hepatopancreas, with the lowest expression in muscle (0.08%, compared to the gills). Myostatin (LvMstn) was mainly expressed in the heart, and molt-inhibiting hormone (LvMIH) in the ventral nerve. In situ hybridization of gill tissues using the mRNA of the gene as a probe revealed strong LvSlc12A2 signals in the gill stratum and epithelial cells. Overexpression of LvSlc12A2, significantly decreased the osmotic gene aquaporin (LvAqp), while knockdown increased its expression. Additionally, levels of growth-related inhibitory genes LvMstn and LvMIH increased significantly after LvSlc12A2 overexpression and were downregulated after its knockdown, suggesting LvSlc12A2 negatively regulates growth, possibly in synergy with LvMstn and LvMIH. These findings indicate LvSlc12A2 influences growth both by negative regulation and by modulating osmotic balance in gill tissues.

1. Introduction

Solute carrier (SLC) transporters are a large family of more than 400 membrane-bound proteins, the second largest group of membrane transporters after G protein-coupled receptors. They facilitate the transport of various substrates across biological membranes and play an important role in physiological processes from cellular uptake of nutrients to uptake of drugs and other exogenous substances [1]. The SLC family is divided into 65 subfamilies that mediate the exchange of substances such as ions, nutrients, signaling molecules, and drugs across biological membranes. SLC12 is a complete small family of membrane proteins, consisting of SLC12A1-SLC12A9 genes that encode an electrically neutral, cation-conjugated chloride transporter [2,3]. To date, all SLC12 family members that have been functionally characterized have been shown to be electrically neutral, cation-chloride cotransporters [4]. Nine SLC12 family members are known to be in vertebrates [5], including two NKCCs [6,7] (NKCC1 and NKCC2), a Na+-Cl cotransporter (NCC), four K-Cls (KCC1, KCC2, KCC3, and KCC4), and two other proteins with unclear functions (CIP and CCC9). Studies have shown that the Na+-K+-2Cl cotransporter, NKCC1 (encoded by LvSlc12A2) is capable of transmembrane ion transport at a ratio of 1Na:1K:2Cl [8,9]. It plays a role in osmotic regulation under different salinity stresses, maintains cell ion homeostasis and regulates cell volume, and thus maintains cellular osmolality [5,6,7,10]. NKCC1 depletion decreases the intracellular Na+ concentration and cell volume (size) and quality, and stimulates cell proliferation [4]. NKCC1 transports Na, K, and Cl ions between epithelial and non-epithelial cells, thereby regulating cell proliferation, differentiation, and metastasis [11]. The protein is found in the stomach, esophagus, colorectal, liver, pancreas, lungs, and other tissues, and is abnormally expressed in many tumors. In addition, the SLC12 sequence has been identified in many lower species, including crustaceans, insects, worms, plants, fungi, and some bacteria. In recent years, significant progress has been made in the study of Solute Carrier (SLC) family genes in Litopenaeus vannamei, revealing their crucial roles in various key physiological processes. In the context of immune defense, studies have found that LvSlc15A4 participates in the innate immune response by activating the NF-κB signaling pathway [12], while LvSlc5 has been confirmed to be associated with resistance to White Spot Syndrome Virus (WSSV) infection [13]. Furthermore, regarding environmental stress responses, the functions of several SLC members have also been elucidated; for instance, both LvSlc26A6 [14] and LvSlc12A2 [15] have been shown to be involved in the response to nitrite stress. However, although the LvSlc12A2 gene has been cloned and its function in stress response reported, its potential role in the regulation of growth in L. vannamei and the underlying molecular mechanisms remain unknown, presenting an important scientific question for further investigation.
L. vannamei occupies an important position in China’s aquaculture, and is widely cultivated because of its strong adaptability and tolerance to extensive culture. It is the shrimp species with the highest aquaculture yield in the world [16,17]. With the intensified competition in the L. vannamei farming industry, the cultivation of fast-growing new varieties has always been an important target for industrialization. The growth rate of L. vannamei is affected by a variety of internal and external factors, such as water-salt balance, hormone regulation, etc., but gene regulation is a crucial part of it. In a previous study (unpublished data), we established fast-growing and slow-growing families of L. vannamei and conducted transcriptome analysis with the aim to find genes related to growth regulation. We found that the LvSlc12A2 gene was significantly differentially expressed in the fast- and slow-growing families. This finding prompted further investigation into the role and mechanism of this gene in regulating shrimp growth, with the goal of accelerating the breeding of improved fast-growing varieties. To achieve this, we used a combination of quantitative PCR (qPCR), RNA interference (RNAi), gene overexpression, and tissue in situ hybridization to explore the expression patterns of LvSlc12A2 in different tissues, and its regulatory effects on growth-related inhibitory genes such as LvMstn (myostatin) and LvMIH (molt-inhibiting hormone). We also assessed the involvement of LvSlc12A2 in osmoregulatory mechanisms by evaluating its impact on LvAqp (aquaporin) expression, providing insights into its potential dual role in growth regulation and osmotic pressure control in L. vannamei.

2. Materials and Methods

2.1. Source of Materials

The shrimps used in this study were from BLUP Aquabreed Co., Ltd., Weifang, China. Shrimps were reared in tanks measuring 60 cm (L) × 50 cm (W) × 40 cm (H). Each tank was stocked with 30 shrimp. All individuals had a good growth status and consistent specifications, with an average body length of 7 ± 0.2 cm and an average body weight of 3 ± 0.2 g. Before the experiments, the shrimp were temporarily reared for one week under controlled conditions. The rearing water temperature was maintained at 25.0–28.0 °C, salinity at 24 ± 2 ppt, pH at 8.0 ± 0.2, and dissolved oxygen at 7.0 ± 0.5 mg/L. The shrimp were fed commercial feed produced by Tongwei Group (Chengdu, China), containing approximately 35% crude protein, 8% crude lipid, and 6% ash. Feed was administered twice daily at 9:00 and 16:00, with the feed amounting to 1% of body weight each time. During this period, the water was under 24 h continuous aeration, with regular cleaning of bait and feces. Sex was not considered during the selection process.

2.2. RNA Extraction and cDNA Synthesis

Instructions from the relevant kits were used. Total RNA was extracted from 15 to 25 mg of tissue with a UNIQ-10 column Trizol total RNA extraction kit (Sangon, Shanghai, China). The quantity and purity of the extracted RNA were assessed using a NanoDrop spectrophotometer by measuring the absorbance at 260 nm and 280 nm (A260/A280), and the RNA integrity was evaluated by 1% agarose gel electrophoresis. 1 µg of qualified RNA was reverse-transcribed into cDNA using a HiScript® III RT SuperMix for qPCR (+gDNA wiper) (Vazyme, Nanjing, China) kit, and then stored at −80 °C.

2.3. Analysis of LvSlc12A2, LvMstn, and LvMIH Expression Characteristics

Nine healthy shrimps were dissected to obtain hemolymph, eyestalk, stomach, heart, gill, hepatopancreas, intestine, muscle, ventral nerve, and ovary tissues. RNA extraction and cDNA synthesis were performed as described in Section 2.2. Specific PCR primers were designed using Primer Premier 5.0 software based on the conserved sequences of the core of the LvSlc12A2 gene (Table 1), and 18S rRNA was used as the internal reference gene [16], and qRT-PCR was performed according to the ChamQ SYBR qPCR Master Mix (Vazyme, Nanjing, China). The reaction procedure was as follows: 1 cycle of 95 °C for 15 s for pre-denaturation; 40 cycles of 95 °C for 3 s and 60 °C for 30 s. All samples were analyzed in triplicate (n = 3).

2.4. LvSlc12A2 Gene Overexpression

Recombinant primers were designed according to the core conserved sequences of the LvSlc12A2 gene (Table 1), and the overexpression vector was constructed. The constructed vectors were transcribed in vitro according to the Easy Cap T7 Co-transcription Kit with the CAG Trimer Kit (Vazyme, Nanjing, China). Two groups were designed, namely the control group and the overexpression group, with three parallel replicates in each group and 30 animals in each replicate. The control group was injected with only normal saline (saline injection), and the overexpression group was injected with dsRNA of the LvSlc12A2 gene. The injection volume was prepared as a standard of 4 μg/g normal saline or dsRNA. At 0, 6, 12, 24, 48, and 72 h post-injection, three shrimp were randomly sampled from each tank, and their gill and muscle tissues were, respectively, pooled. Consequently, three biological replicates were obtained for each group at each time point. All quantitative analyses were performed with three technical replicates for each biological sample. Quantitative analysis was performed on key target genes, including two growth inhibition of related genes (LvMstn [18] and LvMIH [19]) and osmotic pressure regulation (LvAqp [20]). The qRT-PCR-related primers are shown in Table 1.

2.5. RNA Interference

The LvSlc12A2 gene interference primers (Table 1) were designed from the online website https://rnaidesigner.thermofisher.com/rnaiexpress/ (accessed on 10 July 2024) (thermofisher.com). RNA interference reagents were synthesized according to the instructions of the T7 RNAi Transcription Kit (Vazyme, Nanjing, China). RNA interference experiments were performed on healthy, vigorous, uniformly sized L. vannamei. The experimental method is the same as that described in Section 2.4.

2.6. In Situ Hybridization

The recombinant primers were designed according to the core sequence of the LvSlc12A2 gene. The linearized DNA was amplified with linearized primers and LvSlc12A2-PSPT18 recombinant plasmid. The primers are shown in Table 1. The DIG RNA labeling kit (SP6/T7) reagent was used for in vitro transcription. After the DIG-labeled probes were synthesized, the integrity of the combined probes was detected by 1% agarose gel electrophoresis. The probe concentration was determined by a nucleic acid analyzer, and the probes were stored at −80 °C for later use.
Gill tissue of L. vannamei was fixed in 4% paraformaldehyde for 24 h, and tissues were routinely dehydrated, embedded in paraffin, and sectioned (slice thickness 4 μm). The synthetic mRNA probe of the LvSlc12A2 gene was used for pre-hybridization and hybridization experiments, and the DAB chromogenic agent was used for color development. After ethanol dehydration and xylene treatment, neutral gum was used to seal the sections, and natural drying was carried out under a microscope, where the hybridization signal was observed and photomicrographed [17].

2.7. Data Analysis

All data are presented as mean ± SEM. Datasets were evaluated for the homogeneity of variance (Levene’s test) and for normality (the Shapiro–Wilk test). The qRT-PCR results were statistically analyzed using SPSS 19.0 and the 2−ΔΔCt method with Excel software [21]. The differential expression of the gene among various tissues was analyzed by one-way ANOVA followed by the Least Significant Difference (LSD) post hoc test. Differences between the control group and the interference group were compared using repeated measure two way ANOVA and followed by Bonferroni post hoc tests for multiple comparisons. p values less than 0.05 were considered to be significant.

3. Results

3.1. Expression Characteristics of LvSlc12A2, LvMstn, and LvMIH in Different Tissues of L. vannamei

The tissue distribution of LvSlc12A2, LvMstn, and LvMIH expression was investigated using real-time fluorescence quantification (results are shown in Figure 1). Different tissue-specific expression patterns were seen for all three genes (Figure 1). LvSlc12A2 (Figure 1A), LvMstn (Figure 1B), and LvMIH (Figure 1C) were ubiquitously expressed across the ten examined tissues in L. vannamei, but distinct expression patterns were seen with significant tissue specificity. LvSlc12A2 was highly expressed in the gills (p < 0.05), followed by the hepatopancreas. It comprised about 62% of the expression in the gills, and the lowest expression level was in muscle (only 0.08% of that of the gills). LvMstn showed the highest expression in the heart, and the expression in the muscle was about 32% of that of the heart. The lowest expression was in the blood. LvMIH was highly expressed in nervous tissue, followed by the hepatopancreas, intestine, gills, and heart, with the lowest expression in the blood.

3.2. Effects of LvSlc12A2 Overexpression on the LvAqp, LvMstn, and LvMIH Genes

Repeated measure two-way ANOVA confirmed that LvSlc12A2 overexpression, time, and their interaction significantly affected the expression of target genes (Figure 2). In gill tissue, we first confirmed the successful overexpression of LvSlc12A2 at 24, 48, and 72 h, with the highest levels observed at 72 h (Figure 2A). This overexpression led to a significant downregulation of LvAqp (Figure 2B) at 6, 12, 24, 48, 72 h and a significant upregulation of both LvMstn (Figure 2C) and LvMIH (Figure 2D) at 24 and 48 h. In muscle tissue, the expression of LvMstn and LvMIH was also significantly altered. LvMstn levels were elevated across multiple time points (6, 12, 24, and 72 h), peaking at a 6.6-fold increase at 6 h (Figure 2E). LvMIH expression was also robustly induced, rising by approximately 12-fold and 7.5-fold at 6 and 24 h, respectively (Figure 2F).

3.3. Effects of Knockdown LvSlc12A2 Genes on LvAqp, LvMstn, and LvMIH Genes

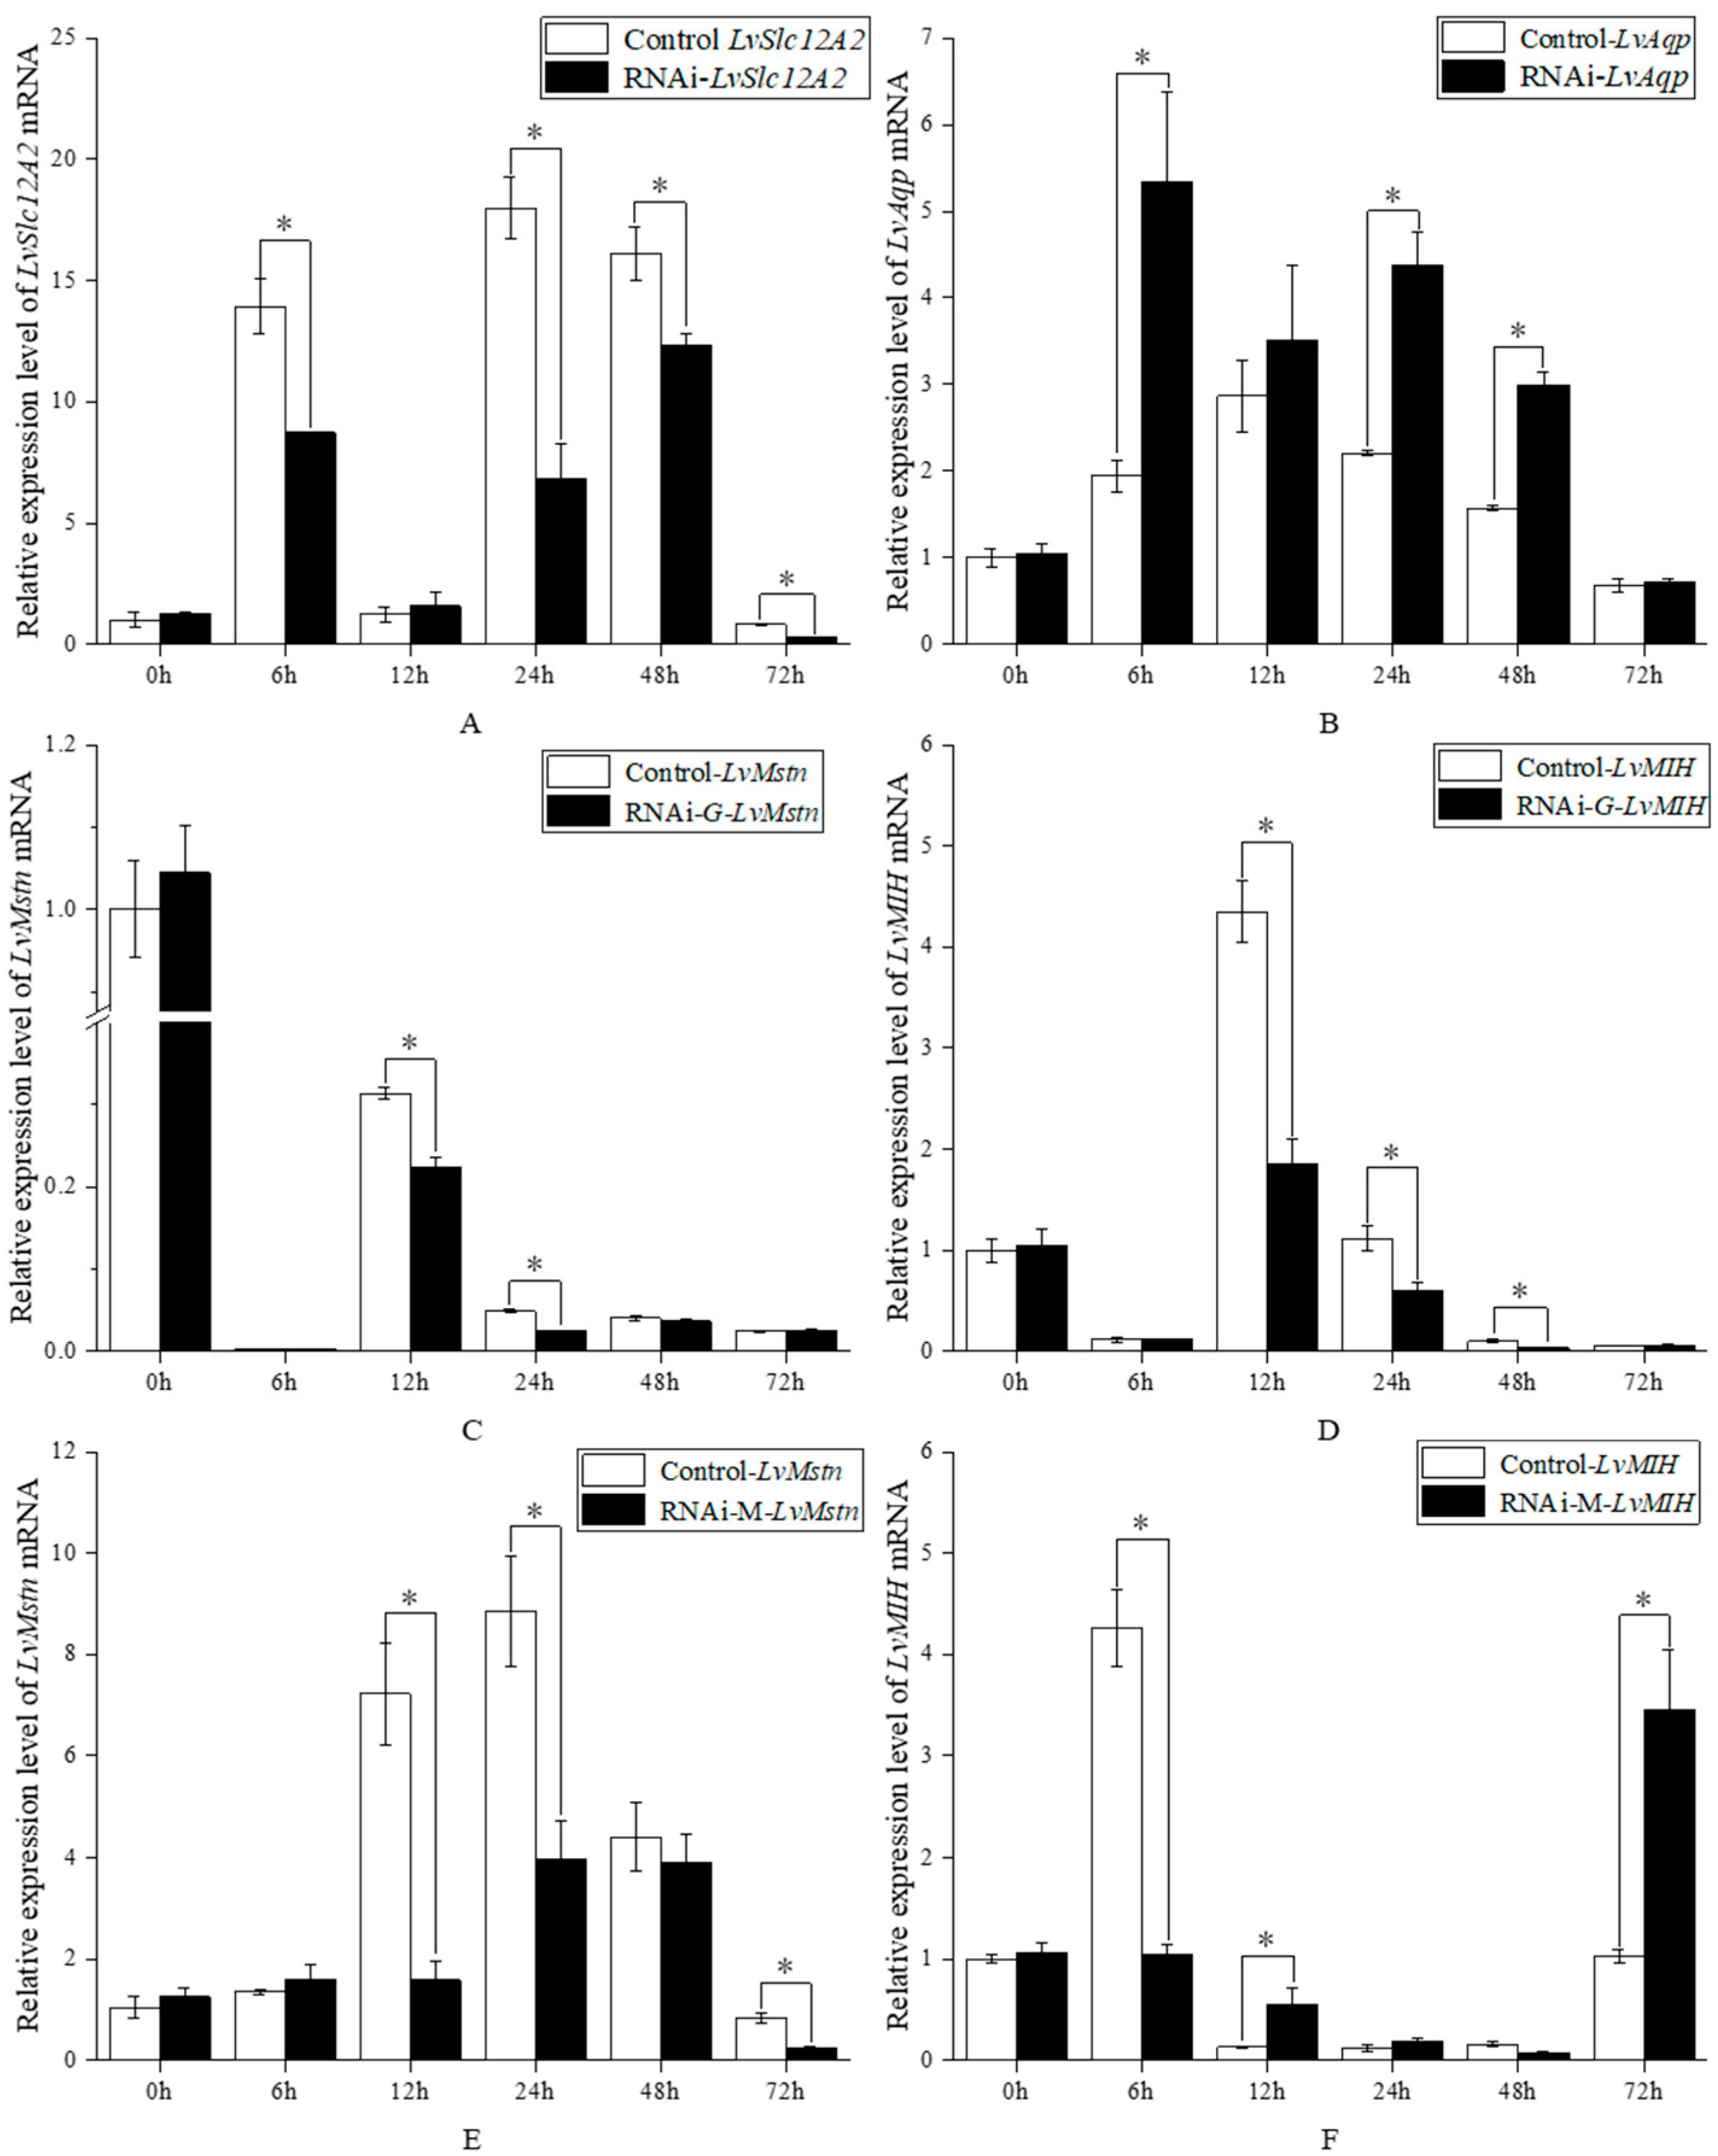
Silencing of the LvSlc12A2 gene via RNA interference significantly altered the expression of several related genes in both gill and muscle tissues (Figure 3). These effects were significantly influenced by treatment, time, and their interaction (repeated measure two-way ANOVA, p < 0.05). In the gills, LvSlc12A2 expression was effectively suppressed at all tested time points (6, 24, 48, and 72 h), with a maximum knockdown efficiency of 70.2% observed at 24 h (Figure 3A). This knockdown resulted in the significant upregulation of LvAqp at 6, 24, and 48 h (Figure 3B), and the significant downregulation of LvMstn (at 12 and 24 h) and LvMIH (at 12, 24 and 48 h) (Figure 3C,D). In muscle tissue, LvMstn levels were consistently repressed at 12, 24, and 72 h following LvSlc12A2 knockdown (Figure 3E). In contrast, LvMIH exhibited a biphasic response, showing significant downregulation at 6 h, followed by significant upregulation at 12 and 72 h (Figure 3F).

3.4. Localization of LvSlc12A2 mRNA in Gill Tissue

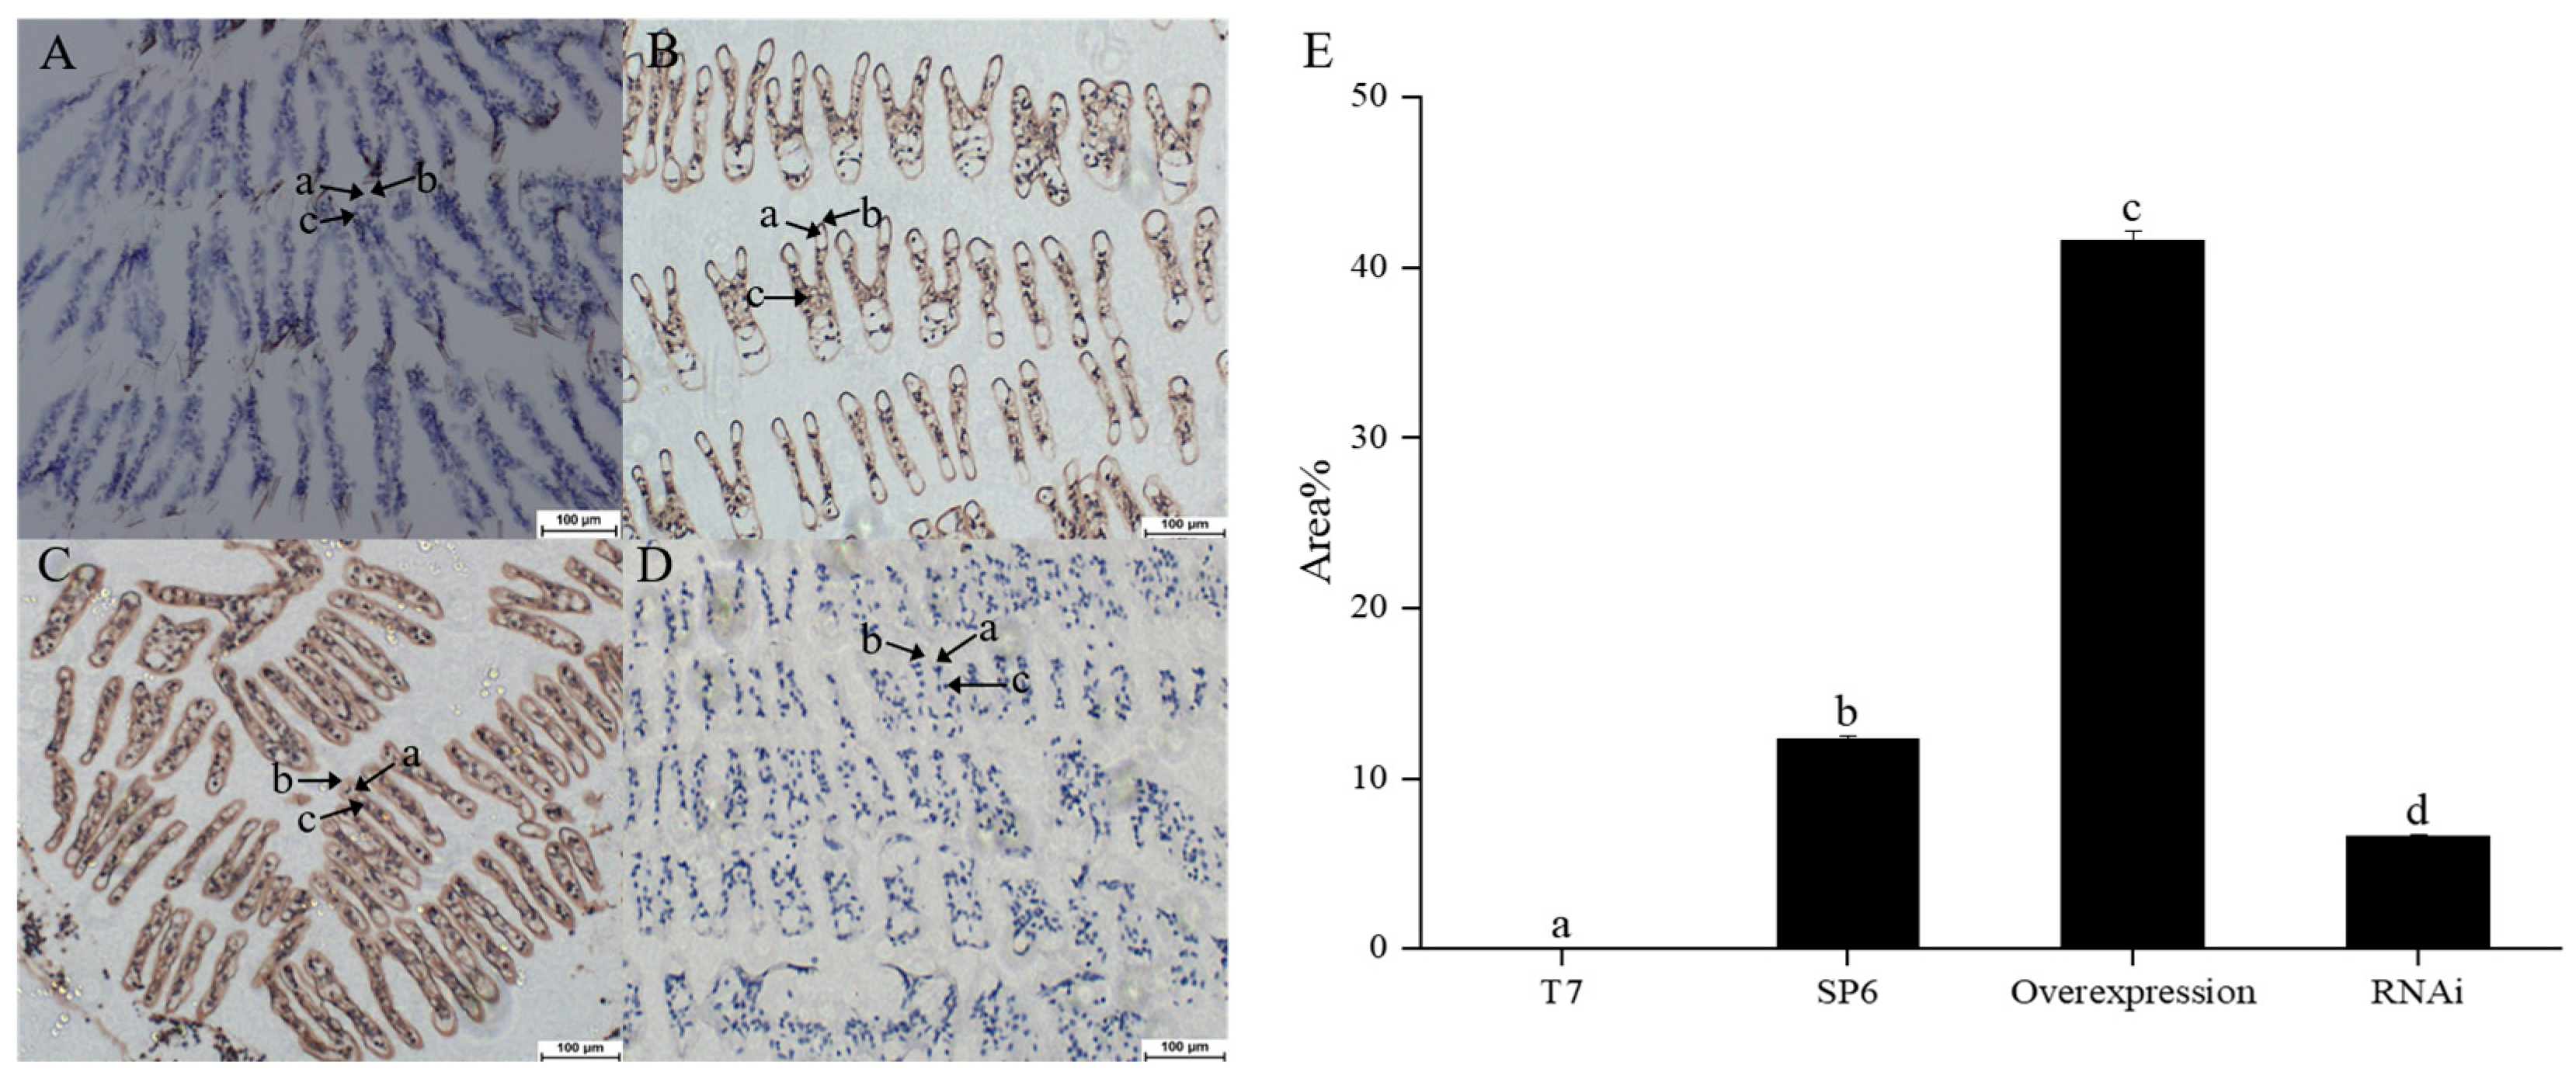
The spatial distribution of the LvSlc12A2 gene in the gills of L. vannamei were analyzed using the mRNA of LvSlc12A2 as a probe. The results, shown in Figure 4, demonstrate that the hybridization signal of the LvSlc12A2 gene mainly appears in the gill epithelium and cuticle cells in gill tissue, and no hybridization signal appears in the nucleus.
This study also detected the expression distribution with a semi-quantitative analysis of LvSlc12A2 in gill tissues of each treatment group (Figure 4A–E). The results show that the positive signal in the mRNA-LvSlc12A2 group (Figure 4C) was stronger, compared to the blank control group (Figure 4B). In addition, the positive signal in the RNAi-LvSlc12A2 group (Figure 4E) was weaker, compared to the blank control (Figure 4B).

4. Discussion

4.1. Distribution Characteristics and Function of LvSlc12A2

To explore the biological function of LvSlc12A2, qRT-PCR was used to analyze the expression of LvSlc12A2 in different tissues of L. vannamei. The results show that the LvSlc12A2 gene was expressed in all tissues, with the highest expression in gill tissue, followed by the hepatopancreas, and the lowest expression was in muscle. To further explore the spatial expression distribution of LvSlc12A2 in gill tissue, we used in situ hybridization to locate the expression of the mRNA of LvSlc12A2 in gill tissue, and found that the hybridization signals were mainly concentrated in the gill epithelium and cuticle cells. This is consistent with the high expression level of LvSlc12A2 that was found in gill tissues of Penaeus japonicus and tilapia [15,22,23,24], supporting the idea that LvSlc12A2 may be involved in osmotic regulation in the gills. Notably, its expression in muscle was the lowest among all tested tissues. We speculate that this low expression may indicate that LvSlc12A2 plays only a minor role in muscle physiology, possibly reflecting the lower involvement of muscle tissue in osmotic balance, while still participating indirectly in growth and metabolic regulation through systemic signaling. The gills are a multifunctional organ that play a key role in respiration, acid-base balance regulation, ion balance maintenance, nitrogen excretion, and osmoregulation [25]. The gill epithelium contains many cell types, such as granulosa cells, nephrogenic cells, and columnar cells, etc., for regulating and maintaining the osmotic balance between the external water environment and the hemolymph. The cells are known to perform functions in respiration, excretion, osmotic pressure regulation, and even disease prevention [26,27]. The coordinated transport of SlC12A2 located on the plasma membrane of the basal side of these cells also plays an important role [28,29,30,31]. Besides epithelial cells, LvSlc12A2 can also be expressed in non-epithelial cells such as heart and skeletal muscle neurons [32]. The expression of LvSlc12A2 has also been reported in the choroid cereus parietal membrane, neurons, oligodendrocytes, and dorsal root ganglion neurons in the nervous system [33]. Therefore, because of its involvement with perception of normal sensations, we speculate that LvSlc12A2 may also be associated with hormonal regulation.

4.2. Regulatory Links Between LvSlc12A2 and the Expression of LvMstn and LvMIH

Our finding that LvSlc12A2 regulates the expression of both LvMstn and LvMIH provides a novel mechanistic link between cellular ion homeostasis and the complex regulation of shrimp growth. This connection is particularly significant because LvMstn and LvMIH are the primary regulators of the two distinct modes of crustacean growth: continuousand discontinuous. The broad, non–tissue-specific expression of LvMstn [18,34,35,36] and the wide distribution of LvMIH beyond traditional neurosecretory sites [19] align with their central roles in systemic growth control—a process our findings now implicate LvSlc12A2 in modulating.
A plausible mechanism for this modulation is grounded in the established functions of LvSlc12A2. Both muscle development and the substantial tissue expansion during molting demand precise regulation of cell volume. As a key controller of ion flux and cell volume [2,37,38], LvSlc12A2 is well positioned to meet these demands. Moreover, its capacity to influence key metabolic pathways—such as by limiting mTORC1 activity [39]—suggests it could directly shape the cellular states required for both sustained tissue growth and successful molting. We therefore propose that LvSlc12A2 functions not merely as a housekeeping ion transporter, but as a strategic regulatory node, integrating fundamental cellular physiology with high-level developmental signals from LvMstn and LvMIH to ensure balanced and efficient growth in shrimp.

4.3. LvSlc12A2 Biological Function in the Growth and Development of L. vannamei

This study reveals for the first time that the ion transporter LvSlc12A2 plays a dual role in L. vannamei, acting as a crucial node that links osmoregulation with growth control. The LvAqp (aquaporin) family comprises small and very hydrophobic intrinsic membrane proteins with functions such as water transport, cell osmotic regulation, osmotic stress response, and selective ion osmosis [40]. Our results demonstrate an inverse relationship between LvSlc12A2 and the aquaporin gene LvAqp, which is consistent with the function of SLC12 family members in managing ion gradients that influence cellular water balance and trigger compensatory expression of aquaporins under osmotic stress. Most studies have found that changes in osmotic pressure can regulate gene expression in tissues [41]. For example, NKCC in Eriocheir sinensis responds rapidly to external osmotic changes [42]. Interfering with LvAqp1 expression reduces water transport in the gills, resulting in an osmotic difference between the inside and outside of cells; while promoting NKCC upregulates the gill Na+/K+-ATP gene, facilitating excess ion excretion [43]. Therefore, altering LvSlc12A2 expression may change osmotic pressure and affect LvAqp expression, suggesting its role in osmoregulation. Concurrently, we found a positive correlation between the expression of LvSlc12A2 and the growth-inhibiting genes LvMstn and LvMIH. RNAi-mediated suppression of LvSlc12A2 reduced their expression, whereas its overexpression significantly increased their levels in both gill and muscle tissues. Collectively, these findings suggest that LvSlc12A2 is not just a housekeeping transporter but a key signal integrator, capable of translating physiological stress signals, such as osmotic shifts, into commands that modulate the pace of growth and molting.
A key observation from our time-course analysis is the tissue-specific dynamics of this regulation, with muscle tissue exhibiting a more pronounced response to LvSlc12A2 modulation compared to the gills. For instance, both overexpression and knockdown elicited a much larger fold-change in LvMstn expression in muscle tissue (Figure 2C,E vs. Figure 3C,E), following overexpression, while LvMstn expression increased significantly in both tissues at 6 h, the change in muscle tissue was 6.6-fold, relative to the control, and in the gills, it was only 1.4-fold, highlighting muscle as a more sensitive target of this pathway. A similar trend was observed for LvMIH (Figure 2D,F vs. Figure 3D,F). The most striking tissue-specific phenomenon was the late-stage response of LvMIH in muscle. While overexpression led to a sustained high level of LvMIH, the knockdown condition produced an unexpected, significant upregulation at 72 h (Figure 2F). We hypothesize that Prolonged ionic imbalance may trigger a neuroendocrine feedback loop that activates LvMIH expression to restore homeostatic control over the vital molting cycle, a complex reaction not observed in the more rapidly compensating gill tissue. Another possibility is that environmental fluctuations induced stress responses, as suggested by Figure 3, which shows gene expression variability at different time points in both experimental and control groups. Such variation may reflect stress-induced self-protective or tissue-repair signaling in shrimp.
Our findings also contribute to the ongoing debate regarding the precise role of myostatin (Mstn) in crustacean growth. LvMstn, a myostatin gene, regulates muscle growth mainly via the TGF-β/Smad and PI3K-AKT-mTOR pathways, acting as a negative regulator of muscle differentiation, growth, and protein synthesis, and has been shown to inhibit growth in most crustaceans [44,45]. Some studies have also shown that LvMstn has a positive regulatory effect on muscle growth during the molting cycle (e.g., in L. vannamei), and the growth rate can be slowed down after inhibiting LvMstn expression [18,46,47]. Nevertheless, some research also suggests that LvMstn negatively regulates the growth of L. vannamei [48], and it still remains unclear whether LvMstn is a positive or negative regulator of crustacean muscle growth [49]. In Penaeus monodon, the RNAi-mediated knockdown of PmMstn resulted in significantly slower growth relative to the control group, suggesting that PmMstn may play a positive regulatory role in growth [34]. In Fenneropenaeus merguiensis, elevated FmMstn expression was seen in smaller individuals of the same age group, indicating its possible negative regulatory role in muscle development [50]. In Fenneropenaeus chinensis, about 20–30% of the individuals in the dsRNA-injected group molted after injection at about 12 h, indicating that down-regulated of FcMstn can increase the molt for growth [51]. LvMIH is a molting-inhibiting hormone belonging to the crustacean hyperglycemic hormone (CHH) family of neuropeptides, which negatively regulate the molting growth of crustaceans by inhibiting ecdysone synthesis in the Y-organs [52]. In this study, we showed that after interfering or overexpressing LvSlc12A2, LvMstn and LvMIH showed similar expression patterns, which is reasonable since these genes are related to the molting cycle [35,53]. Our findings reveal that the analogous expression patterns of LvMstn and LvMIH imply a shared functionality in growth regulation. We have also demonstrated that LvMstn, pivotal for muscle growth and development, likely acts as a negative regulator of growth in shrimp, mirroring its conserved function in vertebrates. We speculate that the up-regulation or down-regulation of LvSlc12A2 may inhibit or activate the pathways where LvMstn and LvMIH genes are located, in turn, changing their levels of expression. Our results show that the three factors likely play a synergistic role in the growth and development of L. vannamei, jointly regulating its growth.
While our molecular data provide compelling evidence for this regulatory network, a limitation of this study is that we did not directly measure the resulting growth phenotypes. Based on our findings, we hypothesize that elevated basal expression of LvSlc12A2 would correlate with slower growth, possibly indicating that there was an abnormal or stressed physiological state in the shrimp. This hypothesis is consistent with observations in other biological systems where low level of expression of LvSlc12A2 homologs (NKCC1) is characteristic of normal, mature physiology [37]. Therefore, future research should not only validate the phenotype link but also identify the upstream factors that cause variations in LvSlc12A2 expression. Potential mechanisms warranting investigation include epigenetic regulation, such as DNA methylation, which has been shown to control SLC12A expression [34,40]. Furthermore, given the established roles of the SLC12A family in neurodevelopment and injury response [54], it is plausible that the shrimp’s neurological health could also contribute to LvSlc12A2 dysregulation and consequently affect growth. Elucidating these upstream pathways holds significant potential for developing novel biomarkers for selecting robust and fast-growing shrimp in aquaculture.

5. Conclusions

In this study, we detected the expression of LvSlc12A2, LvMstn, and LvMIH genes in various tissues by real-time fluorescence quantification, and measured the expression of LvAqp, LvMstn, and LvMIH in gill and muscle tissues at different time points after overexpression and interference. We found that LvSlc12A2 was highly expressed in gill tissues, LvMstn was expressed in the heart, and LvMIH was expressed in the ventral nerve. Our in situ hybridization results showed that the gene was mainly expressed in gill epithelial cells and in the stratum corneum. The relative expression of LvAqp decreased significantly and LvMstn and LvMIH expression increased significantly after the overexpression of the LvSlc12A2 gene. The converse was also true in that after LvSlc12A2 interference, the relative expression of LvAqp increased significantly and the relative expressions of LvMstn and LvMIH decreased significantly. Although the specific regulatory mechanisms remain unknown, our results indicate that LvSlc12A2 negatively regulates the growth of L. vannamei.

Author Contributions

Conceptualization, M.L. and S.C.; methodology, P.N., J.K., K.L. and S.J.; validation, X.M.; formal analysis, S.L.; investigation, P.N.; resources, J.K.; data curation, Q.Z.; writing—original draft preparation, P.N.; writing—review and editing, H.G.; supervision, K.L.; resources and editing, Q.X. funding acquisition, H.G. All authors have read and agreed to the published version of the manuscript.

Funding

This research was funded by The National Key R&D Program of China (No. 2022YFD2400201).

Institutional Review Board Statement

Ethical approval was not required for the use of invertebrate species in this study.

Informed Consent Statement

Not applicable.

Data Availability Statement

The original contributions made in this study are contained within the article; any additional inquiries can be directed to the corresponding authors.

Conflicts of Interest

Qun Xing are affiliated with BLUP Aquabreed Co., Ltd. However, this study was conducted independently, and there are no conflicts of interest related to this work. The research does not involve any company products, and no commercial or financial benefits are expected from this publication The remaining authors declare that the research was conducted in the absence of any commercial or financial relationships that could be construed as a potential conflict of interest.

References

  1. Schwartz, A.L.; Dickerson, E.; Dagia, N.; Malgor, R.; McCall, K.D. TLR signaling inhibitor, phenylmethimazole, in combination with tamoxifen inhibits human breast cancer cell viability and migration. Oncotarget 2016, 8, 113295–113302. [Google Scholar] [CrossRef] [PubMed]
  2. Arroyo, J.P.; Kahle, K.T.; Gamba, G. The SLC12 family of electroneutral cation-coupled chloride cotransporters. Mol. Asp. Med. 2013, 34, 288–298. [Google Scholar] [CrossRef]
  3. Hebert, S.C.; Mount, D.B.; Gamba, G. Molecular physiology of cation-coupled Cl− cotransport: The SLC12 family. Pflügers Arch. 2004, 447, 580–593. [Google Scholar] [CrossRef]
  4. Delpire, E.; Mount, D.B. Human and murine phenotypes associated with defects in cation-chloride cotransport. Annu. Rev. Physiol. 2002, 64, 803–843. [Google Scholar] [CrossRef]
  5. Gamba, G. Molecular physiology and pathophysiology of electroneutral cation-chloride cotransporters. Physiol. Rev. 2005, 85, 423–493. [Google Scholar] [CrossRef]
  6. Xu, J.C.; Lytle, C.; Zhu, T.T.; Payne, J.A.; Benz Jr, E.; Forbush, B., 3rd. Molecular cloning and functional expression of the bumetanide-sensitive Na-K-Cl cotransporter. Proc. Natl. Acad. Sci. USA 1994, 91, 2201–2205. [Google Scholar] [CrossRef]
  7. Park, J.H.; Saier, M.H., Jr. Phylogenetic, structural and functional characteristics of the Na-K-Cl cotransporter family. J. Membr. Biol. 1996, 149, 161–168. [Google Scholar] [CrossRef]
  8. Motoshima, T.; Nagashima, A.; Ota, C.; Oka, H.; Hosono, K.; Braasch, I.; Nishihara, H.; Kato, A. Na+/Cl− cotransporter 2 is not fish-specific and is widely found in amphibians, non-avian reptiles, and select mammals. Physiol. Genom. 2023, 55, 113–131. [Google Scholar] [CrossRef] [PubMed]
  9. Virtanen, M.A.; Uvarov, P.; Hübner, C.A.; Kaila, K. NKCC1, an elusive molecular target in brain development: Making sense of the existing data. Cells 2020, 9, 2607. [Google Scholar] [CrossRef]
  10. Gagnon, É.; Forbush, B.; Caron, L.; Isenring, P. Functional comparison of renal Na-K-Cl cotransporters between distant species. Am. J. Physiol. Cell Physiol. 2003, 284, C365–C370. [Google Scholar] [CrossRef] [PubMed]
  11. Zhou, Y.Y.; Sun, W.; Chen, N.; Xu, C.; Wang, X.X.; Dong, K.; Zhang, B.X.; Zhang, J.; Hao, N.; Sun, A.; et al. Discovery of NKCC1 as a potential therapeutic target to inhibit hepatocellular carcinoma cell growth and metastasis. Oncotarget 2017, 8, 66328. [Google Scholar] [CrossRef]
  12. Chen, Y.G.; Yuan, K.; Zhang, Z.Z.; Yuan, F.H.; Wen, S.P.; Yue, H.T.; He, J.G.; Chen, Y.H. Identification and functional characterization of a solute carrier family 15, member 4 gene in Litopenaeus vannamei. Dev. Comp. Immunol. 2016, 57, 57–66. [Google Scholar] [CrossRef]
  13. Peng, M.; Zeng, D.G.; Zhu, W.L.; Chen, X.L.; Yang, C.L.; Liu, Q.Y.; Li, Q.Y.; Wang, H.W.; Liu, H.; Liang, J.Z.; et al. Construction of a high-density genetic map and identification of quantitative trait loci for nitrite tolerance in the Pacific white shrimp (Litopenaeus vannamei). Front. Genet. 2020, 11, 571880. [Google Scholar] [CrossRef] [PubMed]
  14. Wang, W.; Chen, J.L.; Chen, Y.; Pan, C.K.; Lin, Z.Y.; Chen, J.M. WSV056-mediated downregulation of PvSMCT1 contributes to immune evasion of white spot syndrome virus in the infection of Penaeus vannamei. Aquaculture 2023, 563, 739010. [Google Scholar] [CrossRef]
  15. Li, X.N.; Dai, X.L. Characterization and functional analysis of Litopenaeus vannamei Na+/K+/2Cl cotransporter 1 under nitrite stress. Comp. Biochem. Physiol. Part A Mol. Integr. Physiol. 2024, 298, 111749. [Google Scholar] [CrossRef]
  16. Cao, Z.; Chen, C.Y.; Wang, C.X.; Li, T.; Chang, L.R.; Si, L.J.; Yan, D.C. Enterocytozoon hepatopenaei (EHP) infection alters the metabolic processes and induces oxidative stress in Penaeus vannamei. Animals 2023, 13, 3661. [Google Scholar] [CrossRef]
  17. Hua, S.S.; Li, W.Y.; Zheng, D.W.; Zhou, X.Y.; Zhang, S.C.; Zhang, H.M.; Liu, X.; Baloch, W.A.; Yan, B.L.; Gao, H. The proliferating cell nuclear antigen gene (pcna) plays a key role in ovarian development in the ridgetail white prawn, Exopalaemon carinicauda. Aquac. Rep. 2024, 36, 102170. [Google Scholar] [CrossRef]
  18. Qian, Z.Y.; Mi, X.; Wang, X.Z.; He, S.L.; Liu, Y.J.; Hou, F.J.; Liu, Q.; Liu, X.L. cDNA cloning and expression analysis of myostatin/GDF11 in shrimp, Litopenaeus vannamei. Comp. Biochem. Physiol. Part A Mol. Integr. Physiol. 2013, 165, 30–39. [Google Scholar] [CrossRef]
  19. Zuo, H.L.; Yuan, J.; Niu, S.W.; Yang, L.W.; Weng, S.P.; He, J.G.; Xu, X.P. A molting-inhibiting hormone-like protein from Pacific white shrimp Litopenaeus vannamei is involved in immune responses. Fish Shellfish Immunol. 2018, 72, 544–551. [Google Scholar] [CrossRef]
  20. Xian, Y.F.; Duan, Y.F.; Wei, Z.K.; Zhu, X.Y.; Huang, J.H.; Zhang, J.S. Effects of nitrite and microplastic stress on immune, detoxification metabolism and osmoregulation-related indicators in gills of Litopenaeus vannamei. S. China Fish. Sci. 2023, 19, 70–77. [Google Scholar] [CrossRef]
  21. Schmittgen, T.D.; Livak, K.J. Analyzing real-time PCR data by the comparative CT method. Nat. Protoc. 2008, 3, 1101–1108. [Google Scholar] [CrossRef]
  22. Cutler, C.P.; Cramb, G. Differential expression of absorptive intestinal and renal tissues of the cation-chloride-cotransporters in the European eel (Anguilla anguilla). Comp. Biochem. Physiol. B-Biochem. Mol. Biol. 2008, 149, 63–73. [Google Scholar] [CrossRef]
  23. Yang, W.K.; Wu, Y.C.; Tang, C.H.; Lee, T.H. Microtubule-dependent changes in morphology and localization of chloride transport proteins in gill mitochondria-rich cells of the tilapia, Oreochromis mossambicus. J. Morphol. 2016, 277, 1113–1122. [Google Scholar] [CrossRef]
  24. Liu, H.T.; Wang, J.; Mao, Y.; Qiao, Y.; Zhong, S.P.; Su, Y.Q. Molecular cloning and expression anaysis of Na-K-2CI cotransporter from Marsupenaeus japonicus. J. Xiamen Univ. Nat. Sci. 2016, 55, 46–54. [Google Scholar] [CrossRef]
  25. Wang, W.H.; Dong, H.B.; Sun, Y.X.; Sun, C.Y.; Duan, Y.F.; Gu, Q.H.; Li, Y.; Xie, M.J.; Zhang, J.S. (Immune and physiological responses of juvenile Chinese sea bass (Lateolabrax maculatus) to eugenol and tricaine methanesulfonate (MS-222) in gills. Aquac. Rep. 2020, 18, 100554. [Google Scholar] [CrossRef]
  26. Freire, C.A.; Onken, H.; McNamara, J.C. A structure–function analysis of ion transport in crustacean gills and excretory organs. Comp. Biochem. Physiol. Part A Mol. Integr. Physiol. 2008, 151, 272–304. [Google Scholar] [CrossRef]
  27. Hediger, M.A.; Romero, M.F.; Peng, J.B.; Rolfs, A.; Takanaga, H.; Bruford, E.A. The ABCs of solute carriers: Physiological, pathological and therapeutic implications of human membrane transport proteins: Introduction. Pflügers Arch. 2004, 447, 465–468. [Google Scholar] [CrossRef]
  28. O’grady, S.M.; Palfrey, H.C.; Field, M. Characteristics and functions of Na-K-Cl cotransport in epithelial tissues. Am. J. Physiol. Cell Physiol. 1987, 253, C177–C192. [Google Scholar] [CrossRef]
  29. Payne, J.A.; Forbush III, B. Molecular characterization of the epithelial Na K Cl cotransporter isoforms. Curr. Opin. Cell Biol. 1995, 7, 493–503. [Google Scholar] [CrossRef]
  30. Palfrey, C.; O’Donnell, M.E. Characteristics and regulation of the Na/K/2CI cotransporter. Cell. Physiol. Biochem. 1992, 2, 293–307. [Google Scholar] [CrossRef]
  31. Pan, L.Q.; Liu, H.Y. Advances in the physiology of osmotic regulation in crustaceans. J. Fish. China 2005, 29, 109–114. [Google Scholar]
  32. Fu, X.Y.; Sun, J.Q.; Lv, J.; Shi, R.L. Research progress on Na+-K+-2Cl-cotransporter 1 and its relationship to nervous system diseases. Chin. J. Contemp. Neurol. Neurosurg. 2021, 21, 223. [Google Scholar] [CrossRef]
  33. Plotkin, M.D.; Kaplan, M.R.; Peterson, L.N.; Gullans, S.R.; Hebert, S.C.; Delpire, E. Expression of the Na (+)-K (+)-2Cl-cotransporter BSC2 in the nervous system. Am. J. Physiol. Cell Physiol. 1997, 272, C173–C183. [Google Scholar] [CrossRef] [PubMed]
  34. De Santis, C.; Wade, N.M.; Jerry, D.R.; Preston, N.P.; Glencross, B.D.; Sellars, M.J. Growing backwards: An inverted role for the shrimp ortholog of vertebrate myostatin and GDF11. Am. J. Physiol. Cell Physiol. 2011, 214, 2671–2677. [Google Scholar] [CrossRef]
  35. Covi, J.A.; Kim, H.W.; Mykles, D.L. Expression of alternatively spliced transcripts for a myostatin-like protein in the blackback land crab, Gecarcinus lateralis. Comp. Biochem. Physiol. Part A Mol. Integr. Physiol. 2008, 150, 423–430. [Google Scholar] [CrossRef]
  36. Kim, K.S.; Kim, Y.-J.; Jeon, J.M.; Kang, Y.S.; Kang, Y.S.; Oh, C.W.; Kim, H.-W. Molecular characterization of myostatin-like genes expressed highly in the muscle tissue from Morotoge shrimp, Pandalopsis japonica. Aquac. Res. 2010, 41, e862–e871. [Google Scholar] [CrossRef]
  37. Zhang, S.Q.; Liu, Y.; Zhou, J.; Wang, J.X.; Jin, G.Y.; Wang, X.D. Breast cancer vaccine containing a novel toll-like receptor 7 agonist and an aluminum adjuvant exerts antitumor effects. Int. J. Mol. Sci. 2022, 23, 15130. [Google Scholar] [CrossRef]
  38. Engberink, A.O.; Meijer, J.H.; Michel, S. Chloride cotransporter KCC2 is essential for GABAergic inhibition in the SCN. Neuropharmacology 2018, 138, 80–86. [Google Scholar] [CrossRef] [PubMed]
  39. Demian, W.L.; Persaud, A.; Jiang, C.; Coyaud, É.; Liu, S.X.; Kapus, A.; Kafri, R.; Raught, B.; Rotin, D. The ion transporter NKCC1 links cell volume to cell mass regulation by suppressing mTORC1. Cell Rep. 2019, 27, 1886–1896. [Google Scholar] [CrossRef]
  40. Giffard-Mena, I.; Boulo, V.; Aujoulat, F.; Flicoteaux, R.; Lorin-Nebel, C.; Charmantier, G. Aquaporin Molecular Characterization in the Sea-Bass (Dicentrarchus labrax): The Effect of Salinity on AQP1 and AQP3 Expression. Comp. Biochem. Physiol. A Mol. Integr. Physiol. 2007, 148, 430–444. [Google Scholar] [CrossRef] [PubMed]
  41. Liao, Y.L.; Zhang, C.J.; Gao, Q.X.; Peng, S.M.; Shi, Z.H. New insights into ionocytes and ion channles. Mar. Fish. 2015, 37, 77–86. [Google Scholar] [CrossRef]
  42. Yang, Z.G.; Zhou, J.Y.; Zhu, L.L.; Cheng, Y.X.; Xia, D.M. Gene Cloning and Functional Analysis of Na+-K+-Cl- Contransporter from Eriocheir sinensis. J. Fudan Univ. (Nat. Sci.) 2021, 60, 84–92. [Google Scholar] [CrossRef]
  43. Yang, Z.G.; Zhang, L.; Chen, C.Y.; Cheng, Y.X.; Xia, D.M. Study on Cloning, Expression and RNA Interference of Aquaporin 1 Gene of Eriocheir sinensis. J. Fudan Univ. (Nat. Sci.) 2021, 60, 93–101. [Google Scholar] [CrossRef]
  44. Emerenciano, M.G.C.; Rombenso, A.N.; Vieira, F.D.N.; Martins, M.A.; Coman, G.J.; Truong, H.H.; Noble, T.H.; Simon, C.J. Intensification of penaeid shrimp culture: An applied review of advances in production systems, nutrition and breeding. Animals 2022, 12, 236. [Google Scholar] [CrossRef]
  45. Xue, B.; Zhang, B.; Li, Z.H.; Zhao, L.; Tai, X.F.; Xu, Y.; Lai, X.F.; Gao, H.; Yan, B.L. Expression Profiles of Myostatin(MSTN) Gene in Different Tissues and at Different Post-molt Times in Exopalaemon carinicadua. J. Huaihai Inst. Technol. (Nat. Sci. Ed.) 2016, 25, 66–70. [Google Scholar]
  46. Lee, J.H.; Momani, J.; Kim, Y.M.; Kang, C.K.; Choi, J.H.; Baek, H.J.; Kim, H.W. Effective RNA-silencing strategy of Lv-MSTN/GDF11 gene and its effects on the growth in shrimp, Litopenaeus vannamei. Comp. Biochem. Physiol. Part B Biochem. Mol. Biol. 2015, 179, 9–16. [Google Scholar] [CrossRef] [PubMed]
  47. Mykles, D.L. Crustacean muscle plasticity: Molecular mechanisms determining mass and contractile properties. Comp. Biochem. Physiol. Part B Biochem. Mol. Biol. 1997, 117, 367–378. [Google Scholar] [CrossRef] [PubMed]
  48. Qian, Z.Y. Isolation, Identification, Expression and Function Studies of Growth Performance Candidate Genes in Litopenaeus vannamei. Ph.D. Thesis, Northwest A&F University, Yangling, China, 2014. [Google Scholar]
  49. Wang, J.; Li, J.; Ge, Q.; Li, J. A potential negative regulation of myostatin in muscle growth during the intermolt stage in Exopalaemon carinicauda. Gen. Comp. Endocrinol. 2021, 314, 113902. [Google Scholar] [CrossRef]
  50. Zhuo, R.Q.; Zhou, T.T.; Yang, S.P.; Chan, S.F. Characterization of a Molt-Related Myostatin Gene (FmMstn) from the Banana Shrimp Fenneropenaeus merguiensis. Gen. Comp. Endocrinol. 2017, 248, 55–68. [Google Scholar] [CrossRef] [PubMed]
  51. Yan, Y.; Lu, X.; Kong, J.; Meng, X.; Luan, S.; Dai, P.; Chen, B.; Cao, B.; Luo, K. Molecular Characterization of Myostatin and Its Inhibitory Function on Myogenesis and Muscle Growth in Chinese Shrimp, Fenneropenaeus chinensis. Gene 2020, 758, 144986. [Google Scholar] [CrossRef]
  52. Chen, H.Y.; Toullec, J.Y.; Lee, C.Y. The crustacean hyperglycemic hormone superfamily: Progress made in the past decade. Front. Endocrinol. 2020, 11, 578958. [Google Scholar] [CrossRef] [PubMed]
  53. Kim, B.K.; Kim, K.S.; Oh, C.W.; Mykles, D.L.; Lee, S.G.; Kim, H.J.; Kim, H.W. Twelve actin-encoding cDNAs from the American lobster, Homarus americanus: Cloning and tissue expression of eight skeletal muscle, one heart, and three cytoplasmic isoforms. Comp. Biochem. Physiol. Part B Biochem. Mol. Biol. 2009, 153, 178–184. [Google Scholar] [CrossRef] [PubMed]
  54. Lee, H.A.; Hong, S.H.; Kim, J.W.; Jang, I.S. Possible involvement of DNA methylation in NKCC1 gene expression during postnatal development and in response to ischemia. J. Neurochem. 2010, 114, 520–529. [Google Scholar] [CrossRef] [PubMed]
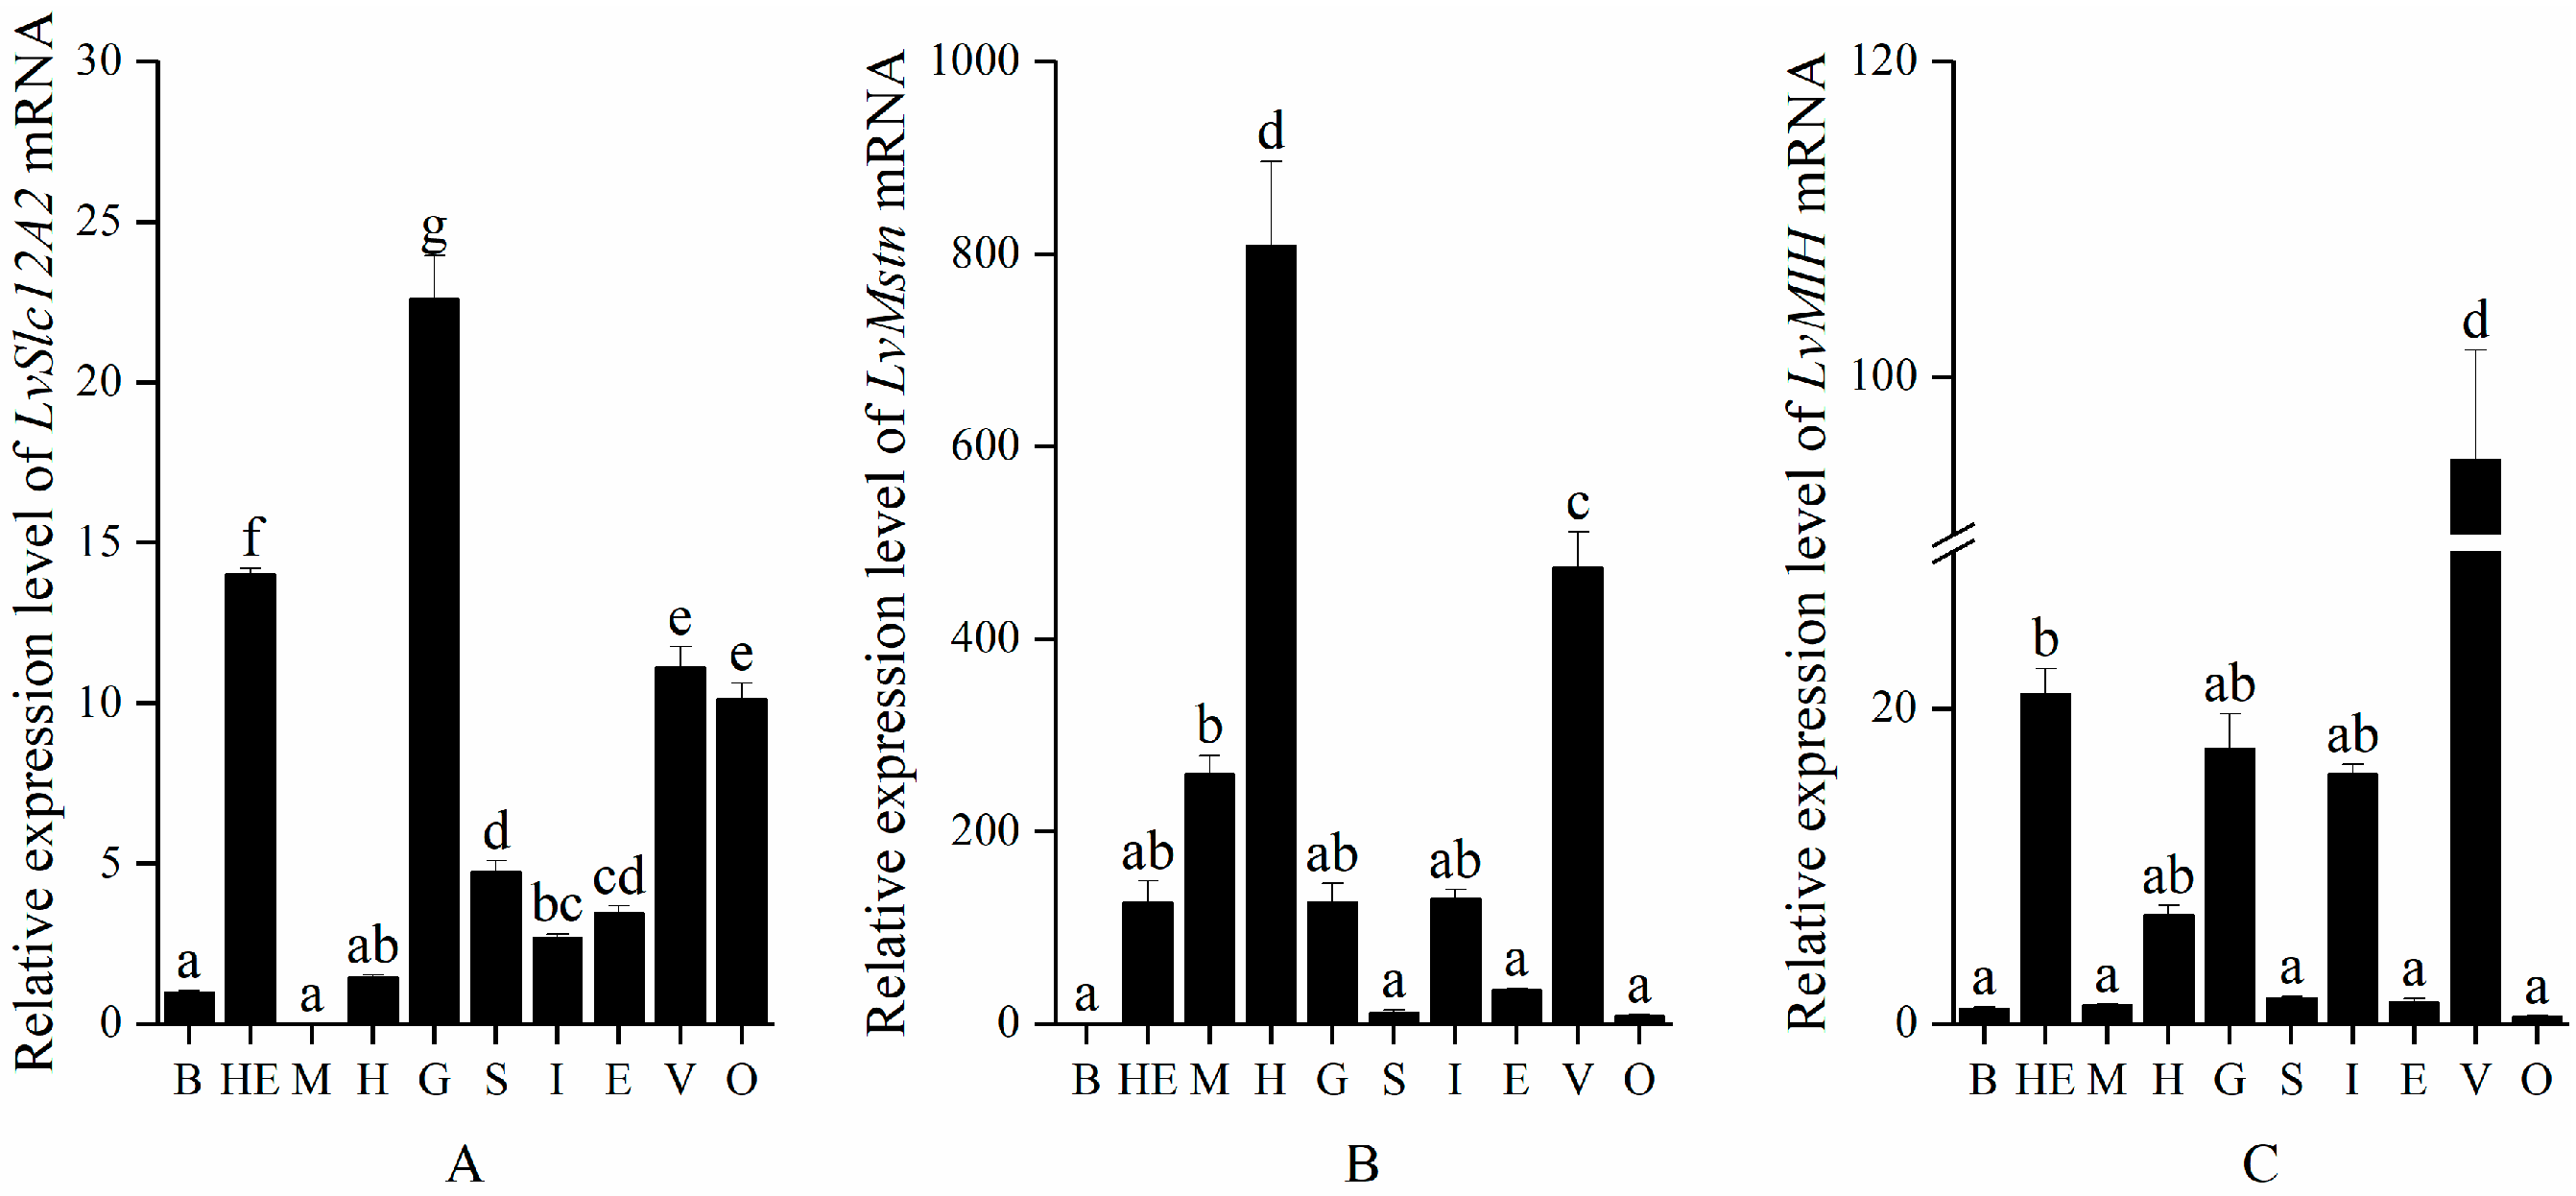
Figure 1. Expression characteristics of genes in different tissues of L. vannamei. (A) Expression of LvSlc12A2 in various tissues of L. vannamei; (B) expression of LvMstn in various tissues of L. vannamei; (C) expression of LvMIH in various tissues of L. vannamei. Note: B: Blood; HE: hepatopancreas; M: muscle; H: heart; G: gill; S: stomach; I: intestine; E: eyestalk; V: ventral nerve; O: ovary. Data are presented as mean ± SEM (n = 3). Different lowercase letters above the bars indicate significant differences among treatments (one-way ANOVA followed by LSD multiple range test, p < 0.05).
Animals 15 02467 g001
Figure 2. Relative expression levels of each gene at different time points after overexpression of LvSlc12A2. (A) Expression levels of LvSlc12A2 in gills after overexpression treatment; (B) expression levels of LvAqp in gills after overexpression treatment; (C) expression levels of LvMstn in gills after overexpression treatment; (D) expression levels of LvMIH in gills after overexpression treatment; (E) LvMstn expression levels in muscle after overexpression treatment; (F) LvMIH expression levels in muscle after overexpression treatment. Data are presented as mean ± SD (n = 3). The asterisk (*) indicates a significant difference between the two groups (repeated measure two-way ANOVA followed by Bonferroni post hoc tests for multiple comparisons, p < 0.05).
Animals 15 02467 g002
Figure 3. Relative expression levels of each gene at different time points after knockdown LvSlc12A2. Notes: (A) expression levels of LvSlc12A2 in gills after RNAi treatment; (B) LvAqp expression levels in gills after RNAi treatment; (C) expression levels of LvMstn in gill tissues after RNAi treatment; (D) expression levels of LvMIH in gills after RNAi treatment; (E) LvMstn expression levels in muscle after RNAi treatment; (F) LvMIH expression levels in muscle after RNAi treatment. Data are presented as mean ± SD (n = 3). The asterisk (*) indicates a significant difference between the two groups (repeated measure two-way ANOVA followed by Bonferroni post hoc tests for multiple comparisons, p < 0.05).
Animals 15 02467 g003
Figure 4. Spatial distribution of LvSlc12A2 mRNA in gill tissue of L. vannamei. (A) Localization results for the sense probe in gill tissue. (B) Localization results for the antisense probe in gill tissue of the control group. (C) The mRNA-LvSlc12A2 groups of the ISH assay. (D) The RNAi-LvSlc12A2 groups of the ISH assay. (E) Semi-quantitative ISH analysis showing the expression pattern of LvSlc12A2 in gill tissue. Note—a, epithelial cells; b, stratum corneum; c, nucleus. Data are presented as mean ± SEM (n = 3). Different lowercase letters above the bars indicate significant differences among treatments (one-way ANOVA followed by LSD multiple range test, p < 0.05).
Animals 15 02467 g004
Table 1. Sequence of oligonucleotide used in this study.
Primer NameSequencesGenbank Accession No.Length (bp)Efficiency (%)Purpose
18S-FTATACGCTAGTGGAGCTGGAAEU92096914792.1Internal reference
18S-RGGGGAGGTAGTGACGAAAAAT
LvMstn-FGGGACTTCATTGTTGCTCJQ045427.112097.62Real-time fluorescent
LvMstn-RCGCTGGTGCTATTCATCT quantitative
LvMIH-FAGCAGTTCAACAGGTGGATCAGMF358695.1123108.82
LvMIH-RAAGGAGCAGCAGGAGGAGAG
LvAqp-FGCAGCCATCTTGAAGGGAGTGACXM_070140003.112595.96
LvAqp-RACGAGGACGAAGGTGATGAGGAG
LvSlc12A2-FGACTCTCCTGCTGCCTTACATCCPQ07321112291.38
LvSlc12A2-RGGTTTGCCATGCTTCTCTGTTCC
S-A1GATCACTAATACGACTCACTATAGGGCAAACGTAATCAGTCTGCTGGTCAGTT 25 RNA interference
S-A2AACTGACCAGCAGACTGATTACGTTTGCCCTATAGTGAGTCGTATTAGTGATC
S-B1GATCACTAATACGACTCACTATAGGGCTGA CCAGCAGACTGATTACGTTTGTT
S-B2AACAAACGTAATCAGTCTGCTGGTCA GCCCTATAGTGAGTCGTATTAGTGATC
Pspt18-SFGAGACCGGAATTCGAGCTCGGAACTCTACGGACCTCTTAGAGAACC 1056 Homologous recombination
Pspt18-SRGAATACAAGCTTGCATGCCTGCCGGTCACACTTAGCCCAATTTG
SP6-LvSlc12A2ATTTAGGTGACACTATAGAATACAAGCTTGCATGCCTGCCGGTCACACTTAGC 1073 In situ hybridization
T7--LvSlc12A2TAATACGACTCACTATAGGGAGACCGGAATTCGAGCTCGGAACTCTACGGACC 1075
Disclaimer/Publisher’s Note: The statements, opinions and data contained in all publications are solely those of the individual author(s) and contributor(s) and not of MDPI and/or the editor(s). MDPI and/or the editor(s) disclaim responsibility for any injury to people or property resulting from any ideas, methods, instructions or products referred to in the content.