


Pet, Pest, Profit: Patient! How Attitudes Toward Animals Among Veterinary Students in the Netherlands Differ According to Animal Categories and Student-Related Variables

Simple Summary
Abstract
1. Introduction
2. Materials and Methods
2.1. Study Design
2.2. Participants and Settings
2.3. Data Analysis
2.4. Outcomes of Interest
- (1)
- We measured the internal consistency of the Pet, Pest, and Profit Scale for the current research population with Cronbach’s alpha.
- (2)
- We tested the differences between the pet, pest, and profit scores with the Friedman test, a nonparametric alternative to the analysis of variance based on ranks, followed by a pairwise post hoc test with Bonferroni correction.
- (3)
- We tested whether the pet, pest, and profit scores differed depending on student-related variables (year of study, career choice, background, diet, and gender) with a one-way analysis of variance or, in the case of violated equal variance, a Kruskal–Wallis test, followed by an appropriate pairwise post hoc test with Bonferroni correction.
3. Results
3.1. Reliability of Pet, Pest, and Profit Subscales
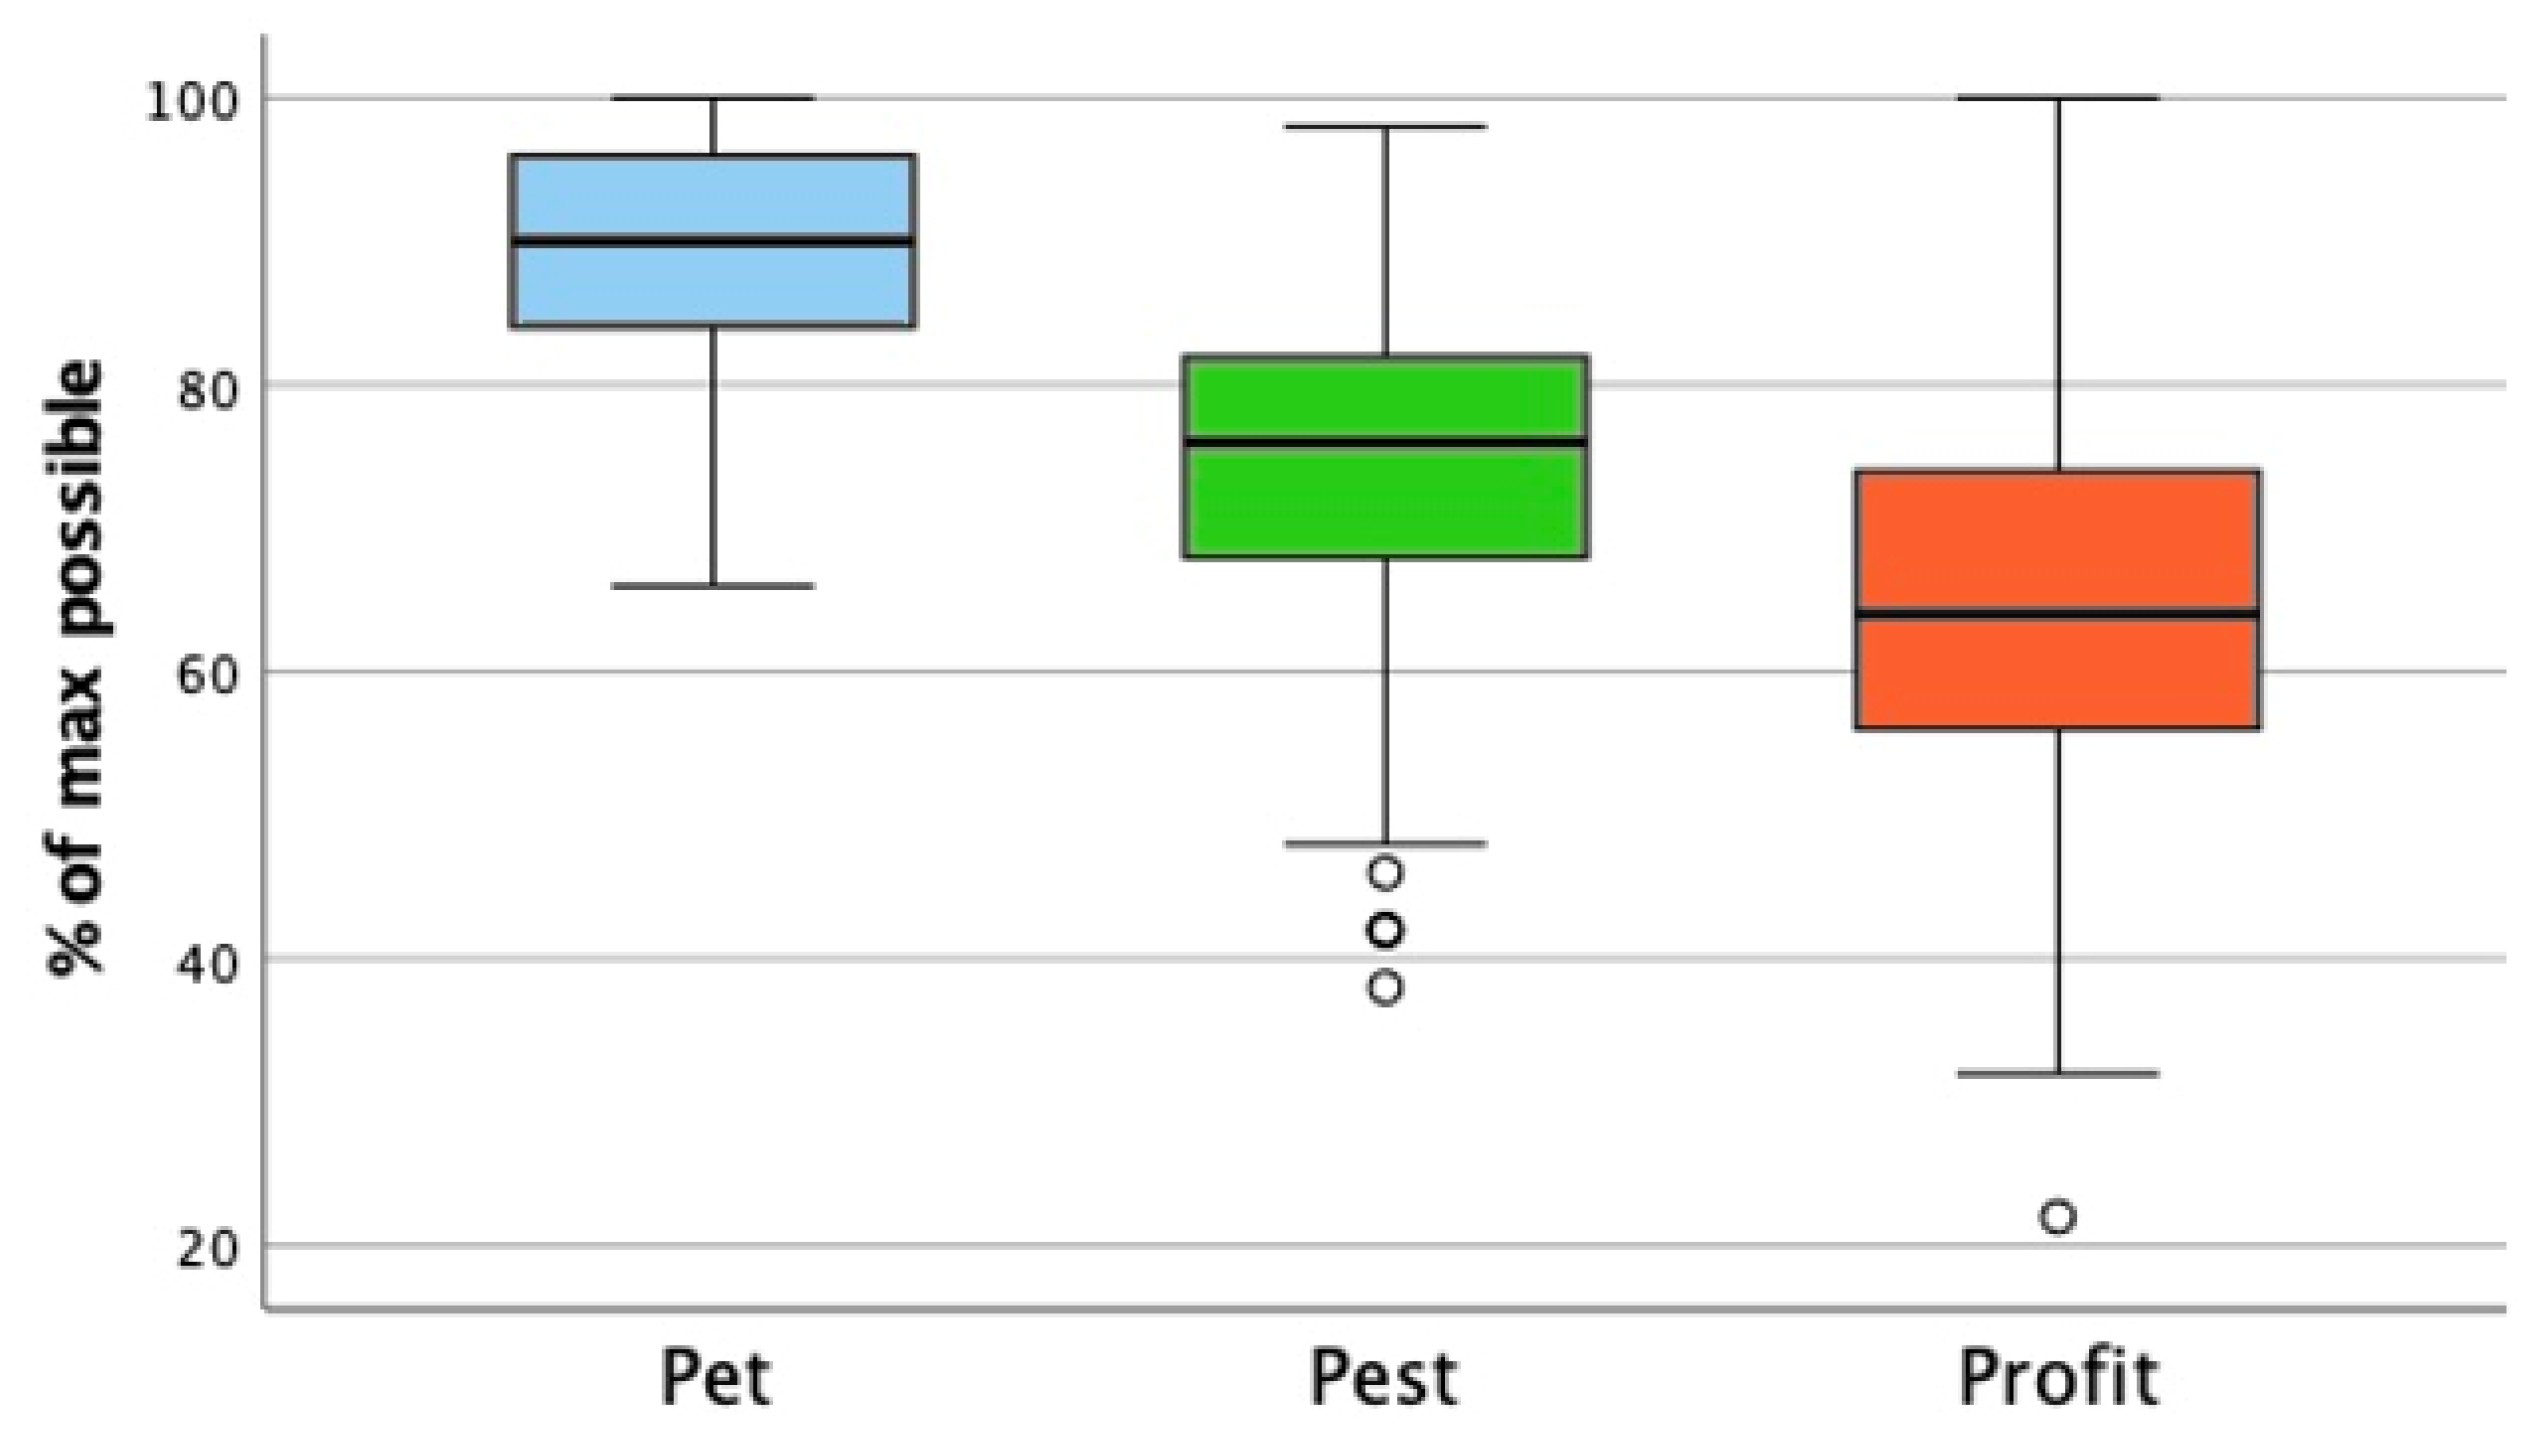
3.2. Attitude Toward Animals Scores for Pet, Pest, and Profit Categories
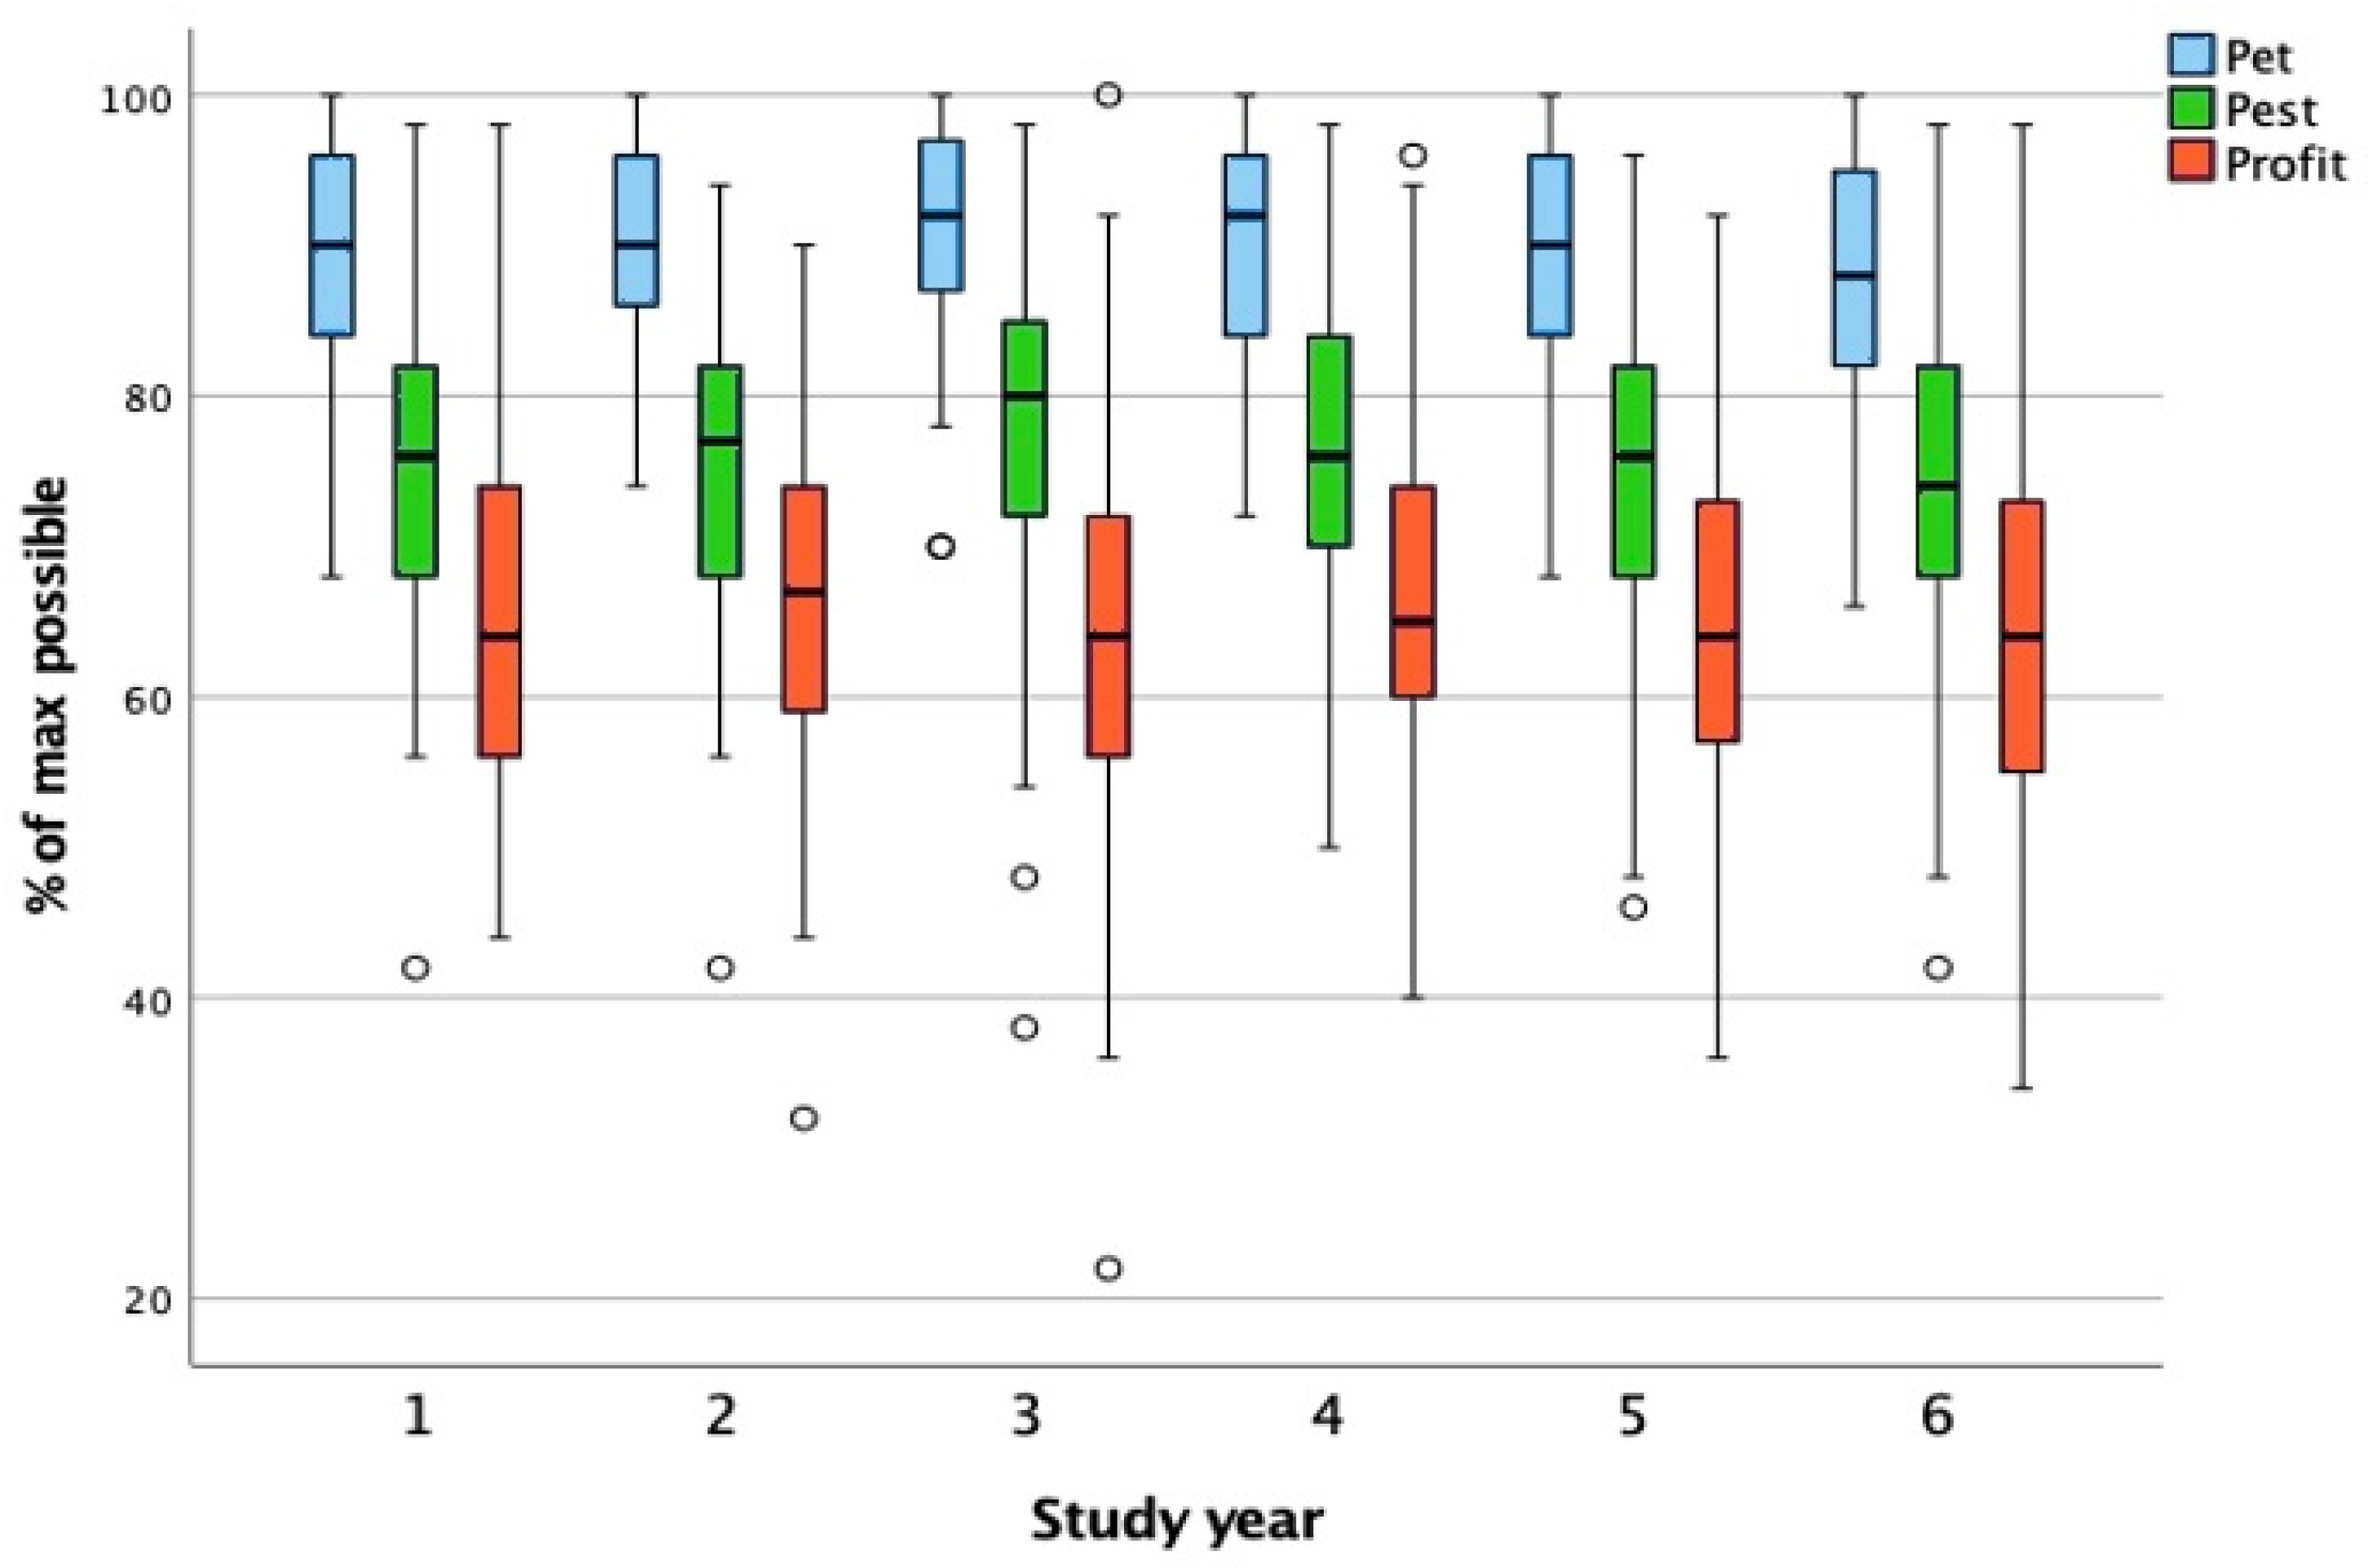
3.3. Study Year
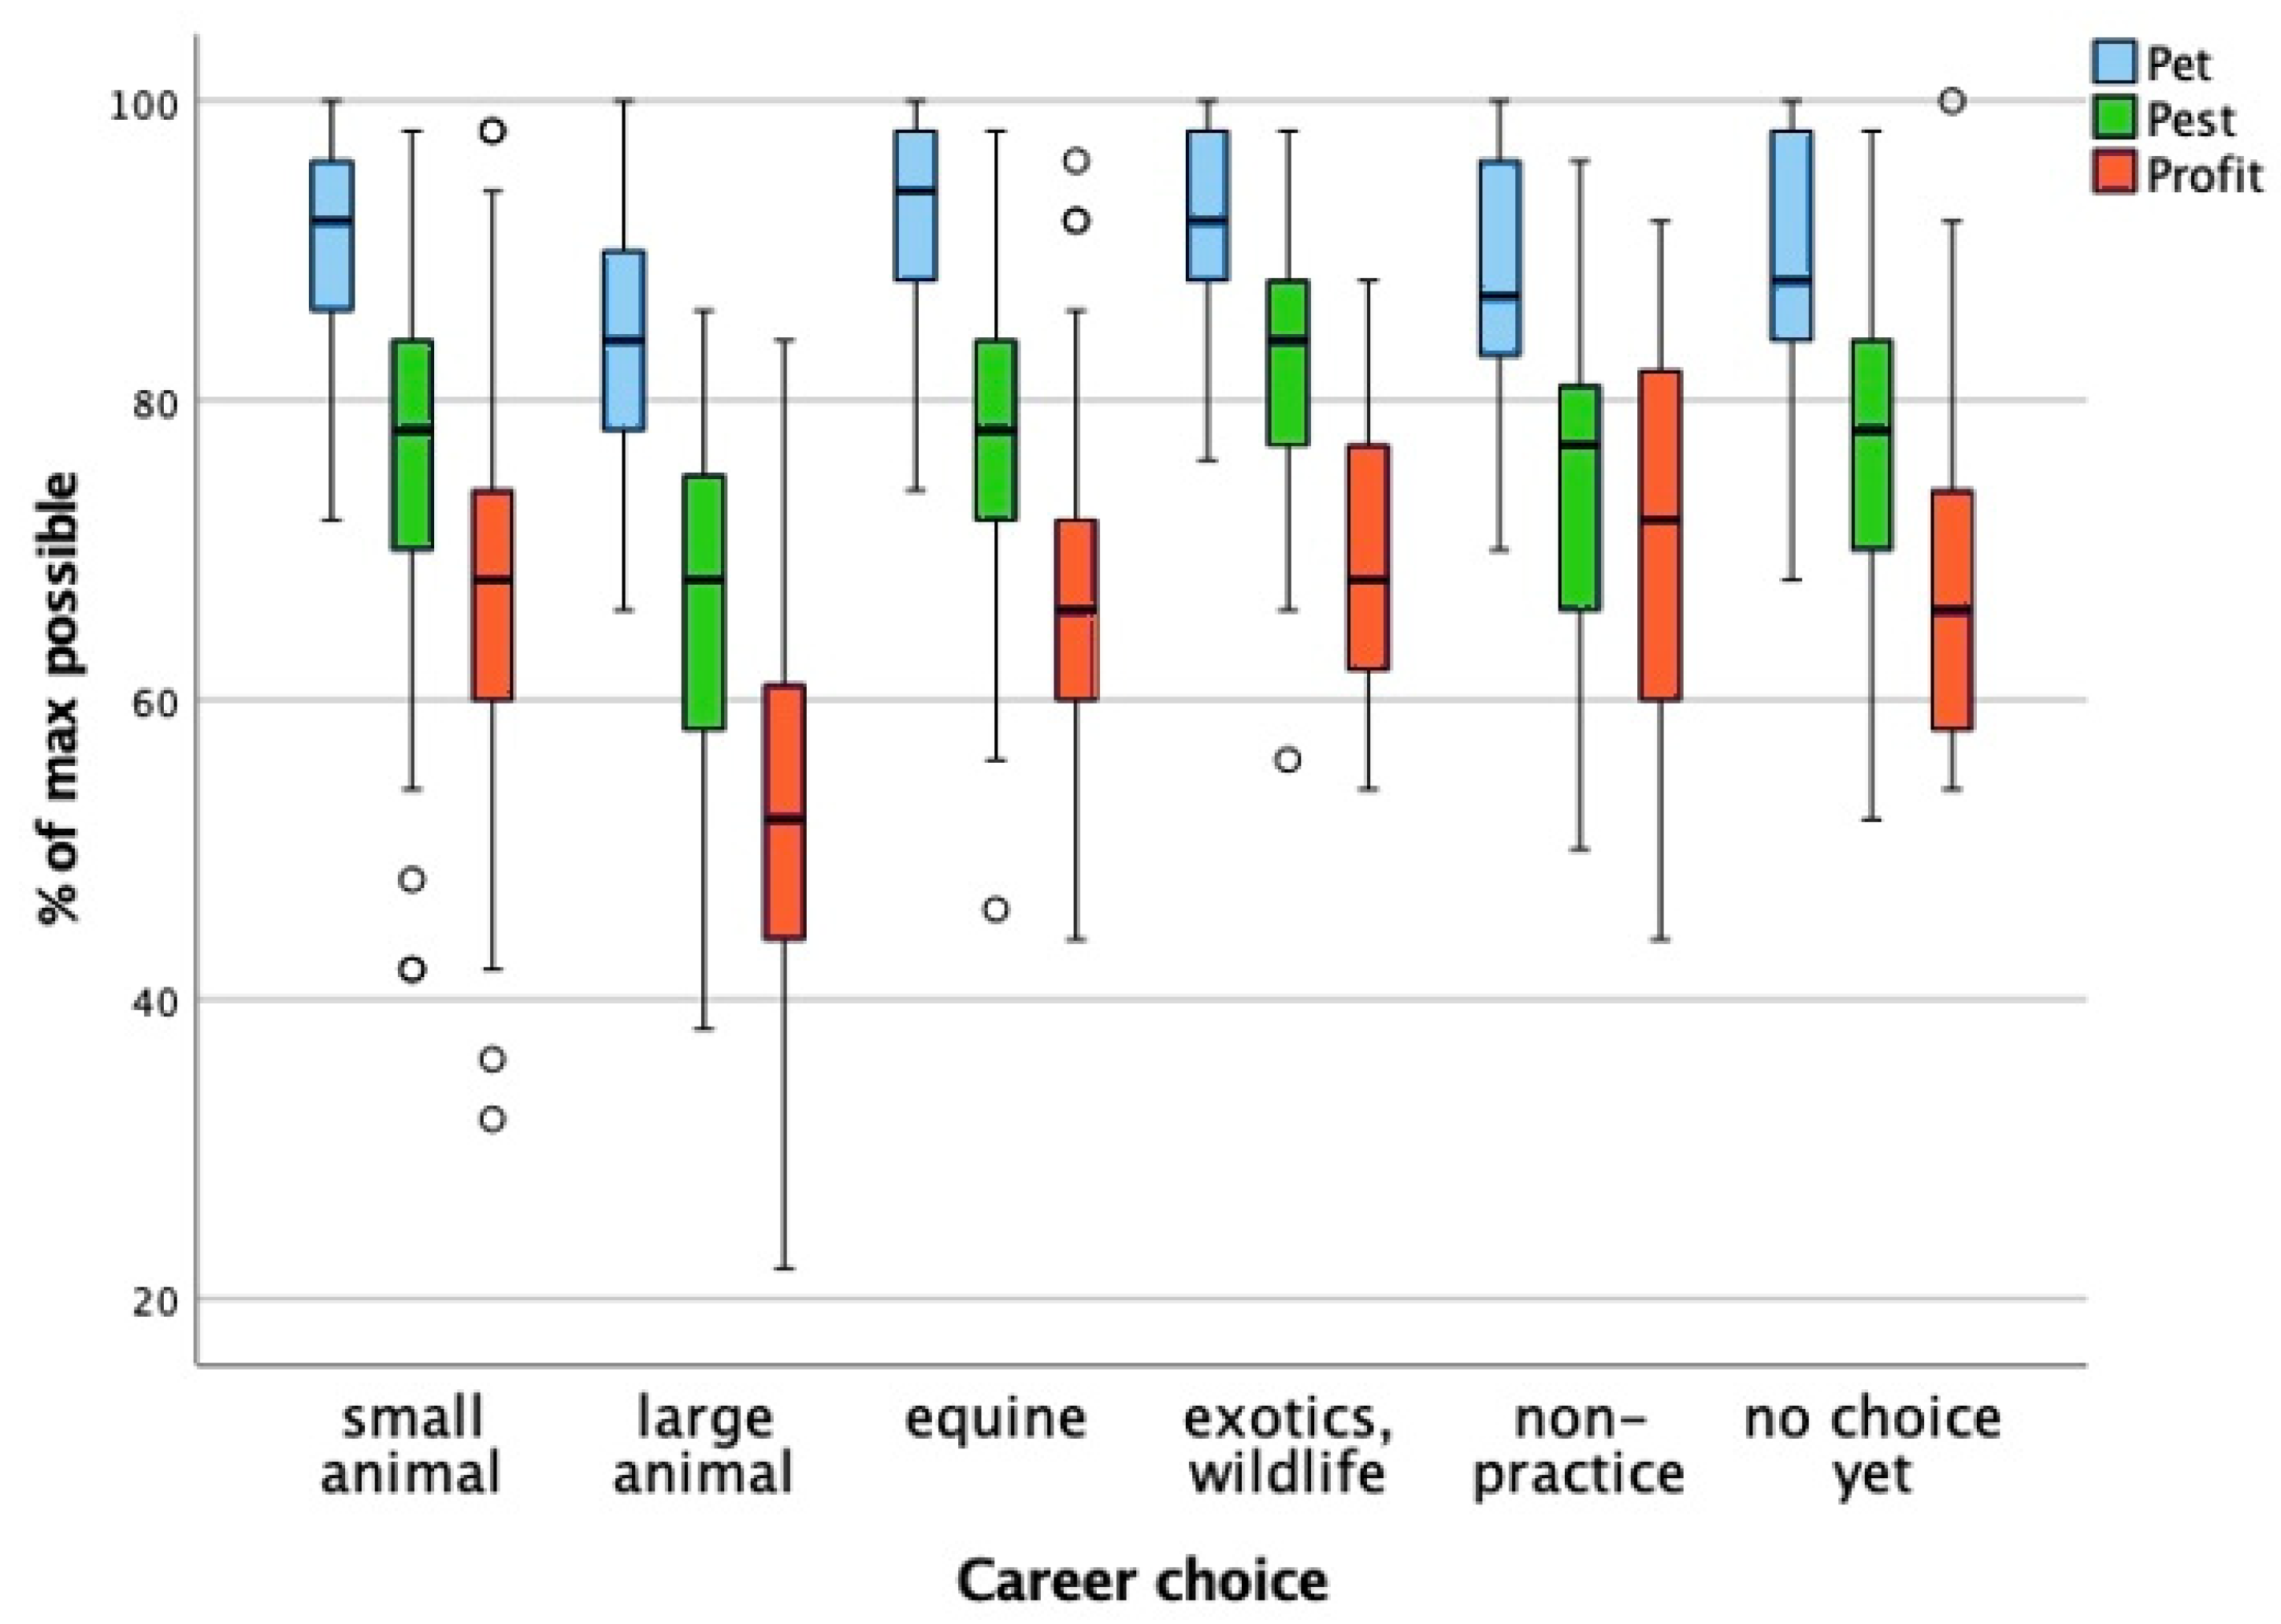
3.4. Career Choice
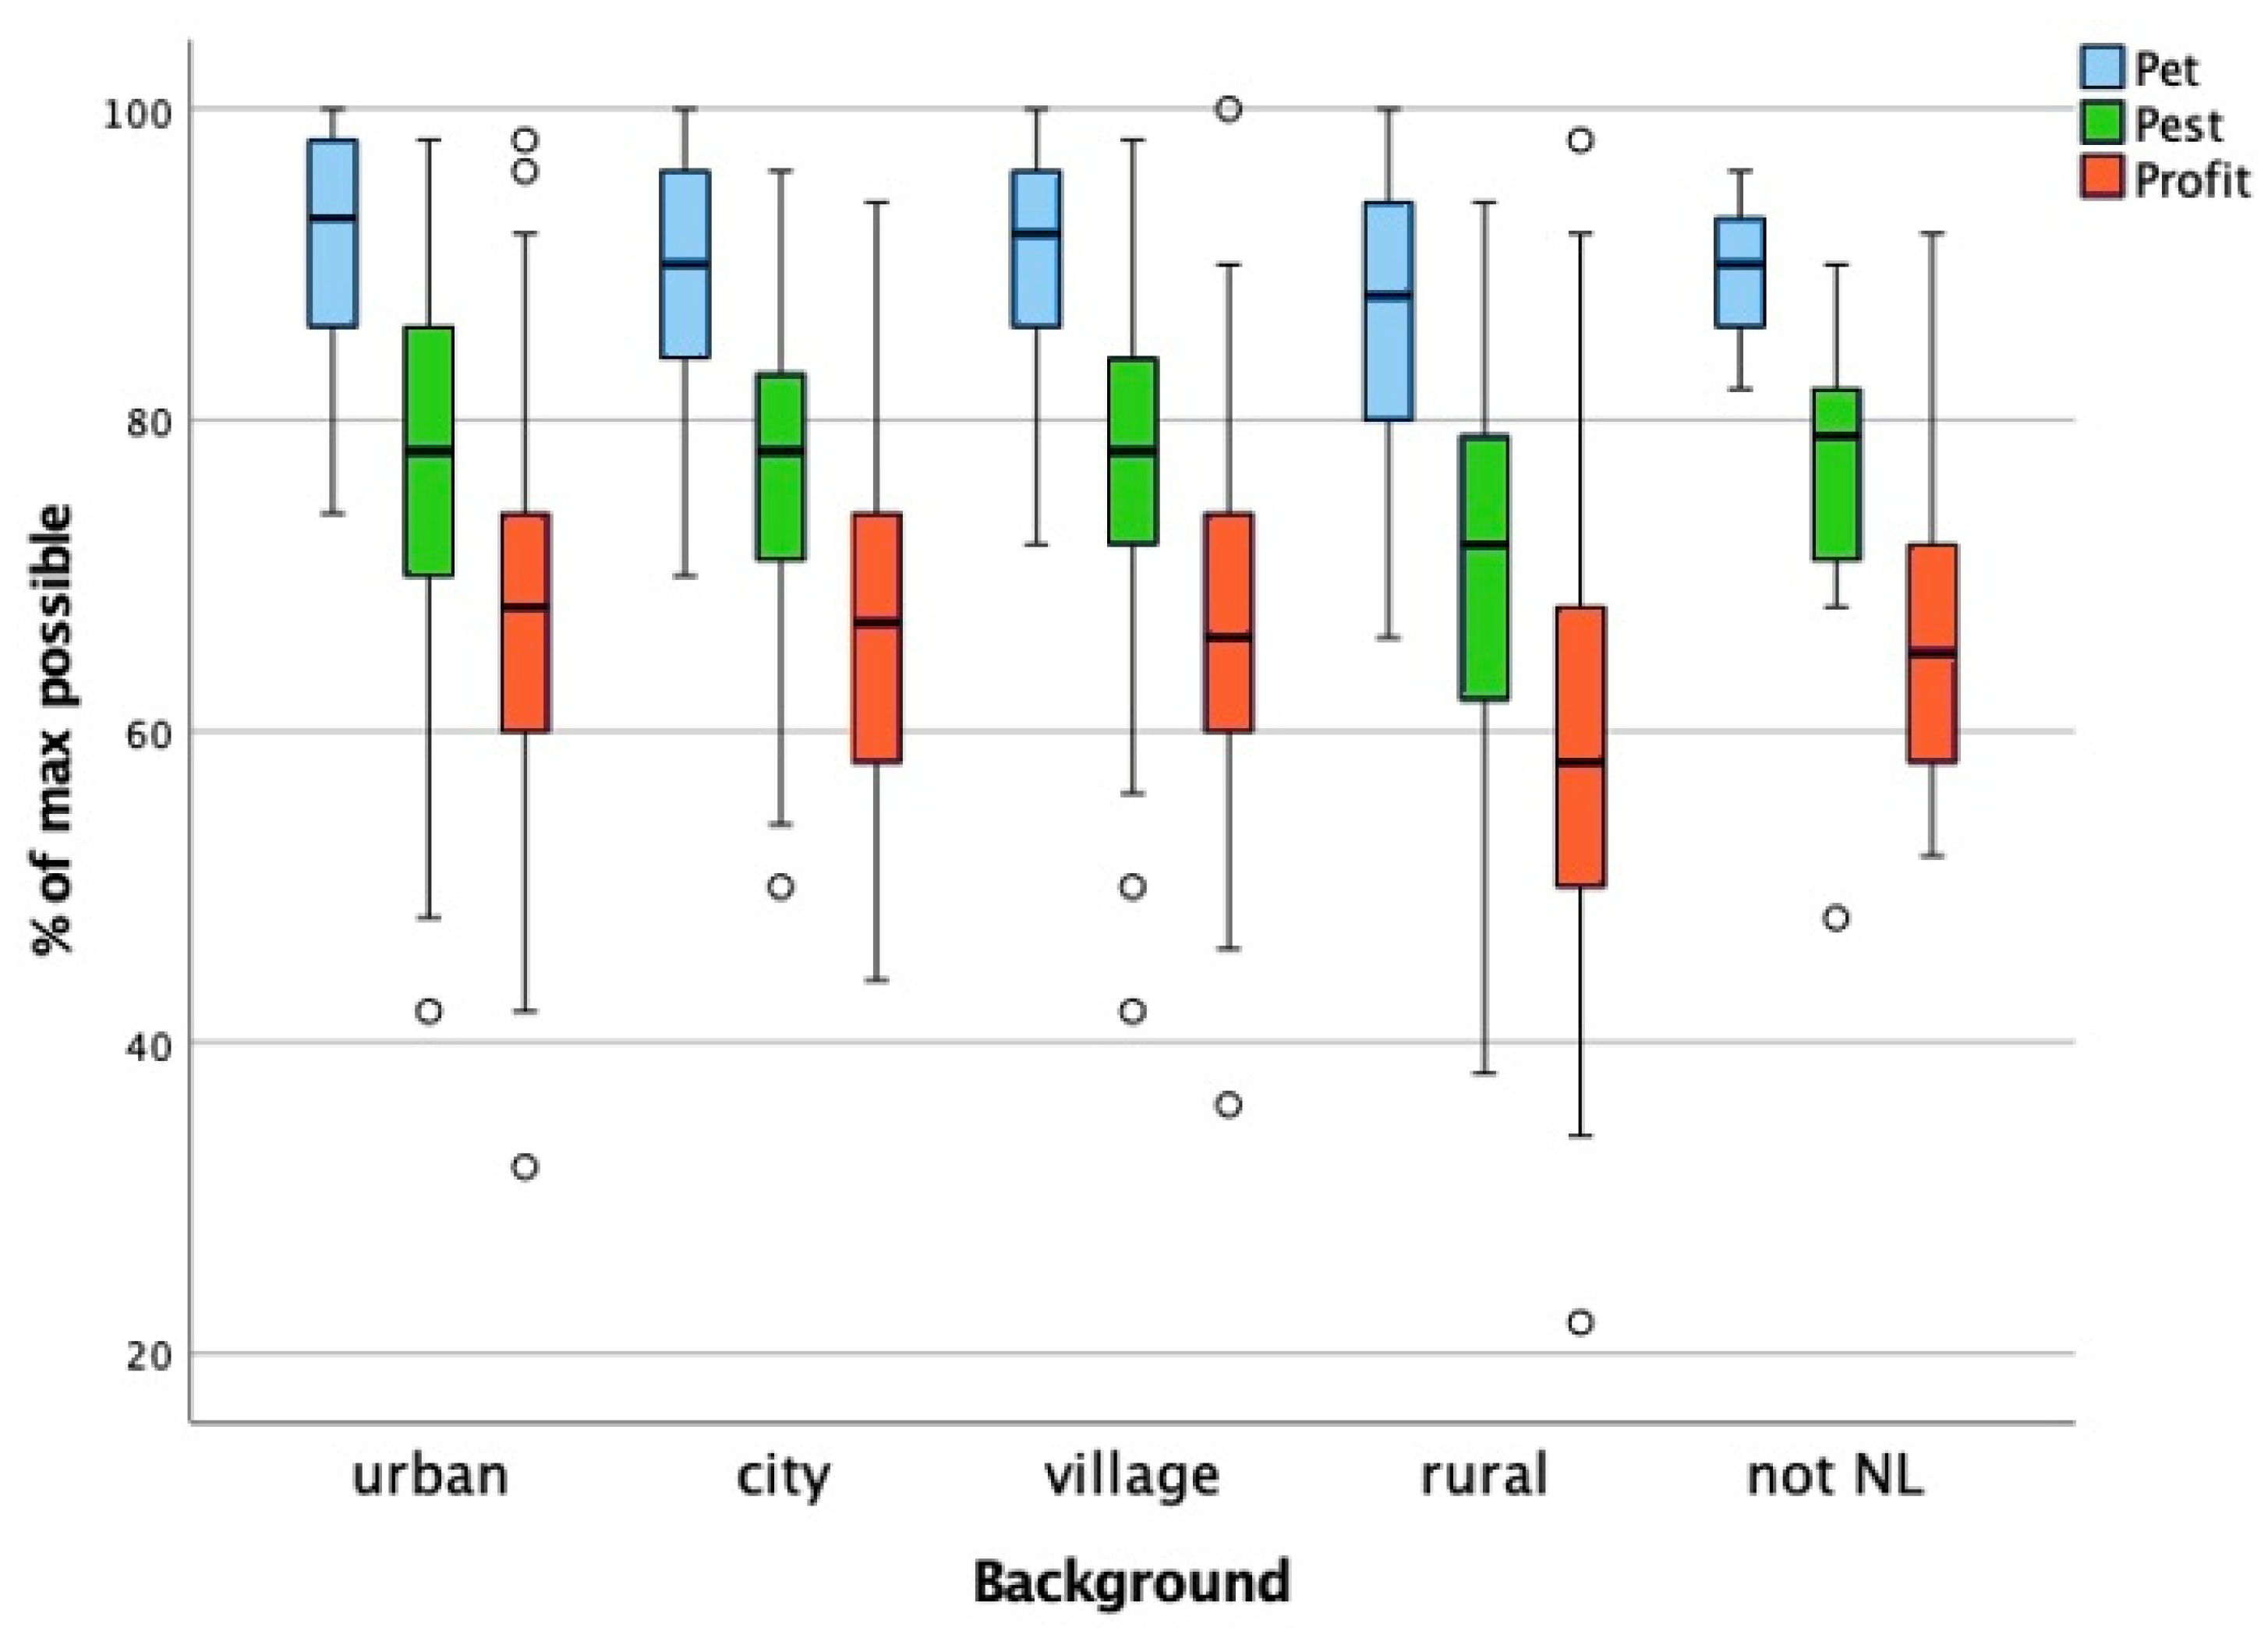
3.5. Background of the Students
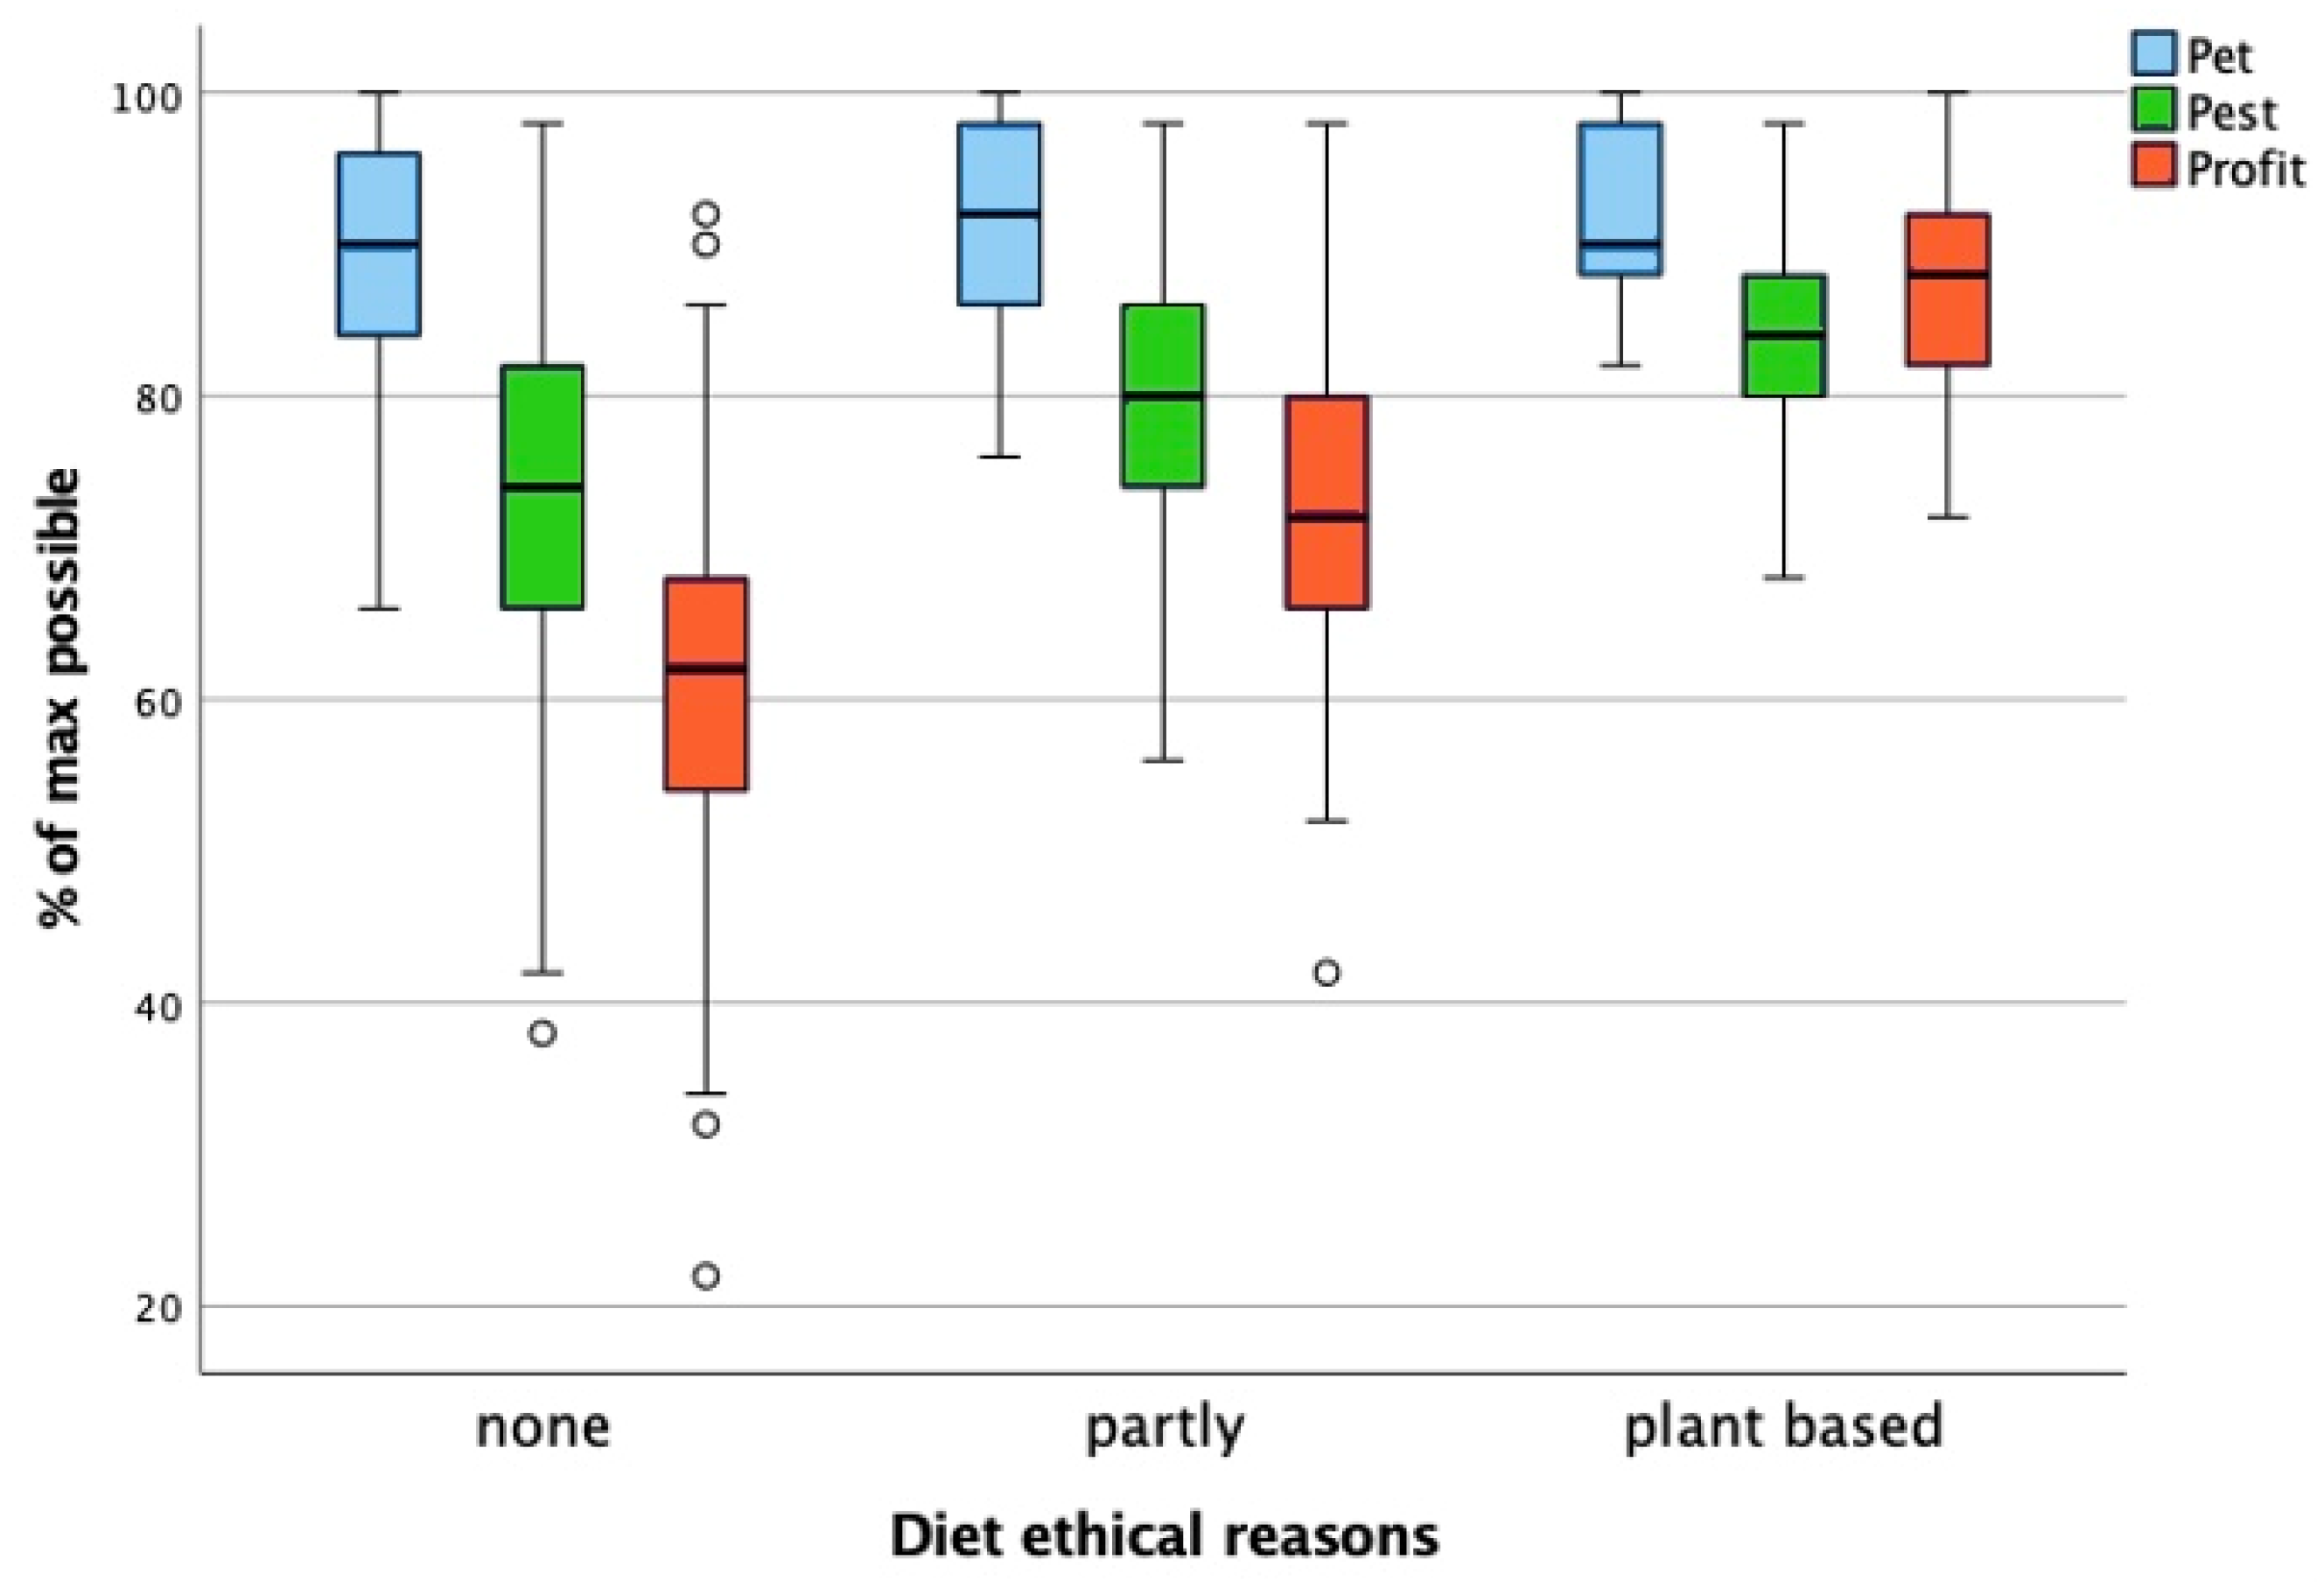
3.6. Diet for Ethical Reasons
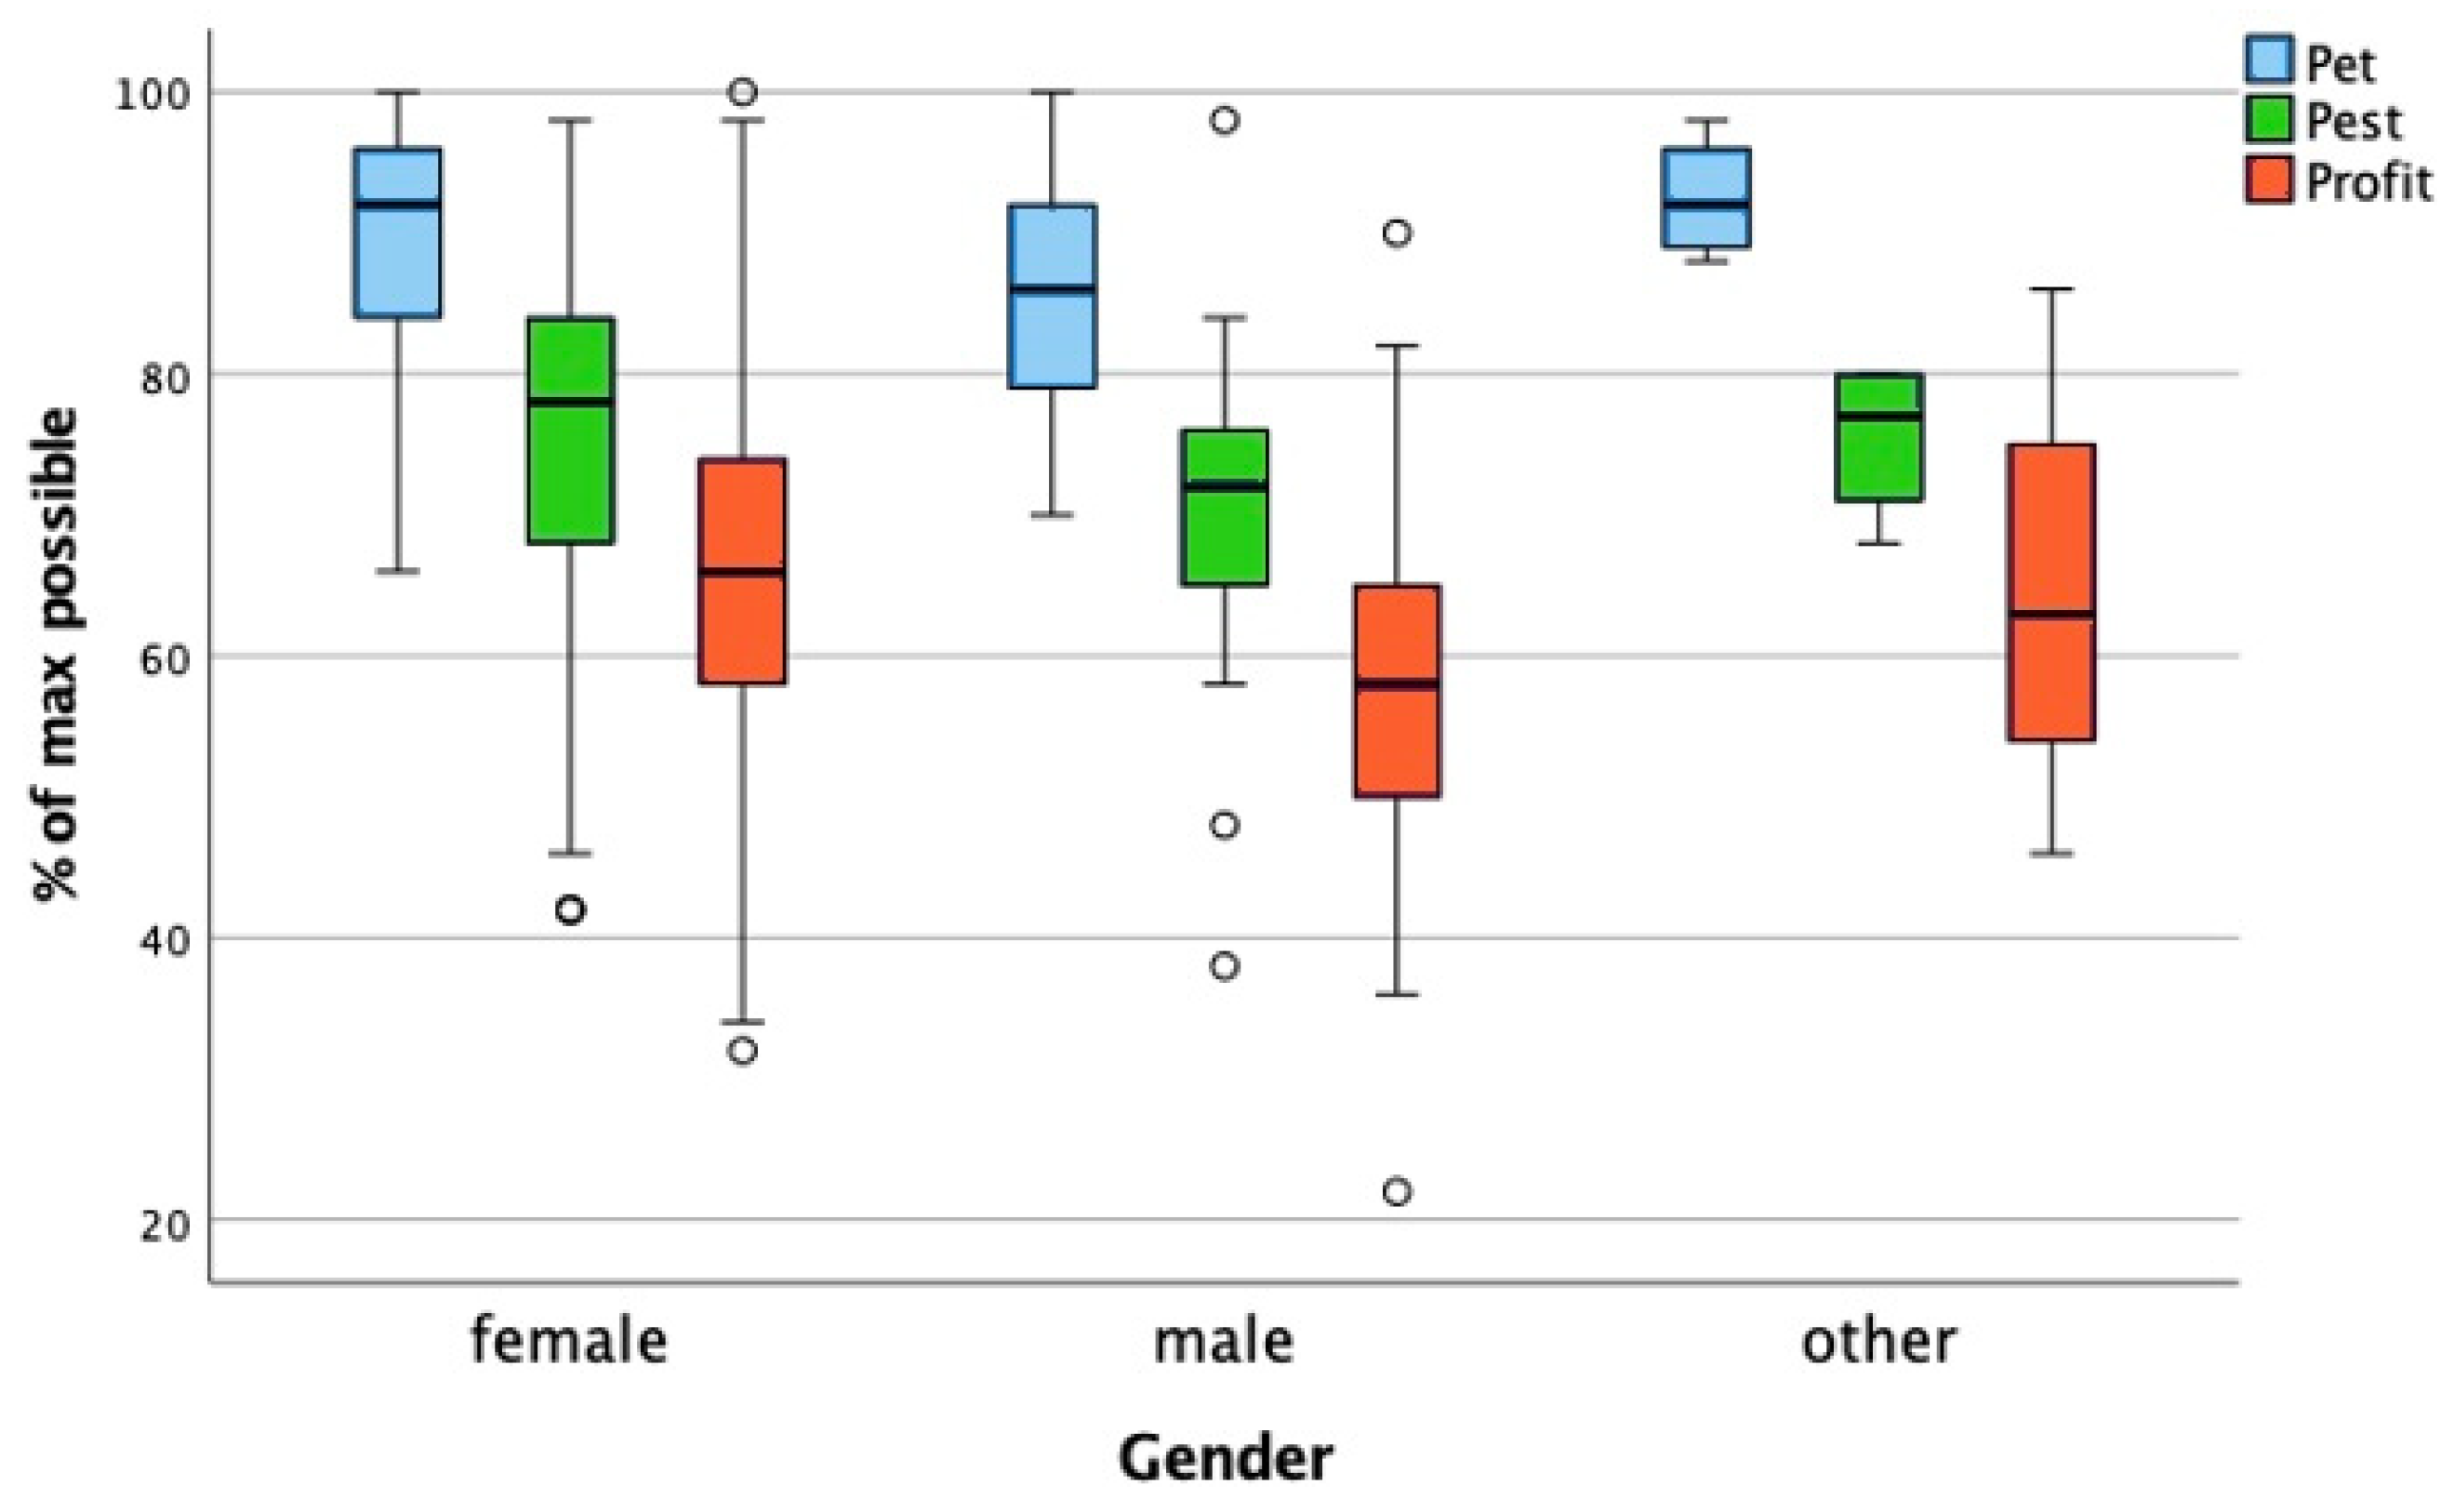
3.7. Gender
4. Discussion
4.1. Pet, Pest, and Profit Scores
4.2. Student-Related Variables
4.3. Implications
4.4. Recommendations
5. Conclusions
Limitations
Supplementary Materials
Author Contributions
Funding
Institutional Review Board Statement
Informed Consent Statement
Data Availability Statement
Acknowledgments
Conflicts of Interest
Abbreviations
| AAS | Animal Attitude Scale |
| ANOVA | Analysis of Variance |
| ATA | Attitude Toward Animals |
| ERB | Ethical Review Board |
| GDPR | General Data Protection Regulation |
| IQR | Interquartile Range |
| KNMvD | Koninklijke Nederlandse Maatschappij voor Diergeneeskunde (Royal Dutch Veterinary Association) |
| NGO | Non-Governmental Organization |
| NL | Nederland (the Netherlands) |
| NVMO | Nederlandse Vereniging voor Medisch Onderwijs (Dutch Association for Medical Education) |
| PPP | Pet, Pest, and Profit (Scale) |
| SPSS | Statistical Package for the Social Sciences |
| UU | Utrecht University (Utrecht University) |
References
- Bradley, A.; Mennie, N.; Bibby, P.A.; Cassaday, H.J. Some Animals Are More Equal than Others: Validation of a New Scale to Measure How Attitudes to Animals Depend on Species and Human Purpose of Use. PLoS ONE 2020, 15, e0227948. [Google Scholar] [CrossRef] [PubMed]
- Signal, T.; Taylor, N.; Maclean, A.S. Pampered or Pariah: Does Animal Type Influence the Interaction between Animal Attitude and Empathy? Psychol. Crime Law 2018, 24, 527–537. [Google Scholar] [CrossRef]
- Higgs, M.J.; Bipin, S.; Cassaday, H.J. Man’s Best Friends: Attitudes towards the Use of Different Kinds of Animal Depend on Belief in Different Species’ Mental Capacities and Purpose of Use. R. Soc. Open Sci. 2020, 7, 191162. [Google Scholar] [CrossRef] [PubMed]
- Macauley, L.P.J. Friends, Food, or “Free Egg Machines”? A Qualitative Study of Chicken Owners’ Perceptions of Chickens and Chicken Meat; University of Adelaide: Adelaide, Australia, 2018. [Google Scholar]
- Arndt, S.S.; Goerlich, V.C.; van der Staay, F.J. A Dynamic Concept of Animal Welfare: The Role of Appetitive and Adverse Internal and External Factors and the Animal’s Ability to Adapt to Them. Front. Anim. Sci. 2022, 3, 908513. [Google Scholar] [CrossRef]
- Schukken, Y.H.; van Trijp, J.C.M.; van Alphen, J.J.M.; Hopster, H. (Eds.) The State of the Animal in the Netherlands. In Den Haag: Raad Voor Dierenaangelegenheden; Raad voor Dieraangelegenheden: Den Haag, The Netherlands, 2019. [Google Scholar]
- Mellor, D. Updating Animal Welfare Thinking: Moving beyond the “Five Freedoms” towards “A Life Worth Living”. Animals 2016, 6, 21. [Google Scholar] [CrossRef]
- Littlewood, K.E.; Beausoleil, N.J. Two Domains to Five: Advancing Veterinary Duty of Care to Fulfil Public Expectations of Animal Welfare Expertise. Animals 2021, 11, 3504. [Google Scholar] [CrossRef]
- Federation of Veterinarians of Europe (FVE) European Veterinary Code of Conduct. Available online: https://fve.org/cms/wp-content/uploads/FVE_Code_of_Conduct_2019_R1_WEB.pdf (accessed on 9 October 2022).
- Koninklijke Nederlandse Maatschappij voor Diergeneeskunde (KNMvD) Code Voor de Dierenarts. Available online: https://www.knmvd.nl/app/uploads/2022/06/Code-voor-de-Dierenarts-2022.pdf (accessed on 9 October 2022).
- Universiteit Utrecht Faculty of Veterinary Medicine. Veterinaire Eed (Veterinary Oath). Available online: https://students.uu.nl/sites/default/files/dgk_eed_-_belofte_voor_de_dierenarts_mrt_2019.pdf (accessed on 9 October 2022).
- Universiteit Utrecht Faculty of Veterinary Medicine. Eindtermen Masteropleiding Diergeneeskunde 2020; Faculty of Veterinary Medicine, Utrecht University: Utrecht, The Netherlands, 2018. [Google Scholar]
- Norring, M.; Wikman, I.; Hokkanen, A.-H.; Kujala, M.V.; Hänninen, L. Empathic Veterinarians Score Cattle Pain Higher. Vet. J. 2014, 200, 186–190. [Google Scholar] [CrossRef]
- Prguda, E.; Neumann, D.L. Inter-Human and Animal-Directed Empathy: A Test for Evolutionary Biases in Empathetic Responding. Behav. Process. 2014, 108, 80–86. [Google Scholar] [CrossRef]
- Henry, B.C. Empathy, Home Environment, and Attitudes toward Animals in Relation to Animal Abuse. Anthrozoös 2006, 19, 17–34. [Google Scholar] [CrossRef]
- Taylor, N.; Signal, T.D. Empathy and Attitudes to Animals. Anthrozoös 2005, 18, 18–27. [Google Scholar] [CrossRef]
- Cuff, B.M.P.; Brown, S.J.; Taylor, L.; Howat, D.J. Empathy: A Review of the Concept. Emot. Rev. 2016, 8, 144–153. [Google Scholar] [CrossRef]
- Marriott, S.; Cassaday, H.J. Attitudes to Animal Use of Named Species for Different Purposes: Effects of Speciesism, Individualising Morality, Likeability and Demographic Factors. Humanit. Soc. Sci. Commun. 2022, 9, 138. [Google Scholar] [CrossRef]
- Batt, S. Human Attitudes towards Animals in Relation to Species Similarity to Humans: A Multivariate Approach. Biosci. Horiz. 2009, 2, 180–190. [Google Scholar] [CrossRef]
- Randler, C.; Adan, A.; Antofie, M.-M.; Arrona-Palacios, A.; Candido, M.; Pauw, J.B.-D.; Chandrakar, P.; Demirhan, E.; Detsis, V.; Di Milia, L.; et al. Animal Welfare Attitudes: Effects of Gender and Diet in University Samples from 22 Countries. Animals 2021, 11, 1893. [Google Scholar] [CrossRef]
- Serpell, J.A. Factors Influencing Veterinary Students’ Career Choices and Attitudes to Animals. J. Vet. Med. Educ. 2005, 32, 491–496. [Google Scholar] [CrossRef]
- Knight, S.; Vrij, A.; Bard, K.; Brandon, D. Science versus Human Welfare? Understanding Attitudes toward Animal Use. J. Soc. Issues 2009, 65, 463–483. [Google Scholar] [CrossRef]
- Taylor, N.; Signal, T.D. Pet, Pest, Profit: Isolating Differences in Attitudes towards the Treatment of Animals. Anthrozoös 2009, 22, 129–135. [Google Scholar] [CrossRef]
- Wilhelmus, K.R. The Draize Eye Test. Surv. Ophthalmol. 2001, 45, 493–515. [Google Scholar] [CrossRef] [PubMed]
- Hernandez, E.; Fawcett, A.; Brouwer, E.; Rau, J.; Turner, P. Speaking Up: Veterinary Ethical Responsibilities and Animal Welfare Issues in Everyday Practice. Animals 2018, 8, 15. [Google Scholar] [CrossRef]
- Bratanova, B.; Loughnan, S.; Bastian, B. The Effect of Categorization as Food on the Perceived Moral Standing of Animals. Appetite 2011, 57, 193–196. [Google Scholar] [CrossRef] [PubMed]
- Bubeck, M.J. Justifying Euthanasia: A Qualitative Study of Veterinarians’ Ethical Boundary Work of “Good” Killing. Animals 2023, 13, 2515. [Google Scholar] [CrossRef]
- Herzog, H.; Grayson, S.; McCord, D. Brief Measures of the Animal Attitude Scale. Anthrozoös 2015, 28, 145–152. [Google Scholar] [CrossRef]
- Romero, M.H.; Escobar, L.; Sánchez, J.A. Empathy Levels Among Veterinary Medicine Students in Colombia (South America). J. Vet. Med. Educ. 2022, 49, 740–747. [Google Scholar] [CrossRef]
- Binngießer, J.; Wilhelm, C.; Randler, C. Attitudes toward Animals among German Children and Adolescents. Anthrozoös 2013, 26, 325–339. [Google Scholar] [CrossRef]
- Morrison, R.; Maust-Mohl, M.; Charlton, K. Friend, Foe, or Food: What Influences Students’ Attitudes Toward Animals? Anthrozoös 2021, 34, 187–200. [Google Scholar] [CrossRef]
- Pirrone, F.; Mariti, C.; Gazzano, A.; Albertini, M.; Sighieri, C.; Diverio, S. Attitudes toward Animals and Their Welfare among Italian Veterinary Students. Vet. Sci. 2019, 6, 19. [Google Scholar] [CrossRef] [PubMed]
- Calderón-Amor, J.; Luna-Fernández, D.; Tadich, T. Study of the Levels of Human–Human and Human–Animal Empathy in Veterinary Medical Students from Chile. J. Vet. Med. Educ. 2017, 44, 179–186. [Google Scholar] [CrossRef]
- Weijden, J.V.D. Attitudes towards the Use of Animals of Students Enrolled in Animal Welfare and Laboratory Science Courses in The Netherlands. Master Thesis, The Department Animals in Science & Society (AISS) of the Faculty of Veterinary Medicine, Utrecht University, Utrecht, The Netherlands, 2013. [Google Scholar]
- Menor-Campos, D.J.; Diverio, S.; Sánchez-Muñoz, C.; López-Rodríguez, R.; Gazzano, A.; Palandri, L.; Mariti, C. Attitudes toward Animals of Students at Three European Veterinary Medicine Schools in Italy and Spain. Anthrozoös 2019, 32, 375–385. [Google Scholar] [CrossRef]
- Singer, P. Animal Liberation; HarperCollins: New York, NY, USA, 2009. [Google Scholar]
- Korsgaard, C.M. Fellow Creatures: Our Obligations to the Other Animals; Oxford University Press: Oxford, UK, 2018; ISBN 978-019-875-3858. [Google Scholar]
- Marino, L. Thinking Chickens: A Review of Cognition, Emotion, and Behavior in the Domestic Chicken. Anim. Cogn. 2017, 20, 127–147. [Google Scholar] [CrossRef] [PubMed]
- Dawkins, M.S. Animal Suffering: The Science of Animal Welfare; Chapman & Hall: London, UK, 1980. [Google Scholar]
- Harpe, S.E. How to Analyze Likert and Other Rating Scale Data. Curr. Pharm. Teach. Learn. 2015, 7, 836–850. [Google Scholar] [CrossRef]
- Qualtrics Sample Size Calculator. Available online: https://www.qualtrics.com/blog/calculating-sample-size/ (accessed on 5 November 2022).
- Guyatt, G.; Drummond, R.; Meade, M.O.; Cook, D.J. Users’ Guides to the Medical Literature, 3rd ed.; McGraw-Hill Education: New York, NY, USA, 2015; ISBN 978-0-07-179071-0. [Google Scholar]
- Robbins, J.; Danielson, J.; Johnson, A.; Parsons, R.; Jorgensen, M.; Millman, S. Attitudes towards Animals and Belief in Animal Mind among First-Year Veterinary Students before and after an Introductory Animal Welfare Course. Anim. Welf. 2021, 30, 409–418. [Google Scholar] [CrossRef]
- Hazel, S.J.; Signal, T.D.; Taylor, N. Can Teaching Veterinary and Animal-Science Students about Animal Welfare Affect Their Attitude toward Animals and Human-Related Empathy? J. Vet. Med. Educ. 2011, 38, 74–83. [Google Scholar] [CrossRef]
- Paul, E.S.; Podberscek, A.L. Veterinary Education and Students’ Attitudes towards Animal Welfare. Vet. Rec. 2000, 146, 269–272. [Google Scholar] [CrossRef]
- Azahar, F.A.M.; Fakri, N.M.R.M.; Pa, M.N.M. Associations between Gender, Year of Study and Empathy Level With Attitudes towards Animal Welfare among Undergraduate Doctor of Veterinary Medicine Students in Universiti Putra Malaysia. Educ. Med. J. 2014, 6, e66–e73. [Google Scholar] [CrossRef]
- Cornish, A.R.; Caspar, G.L.; Collins, T.; Degeling, C.; Fawcett, A.; Fisher, A.D.; Freire, R.; Hazel, S.J.; Hood, J.; Johnson, A.J.; et al. Career Preferences and Opinions on Animal Welfare and Ethics: A Survey of Veterinary Students in Australia and New Zealand. J. Vet. Med. Educ. 2016, 43, 310–320. [Google Scholar] [CrossRef] [PubMed]
- Mariti, C.; Pirrone, F.; Albertini, M.; Gazzano, A.; Diverio, S. Familiarity and Interest in Working with Livestock Decreases the Odds of Having Positive Attitudes towards Non-Human Animals and Their Welfare among Veterinary Students in Italy. Animals 2018, 8, 150. [Google Scholar] [CrossRef] [PubMed]
- Binngießer, J.; Randler, C. Association of the Environmental Attitudes “Preservation” and “Utilization” with Pro-Animal Attitudes. Int. J. Environ. Sci. Educ. 2015, 10, 477–492. [Google Scholar]
- Knight, S.; Vrij, A.; Cherryman, J.; Nunkoosing, K. Attitudes towards Animal Use and Belief in Animal Mind. Anthrozoös 2004, 17, 43–62. [Google Scholar] [CrossRef]
- de Waal, F.B.M.; Andrews, K. The Question of Animal Emotions. Science 2022, 375, 1351–1352. [Google Scholar] [CrossRef]
- Hazel, S.; O’Dwyer, L.; Ryan, T. “Chickens Are a Lot Smarter than I Originally Thought”: Changes in Student Attitudes to Chickens Following a Chicken Training Class. Animals 2015, 5, 821–837. [Google Scholar] [CrossRef] [PubMed]
- Ventura, B.A.; Terreaux, C.M.H.A.; Zhitnitskiy, P.E. Veterinary Student Knowledge and Attitudes about Swine Change after Lectures and a Farm Visit. J. Vet. Med. Educ. 2021, 48, 492–502. [Google Scholar] [CrossRef]
- Johnstone, E.C.S.; Frye, M.A.; Lord, L.K.; Baysinger, A.K.; Edwards-Callaway, L.N. Knowledge and Opinions of Third Year Veterinary Students Relevant to Animal Welfare Before and After Implementation of a Core Welfare Course. Front. Vet. Sci. 2019, 6, 103. [Google Scholar] [CrossRef]
- Tzioumis, V.; Freire, R.; Hood, J.; Johnson, A.J.; Lloyd, J.; Phillips, C.J.C.; McGreevy, P.D. Educators’ Perspectives on Animal Welfare and Ethics in the Australian and New Zealand Veterinary Curricula. J. Vet. Med. Educ. 2018, 45, 448–463. [Google Scholar] [CrossRef] [PubMed]
- Kopnina, H. Wild Animals and Justice: The Case of the Dead Elephant in the Room. J. Int. Wildl. Law Policy 2016, 19, 219–235. [Google Scholar] [CrossRef]
- Crist, E. Abundant Earth and the Population Question. In Life on the Brink: Environmentalists Confront Overpopulation; Cafaro, P., Crist, E., Eds.; University of Georgia Press: Athens, GA, USA, 2012; pp. 141–153. [Google Scholar]
- Kremen, C.; Miles, A. Ecosystem Services in Biologically Diversified versus Conventional Farming Systems: Benefits, Externalities, and Trade-Offs. Ecol. Soc. 2012, 17, 40. [Google Scholar] [CrossRef]

| Student Variable | Subgroups | N = 321 (100%) |
|---|---|---|
| Gender | Female | 282 (87.9%) |
| Male | 35 (10.9%) | |
| Other (both 1, neither 1, no answer 2) | 4 (1.2%) | |
| Background | Urban | 82 (25.5%) |
| City | 32 (10.0%) | |
| Village/town | 104 (32.4%) | |
| Rural | 95 (29.6%) | |
| Outside the Netherlands | 8 (2.5%) | |
| Diet | No | 223 (69.5%) |
| Partly (no dairy/eggs/meat/fish) | 85 (26.48%) | |
| Yes (no products of animal origin) | 13 (4.05%) | |
| Study year | First year | 57 (17.8%) |
| Second year | 60 (18.7%) | |
| Third year | 55 (17.1%) | |
| Fourth year | 46 (14.3%) | |
| Fifth year | 48 (15.0%) | |
| Sixth year | 55 (17.1%) | |
| Career choice | Small animal practice | 131 (40.8%) |
| Large animal practice | 60 (18.7%) | |
| Equine practice | 61 (19.0%) | |
| Exotics/wildlife practice | 28 (8.7%) | |
| Non-practice (food safety, research, education, industry, government NGO) | 24 (7.5%) | |
| No choice made yet | 17 (5.3%) |
Disclaimer/Publisher’s Note: The statements, opinions and data contained in all publications are solely those of the individual author(s) and contributor(s) and not of MDPI and/or the editor(s). MDPI and/or the editor(s) disclaim responsibility for any injury to people or property resulting from any ideas, methods, instructions or products referred to in the content. |
© 2025 by the authors. Licensee MDPI, Basel, Switzerland. This article is an open access article distributed under the terms and conditions of the Creative Commons Attribution (CC BY) license (https://creativecommons.org/licenses/by/4.0/).
Share and Cite
Dijkstra Klaasse, A.V.; Janssens, M.R.E.; Salvatori, D.C.F. Pet, Pest, Profit: Patient! How Attitudes Toward Animals Among Veterinary Students in the Netherlands Differ According to Animal Categories and Student-Related Variables. Animals 2025, 15, 2222. https://doi.org/10.3390/ani15152222
Dijkstra Klaasse AV, Janssens MRE, Salvatori DCF. Pet, Pest, Profit: Patient! How Attitudes Toward Animals Among Veterinary Students in the Netherlands Differ According to Animal Categories and Student-Related Variables. Animals. 2025; 15(15):2222. https://doi.org/10.3390/ani15152222
Chicago/Turabian StyleDijkstra Klaasse, Angelika V., Monique R. E. Janssens, and Daniela C. F. Salvatori. 2025. "Pet, Pest, Profit: Patient! How Attitudes Toward Animals Among Veterinary Students in the Netherlands Differ According to Animal Categories and Student-Related Variables" Animals 15, no. 15: 2222. https://doi.org/10.3390/ani15152222
APA StyleDijkstra Klaasse, A. V., Janssens, M. R. E., & Salvatori, D. C. F. (2025). Pet, Pest, Profit: Patient! How Attitudes Toward Animals Among Veterinary Students in the Netherlands Differ According to Animal Categories and Student-Related Variables. Animals, 15(15), 2222. https://doi.org/10.3390/ani15152222