
Development of Machine Learning-Based Sub-Models for Predicting Net Protein Requirements in Lactating Dairy Cows


Simple Summary
Abstract
1. Introduction
2. Materials and Methods
2.1. Database Construction and Dataset Extraction
2.2. Variable Selection and Calculations
2.3. Model Development and Evaluation
3. Results
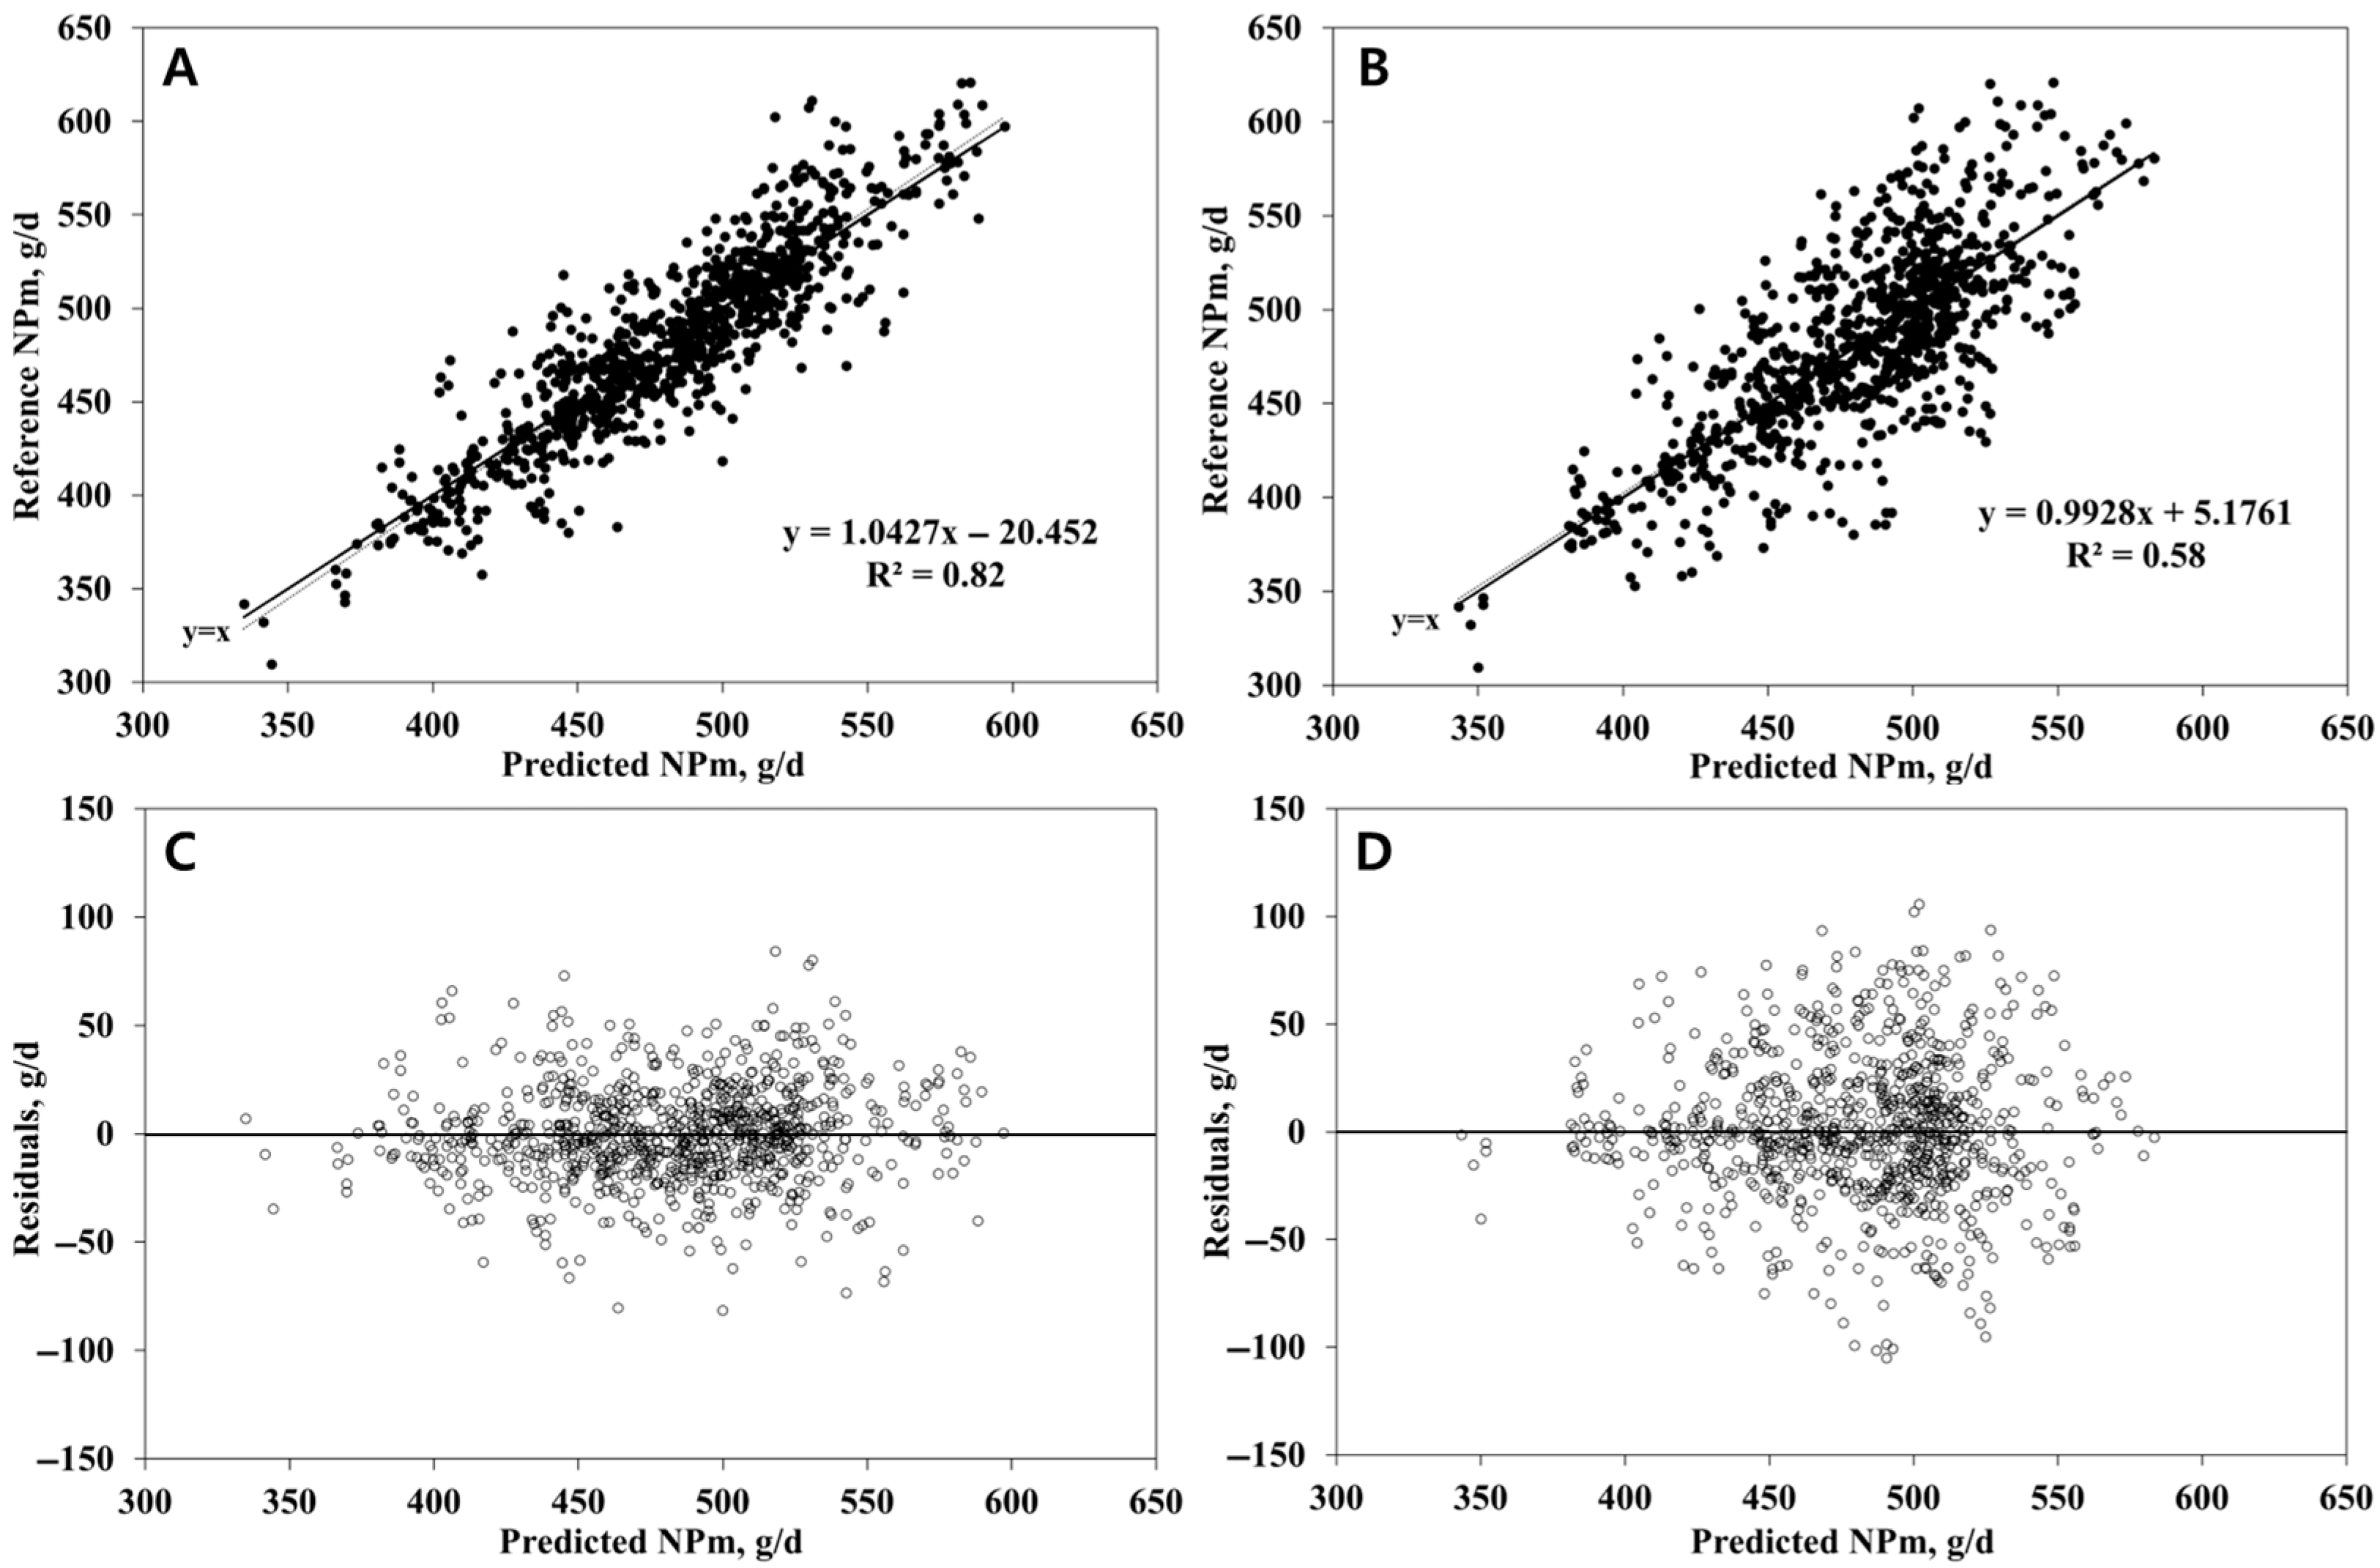
3.1. NPm Prediction
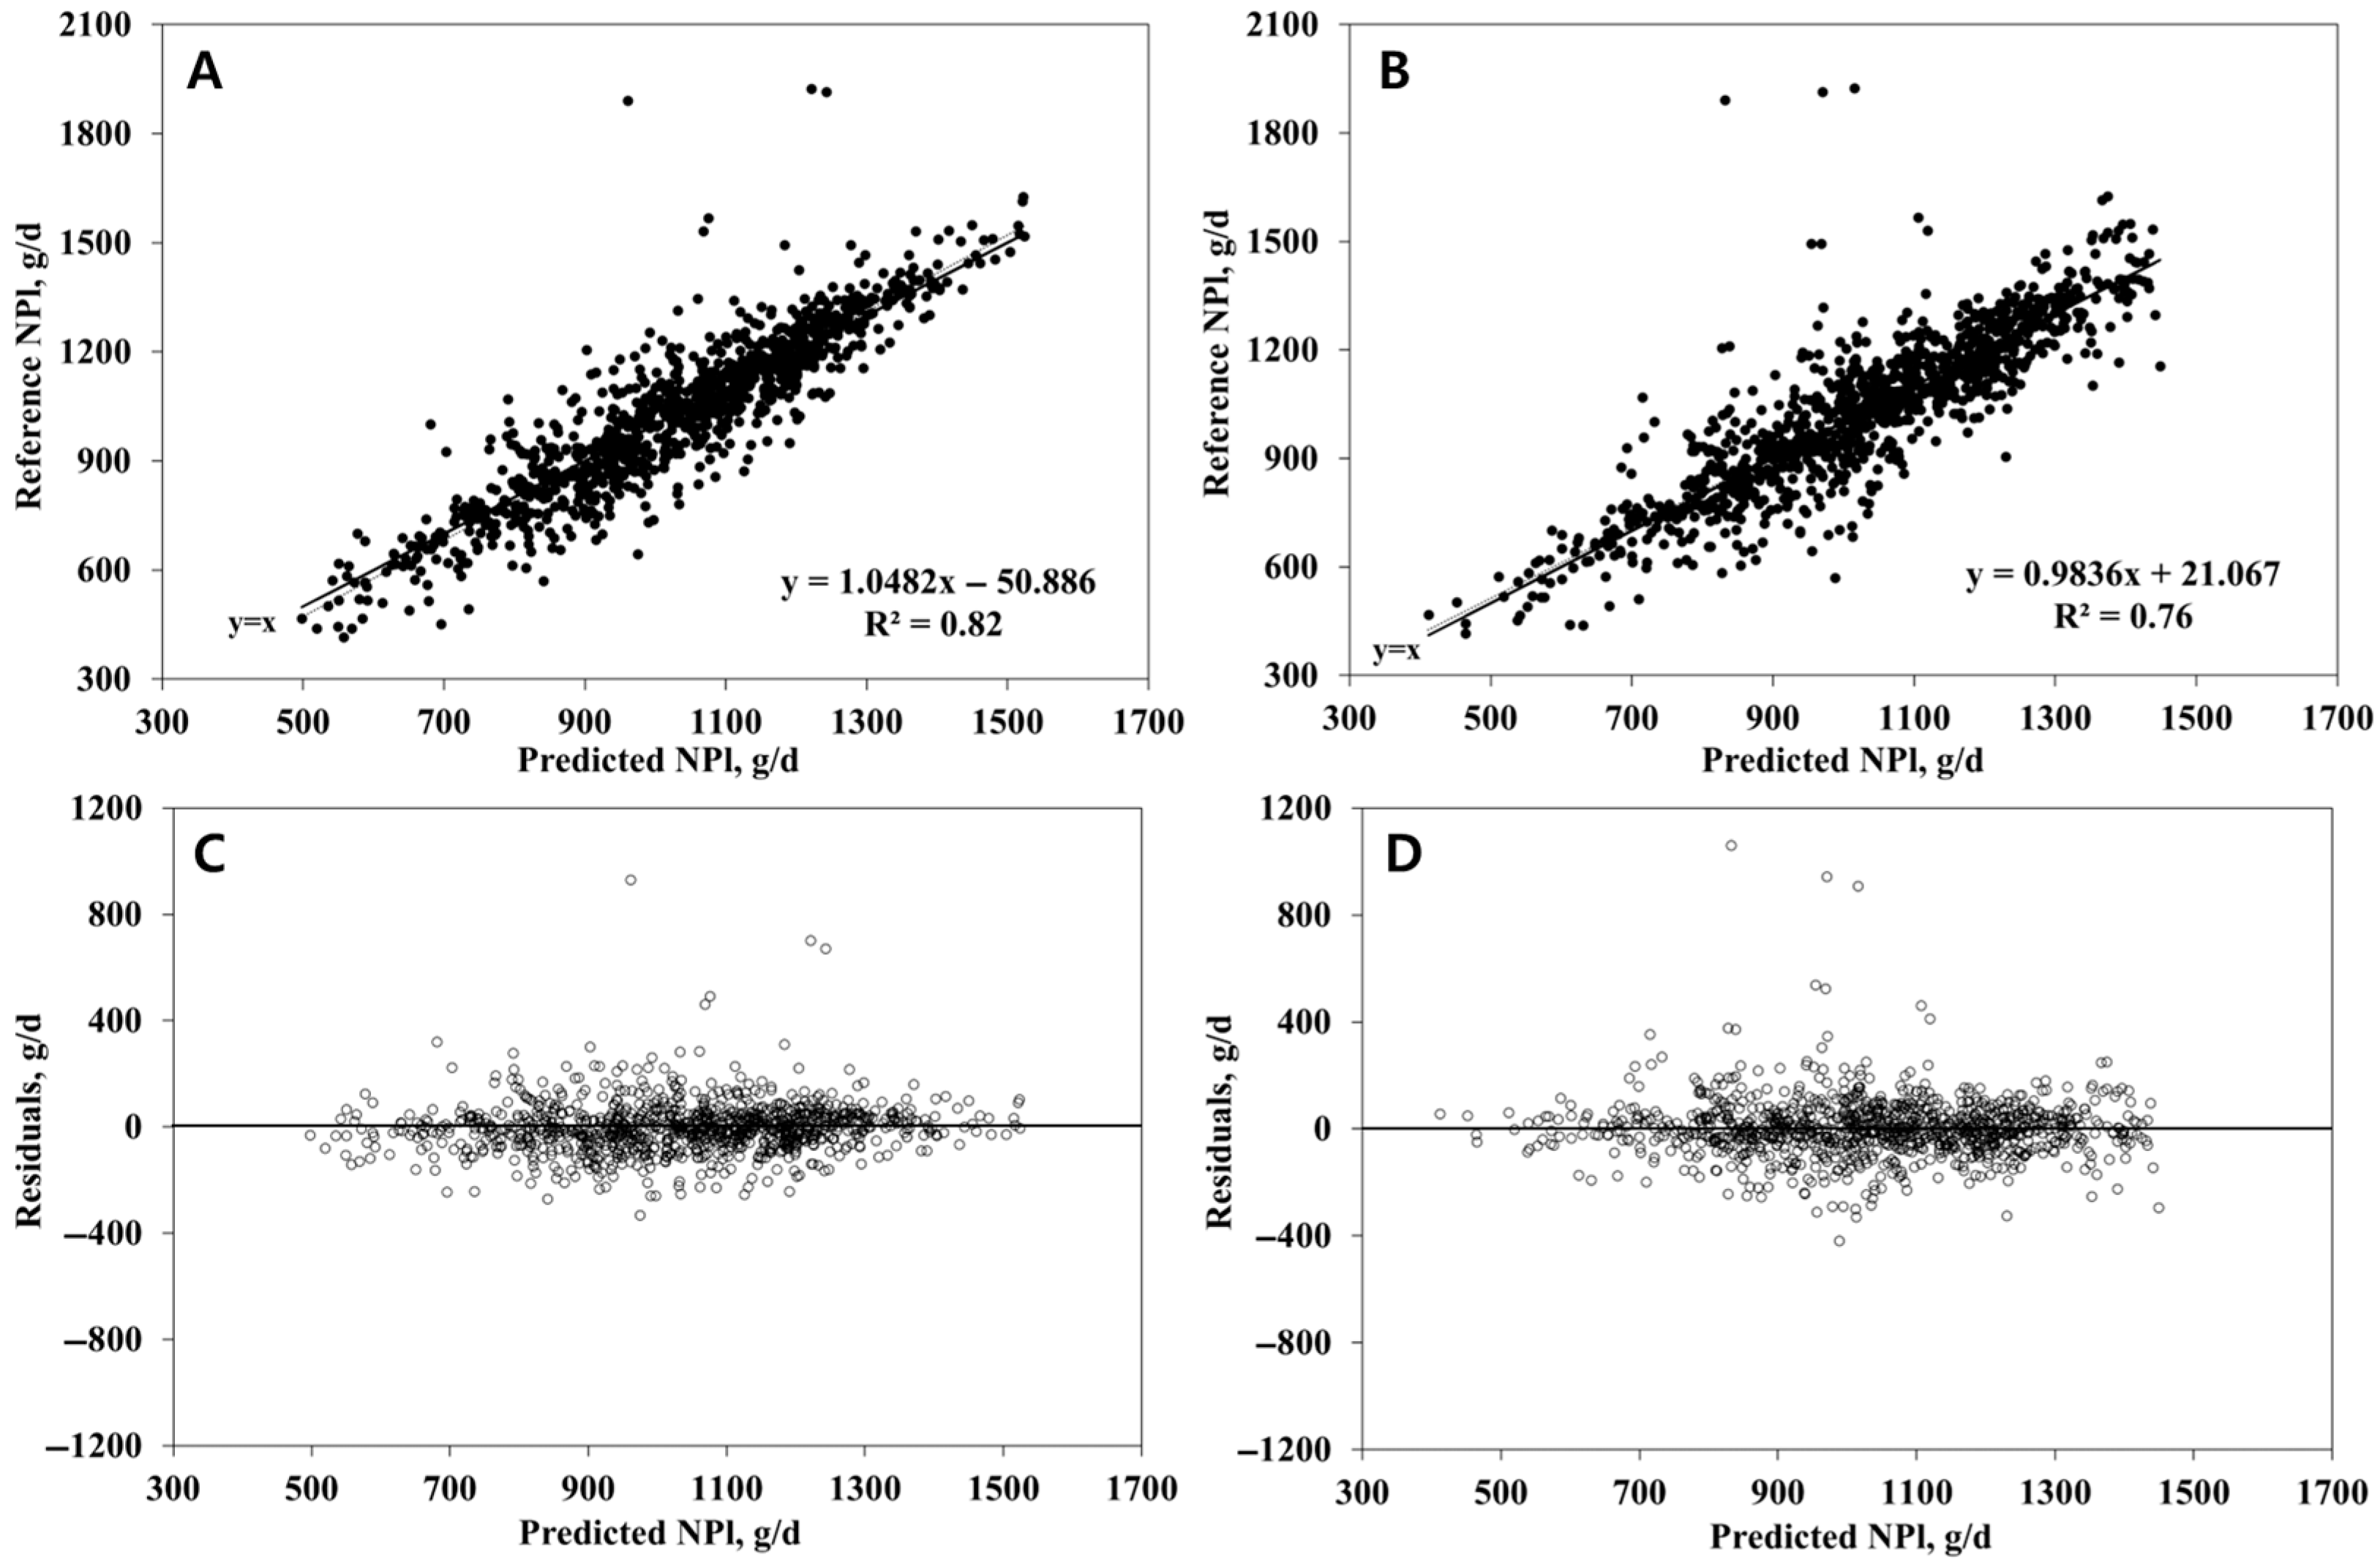
3.2. NPl Prediction
4. Discussion
5. Conclusions
Author Contributions
Funding
Institutional Review Board Statement
Informed Consent Statement
Data Availability Statement
Conflicts of Interest
References
- Capper, J.L.; Cady, R.A.; Bauman, D.E. The environmental impact of dairy production: 1944 compared with 2007. J. Anim. Sci. 2009, 87, 2160–2167. [Google Scholar] [CrossRef] [PubMed]
- Eastridge, M.L. Major advances in applied dairy cattle nutrition. J. Dairy Sci. 2006, 89, 1311–1323. [Google Scholar] [CrossRef] [PubMed]
- VandeHaar, M.J.; St-Pierre, N. Major advances in nutrition: Relevance to the sustainability of the dairy industry. J. Dairy Sci. 2006, 89, 1280–1291. [Google Scholar] [CrossRef] [PubMed]
- Huhtanen, P.; Hristov, A.N. A meta-analysis of the effects of dietary protein concentration and degradability on milk protein yield and milk N efficiency in dairy cows. J. Dairy Sci. 2009, 92, 3222–3232. [Google Scholar] [CrossRef] [PubMed]
- Lapierre, H.; Lobley, G.E. Nitrogen recycling in the ruminant: A review. J. Dairy Sci. 2001, 84, E223–E236. [Google Scholar] [CrossRef]
- NRC. Nutrient Requirements of Dairy Cattle, 8th ed.; National Academy Press: Washington, DC, USA, 2001. [Google Scholar]
- NASEM. Nutrient Requirements of Dairy Cattle; National Academy Press: Washington, DC, USA, 2021. [Google Scholar]
- Castillo, A.R.; Kebreab, E.; Beever, D.E.; France, J. A review of efficiency of nitrogen utilisation in lactating dairy cows and its relationship with environmental pollution. J. Anim. Feed Sci. 2000, 9, 1–32. [Google Scholar] [CrossRef]
- Kebreab, E.; France, J.; Mills, J.A.N.; Allison, R.; Dijkstra, J. A dynamic model of N metabolism in the lactating dairy cow and an assessment of impact of N excretion on the environment. J. Anim. Sci. 2002, 80, 248–259. [Google Scholar] [CrossRef] [PubMed]
- Tedeschi, L.O.; Fox, D.G. The Ruminant Nutrition System: An Applied Model for Predicting Nutrient Requirements and Feed Utilization in Ruminants, 3rd ed.; Kendall Hunt: Dubuque, IA, USA, 2020; Volume 1, Available online: https://he.kendallhunt.com/product/ruminant-nutrition-system-volume-1-hard-cover (accessed on 7 February 2025).
- Tedeschi, L.O.; Fox, D.G. The Ruminant Nutrition System: Tables of Equations and Coding, 3rd ed.; Kendall Hunt: Dubuque, IA, USA, 2020; Volume 2, Available online: https://he.kendallhunt.com/product/ruminant-nutrition-system-volume-2-hard-cover (accessed on 7 February 2025).
- Allen, M.S. Do more mechanistic models increase accuracy of prediction of metabolisable protein supply in ruminants? Anim. Prod. Sci. 2019, 59, 1991–1998. [Google Scholar] [CrossRef]
- Fox, D.G.; Tedeschi, L.O.; Tylutki, T.P.; Russell, J.B.; Van Amburgh, M.E.; Chase, L.E.; Pell, A.N.; Overton, T.R. The Cornell Net Carbohydrate and Protein System model for evaluating herd nutrition and nutrient excretion. Anim. Feed Sci. Technol. 2004, 112, 29–78. [Google Scholar] [CrossRef]
- Hanigan, M.D.; Souza, V.C.; Martineau, R.; Daley, V.L.; Kononoff, P. Predicting ruminally undegraded and microbial protein flows from the rumen. J. Dairy Sci. 2021, 104, 8685–8707. [Google Scholar] [CrossRef] [PubMed]
- Cockburn, M. Review: Application and prospective discussion of machine learning for the management of dairy farms. Animals 2020, 10, 1690. [Google Scholar] [CrossRef] [PubMed]
- De Vries, A.; Bliznyuk, N.; Pinedo, P. Invited Review: Examples and opportunities for artificial intelligence (AI) in dairy farms. Appl. Anim. Sci. 2023, 39, 14–22. [Google Scholar] [CrossRef]
- Tedeschi, L.O. ASN-ASAS Symposium: Future of data analytics in nutrition: Mathematical modeling in ruminant nutrition: Approaches and paradigms, extant models, and thoughts for upcoming predictive analytics. J. Anim. Sci. 2019, 97, 1921–1944. [Google Scholar] [CrossRef] [PubMed]
- Breiman, L. Random forests. Mach. Learn. 2001, 45, 5–32. [Google Scholar] [CrossRef]
- Hastie, T.; Tibshirani, R.; Friedman, J.H. The Elements of Statistical Learning: Data Mining, Inference, and Prediction, 2nd ed.; Springer: New York, NY, USA, 2009; Volume 2. [Google Scholar]
- Shine, P.; Murphy, M.D. Over 20 years of machine learning applications on dairy farms: A comprehensive mapping study. Sensors 2022, 22, 52. [Google Scholar] [CrossRef] [PubMed]
- Slob, N.; Catal, C.; Kassahun, A. Application of machine learning to improve dairy farm management: A systematic literature review. Prev. Vet. Med. 2021, 187, 105237. [Google Scholar] [CrossRef] [PubMed]
- Lee, M.; Kim, D.H.; Seo, S.; Tedeschi, L.O. Development of machine learning models for estimating metabolizable protein supply from feed in lactating dairy cows. Animals 2025, 15, 687. [Google Scholar] [CrossRef] [PubMed]
- Tedeschi, L.O. ASAS-NANP Symposium: Mathematical modeling in animal nutrition: The progression of data analytics and artificial intelligence in support of sustainable development in animal science. J. Anim. Sci. 2022, 100, skac111. [Google Scholar] [CrossRef] [PubMed]
- Tedeschi, L.O. The prevailing mathematical modeling classifications and paradigms to support the advancement of sustainable animal production. Animal 2023, 17, 100813. [Google Scholar] [CrossRef] [PubMed]
- Jeon, S.; Kang, H.; Park, S.; Seo, S. Evaluation of the equations to predict net energy requirement for lactation in the cattle feeding system: Based on the literature database. Agriculture 2022, 12, 654. [Google Scholar] [CrossRef]
- RC Team. R: A Language and Environment for Statistical Computing. 2024. Available online: https://www.R-project.org/ (accessed on 14 June 2024).
- Burges, C.J.C. A tutorial on support vector machines for pattern recognition. Data Min. Knowl. Discov. 1998, 2, 121–167. [Google Scholar] [CrossRef]
- Vapnik, V. The Nature of Statistical Learning Theory; Springer Science & Business Media: Berlin/Heidelberg, Germany, 1999. [Google Scholar]
- Meyer, D.; Dimitriadou, E.; Hornik, K.; Weingessel, A.; Leisch, F.; Chang, C.-C.; Lin, C.-C. e1071: Misc Functions of the Department of Statistics, Probability Theory Group, R Package Version 1.7.16; Vienna University of Technology (TU Wien): Vienna, Austria, 2019. [Google Scholar]
- Tedeschi, L.O. ASAS-NANP Symposium: Mathematical modeling in animal nutrition: Synthetic database generation for non-normal multivariate distributions: A rank-based method with application to ruminant methane emissions. J. Anim. Sci. 2025, skaf136. [Google Scholar] [CrossRef] [PubMed]
- Breiman, L.; Cutler, A.; Liaw, A.; Wiener, M. Randomforest: Breiman and Cutler’s Random Forests for Classification and Regression, R Package Version 4.7.1.2; R Foundation for Statistical Computing: Vienna, Austria, 2002. [Google Scholar]
- Tedeschi, L.O. Assessment of the adequacy of mathematical models. Agric. Syst. 2006, 89, 225–247. [Google Scholar] [CrossRef]
- Hinkle, D.E.; Wiersma, W.; Jurs, S.G. Applied Statistics for the Behavioral Sciences, 5th ed.; Houghton Mifflin College Division: Boston, MA, USA, 2003; Volume 663. [Google Scholar]
- Groff, E.B.; Wu, Z. Milk production and nitrogen excretion of dairy cows fed different amounts of protein and varying proportions of alfalfa and corn silage. J. Dairy Sci. 2005, 88, 3619–3632. [Google Scholar] [CrossRef] [PubMed]
- Jeon, E.; Cho, S.; Hwang, S.; Cho, K.; Gondro, C.; Choi, N.-J. Development of prediction model for body weight and energy balance indicators from milk traits in lactating dairy cows based on deep neural networks. J. King Saud Univ.-Sci. 2024, 36, 103008. [Google Scholar] [CrossRef]
- Tedde, A.; Grelet, C.; Ho, P.N.; Pryce, J.E.; Hailemariam, D.; Wang, Z.; Plastow, G.; Gengler, N.; Brostaux, Y.; Froidmont, E.; et al. Validation of dairy cow bodyweight prediction using traits easily recorded by dairy herd improvement organizations and its potential improvement using feature selection algorithms. Animals 2021, 11, 1288. [Google Scholar] [CrossRef] [PubMed]
- Bjerre-Harpøth, V.; Friggens, N.C.; Thorup, V.M.; Larsen, T.; Damgaard, B.M.; Ingvartsen, K.L.; Moyes, K.M. Metabolic and production profiles of dairy cows in response to decreased nutrient density to increase physiological imbalance at different stages of lactation. J. Dairy Sci. 2012, 95, 2362–2380. [Google Scholar] [CrossRef] [PubMed]
- Weber, C.; Hametner, C.; Tuchscherer, A.; Losand, B.; Kanitz, E.; Otten, W.; Sauerwein, H.; Bruckmaier, R.M.; Becker, F.; Kanitz, W.; et al. Hepatic gene expression involved in glucose and lipid metabolism in transition cows: Effects of fat mobilization during early lactation in relation to milk performance and metabolic changes. J. Dairy Sci. 2013, 96, 5670–5681. [Google Scholar] [CrossRef] [PubMed]
- Ingvartsen, K.L. Feeding- and management-related diseases in the transition cow: Physiological adaptations around calving and strategies to reduce feeding-related diseases. Anim. Feed Sci. Technol. 2006, 126, 175–213. [Google Scholar] [CrossRef]
- Silva, H.M.d.; Oliveira, A.S.d. A new protein requirement system for dairy cows. J. Dairy Sci. 2023, 106, 1757–1772. [Google Scholar] [CrossRef] [PubMed]
- Chen, X.; Zheng, H.; Wang, H.; Yan, T. Can machine learning algorithms perform better than multiple linear regression in predicting nitrogen excretion from lactating dairy cows. Sci. Rep. 2022, 12, 12478. [Google Scholar] [CrossRef] [PubMed]
- Gross, J.J. Limiting factors for milk production in dairy cows: Perspectives from physiology and nutrition. J. Anim. Sci. 2022, 100, skac044. [Google Scholar] [CrossRef] [PubMed]
- Lapierre, H.; Martineau, R.; Hanigan, M.D.; van Lingen, H.J.; Kebreab, E.; Spek, J.W.; Ouellet, D.R. Review: Impact of protein and energy supply on the fate of amino acids from absorption to milk protein in dairy cows. Animal 2020, 14, s87–s102. [Google Scholar] [CrossRef] [PubMed]
- Hristov, A.N.; Price, W.J.; Shafii, B. A meta-analysis examining the relationship among dietary factors, dry matter intake, and milk and milk protein yield in dairy cows. J. Dairy Sci. 2004, 87, 2184–2196. [Google Scholar] [CrossRef] [PubMed]
- Azizi, O.; Kaufmann, O.; Hasselmann, L. Relationship between feeding behaviour and feed intake of dairy cows depending on their parity and milk yield. Livest. Sci. 2009, 122, 156–161. [Google Scholar] [CrossRef]
- Chen, L.; Thorup, V.M.; Kudahl, A.B.; Østergaard, S. Effects of heat stress on feed intake, milk yield, milk composition, and feed efficiency in dairy cows: A meta-analysis. J. Dairy Sci. 2024, 107, 3207–3218. [Google Scholar] [CrossRef] [PubMed]
- Rumphorst, T.; Scheu, T.; Koch, C.; Sundrum, A. Inter- and intra-individual variation in the behavior of feed intake on nutrient availability in early lactating dairy cows. Animals 2022, 12, 37. [Google Scholar] [CrossRef] [PubMed]
- de Souza, R.A.; Tempelman, R.J.; Allen, M.S.; VandeHaar, M.J. Updating predictions of dry matter intake of lactating dairy cows. J. Dairy Sci. 2019, 102, 7948–7960. [Google Scholar] [CrossRef] [PubMed]
- Græsbøll, K.; Kirkeby, C.; Nielsen, S.S.; Halasa, T.; Toft, N.; Christiansen, L.E. Models to estimate lactation curves of milk yield and somatic cell count in dairy cows at the herd level for the use in dimulations and predictive models. Front. Vet. Sci. 2016, 3, 115. [Google Scholar] [CrossRef] [PubMed]
- Roseler, D.K.; Fox, D.G.; Chase, L.E.; Pell, A.N.; Stone, W.C. Development and evaluation of equations for prediction of feed intake for lactating Holstein dairy cows. J. Dairy Sci. 1997, 80, 878–893. [Google Scholar] [CrossRef] [PubMed]
- Ellis, J.L.; Qiao, F.; Cant, J.P. Prediction of dry matter intake throughout lactation in a dynamic model of dairy cow performance. J. Dairy Sci. 2006, 89, 1558–1570. [Google Scholar] [CrossRef] [PubMed]
- Gross, J.J. Dairy cow physiology and production limits. Anim. Front. 2023, 13, 44–50. [Google Scholar] [CrossRef] [PubMed]
- Poncheki, J.K.; Canha, M.L.S.; Viechnieski, S.L.; Almeida, R.d. Analysis of daily body weight of dairy cows in early lactation and associations with productive and reproductive performance. Rev. Bras. Zootec. 2015, 44, 187–192. [Google Scholar] [CrossRef]
- Roche, J.R.; Bell, A.W.; Overton, T.R.; Loor, J.J. Nutritional management of the transition cow in the 21st century—A paradigm shift in thinking. Anim. Prod. Sci. 2013, 53, 1000–1023. [Google Scholar] [CrossRef]
- Grömping, U. Variable importance assessment in regression: Linear regression versus random forest. Am. Stat. 2009, 63, 308–319. [Google Scholar] [CrossRef]
- Hamadani, A.; Ganai, N.A.; Mudasir, S.; Shanaz, S.; Alam, S.; Hussain, I. Comparison of artificial intelligence algorithms and their ranking for the prediction of genetic merit in sheep. Sci. Rep. 2022, 12, 18726. [Google Scholar] [CrossRef] [PubMed]
- Kozaklı, Ö.; Ceyhan, A.; Noyan, M. Comparison of machine learning algorithms and multiple linear regression for live weight estimation of Akkaraman lambs. Trop. Anim. Health Prod. 2024, 56, 250. [Google Scholar] [CrossRef] [PubMed]
- Smola, A.J.; Schölkopf, B. A tutorial on support vector regression. Stat. Comput. 2004, 14, 199–222. [Google Scholar] [CrossRef]
- Shine, P.; Scully, T.; Upton, J.; Murphy, M.D. Annual electricity consumption prediction and future expansion analysis on dairy farms using a support vector machine. Appl. Energy 2019, 250, 1110–1119. [Google Scholar] [CrossRef]
- Zhu, Z.; Zhu, X.; Guo, W. Quantitatively determining the somatic cell count of raw milk using dielectric spectra and support vector regression. J. Dairy Sci. 2022, 105, 772–781. [Google Scholar] [CrossRef] [PubMed]

| Variables | n | Mean | Median | Min | Max |
|---|---|---|---|---|---|
| No. of articles | 323 | ||||
| No. of treatments | 1288 | ||||
| No. of animals per study | 15,176 | 47.0 | 4.0 | 384.0 | 45.15 |
| No. of animals per treatment | 15,176 | 11.8 | 2.0 | 52.0 | 9.10 |
| Animal information | |||||
| Days in milk (day) | 1093 | 105.5 | 1.0 | 323.0 | 59.50 |
| Parity | 1084 | 1.8 | 1.0 | 2.0 | 0.28 |
| Body weight (kg) | 1288 | 635.1 | 476.0 | 861.9 | 58.56 |
| Dry matter intake (kg/d) | 1288 | 22.4 | 11.3 | 32.0 | 3.70 |
| Milk yield (kg/d) | 1251 | 34.3 | 10.2 | 58.5 | 8.17 |
| Dietary chemical composition (% DM) | |||||
| Dry matter (% as-fed) | 767 | 53.9 | 13.5 | 96.3 | 12.17 |
| Organic matter | 787 | 92.3 | 46.1 | 98.9 | 2.73 |
| Crude protein | 1280 | 16.6 | 9.3 | 29.6 | 1.96 |
| Neutral detergent fiber | 1288 | 32.8 | 17.6 | 60.8 | 5.03 |
| Acidic detergent fiber | 951 | 20.4 | 8.8 | 39.7 | 3.78 |
| Fat | 652 | 3.9 | 0.3 | 8.9 | 1.22 |
| Ash | 691 | 7.4 | 1.1 | 16.5 | 1.61 |
| Non-starch carbohydrate | 527 | 39.4 | 16.8 | 51.2 | 5.52 |
| Starch | 765 | 24.5 | 0.2 | 47.6 | 6.64 |
| Net protein requirements for maintenance (g/d) | 1288 | 480.3 | 309.7 | 621.1 | 52.24 |
| Variables | n | Mean | Median | Min | Max |
|---|---|---|---|---|---|
| No. of articles | 332 | ||||
| No. of treatments | 1584 | ||||
| No. of animals per study | 18,931 | 48.4 | 4.0 | 777.0 | 56.72 |
| No. of animals per treatment | 18,931 | 12.0 | 2.0 | 58.0 | 9.72 |
| Animal information | |||||
| Days in milk (day) | 1304 | 100.4 | 1.0 | 323.0 | 61.15 |
| Parity | 1341 | 1.9 | 1.0 | 2.0 | 0.28 |
| Body weight (kg) | 1352 | 630.3 | 476.0 | 861.9 | 59.35 |
| Dry matter intake (kg/d) | 1584 | 22.1 | 10.8 | 32.0 | 3.73 |
| Milk yield (kg/d) | 1584 | 33.9 | 10.2 | 58.5 | 8.07 |
| Dietary chemical composition (% DM) | |||||
| Dry matter (% as-fed) | 932 | 53.3 | 13.5 | 96.3 | 11.62 |
| Organic matter | 909 | 92.4 | 46.1 | 98.9 | 2.63 |
| Crude protein | 1510 | 16.5 | 9.3 | 29.6 | 1.95 |
| Neutral detergent fiber | 1392 | 32.9 | 21.0 | 60.8 | 4.81 |
| Acidic detergent fiber | 1103 | 20.4 | 10.3 | 61.6 | 3.71 |
| Fat | 724 | 3.9 | 0.3 | 8.9 | 1.20 |
| Ash | 756 | 7.3 | 1.1 | 16.5 | 1.56 |
| Non-starch carbohydrate | 590 | 39.5 | 16.8 | 51.2 | 5.30 |
| Starch | 872 | 24.8 | 0.2 | 47.6 | 6.68 |
| Net protein requirements for lactation (g/d) | 1584 | 1014.9 | 357.9 | 1923.7 | 234.26 |
| RFR | SVR | |||
|---|---|---|---|---|
| Model | Hold-Out 1 | 10-Fold CV 2 | Hold-Out | 10-Fold CV |
| R2 | 0.77 | 0.82 | 0.65 | 0.58 |
| RMSEP, g/d | 23.35 | 22.38 | 29.35 | 33.34 |
| Mean bias (% RMSEP) 3 | 0.3 | 3.4 | 0.1 | 2.4 |
| Slope bias (% RMSEP) 3 | 0.3 | 1.5 | 2.8 | 0.1 |
| Random bias (% RMSEP) | 99.4 | 95.1 | 97.1 | 97.5 |
| CCC | 0.87 | 0.89 | 0.80 | 0.73 |
| RFR | SVR | |||
|---|---|---|---|---|
| Model | Hold-Out 1 | 10-Fold CV 2 | Hold-Out | 10-Fold CV |
| R2 | 0.79 | 0.82 | 0.78 | 0.76 |
| RMSEP, g/d | 90.45 | 95.17 | 91.36 | 109.06 |
| Mean Bias (% RMSEP) 3 | 0.0 | 0.4 | 0.3 | 0.8 |
| Slope Bias (% RMSEP) 3 | 0.1 | 1.2 | 0.1 | 1.0 |
| Random Bias (% RMSEP) | 99.9 | 98.4 | 99.6 | 98.2 |
| CCC | 0.88 | 0.89 | 0.88 | 0.86 |
Disclaimer/Publisher’s Note: The statements, opinions and data contained in all publications are solely those of the individual author(s) and contributor(s) and not of MDPI and/or the editor(s). MDPI and/or the editor(s) disclaim responsibility for any injury to people or property resulting from any ideas, methods, instructions or products referred to in the content. |
© 2025 by the authors. Licensee MDPI, Basel, Switzerland. This article is an open access article distributed under the terms and conditions of the Creative Commons Attribution (CC BY) license (https://creativecommons.org/licenses/by/4.0/).
Share and Cite
Lee, M.; Kim, D.H.; Seo, S.; Tedeschi, L.O. Development of Machine Learning-Based Sub-Models for Predicting Net Protein Requirements in Lactating Dairy Cows. Animals 2025, 15, 2127. https://doi.org/10.3390/ani15142127
Lee M, Kim DH, Seo S, Tedeschi LO. Development of Machine Learning-Based Sub-Models for Predicting Net Protein Requirements in Lactating Dairy Cows. Animals. 2025; 15(14):2127. https://doi.org/10.3390/ani15142127
Chicago/Turabian StyleLee, Mingyung, Dong Hyeon Kim, Seongwon Seo, and Luis O. Tedeschi. 2025. "Development of Machine Learning-Based Sub-Models for Predicting Net Protein Requirements in Lactating Dairy Cows" Animals 15, no. 14: 2127. https://doi.org/10.3390/ani15142127
APA StyleLee, M., Kim, D. H., Seo, S., & Tedeschi, L. O. (2025). Development of Machine Learning-Based Sub-Models for Predicting Net Protein Requirements in Lactating Dairy Cows. Animals, 15(14), 2127. https://doi.org/10.3390/ani15142127