
Variability in Fishmeal Nutritional Value in Weaned Pigs and Development of Predictive Equations

 , , ,
, , ,  , and
, and 
Simple Summary
Abstract
1. Introduction
2. Materials and Methods
2.1. Experiment 1: Ileal Digestibility of CP and AAs
2.1.1. Diets, Animals, and Experimental Design
2.1.2. Experimental Procedure
2.1.3. Chemical Analysis
2.1.4. Serum Antioxidation and Immune Analyses
2.1.5. Calculation and Statistical Analysis
2.2. Experiment 2: Total Tract Digestibility and Energy Concentration
2.2.1. Diets, Animals, and Experimental Design
2.2.2. Experimental Procedure
2.2.3. Chemical Analyses
2.2.4. Calculation and Statistical Analysis
3. Results
3.1. Experiment 1: Ileal Digestibility of CP and AAs
3.1.1. Chemical Composition in FM
3.1.2. Apparent Ileal Digestibility and Standardized Ileal Digestibility of CP and AAs in FM
3.1.3. Prediction Equations for SIDLAA
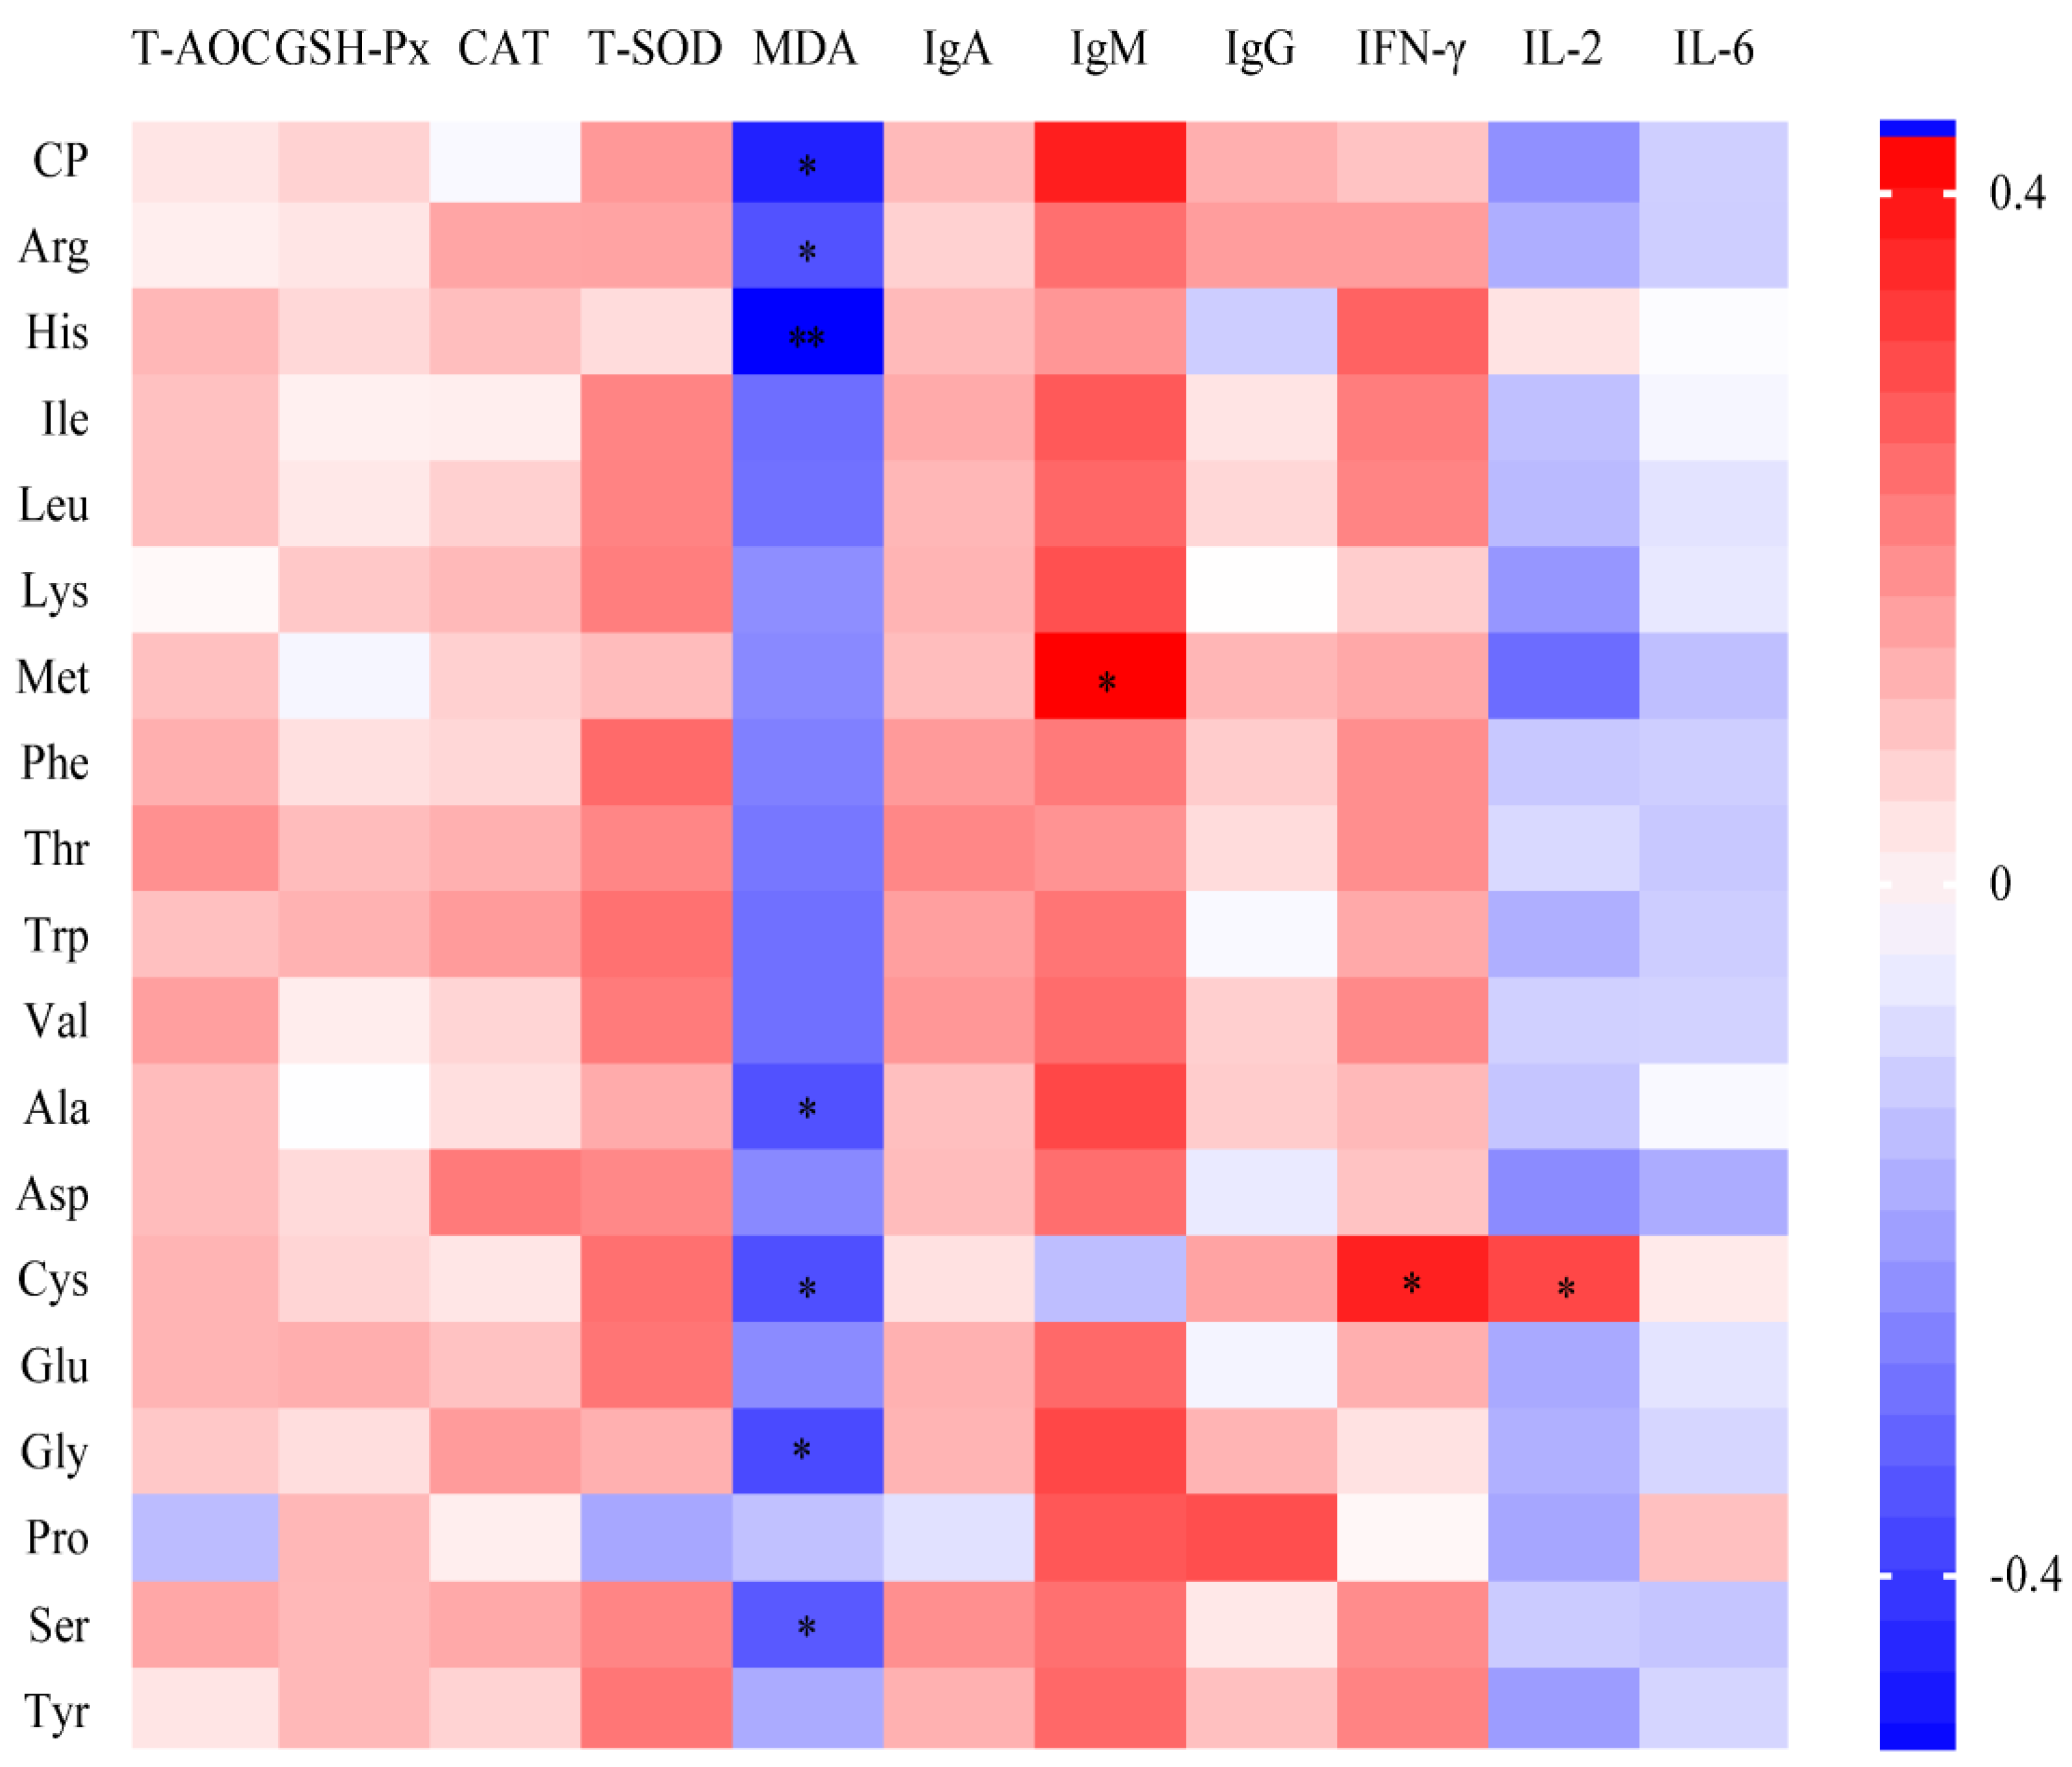
3.1.4. Antioxidant and Immune Capacity in Serum
3.2. Experiment 2: Total Tract Digestibility and Energy Concentration
3.2.1. ATTD of Nutrients in FM
3.2.2. Energy and N Balance in Piglets Fed Different FM Diets
3.2.3. DE, ME, and ATTD of GE in FM
3.2.4. Prediction Equations for DE and ME of FM
4. Discussion
4.1. Ileal AA Digestibility of FM
4.2. The ATTD, DE, and ME of Different FM
5. Conclusions
Author Contributions
Funding
Institutional Review Board Statement
Informed Consent Statement
Data Availability Statement
Conflicts of Interest
Abbreviations
| AA | Amino acid |
| AID | Apparent ileal digestibility |
| ATTD | Apparent total tract digestibility |
| BV | Biological value |
| Ca | Calcium |
| CV | Coefficient of variation |
| CP | Crude protein |
| DE | Digestible energy |
| DM | Dry matter |
| EAA | Essential amino acid |
| EE | Ether extract |
| FM | Fishmeal |
| GE | Gross energy |
| LAA | Limiting amino acid |
| ME | Metabolizable energy |
| N | Nitrogen |
| P | Phosphorus |
| SID | Standardized ileal digestibility |
References
- Garavito-Duarte, Y.R.; Levesque, C.L.; Herrick, K.; Perez-Palencia, J.Y. Nutritional value of high protein ingredients fed to growing pigs in comparison to commonly used protein sources in swine diets. J. Anim. Sci. 2023, 101, skad135. [Google Scholar] [CrossRef] [PubMed]
- Jeyasanta, K.I.; Patterson, J. Study on the effect of freshness of raw materials on the final quality of fish meals. Indian J. Mar. Sci. 2020, 49, 124–134. [Google Scholar]
- Kaewtapee, C.; Mosenthin, R.; Nenning, S.; Wiltafsky, M.; Schäffler, M.; Eklund, M.; Rosenfelder-Kuon, P. Standardized ileal digestibility of amino acids in European soya bean and rapeseed products fed to growing pigs. J. Anim. Physiol. Anim. Nutr. 2018, 102, e695–e705. [Google Scholar] [CrossRef] [PubMed]
- Kong, C.; Kim, K.H.; Ji, S.Y.; Kim, B.G. Energy concentration and phosphorus digestibility in meat meal, fish meal, and soybean meal fed to pigs. Anim. Biosci. 2021, 34, 1822–1828. [Google Scholar] [CrossRef]
- Park, C.S.; Adeola, O. Digestibility of amino acids in fish meal and blood-derived protein sources fed to pigs. Anim. Biosci. 2022, 35, 1418–1425. [Google Scholar] [CrossRef]
- Jones, A.M.; Wu, F.; Woodworth, J.C.; Tokach, M.D.; Goodband, R.D.; DeRouchey, J.M.; Dritz, S.S. Evaluating the effects of fish meal source and level on growth performance of nursery pigs. Transl. Anim. Sci. 2018, 2, 144–155. [Google Scholar] [CrossRef]
- NRC. Nutrient Requirements of Swine; The National Academies Press: Washington, DC, USA, 2012. [Google Scholar]
- Stein, H.H.; Shipley, C.F.; A Easter, R. Technical note: A technique for inserting a T-cannula into the distal ileum of pregnant sows. J. Anim. Sci. 1998, 76, 1433–1436. [Google Scholar] [CrossRef]
- Park, C.S.; Adeola, O. Basal ileal endogenous losses of amino acids in pigs determined by feeding nitrogen-free diet or low-casein diet or by regression analysis. Anim. Feed. Sci. Tech. 2020, 267, 114550. [Google Scholar] [CrossRef]
- Li, S.; Sauer, W.C.; Fan, M.Z. The effect of dietary crude protein level on amino acid digestibility in early-weaned piglets. J. Anim. Physiol. Anim. Nutr. 1993, 70, 26–37. [Google Scholar] [CrossRef]
- Yu, J.; Yu, G.; Yu, B.; Zhang, Y.; He, J.; Zheng, P.; Mao, X.; Luo, J.; Huang, Z.; Luo, Y.; et al. Dietary protease improves growth performance and nutrient digestibility in weaned piglets fed diets with different levels of soybean meal. Livest. Sci. 2020, 241, 104179. [Google Scholar] [CrossRef]
- AOAC International. Official Methods of Analysis of AOAC International, 21st ed.; AOAC International: Rockville, MD, USA, 2019. [Google Scholar]
- Stein, H.; Fuller, M.; Moughan, P.; Sève, B.; Mosenthin, R.; Jansman, A.; Fernández, J.; de Lange, C. Definition of apparent, true, and standardized ileal digestibility of amino acids in pigs. Livest. Sci. 2007, 109, 282–285. [Google Scholar] [CrossRef]
- Adeola, O. Digestion and balance techniques in pigs. In Swine Nutrition; CRC Press: Washington, DC, USA, 2001. [Google Scholar]
- Goethals; Rijpert, J.H.M.; Spek, J.W.; Millet, S.; Bikker, P. Amino acid requirement of weaned piglets. In Wageningen UR Livestock Research Rapport 1436.2023; WUR: Wageningen, The Netherlands, 2023. [Google Scholar]
- Jansman, A.J.M.; Cirot, O.; Corrent, E.; Lambert, W.; Ensink, J.; van Diepen, J.T.M. Interaction and imbalance between indispensable amino acids in young piglets. Animal 2019, 13, 941–949. [Google Scholar] [CrossRef] [PubMed]
- Rojas, O.J.; Stein, H.H. Concentration of digestible, metabolizable, and net energy and digestibility of energy and nutrients in fermented soybean meal, conventional soybean meal, and fish meal fed to weanling pigs. J. Anim. Sci. 2013, 91, 4397–4405. [Google Scholar] [CrossRef]
- Cervantes-Pahm, S.K.; Stein, H.H. Ileal digestibility of amino acids in conventional, fermented, and enzyme-treated soybean meal and in soy protein isolate, fish meal, and casein fed to weanling pigs. J. Anim. Sci. 2010, 88, 2674–2683. [Google Scholar] [CrossRef]
- Moughan, P.J.; Leenaars, G.S.M. Endogenous amino acid flow in the stomach and small intestine of the young growing pig. J. Sci. Food Agric. 1992, 60, 437–442. [Google Scholar] [CrossRef]
- Livingstone, R.; McWilliam, R. The effect of terminal ileum cannulation on the performance of growing pigs. Br. Vet. J. 1985, 141, 186–191. [Google Scholar] [CrossRef]
- Zebrowska, T.; Buraczewski, S. Methods for determination of amino acids bioavailability of pigs-review. Asian-Australas. J. Anim. Sci. 1998, 11, 620–633. [Google Scholar] [CrossRef]
- Bacou, E.; Walk, C.; Rider, S.; Litta, G.; Perez-Calvo, E. Dietary oxidative distress: A review of nutritional challenges as models for poultry, swine and fish. Antioxidants 2021, 10, 525. [Google Scholar] [CrossRef]
- Ighodaro, O.M.; Akinloye, O.A. First line defence antioxidants-superoxide dismutase (SOD), catalase (CAT) and glutathione peroxidase (GPX): Their fundamental role in the entire antioxidant defence grid. Alex. J. Med. 2018, 54, 287–293. [Google Scholar] [CrossRef]
- Hao, Y.; Xing, M.; Gu, X. Research progress on oxidative stress and its nutritional regulation strategies in pigs. Animals 2021, 11, 1384. [Google Scholar] [CrossRef]
- Grönwall, C.; Vas, J.; Silverman, G.J. Protective roles of natural IgM antibodies. Front Immunol. 2012, 3, 66. [Google Scholar] [CrossRef] [PubMed]
- Eriguchi, Y.; Nakamura, K.; Yokoi, Y.; Sugimoto, R.; Takahashi, S.; Hashimoto, D.; Teshima, T.; Ayabe, T.; Selsted, M.E.; Ouellette, A.J. Essential role of IFN-γ in T cell–associated intestinal inflammation. JCI Insight 2018, 3, e121886. [Google Scholar] [CrossRef]
- Fritsch, S.D.; Weichhart, T. Effects of interferons and viruses on metabolism. Front. Immunol. 2016, 7, 630. [Google Scholar] [CrossRef] [PubMed]
- Hoyer, K.K.; Dooms, H.; Barron, L.; Abbas, A.K. Interleukin-2 in the development and control of inflammatory disease. Immunol. Rev. 2008, 226, 19–28. [Google Scholar] [CrossRef] [PubMed]
- Wu, G.; Bazer, F.W.; Davis, T.A.; Kim, S.W.; Li, P.; Rhoads, J.M.; Satterfield, M.C.; Smith, S.B.; Spencer, T.E.; Yin, Y. Arginine metabolism and nutrition in growth, health and disease. Amino Acids 2009, 37, 153–168. [Google Scholar] [CrossRef]
- Kim, B.G.; Liu, Y.; Stein, H.H. Energy concentration and phosphorus digestibility in yeast products produced from the ethanol industry, and in brewers’ yeast, fish meal, and soybean meal fed to growing pigs. J. Anim. Sci. 2014, 92, 5476–5484. [Google Scholar] [CrossRef]
- Kim, S.W.; A Easter, R. Nutritional value of fish meals in the diet for young pigs. J. Anim. Sci. 2001, 79, 1829–1839. [Google Scholar] [CrossRef]
- Sauvant, D.; Perez, J.M.; Tran, G. Tables of Composition and Nutritional Value of Feed Materials: Pigs, Poultry, Cattle, Sheep, Goats, Rabbits, Horses and Fish, 2nd ed.; Wageningen Academic Publishers: Paris, France, 2004. [Google Scholar]
- Ouyang, Y.N.; Wang, S.Y.; Liang, J.C.; Xue, B.; Li, W.J.; Li, Y.J.; Hong, Q.H. Effect of dietary phosphorus levels on energy metabolism and serum reproductive hormones of Yunnan semi-fine wool sheep during non-pregnancy period. Feed. Res. 2021, 44, 4922–4930. [Google Scholar]
- Zong, E.; Huang, P.; Zhang, W.; Li, J.; Li, Y.; Ding, X.; Xiong, X.; Yin, Y.; Yang, H. The effects of dietary sulfur amino acids on growth performance, intestinal morphology, enzyme activity, and nutrient transporters in weaning piglets. J. Anim. Sci. 2018, 96, 1130–1139. [Google Scholar] [CrossRef]

| No. | CP, % | Source | Production Site | Processing | Specie |
|---|---|---|---|---|---|
| FM 1 | 68 | Peru | PESQUERA EXALMAR S.A.A. (Lima, Peru) | Cooking | Peruvian anchovy |
| FM 2 | 68 | Peru | TASA (Lima, Peru) | Cooking | Peruvian anchovy |
| FM 3 | 68 | Peru | PESQUERA HAYDUK S.A. (Lima, Peru) | Steam drying | Peruvian anchovy |
| FM 4 | 68 | Peru | Corporacion Pesquera Inca S.A.C.-Chancay Plant (Lima, Peru) | Cooking | Peruvian anchovy |
| FM 5 | 65 | Peru | TASA (Lima, Peru) | Cooking | Peruvian anchovy |
| FM 6 | 65 | Peru | Corporacion Pesquera Inca S.A.C.-Chancay Plant (Lima, Peru) | Cooking | Peruvian anchovy |
| FM 7 | 64 | America | - | Cooking | American herring |
| FM 8 | 60 | China | Tianjin Hengyuan Feed Sales Co., Ltd. (Tianjin, China) | Steam drying | Sea miscellaneous fish |
| FM 9 | 60 | China | Cangzhou Qiankun Feed Sales Co., Ltd. (Cangzhou, China) | Degreasing | Sea miscellaneous fish |
| FM 10 | 60 | China | Hebei Haixing Fish Meal Feed Factory (Hebei, China) | Degreasing | Sea miscellaneous fish |
| Items | DNF | FM | |||
|---|---|---|---|---|---|
| 68% | 65% | 64% | 60% | ||
| Ingredients, % | |||||
| Corn starch | 79.20 | 58.60 | 58.10 | 57.10 | 55.60 |
| Fishmeal | - | 23.50 | 24.00 | 25.00 | 26.50 |
| Sucrose | 10.00 | 10.00 | 10.00 | 10.00 | 10.00 |
| Soya-bean oil | 3.00 | 3.00 | 3.00 | 3.00 | 3.00 |
| CMC | 4.00 | 4.00 | 4.00 | 4.00 | 4.00 |
| Calcium carbonate | 0.50 | - | - | - | - |
| Dicalcium phosphata | 1.90 | - | - | - | - |
| Cr2O3 | 0.30 | 0.30 | 0.30 | 0.30 | 0.30 |
| NaCl | 0.40 | 0.40 | 0.40 | 0.40 | 0.40 |
| Vitamin premix 1 | 0.05 | 0.05 | 0.05 | 0.05 | 0.05 |
| Mineral premix 2 | 0.15 | 0.15 | 0.15 | 0.15 | 0.15 |
| K2CO3 | 0.40 | - | - | - | - |
| MgO | 0.10 | - | - | - | - |
| Total | 100.00 | 100.00 | 100.00 | 100.00 | 100.00 |
| Nutrient level 3 | |||||
| DE, Mcal/Kg | 3.81 | 3.74 | 3.74 | 3.73 | 3.72 |
| ME, Mcal/Kg | 3.66 | 3.49 | 3.49 | 3.48 | 3.46 |
| CP, % | 0.02 | 16.00 | 16.10 | 16.02 | 15.92 |
| Ca, % | 0.50 | 1.07 | 1.10 | 1.14 | 1.21 |
| P, % | 0.43 | 0.69 | 0.71 | 0.74 | 0.78 |
| SID Lys, % | - | 1.00 | 1.03 | 1.07 | 1.13 |
| Digestible met, % | - | 0.38 | 0.39 | 0.40 | 0.43 |
| Digestible Thr, % | - | 0.52 | 0.53 | 0.55 | 0.59 |
| Digestible Trp, % | - | 0.14 | 0.14 | 0.15 | 0.16 |
| Ingredients | Corn Group | FM | |||
|---|---|---|---|---|---|
| 68% | 65% | 64% | 60% | ||
| Ingredients, % | |||||
| Corn | 96.35 | 71.35 | 70.55 | 70.05 | 67.95 |
| Fishmeal | - | 25.00 | 25.80 | 26.30 | 28.40 |
| Calcium carbonate | 1.05 | 1.05 | 1.05 | 1.05 | 1.05 |
| Dicalcium phosphate | 1.40 | 1.40 | 1.40 | 1.40 | 1.40 |
| NaCl | 0.30 | 0.30 | 0.30 | 0.30 | 0.30 |
| L-Lys·HCl | 0.45 | 0.45 | 0.45 | 0.45 | 0.45 |
| L-Thr | 0.05 | 0.05 | 0.05 | 0.05 | 0.05 |
| DL-Met | 0.10 | 0.10 | 0.10 | 0.10 | 0.10 |
| Vitamin premix 1 | 0.15 | 0.15 | 0.15 | 0.15 | 0.15 |
| Mineral premix 2 | 0.15 | 0.15 | 0.15 | 0.15 | 0.15 |
| Total | 100.00 | 100.00 | 100.00 | 100.00 | 100.00 |
| Nutrient level 3 | |||||
| DE, Mcal/Kg | 3.30 | 3.25 | 3.24 | 3.24 | 3.24 |
| ME, Mcal/Kg | 3.22 | 3.05 | 3.05 | 3.04 | 3.03 |
| CP, % | 7.71 | 22.46 | 22.41 | 22.44 | 22.48 |
| Ca, % | 0.72 | 1.86 | 1.89 | 1.92 | 2.01 |
| TP, % | 0.51 | 1.16 | 1.19 | 1.20 | 1.25 |
| AP, % | 0.30 | 1.01 | 1.03 | 1.04 | 1.10 |
| Digestible Lys, % | 0.44 | 1.55 | 1.58 | 1.60 | 1.69 |
| Digestible Met, % | 0.14 | 0.51 | 0.52 | 0.53 | 0.56 |
| Digestible Thr, % | 0.26 | 0.72 | 0.74 | 0.75 | 0.79 |
| Items | FM 1 | FM 2 | FM 3 | FM 4 | FM 5 | FM 6 | FM 7 | FM 8 | FM 9 | FM10 | Mean | CV | NRC |
|---|---|---|---|---|---|---|---|---|---|---|---|---|---|
| DM | 92.00 | 92.10 | 92.10 | 90.90 | 93.50 | 93.30 | 93.70 | 92.30 | 92.30 | 91.80 | 92.40 | 0.93 | 93.70 |
| CP | 66.91 | 67.64 | 68.83 | 68.89 | 62.12 | 63.00 | 62.96 | 61.72 | 58.61 | 61.22 | 64.19 | 5.60 | 63.28 |
| EE | 8.40 | 9.10 | 9.00 | 7.80 | 12.00 | 12.40 | 12.20 | 10.00 | 11.00 | 10.80 | 10.27 | 16.14 | 9.71 |
| Ash | 16.70 | 14.90 | 14.90 | 15.30 | 19.30 | 19.50 | 19.10 | 21.20 | 22.50 | 21.10 | 18.45 | 15.27 | 16.07 |
| Ca | 3.63 | 3.00 | 3.02 | 3.30 | 5.04 | 5.26 | 5.16 | 3.16 | 5.45 | 3.08 | 4.01 | 26.62 | 4.28 |
| P | 2.62 | 2.38 | 2.44 | 2.52 | 3.14 | 3.29 | 3.24 | 2.30 | 3.10 | 2.24 | 2.73 | 15.30 | 2.93 |
| Essential AAs | |||||||||||||
| Arg | 3.75 | 3.81 | 3.78 | 3.77 | 3.59 | 3.71 | 3.75 | 3.12 | 3.44 | 3.05 | 3.58 | 7.88 | 3.84 |
| His | 1.85 | 2.41 | 2.45 | 2.04 | 1.40 | 1.38 | 1.41 | 1.39 | 1.49 | 1.35 | 1.72 | 25.62 | 1.44 |
| Ile | 2.90 | 2.78 | 2.72 | 2.91 | 2.41 | 2.36 | 2.39 | 2.56 | 2.33 | 2.51 | 2.59 | 8.66 | 2.65 |
| Leu | 4.87 | 4.84 | 4.82 | 4.93 | 4.13 | 4.09 | 4.07 | 4.36 | 3.90 | 4.27 | 4.43 | 8.94 | 4.47 |
| Lys | 5.21 | 5.23 | 5.18 | 5.29 | 4.48 | 4.47 | 4.48 | 4.36 | 4.15 | 4.27 | 4.71 | 9.68 | 4.56 |
| Met | 1.86 | 1.81 | 1.87 | 2.01 | 1.53 | 1.59 | 1.58 | 1.70 | 1.57 | 1.64 | 1.72 | 9.44 | 1.73 |
| Phe | 2.73 | 2.62 | 2.57 | 2.68 | 2.29 | 2.26 | 2.28 | 2.26 | 2.27 | 2.29 | 2.43 | 8.17 | 2.47 |
| Thr | 2.84 | 2.86 | 2.85 | 2.93 | 2.54 | 2.47 | 2.50 | 2.49 | 2.38 | 2.48 | 2.63 | 7.91 | 2.58 |
| Trp | 0.69 | 0.67 | 0.67 | 0.72 | 0.52 | 0.52 | 0.49 | 0.58 | 0.52 | 0.57 | 0.60 | 14.24 | 0.63 |
| Val | 3.26 | 3.17 | 3.11 | 3.26 | 2.73 | 2.73 | 2.76 | 2.89 | 2.74 | 2.84 | 2.95 | 7.66 | 3.06 |
| Nonessential AAs | |||||||||||||
| Ala | 4.24 | 4.28 | 4.22 | 4.27 | 3.91 | 3.97 | 3.95 | 3.74 | 3.96 | 3.70 | 4.02 | 5.38 | 3.93 |
| Asp | 6.08 | 6.04 | 6.04 | 6.16 | 5.50 | 5.46 | 5.46 | 5.40 | 5.17 | 5.32 | 5.66 | 6.57 | 5.41 |
| Cys | 0.58 | 0.65 | 0.66 | 0.67 | 0.53 | 0.56 | 0.53 | 0.53 | 0.54 | 0.68 | 0.59 | 10.84 | 0.61 |
| Glu | 9.23 | 8.90 | 8.88 | 9.28 | 8.59 | 8.53 | 8.56 | 8.49 | 8.12 | 8.33 | 8.69 | 4.32 | 7.88 |
| Gly | 4.15 | 4.14 | 4.12 | 4.06 | 4.80 | 4.97 | 4.89 | 3.55 | 4.74 | 3.46 | 4.29 | 12.64 | 4.71 |
| Pro | 2.88 | 2.76 | 2.72 | 2.72 | 3.37 | 3.26 | 3.31 | 2.11 | 3.21 | 2.39 | 2.87 | 14.57 | 2.89 |
| Ser | 2.43 | 2.59 | 2.62 | 2.51 | 2.32 | 2.32 | 2.31 | 2.15 | 2.19 | 2.12 | 2.36 | 7.54 | 2.43 |
| Tyr | 2.26 | 2.10 | 2.16 | 2.17 | 1.81 | 1.94 | 1.91 | 1.81 | 1.83 | 1.84 | 1.98 | 8.70 | 1.88 |
| Items | FM 1 | FM 2 | FM 3 | FM 4 | FM 5 | FM 6 | FM 7 | FM 8 | FM 9 | FM 10 | Mean | SEM | p-Value | NRC |
|---|---|---|---|---|---|---|---|---|---|---|---|---|---|---|
| CP | 63.53 a | 78.09 a | 74.52 a | 76.15 a | 67.45 a | 77.86 a | 72.69 a | 48.01 b | 64.41 a | 62.19 ab | 68.49 | 3.23 | <0.01 | 82 |
| Essential AAs | ||||||||||||||
| Arg | 85.36 abc | 89.88 ab | 87.34 ab | 88.54 ab | 84.58 abc | 91.48 a | 86.57 ab | 77.90 c | 83.11 bc | 82.93 bc | 85.77 | 1.63 | <0.01 | 85 |
| His | 74.61 ab | 86.28 a | 79.44 ab | 84.65 a | 73.56 ab | 83.74 a | 75.59 ab | 67.99 b | 75.90 ab | 72.83 ab | 77.46 | 3.10 | 0.03 | 82 |
| Ile | 80.33 abcd | 86.69 abc | 82.54 abc | 87.02 ab | 78.06 cd | 87.85 a | 83.16 abc | 72.25 d | 78.60 cd | 79.16 bcd | 81.57 | 1.77 | <0.01 | 82 |
| Leu | 82.84 ab | 88.67 ab | 84.70 ab | 87.33 ab | 80.52 bc | 89.45 a | 84.89 ab | 73.54 c | 81.98 b | 81.48 b | 83.54 | 1.56 | <0.01 | 82 |
| Lys | 85.06 abc | 90.84 a | 87.78 abc | 90.26 a | 84.25 abc | 90.88 a | 86.48 abc | 76.53 d | 83.11 bcd | 82.55 bcd | 85.77 | 1.38 | <0.01 | 85 |
| Met | 82.92 cd | 90.99 ab | 89.10 abc | 89.94 ab | 84.88 bc | 92.10 a | 88.12 abc | 77.70 d | 85.66 bc | 87.72 abc | 86.91 | 1.33 | <0.01 | 86 |
| Phe | 76.12 c | 85.59 ab | 80.95 abc | 84.77 abc | 77.47 bc | 87.05 a | 81.26 abc | 65.88 d | 78.09 bc | 78.34 abc | 79.55 | 1.86 | <0.01 | 80 |
| Thr | 73.78 b | 82.81 ab | 77.15 ab | 82.82 ab | 73.47 b | 85.73 a | 78.13 ab | 60.93 c | 75.48 b | 74.93 b | 76.52 | 2.16 | <0.01 | 78 |
| Trp | 71.15 ab | 80.11 ab | 75.96 ab | 77.55 ab | 67.50 b | 80.35 a | 71.92 ab | 53.04 c | 69.87 ab | 69.84 ab | 71.73 | 2.45 | <0.01 | 73 |
| Val | 77.60 a | 84.59 a | 80.60 a | 84.24 a | 77.52 a | 85.53 a | 79.95 a | 66.40 b | 78.20 a | 78.16 a | 79.28 | 1.88 | <0.01 | 81 |
| Nonessential AAs | ||||||||||||||
| Ala | 76.79 ab | 84.92 a | 80.39 a | 83.92 a | 77.37 ab | 86.21 a | 81.71 a | 68.46 b | 77.35 ab | 77.87 ab | 79.50 | 2.08 | <0.01 | 79 |
| Asp | 71.01 abcd | 80.54 abc | 76.56 abcd | 78.38 abcd | 69.08 bcd | 82.69 a | 71.90 abcd | 49.29 e | 66.31 d | 69.16 bcd | 73.96 | 2.67 | <0.01 | 71 |
| Cys | 61.64 bcd | 65.70 abc | 54.87 cd | 78.17 a | 63.56 bc | 61.60 bcd | 47.77 d | 60.82 bcd | 70.40 ab | 63.42 bc | 62.80 | 2.87 | <0.01 | 62 |
| Glu | 81.77 ab | 86.53 ab | 82.81 ab | 86.48 ab | 79.201 b | 88.96 a | 84.19 ab | 70.93 c | 79.89 b | 79.29 b | 82.01 | 1.54 | <0.01 | 79 |
| Gly | 58.84 abc | 73.81 ab | 68.74 ab | 68.07 b | 65.87 abc | 78.86 a | 72.42 ab | 42.21 c | 62.42 abc | 55.97 bc | 64.72 | 4.67 | <0.01 | 71 |
| Pro | −24.52 | 19.12 | 14.69 | 6.46 | −17.93 | 28.02 | 29.90 | −10.09 | −29.38 | −26.47 | −1.02 | 34.34 | 0.91 | 65 |
| Ser | 70.16 b | 79.74 ab | 74.70 ab | 80.11 ab | 70.55 b | 83.99 a | 75.93 ab | 54.65 c | 71.24 b | 69.69 b | 73.08 | 2.40 | <0.01 | 72 |
| Tyr | 78.93 bcd | 85.60 ab | 81.09 abcd | 82.57 abc | 74.94 cde | 88.42 a | 80.28 abcd | 67.21 e | 77.71 bcd | 72.53 de | 82.09 | 1.99 | <0.01 | 73 |
| Items | FM 1 | FM 2 | FM 3 | FM 4 | FM 5 | FM 6 | FM 7 | FM 8 | FM 9 | FM 10 | Mean | SEM | p-Value | NRC |
|---|---|---|---|---|---|---|---|---|---|---|---|---|---|---|
| CP | 82.61 abc | 95.45 ab | 91.67 ab | 94.44 ab | 85.59 ab | 97.47 a | 90.33 ab | 66.26 c | 82.71 ab | 80.41 bc | 86.69 | 3.23 | <0.01 | 85 |
| Essential AAs | ||||||||||||||
| Arg | 96.22 ab | 101.47 a | 98.81 a | 100.55 a | 96.18 ab | 102.47 a | 97.55 ab | 89.63 b | 95.11 ab | 96.33 ab | 97.43 | 1.63 | <0.01 | 86 |
| His | 86.64 ab | 94.68 ab | 89.82 ab | 95.91 ab | 86.16 ab | 96.97 a | 89.90 ab | 80.90 b | 89.13 ab | 86.41 ab | 89.65 | 3.10 | 0.03 | 84 |
| Ile | 88.54 abc | 95.01 ab | 90.86 ab | 94.67 ab | 88.55 abc | 96.84 a | 92.44 ab | 80.70 c | 88.72 abc | 88.15 bc | 90.45 | 1.77 | <0.01 | 83 |
| Leu | 90.41 ab | 96.18 ab | 92.09 ab | 95.09 ab | 90.03 ab | 97.41 a | 92.99 ab | 81.50 c | 90.77 ab | 89.65 b | 91.61 | 1.56 | <0.01 | 83 |
| Lys | 90.20 abc | 95.94 ab | 92.96 abc | 95.24 ab | 90.05 abc | 96.33 a | 91.88 abc | 82.03 d | 89.19 bc | 88.20 cd | 91.20 | 1.38 | <0.01 | 86 |
| Met | 87.49 cd | 96.03 ab | 93.84 abc | 93.35 abc | 90.03 abc | 95.58 ab | 92.77 ab | 82.64 d | 89.71 abc | 91.06 abc | 91.25 | 1.33 | <0.01 | 87 |
| Phe | 85.32 b | 93.90 ab | 89.26 ab | 92.94 ab | 86.84 ab | 95.92 a | 90.15 ab | 74.91 c | 87.63 ab | 86.92 ab | 88.38 | 1.86 | <0.01 | 82 |
| Thr | 86.02 b | 95.24 a | 89.77 ab | 94.88 ab | 87.16 b | 98.35 a | 91.16 ab | 73.55 c | 88.94 ab | 87.36 b | 89.24 | 2.16 | <0.01 | 81 |
| Trp | 82.57 b | 91.54 ab | 87.39 ab | 89.73 ab | 81.56 b | 94.41 a | 85.98 ab | 65.23 c | 82.93 ab | 82.03 b | 84.34 | 2.45 | <0.01 | 76 |
| Val | 86.66 b | 93.90 ab | 89.67 ab | 93.42 ab | 87.48 ab | 95.78 a | 90.06 ab | 75.83 c | 88.16 ab | 87.34 ab | 88.83 | 1.88 | <0.01 | 83 |
| Nonessential AAs | ||||||||||||||
| Ala | 88.68 ab | 96.93 a | 92.39 a | 95.46 a | 89.38 ab | 97.97 a | 93.04 a | 80.47 b | 89.60 ab | 89.64 ab | 91.36 | 2.09 | <0.01 | 80 |
| Asp | 79.97 abc | 89.76 ab | 86.05 abc | 88.30 abc | 78.93 abc | 91.97 a | 81.67 abc | 58.44 d | 76.31 c | 78.37 bc | 80.98 | 2.67 | <0.01 | 73 |
| Cys | 81.63 bcd | 86.35 abcd | 77.00 cd | 94.00 ab | 80.76 bcd | 99.59 a | 75.93 cd | 72.73 d | 88.49 abc | 83.42 bcd | 83.99 | 2.87 | <0.01 | 64 |
| Glu | 89.50 ab | 94.70 ab | 90.99 ab | 94.39 ab | 87.96 b | 96.69 a | 91.85 ab | 78.59 c | 88.35 b | 87.46 b | 90.05 | 1.55 | <0.01 | 80 |
| Gly | 89.72 ab | 104.68 a | 99.30 a | 100.28 a | 91.21 ab | 103.55 a | 95.40 ab | 74.08 b | 87.54 ab | 89.27 ab | 93.50 | 4.67 | <0.01 | 75 |
| Pro | 149.27 | 217.73 | 206.45 | 188.79 | 164.40 | 196.54 | 176.24 | 175.27 | 139.13 | 168.66 | 178.25 | 34.34 | 0.89 | 86 |
| Ser | 85.37 b | 94.95 ab | 89.90 ab | 95.31 ab | 86.32 b | 98.43 a | 90.61 ab | 70.13 c | 87.01 b | 85.17 b | 88.32 | 2.40 | <0.01 | 75 |
| Tyr | 92.34 abc | 99.01 ab | 94.21 abc | 96.58 abc | 91.60 abc | 101.00 a | 93.69 abc | 79.54 d | 90.55 bc | 87.57 cd | 92.61 | 1.99 | <0.01 | 74 |
| Equations | Prediction Equations | R2 | p-Value |
|---|---|---|---|
| 1 | Lys = 47.42 + 12.15 × Arg (%) | 0.72 | <0.01 |
| 2 | Lys = 33.93 + 11.54 × Arg (%) + 26.41 × Cys (%) | 0.91 | <0.01 |
| 3 | Lys = 29.00 + 8.31 × Arg (%) + 37.87 × Cys (%) + 3.35 × Pro (%) | 0.96 | <0.01 |
| 4 | Met = 54.21 + 10.51 × Arg (%) | 0.57 | 0.01 |
| 5 | Thr = 25.11 + 18.01 × Arg (%) | 0.53 | 0.02 |
| 6 | Trp = 6.15 + 22.08 × Arg (%) | 0.54 | 0.02 |
| Items | FM 1 | FM 2 | FM 3 | FM 4 | FM 5 | FM 6 | FM 7 | FM 8 | FM 9 | FM 10 | SEM | p-Value |
|---|---|---|---|---|---|---|---|---|---|---|---|---|
| T-AOC, U/mL | 1.61 | 2.05 | 2.06 | 2.89 | 2.30 | 1.64 | 2.11 | 1.83 | 2.81 | 2.83 | 0.43 | 0.32 |
| GSH-Px, U/mL | 451.86 | 510.52 | 437.15 | 381.34 | 426.38 | 419.76 | 394.51 | 440.64 | 396.31 | 380.46 | 31.12 | 0.16 |
| MDA, nmol/mL | 7.01 | 7.74 | 11.75 | 6.05 | 10.01 | 7.43 | 5.72 | 10.47 | 6.39 | 7.82 | 1.24 | 0.05 |
| T-SOD, U/mL | 72.28 | 68.69 | 67.16 | 73.04 | 73.17 | 73.02 | 74.74 | 70.45 | 74.36 | 74.68 | 2.75 | 0.64 |
| CAT, U/mL | 26.78 | 33.18 | 47.36 | 28.26 | 20.96 | 19.87 | 26.99 | 31.97 | 17.98 | 39.64 | 11.04 | 0.81 |
| IgA, ug/ml | 22.77 | 22.27 | 24.35 | 25.94 | 25.90 | 23.53 | 26.68 | 23.18 | 27.01 | 25.51 | 2.28 | 0.87 |
| IgM, ug/ml | 18.05 b | 30.35 a | 21.46 ab | 22.88 ab | 24.34 ab | 20.79 ab | 29.41 ab | 20.83 ab | 20.38 ab | 20.15 ab | 2.48 | 0.04 |
| IgG, ug/ml | 136.91 ab | 136.51 ab | 108.44 ab | 173.52 ab | 253.82 a | 170.12 ab | 82.93 b | 179.11 ab | 200.46 ab | 103.60 b | 27.12 | 0.01 |
| IFN-γ, pg/ml | 1272.73 ab | 924.29 ab | 765.69 b | 1499.92 a | 1276.21 ab | 1430.50 a | 958.06 ab | 1165.49 ab | 1351.71 a | 715.42 b | 122.62 | <0.01 |
| IL-2, pg/ml | 228.58 bcd | 178.53 d | 148.51 d | 321.80 ab | 192.40 bcd | 281.22 bc | 167.42 d | 301.11 ab | 379.86 a | 282.95 bc | 19.58 | <0.01 |
| IL-6, ng/L | 654.47 ab | 305.36 cd | 884.67 a | 662.08 ab | 443.80 bcd | 633.48 ab | 268.59 d | 628.58 ab | 708.14 ab | 566.80 bc | 57.08 | <0.01 |
| Items | FM 1 | FM 2 | FM 3 | FM 4 | FM 5 | FM 6 | FM 7 | FM 8 | FM 9 | FM 10 | Mean | SEM | p-Value | NRC |
|---|---|---|---|---|---|---|---|---|---|---|---|---|---|---|
| DM | 83.65 ab | 83.44 ab | 80.43 ab | 82.10 ab | 79.63 ab | 73.89 ab | 71.09 b | 75.90 ab | 74.94 ab | 84.54 a | 78.96 | 2.47 | 0.01 | - |
| CP | 94.65 a | 94.44 a | 91.93 ab | 93.62 ab | 93.32 ab | 91.22 ab | 89.58 b | 91.41 ab | 92.53 ab | 94.17 a | 92.69 | 0.83 | <0.01 | - |
| EE | 68.94 | 82.24 | 69.32 | 69.31 | 81.46 | 74.06 | 71.22 | 75.99 | 70.61 | 83.58 | 74.67 | 4.41 | 0.12 | - |
| Ash | 68.21 ab | 67.88 ab | 65.20 ab | 69.99 a | 60.29 ab | 56.31 ab | 46.58 b | 60.03 ab | 55.62 ab | 74.03 a | 62.41 | 4.34 | 0.01 | - |
| Ca | 55.88 | 52.29 | 53.49 | 53.78 | 53.29 | 50.62 | 40.34 | 49.60 | 49.18 | 62.41 | 52.09 | 5.64 | 0.56 | - |
| P | 70.19 | 68.65 | 66.43 | 68.87 | 66.39 | 61.72 | 55.88 | 63.15 | 58.74 | 74.41 | 65.44 | 4.04 | 0.12 | 79 |
| Items | FM 1 | FM 2 | FM 3 | FM 4 | FM 5 | FM 6 | FM 7 | FM 8 | FM 9 | FM 10 | SEM | p-Value |
|---|---|---|---|---|---|---|---|---|---|---|---|---|
| N intake, g/d | 33.35 | 34.19 | 31.56 | 27.53 | 43.12 | 37.09 | 35.65 | 41.38 | 35.31 | 34.22 | 8.84 | 0.99 |
| Fecal N, g/d | 2.66 | 2.84 | 3.44 | 3.00 | 3.23 | 4.13 | 4.17 | 4.06 | 3.36 | 2.88 | 0.46 | 0.36 |
| Urine N, g/d | 14.11 | 12.22 | 6.47 | 8.49 | 8.03 | 7.39 | 11.60 | 16.35 | 9.14 | 13.53 | 4.37 | 0.89 |
| N deposition, g/d | 16.58 | 19.14 | 21.65 | 16.03 | 31.85 | 25.58 | 19.89 | 20.97 | 22.80 | 17.80 | 6.39 | 0.94 |
| N deposition rate, % | 50.60 | 53.48 | 66.43 | 55.47 | 71.47 | 67.49 | 52.28 | 52.23 | 59.39 | 54.83 | 8.01 | 0.77 |
| BV, % | 55.95 | 60.21 | 77.47 | 63.35 | 78.82 | 76.56 | 60.30 | 58.48 | 66.18 | 61.44 | 8.41 | 0.64 |
| Items | FM 1 | FM 2 | FM 3 | FM 4 | FM 5 | FM 6 | FM 7 | FM 8 | FM 9 | FM10 | SEM | p-Value |
|---|---|---|---|---|---|---|---|---|---|---|---|---|
| Daily feces output, kg/d | 0.27 | 0.27 | 0.30 | 0.28 | 0.29 | 0.37 | 0.36 | 0.37 | 0.33 | 0.26 | 0.04 | 0.47 |
| Daily urine output, kg/d | 2.04 | 2.09 | 3.63 | 2.59 | 2.43 | 2.39 | 2.63 | 3.18 | 3.08 | 3.05 | 0.72 | 0.87 |
| Daily balance of GE | ||||||||||||
| GE intake, Mcal/d | 4.39 | 4.36 | 4.40 | 4.53 | 4.60 | 4.70 | 4.49 | 4.63 | 4.50 | 4.38 | 0.67 | 1.00 |
| GE in feces, Mcal/d | 0.34 | 0.34 | 0.39 | 0.36 | 0.39 | 0.48 | 0.46 | 0.47 | 0.42 | 0.33 | 0.05 | 0.36 |
| GE in urine, Mcal/d | 0.08 | 0.06 | 0.06 | 0.06 | 0.07 | 0.12 | 0.07 | 0.09 | 0.08 | 0.07 | 0.01 | 0.13 |
| Items | FM 1 | FM 2 | FM 3 | FM 4 | FM 5 | FM 6 | FM 7 | FM 8 | FM 9 | FM 10 | Mean | SEM | p-Value | NRC |
|---|---|---|---|---|---|---|---|---|---|---|---|---|---|---|
| DE, Mcal/kg | 3.63 ab | 3.84 ab | 3.79 ab | 3.91 a | 3.79 ab | 3.58 ab | 3.48 ab | 3.62 ab | 3.38 b | 3.90 a | 3.69 | 0.11 | 0.01 | 3.96 |
| ME, Mcal/kg | 3.48 ab | 3.74 ab | 3.71 ab | 3.80 a | 3.71 ab | 3.44 ab | 3.38 ab | 3.50 ab | 3.25 b | 3.78 a | 3.58 | 0.12 | 0.02 | 3.53 |
| ATTD of GE, % | 81.68 ab | 83.40 ab | 82.54 ab | 89.08 a | 83.10 ab | 79.46 ab | 76.21 b | 83.87 ab | 79.40 ab | 89.60 a | 82.83 | 2.35 | 0.01 | - |
| ME/DE, % | 95.88 | 97.32 | 97.87 | 97.16 | 97.77 | 96.03 | 96.98 | 96.50 | 96.00 | 97.06 | 96.86 | 1.00 | 0.85 | 89.14 |
| Equations | Prediction Equations | R2 | p-Value |
|---|---|---|---|
| Excluding AAs | |||
| 7 | DE = 4.87 − 0.43 × P (%) | 0.74 | <0.01 |
| 8 | DE = 2.51 − 0.29 × P (%) + 0.03 × CP (%) | 0.90 | <0.01 |
| 9 | ME = 4.81 − 0.45 × P (%) | 0.73 | <0.01 |
| 10 | ME = 2.35 − 0.30 × P (%) + 0.03 × CP (%) | 0.88 | <0.01 |
| 11 | ME = 1.75 − 0.39 × P (%) + 0.04 × CP (%) + 0.04 × EE (%) | 0.95 | <0.01 |
| Including AAs | |||
| 12 | DE = 1.86 + 3.02 × Cys (%) | 0.86 | <0.01 |
| 13 | ME = 1.66 + 3.17 × Cys (%) | 0.84 | <0.01 |
Disclaimer/Publisher’s Note: The statements, opinions and data contained in all publications are solely those of the individual author(s) and contributor(s) and not of MDPI and/or the editor(s). MDPI and/or the editor(s) disclaim responsibility for any injury to people or property resulting from any ideas, methods, instructions or products referred to in the content. |
© 2025 by the authors. Licensee MDPI, Basel, Switzerland. This article is an open access article distributed under the terms and conditions of the Creative Commons Attribution (CC BY) license (https://creativecommons.org/licenses/by/4.0/).
Share and Cite
Yang, P.; Su, X.; Li, B.; Jin, J.; Yu, B.; He, J.; Yu, J.; Wang, Q.; Wang, H.; Chen, D.; et al. Variability in Fishmeal Nutritional Value in Weaned Pigs and Development of Predictive Equations. Animals 2025, 15, 1872. https://doi.org/10.3390/ani15131872
Yang P, Su X, Li B, Jin J, Yu B, He J, Yu J, Wang Q, Wang H, Chen D, et al. Variability in Fishmeal Nutritional Value in Weaned Pigs and Development of Predictive Equations. Animals. 2025; 15(13):1872. https://doi.org/10.3390/ani15131872
Chicago/Turabian StyleYang, Pei, Xiaoyan Su, Bin Li, Junqi Jin, Bing Yu, Jun He, Jie Yu, Quyuan Wang, Huifen Wang, Daiwen Chen, and et al. 2025. "Variability in Fishmeal Nutritional Value in Weaned Pigs and Development of Predictive Equations" Animals 15, no. 13: 1872. https://doi.org/10.3390/ani15131872
APA StyleYang, P., Su, X., Li, B., Jin, J., Yu, B., He, J., Yu, J., Wang, Q., Wang, H., Chen, D., & Yan, H. (2025). Variability in Fishmeal Nutritional Value in Weaned Pigs and Development of Predictive Equations. Animals, 15(13), 1872. https://doi.org/10.3390/ani15131872