
Comparison of the Prevalence and Location of Trigger Points in Dressage and Show-Jumping Horses

 , , , and
Simple Summary
Abstract
1. Introduction
2. Materials and Methods
2.1. Animals
2.2. Outcome Measures
2.3. Trigger Point Identification
2.4. Pressure Algometry
2.5. Thermographic Evaluation
2.6. Horse Grimace Scale
2.7. Statistical Analysis
3. Results
3.1. Horses
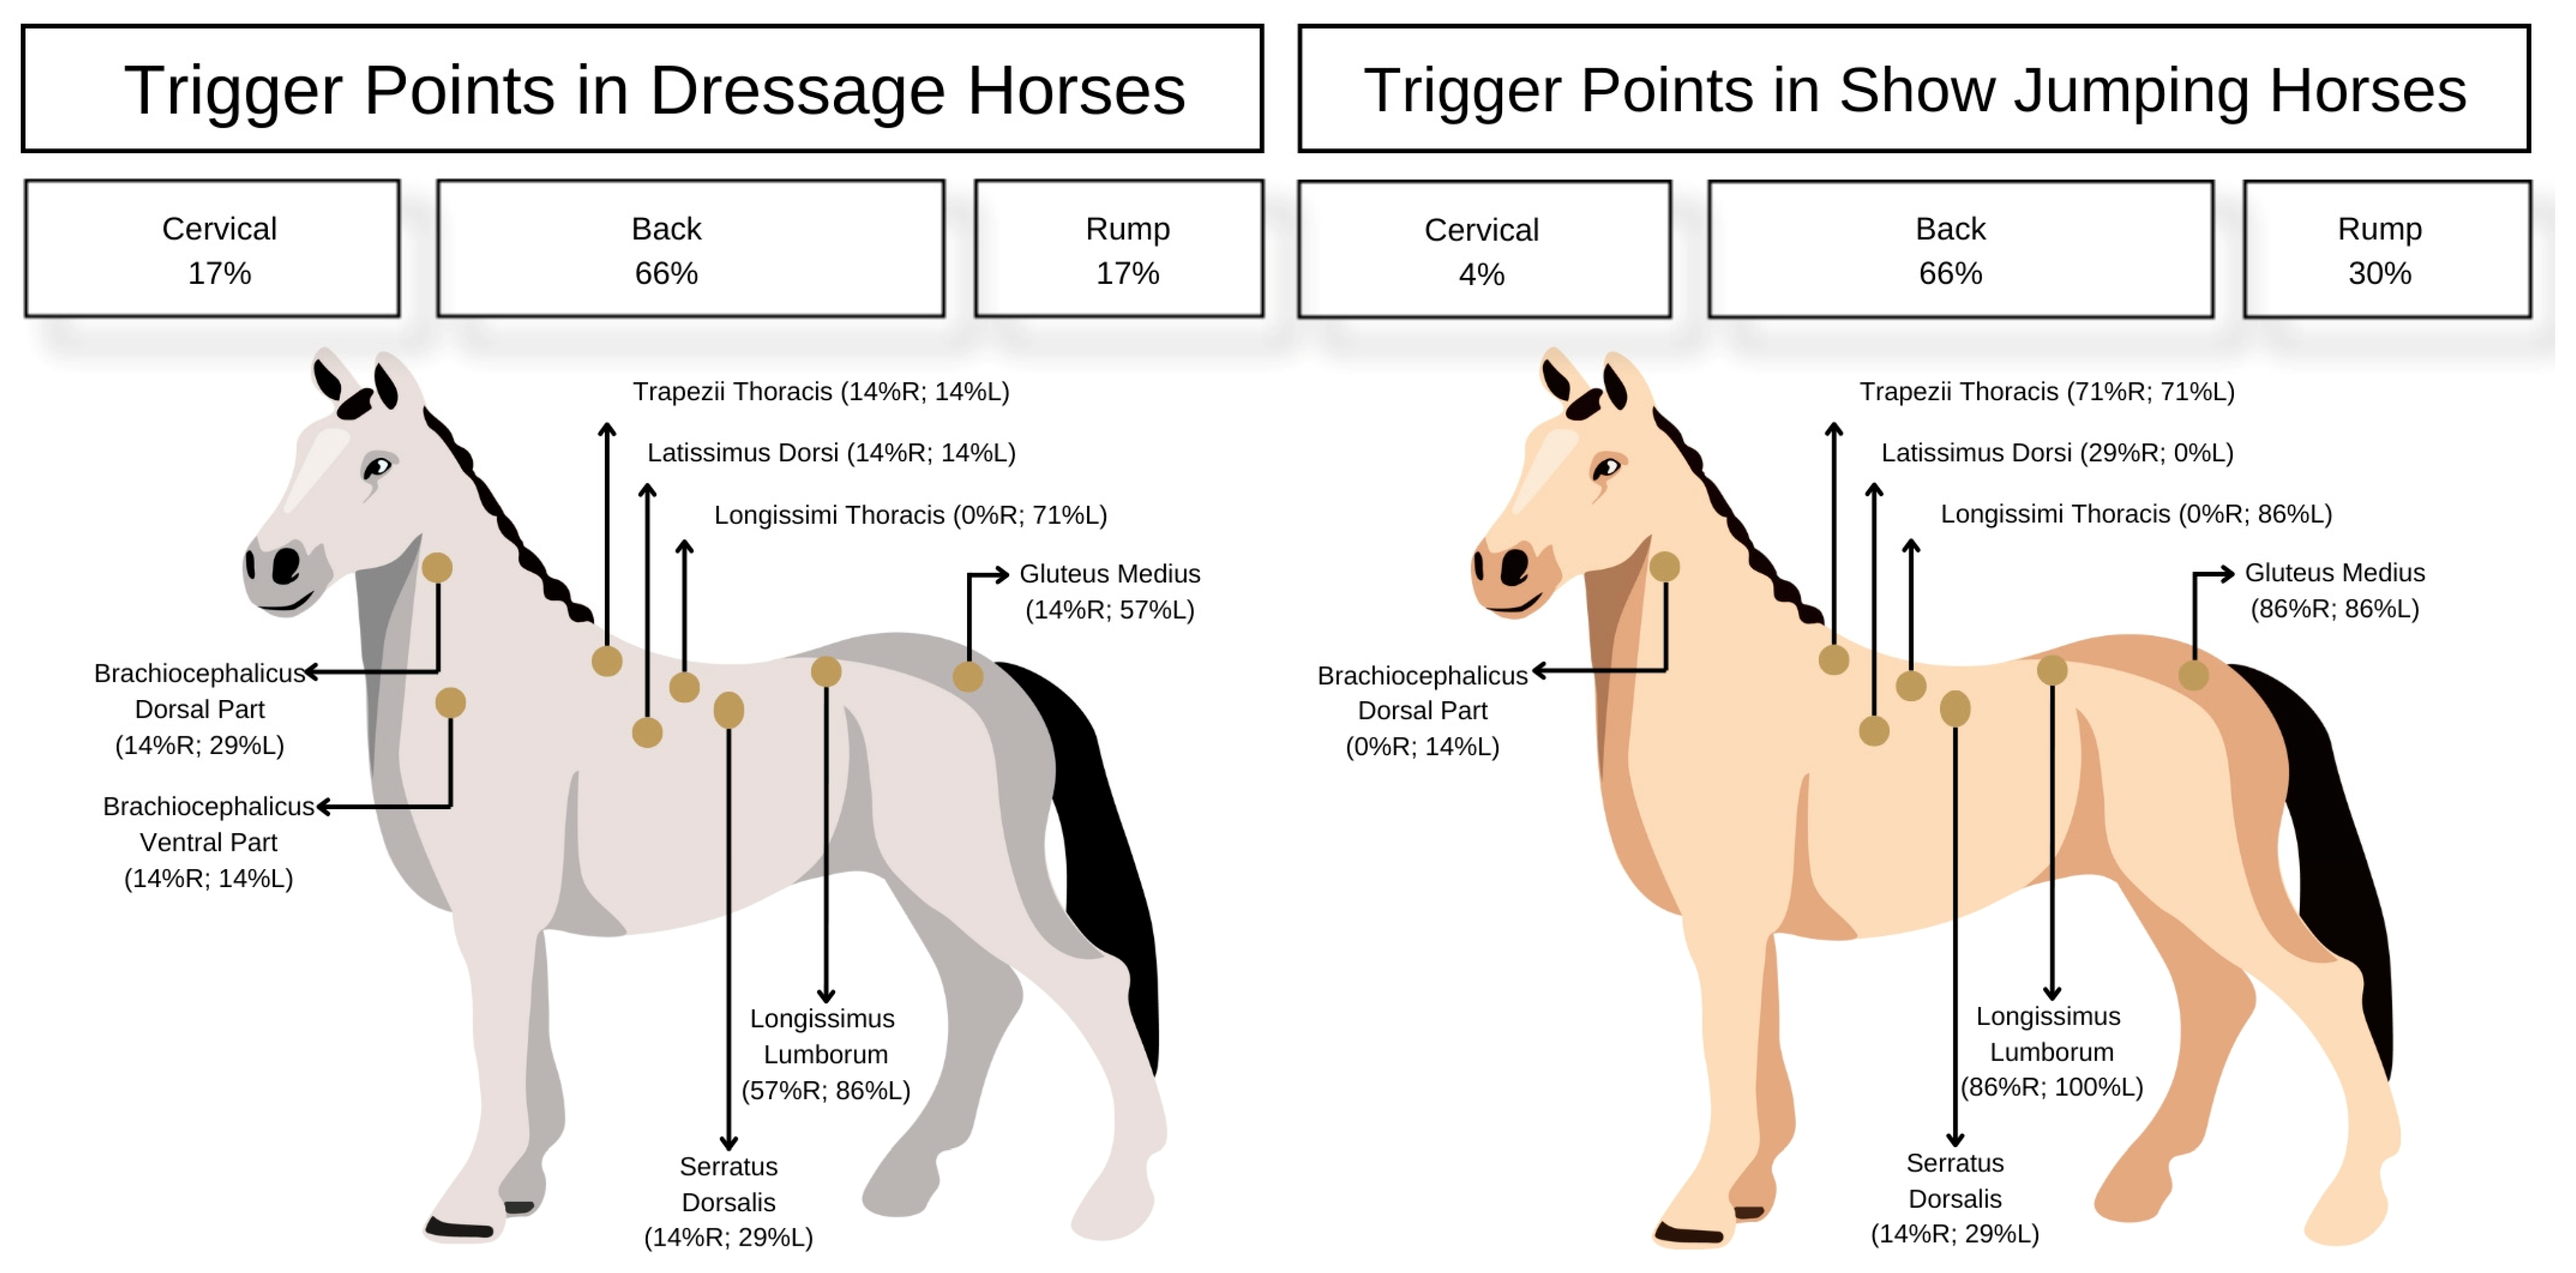
3.2. MTrPs Distribution and Prevalence
3.3. Algometry
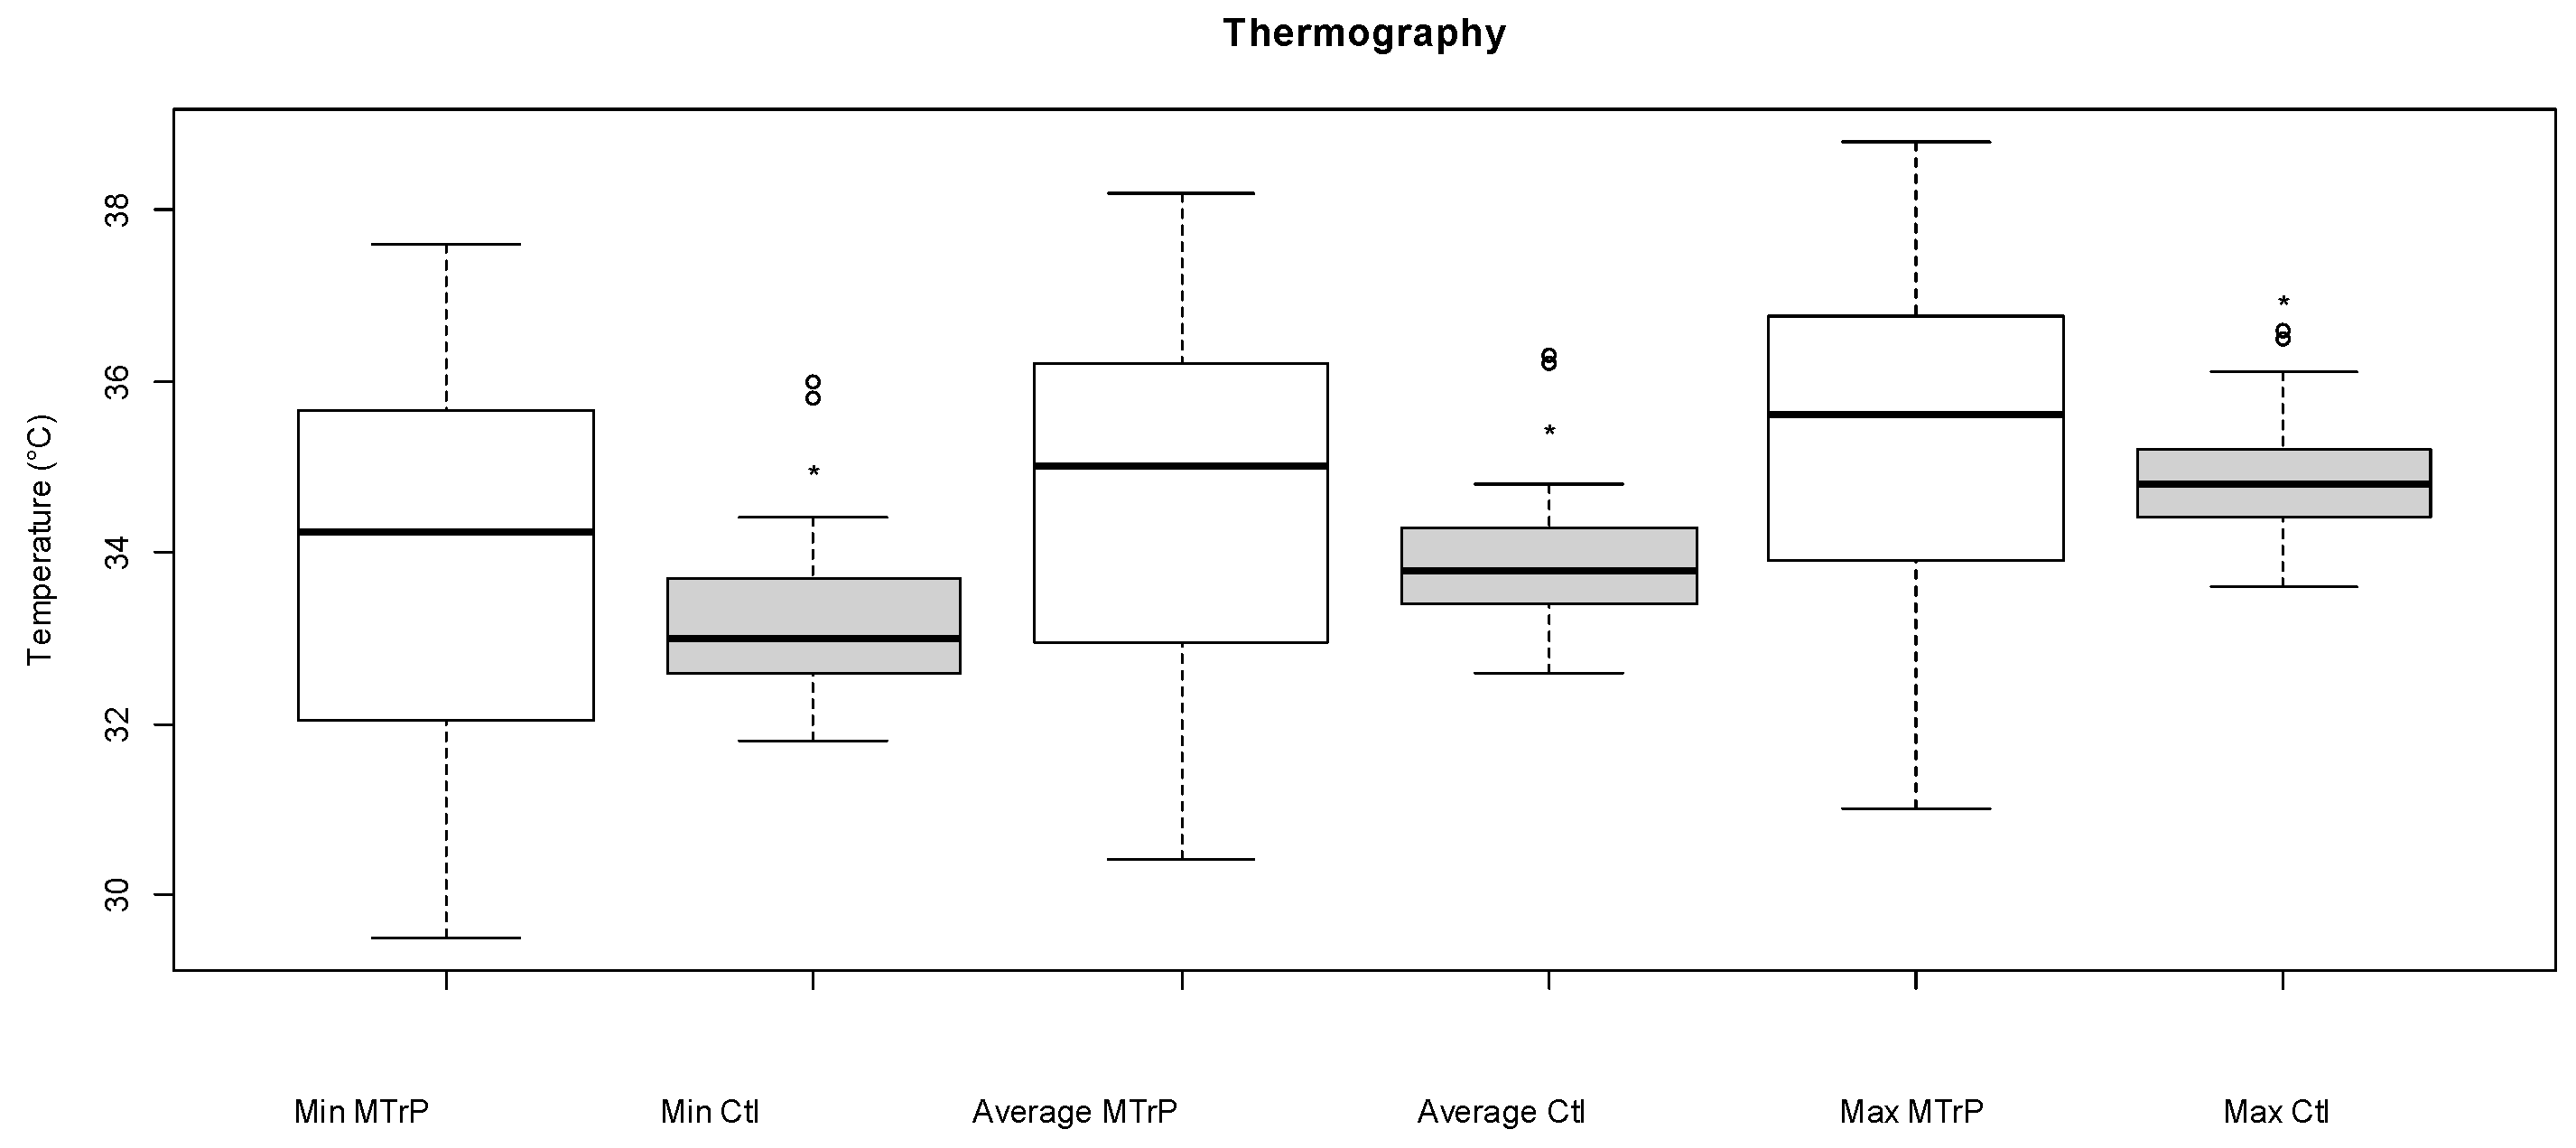
3.4. Thermography
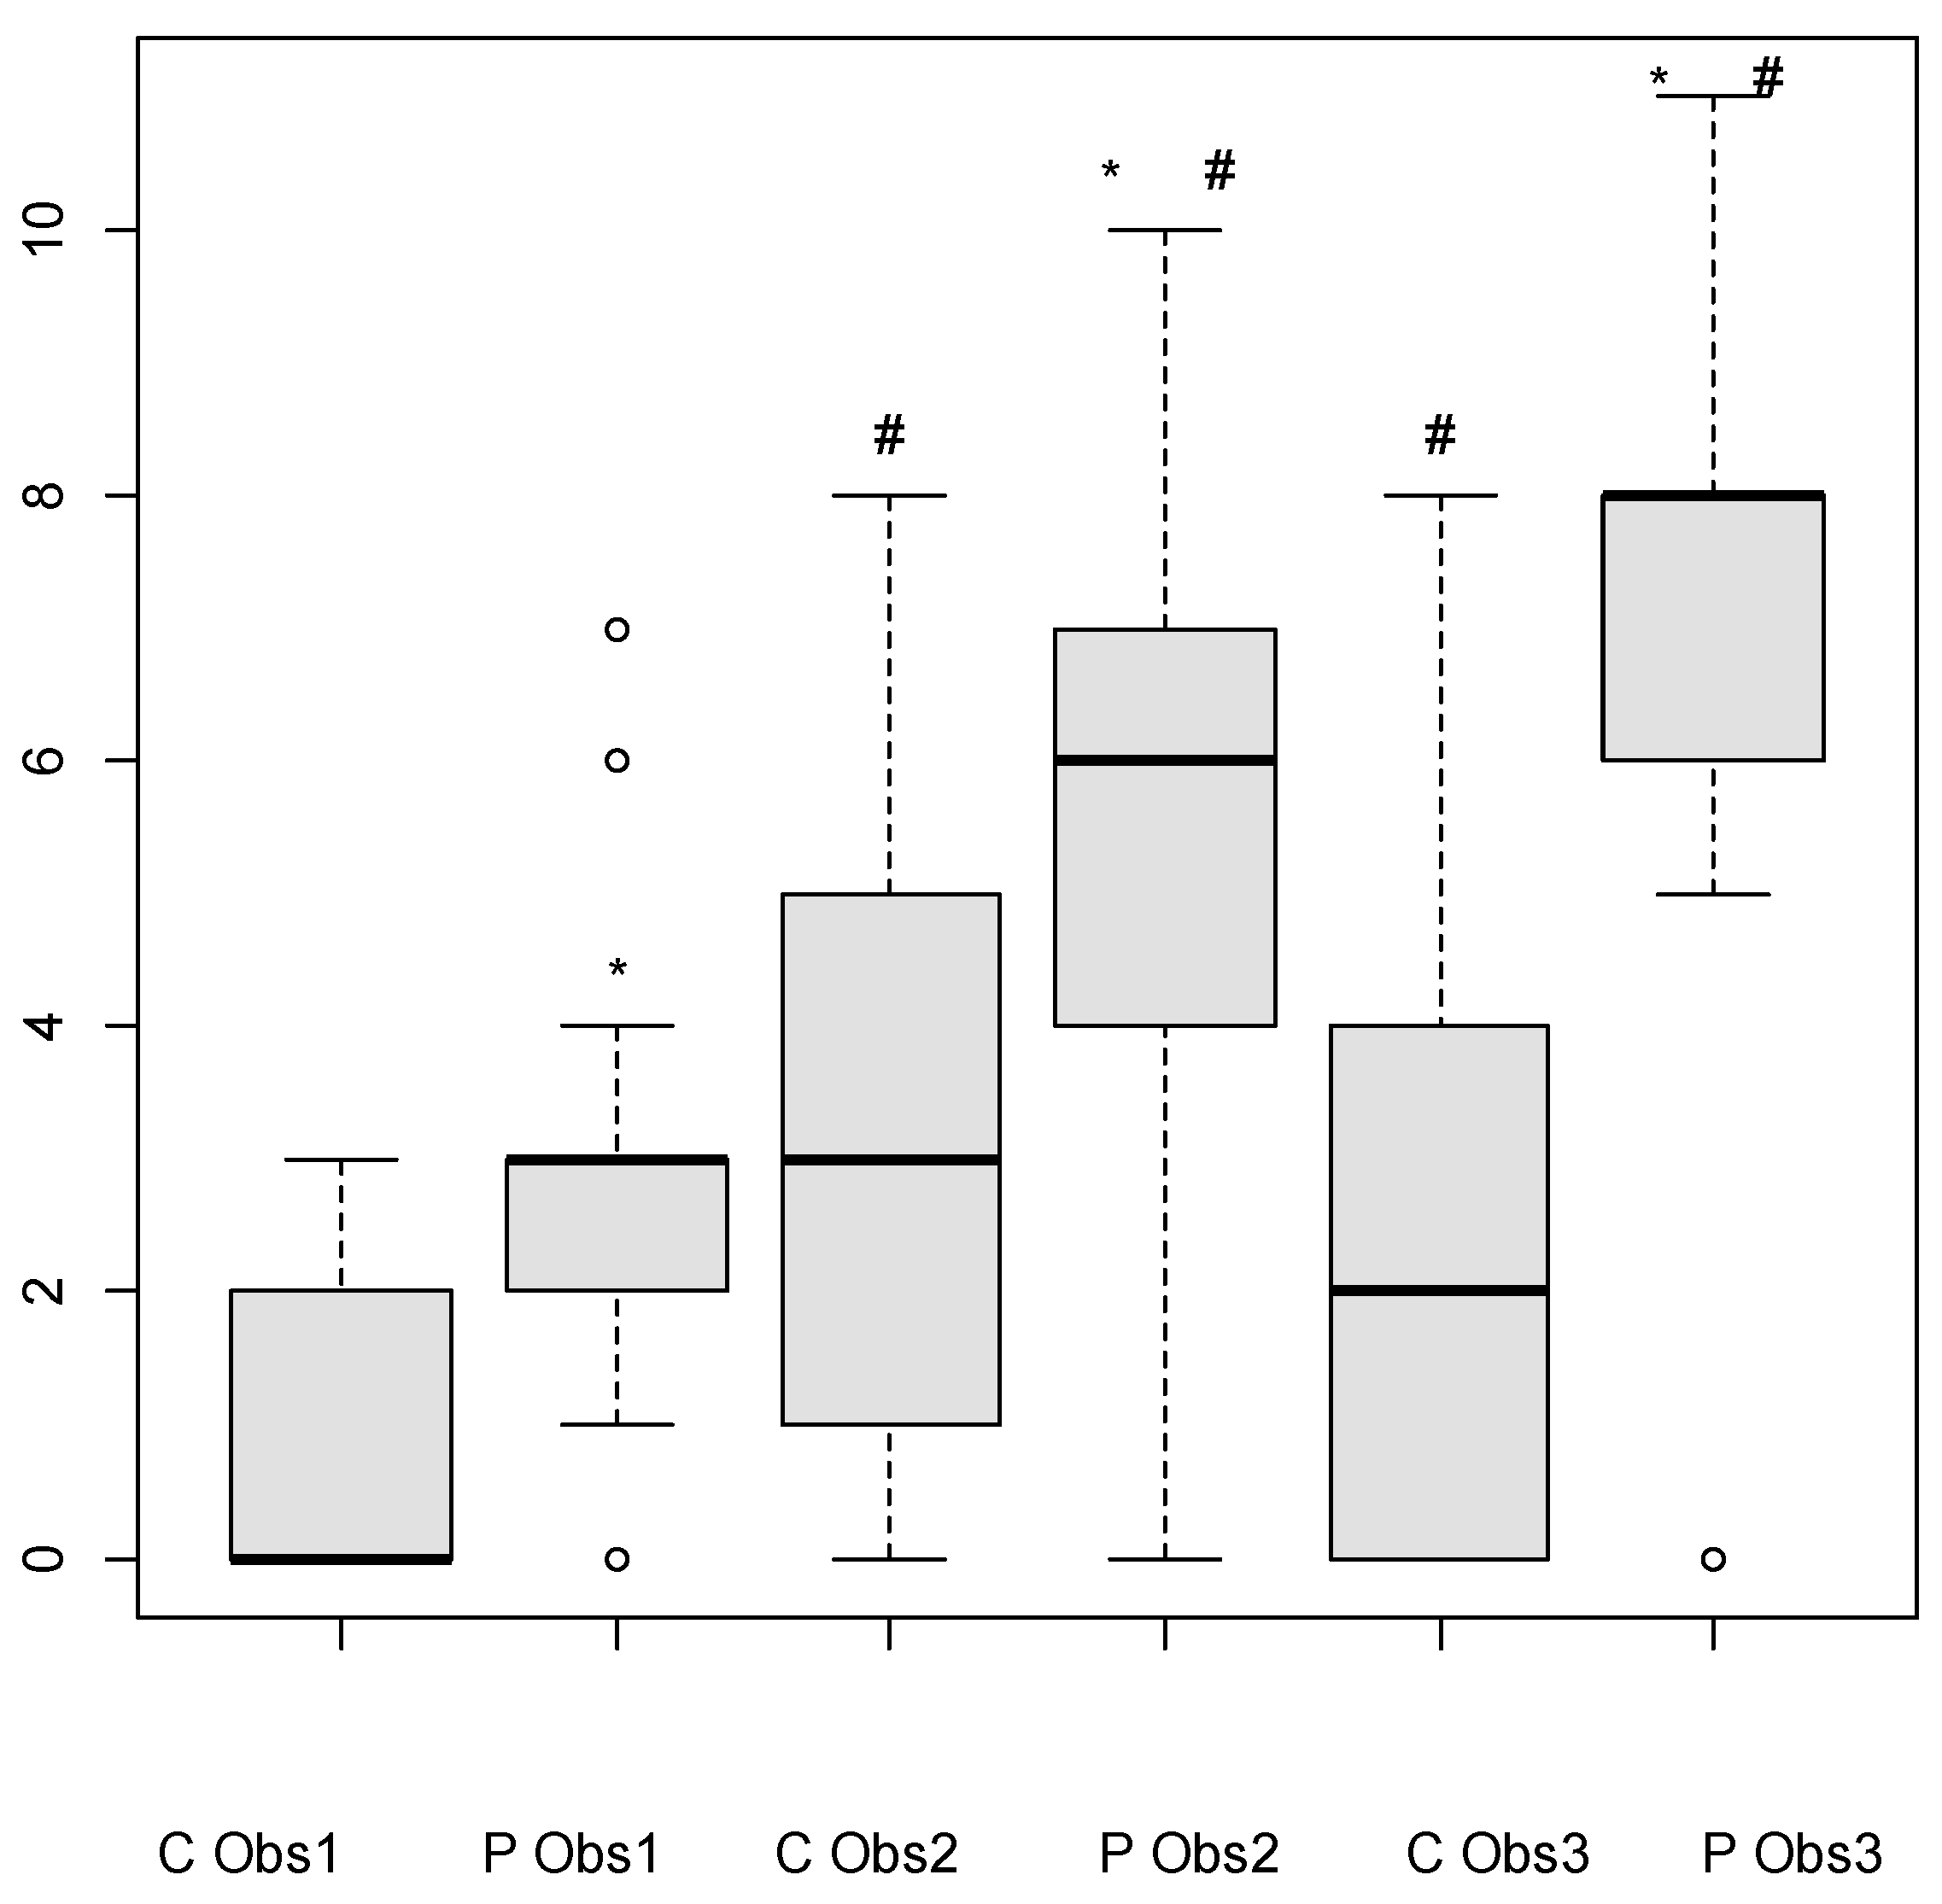
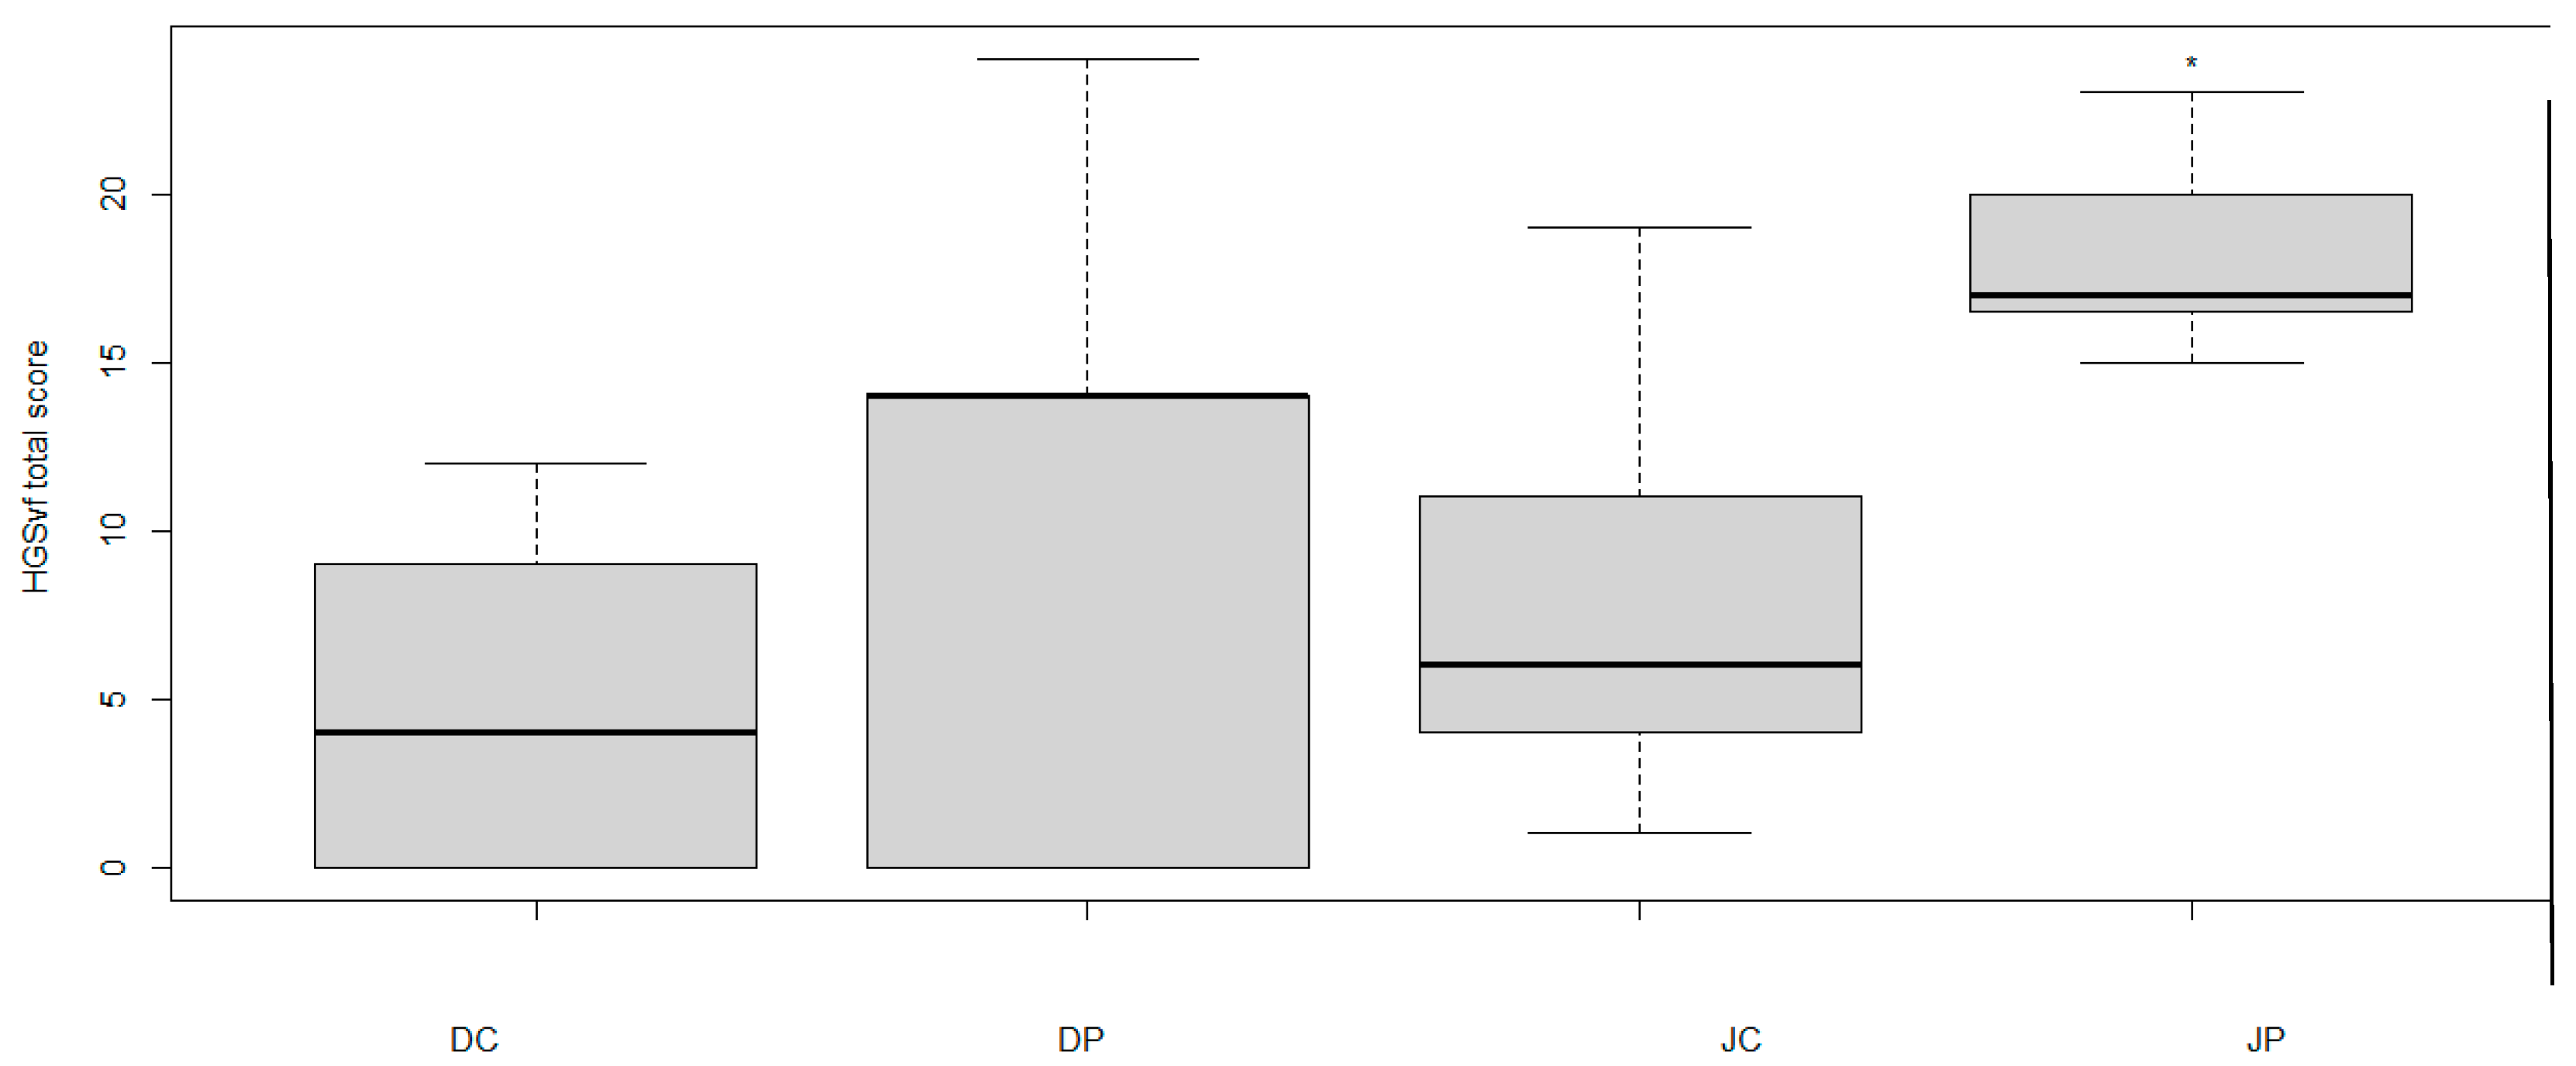
3.5. Horse Grimace Score
- Observer 1: 3 [0–7] vs. 0 [0–3], p = 0.005;
- Observer 2: 6 [0–10] vs. 3 [0–8], p = 0.04;
- Observer 3: 8 [0–11] vs. 2 [0–8], p = 0.008.
4. Discussion
5. Conclusions
Author Contributions
Funding
Institutional Review Board Statement
Informed Consent Statement
Data Availability Statement
Acknowledgments
Conflicts of Interest
Abbreviations
| Ctl | Control |
| FLIR | Forward Looking Infrared |
| HGS | Horse Grimace Scale |
| Max | Maximum |
| Min | Minimum |
| MDPI | Multidisciplinary Digital Publishing Institute |
| MPS | Myofascial Pain Syndrome |
| MTrPs | Myofascial Trigger Points |
| Obs | Observer |
| DOAJ | Directory of open access journals |
| MTrP | Trigger Point |
References
- Stecco, A.; Gesi, M.; Stecco, C.; Stern, R. Fascial Components of the Myofascial Pain Syndrome. Curr. Pain Headache Rep. 2013, 17, 352. [Google Scholar] [CrossRef]
- Urits, I.; Charipova, K.; Gress, K.; Schaaf, A.L.; Gupta, S.; Kiernan, H.C.; Choi, P.E.; Jung, J.W.; Cornett, E.; Kaye, A.D.; et al. Treatment and management of myofascial pain syndrome. Best Pract. Res. Clin. Anaesthesiol. 2020, 34, 427–448. [Google Scholar] [CrossRef]
- Rogers, P. Acupuncture for Equine Paraspinal Myofascial Pain. Am. J. Tradit. Chin. Vet. Med. 2012, 7, 69–75. [Google Scholar]
- Bowen, A.G.; Goff, L.M.; McGowan, C.M. Investigation of Myofascial Trigger Points in Equine Pectoral Muscles and Girth-Aversion Behavior. J. Equine Vet. Sci. 2017, 48, 154–160.e1. [Google Scholar] [CrossRef]
- Travell, J.G.; Simons, D.G. Introduction to Myofascial Pain and Dysfunction. In Myofascial Pain and Dysfunction: The Trigger Point Manual, 2nd ed.; Wolters Kluwer: Baltimore, MD, USA, 1999; Volume 1, pp. 1–28. [Google Scholar]
- Formenton, M.R.; Fantoni, D.T.; Gauthier, L.; Cachon, T.; Yeng, L.T.; Portier, K. Prevalence and location of myofascial trigger points in dogs with osteoarthritis. Front. Vet. Sci. 2025, 12, 1488801. [Google Scholar] [CrossRef]
- Formenton, M.R.; Portier, K.; Gaspar, B.R.; Gauthier, L.; Yeng, L.T.; Fantoni, D.T. Location of Trigger Points in a Group of Police Working Dogs: A Preliminary Study. Animals 2023, 13, 2836. [Google Scholar] [CrossRef]
- Yeng, L.T.; Kaziyama, H.H.S.; Teixeira, M.J. Síndrome dolorosa miofascial. Rev. Med. 2001, 80, 94–110. [Google Scholar] [CrossRef]
- Macgregor, J.; Von Schweinitz, D.G. Needle Electromyographic Activity of Myofascial Trigger Points and Control Sites in Equine Cleido-Brachialis Muscle—An Observational Study. Acupunct. Med. 2006, 24, 61–70. [Google Scholar] [CrossRef]
- Fricton, J.R.; Auvinen, M.D.; Dykstra, D.; Schiffman, E. Myofascial pain syndrome: Electromyographic changes associated with local twitch response. Arch. Phys. Med. Rehabil. 1985, 66, 314–317. [Google Scholar] [CrossRef]
- Saxena, A.; Chansoria, M.; Tomar, G.; Kumar, A. Myofascial Pain Syndrome: An Overview. J. Pain Palliat. Care Pharmacother. 2015, 29, 16–21. [Google Scholar] [CrossRef]
- Ridgway, K. Acupuncture as a Treatment Modality for Back Problems. Vet. Clin. N. Am. Equine Pract. 1999, 15, 211–221. [Google Scholar] [CrossRef]
- Ring, E.F.J.; Ammer, K. Infrared thermal imaging in medicine. Physiol. Meas. 2012, 33, R33–R46. [Google Scholar] [CrossRef]
- Von Schweinitz, D.G. Thermographic Diagnostics in Equine Back Pain. Vet. Clin. N. Am. Equine Pract. 1999, 15, 161–177. [Google Scholar] [CrossRef]
- Hong, C.-Z. Algometry in Evaluation of Trigger Points and Referred Pain. J. Musculoskelet. Pain 1998, 6, 47–59. [Google Scholar] [CrossRef]
- Dalla Costa, E.; Minero, M.; Lebelt, D.; Stucke, D.; Canali, E.; Leach, M.C. Development of the Horse Grimace Scale (HGS) as a Pain Assessment Tool in Horses Undergoing Routine Castration. PLoS ONE 2014, 9, e92281. [Google Scholar] [CrossRef]
- Gil, J. The Prevalence of Myofascial Trigger Points in Asymptomatic Overhead Athletes; College of Health and Human Services, California State University: Fresno, CA, USA, 2015. [Google Scholar]
- Park, J.; Shin, H.J.; Lee, S.; Lee, G.; Yoon, H.; Hong, W.; Goo, B.; Lee, D.; Shin, H.S.; Yoon, B. Common Trigger Points on College-Level Athletes with Various Sports. J. Int. Acad. Phys. Ther. Res. 2010, 1, 58–64. [Google Scholar]
- Eerdekens, A.; Deruyck, M.; Fontaine, J.; Damiaans, B.; Martens, L.; De Poorter, E.; Govaere, J.; Plets, D.; Joseph, W. Horse Jumping and Dressage Training Activity Detection Using Accelerometer Data. Animals 2021, 11, 2904. [Google Scholar] [CrossRef]
- Alvarez, D.J.; Rockwell, P.G. Trigger Points: Diagnosis and Management. Am. Fam. Physician 2002, 65, 653–660. [Google Scholar]
- Torcivia, C.; McDonnell, S. Equine Discomfort Ethogram. Animals 2021, 11, 580. [Google Scholar] [CrossRef]
- Jaeger, B.; Reeves, J.L. Quantification of Changes in Myofascial Trigger Point Sensitivity with the Pressure Algometer Following Passive Stretch. Pain 1986, 27, 203–210. [Google Scholar] [CrossRef]
- Maulave, J.; Mascaró Triedo, C.; Portier, K. Evaluation of the Practical Clinical Use of the Horse Grimace Scale Translated into French. Vet. Anaesth. Analg. 2022, 49, 615–623. [Google Scholar] [CrossRef]
- Aker, P.D.; Gross, A.R.; Goldsmith, C.H.; Peloso, P. Conservative Management of Mechanical Neck Pain: Systematic Overview and Meta-Analysis. BMJ 1996, 313, 1291–1296. [Google Scholar] [CrossRef]
- Hwang, U.J.; Kwon, O.Y.; Yi, C.H.; Jeon, H.S.; Weon, J.H.; Ha, S.M. Predictors of Upper Trapezius Pain with Myofascial Trigger Points in Food Service Workers: The STROBE Study. Medicine 2017, 96, e7252. [Google Scholar] [CrossRef]
- Gerwin, R.D. Diagnosis of Myofascial Pain Syndrome. Phys. Med. Rehabil. Clin. N. Am. 2014, 25, 341–355. [Google Scholar] [CrossRef]
- Benito-de-Pedro, M.; Becerro-de-Bengoa-Vallejo, R.; Losa-Iglesias, M.E.; Rodríguez-Sanz, D.; López-López, D.; Cosín-Matamoros, J.; Martínez-Jiménez, E.M.; Calvo-Lobo, C. Effectiveness between Dry Needling and Ischemic Compression in the Triceps Surae Latent Myofascial Trigger Points of Triathletes on Pressure Pain Threshold and Thermography: A Single Blinded Randomized Clinical Trial. J. Clin. Med. 2019, 8, 1632. [Google Scholar] [CrossRef]
- Dibai Filho, A.V.; Oliveira, A.K.D.; Oliveira, M.P.; Bevilaqua-Grossi, D.; Guirro, R.R.D.J. Relationship between pressure and thermal pain threshold, pain intensity, catastrophizing, disability, and skin temperature over myofascial trigger point in individuals with neck pain. Rev. Assoc. Médica Bras. 2021, 67, 1798–1803. [Google Scholar] [CrossRef]
- Haussler, K.K. Pressure Algometry for the Detection of Mechanical Nociceptive Thresholds in Horses. Animals 2020, 10, 2195. [Google Scholar] [CrossRef]
- Pongratz, U.; Licka, T. Algometry to Measure Pain Threshold in the Horse’s Back—An In Vivo and In Vitro Study. BMC Vet. Res. 2017, 13, 80. [Google Scholar] [CrossRef]
- Sherman, R.A.; Barja, R.H.; Bruno, G.M. Thermographic Correlates of Chronic Pain: Analysis of 125 Patients Incorporating Evaluations by a Blind Panel. Arch. Phys. Med. Rehabil. 1987, 68, 273–279. [Google Scholar]
- Kesztyüs, D.; Brucher, S.; Wilson, C.; Kesztyüs, T. Use of Infrared Thermography in Medical Diagnosis, Screening, and Disease Monitoring: A Scoping Review. Medicina 2023, 59, 2139. [Google Scholar] [CrossRef]
- Sergeev, A.N.; Morozov, A.M.; Charyev, Y.O.; Belyak, M.A. On the Possibility of Using Medical Thermography in Clinical Practice. Profil. Med. 2022, 25, 82. [Google Scholar] [CrossRef]
- Aragona, F.; Arfuso, F.; Rizzo, M.; Fazio, F.; Acri, G.; Piccione, G.; Giannetto, C. Using Infrared Thermography for the Evaluation of Road Transport Thermal Homeostasis in Athletic Horse. J. Equine Vet. Sci. 2024, 138, 105102. [Google Scholar] [CrossRef]
- Cojocaru, M.C.; Cojocaru, I.M.; Voiculescu, V.M.; Cojan-Carlea, N.A.; Dumitru, V.L.; Berteanu, M. Trigger Points—Ultrasound and Thermal Findings. J. Med. Life 2015, 8, 315–318. [Google Scholar]
- Dibai-Filho, A.V.; Guirro, R.R.D.J. Evaluation of Myofascial Trigger Points Using Infrared Thermography: A Critical Review of the Literature. J. Manip. Physiol. Ther. 2015, 38, 86–92. [Google Scholar] [CrossRef]
- Varcoe-Cocks, K.; Sagar, K.N.; Jeffcott, L.B.; McGowan, C.M. Pressure algometry to quantify muscle pain in racehorses with suspected sacroiliac dysfunction. Equine Vet. J. 2006, 38, 558–562. [Google Scholar] [CrossRef]
- Menke, E.S.; Blom, G.; Van Loon, J.P.A.M.; Back, W. Pressure algometry in Icelandic horses: Interexaminer and intraexaminer reliability. J. Equine Vet. Sci. 2016, 36, 26–31. [Google Scholar] [CrossRef]
- Haussler, K.K.; Erb, H.N. Pressure algometry for the detection of induced back pain in horses: A preliminary study. Equine Vet. J. 2006, 38, 76–81. [Google Scholar] [CrossRef]
- Wathan, J.; Burrows, A.M.; Waller, B.M.; McComb, K. EquiFACS: The Equine Facial Action Coding System. PLoS ONE 2015, 10, e0131738. [Google Scholar]
- Dai, F.; Leach, M.; MacRae, A.M.; Minero, M.; Dalla Costa, E. Does Thirty-Minute Standardised Training Improve the Inter-Observer Reliability of the Horse Grimace Scale (HGS)? A Case Study. Animals 2020, 10, 781. [Google Scholar] [CrossRef]
- Dalla Costa, E.; Bracci, D.; Dai, F.; Lebelt, D.; Minero, M. Do different emotional states affect the Horse Grimace Scale (HGS) score? A pilot study. J. Equine Vet. Sci. 2017, 54, 114–117. [Google Scholar] [CrossRef]
- Magalhães, M.F.; Dibai-Filho, A.V.; de Oliveira Guirro, E.C.; Girasol, C.E.; de Oliveira, A.K.; Dias, F.R.C.; de Jesus Guirro, R.R. Evolution of Skin Temperature after the Application of Compressive Forces on Tendon, Muscle and Myofascial Trigger Point. PLoS ONE 2015, 10, e0129034. [Google Scholar] [CrossRef]

| Dressage | Show Jumping | |||
|---|---|---|---|---|
| Area | Number of MTrP 1 | Distribution by Area | Number of MTrP | Distribution by Area |
| Neck | 8 | 17% | 3 | 4% |
| Back | 31 | 66% | 48 | 66% |
| Rump | 8 | 17% | 22 | 30% |
| Total | 47 | 100% | 73 | 100% |
Disclaimer/Publisher’s Note: The statements, opinions and data contained in all publications are solely those of the individual author(s) and contributor(s) and not of MDPI and/or the editor(s). MDPI and/or the editor(s) disclaim responsibility for any injury to people or property resulting from any ideas, methods, instructions or products referred to in the content. |
© 2025 by the authors. Licensee MDPI, Basel, Switzerland. This article is an open access article distributed under the terms and conditions of the Creative Commons Attribution (CC BY) license (https://creativecommons.org/licenses/by/4.0/).
Share and Cite
Portier, K.; Schiesari, C.; Gauthier, L.; Yeng, L.T.; Tabacchi Fantoni, D.; Formenton, M.R. Comparison of the Prevalence and Location of Trigger Points in Dressage and Show-Jumping Horses. Animals 2025, 15, 1558. https://doi.org/10.3390/ani15111558
Portier K, Schiesari C, Gauthier L, Yeng LT, Tabacchi Fantoni D, Formenton MR. Comparison of the Prevalence and Location of Trigger Points in Dressage and Show-Jumping Horses. Animals. 2025; 15(11):1558. https://doi.org/10.3390/ani15111558
Chicago/Turabian StylePortier, Karine, Camilla Schiesari, Lisa Gauthier, Lin Tchia Yeng, Denise Tabacchi Fantoni, and Maira Rezende Formenton. 2025. "Comparison of the Prevalence and Location of Trigger Points in Dressage and Show-Jumping Horses" Animals 15, no. 11: 1558. https://doi.org/10.3390/ani15111558
APA StylePortier, K., Schiesari, C., Gauthier, L., Yeng, L. T., Tabacchi Fantoni, D., & Formenton, M. R. (2025). Comparison of the Prevalence and Location of Trigger Points in Dressage and Show-Jumping Horses. Animals, 15(11), 1558. https://doi.org/10.3390/ani15111558