
Data Augmentation for Enhanced Fish Detection in Lake Environments: Affine Transformations, Neural Filters, SinGAN


Simple Summary
Abstract
1. Introduction
2. Methods
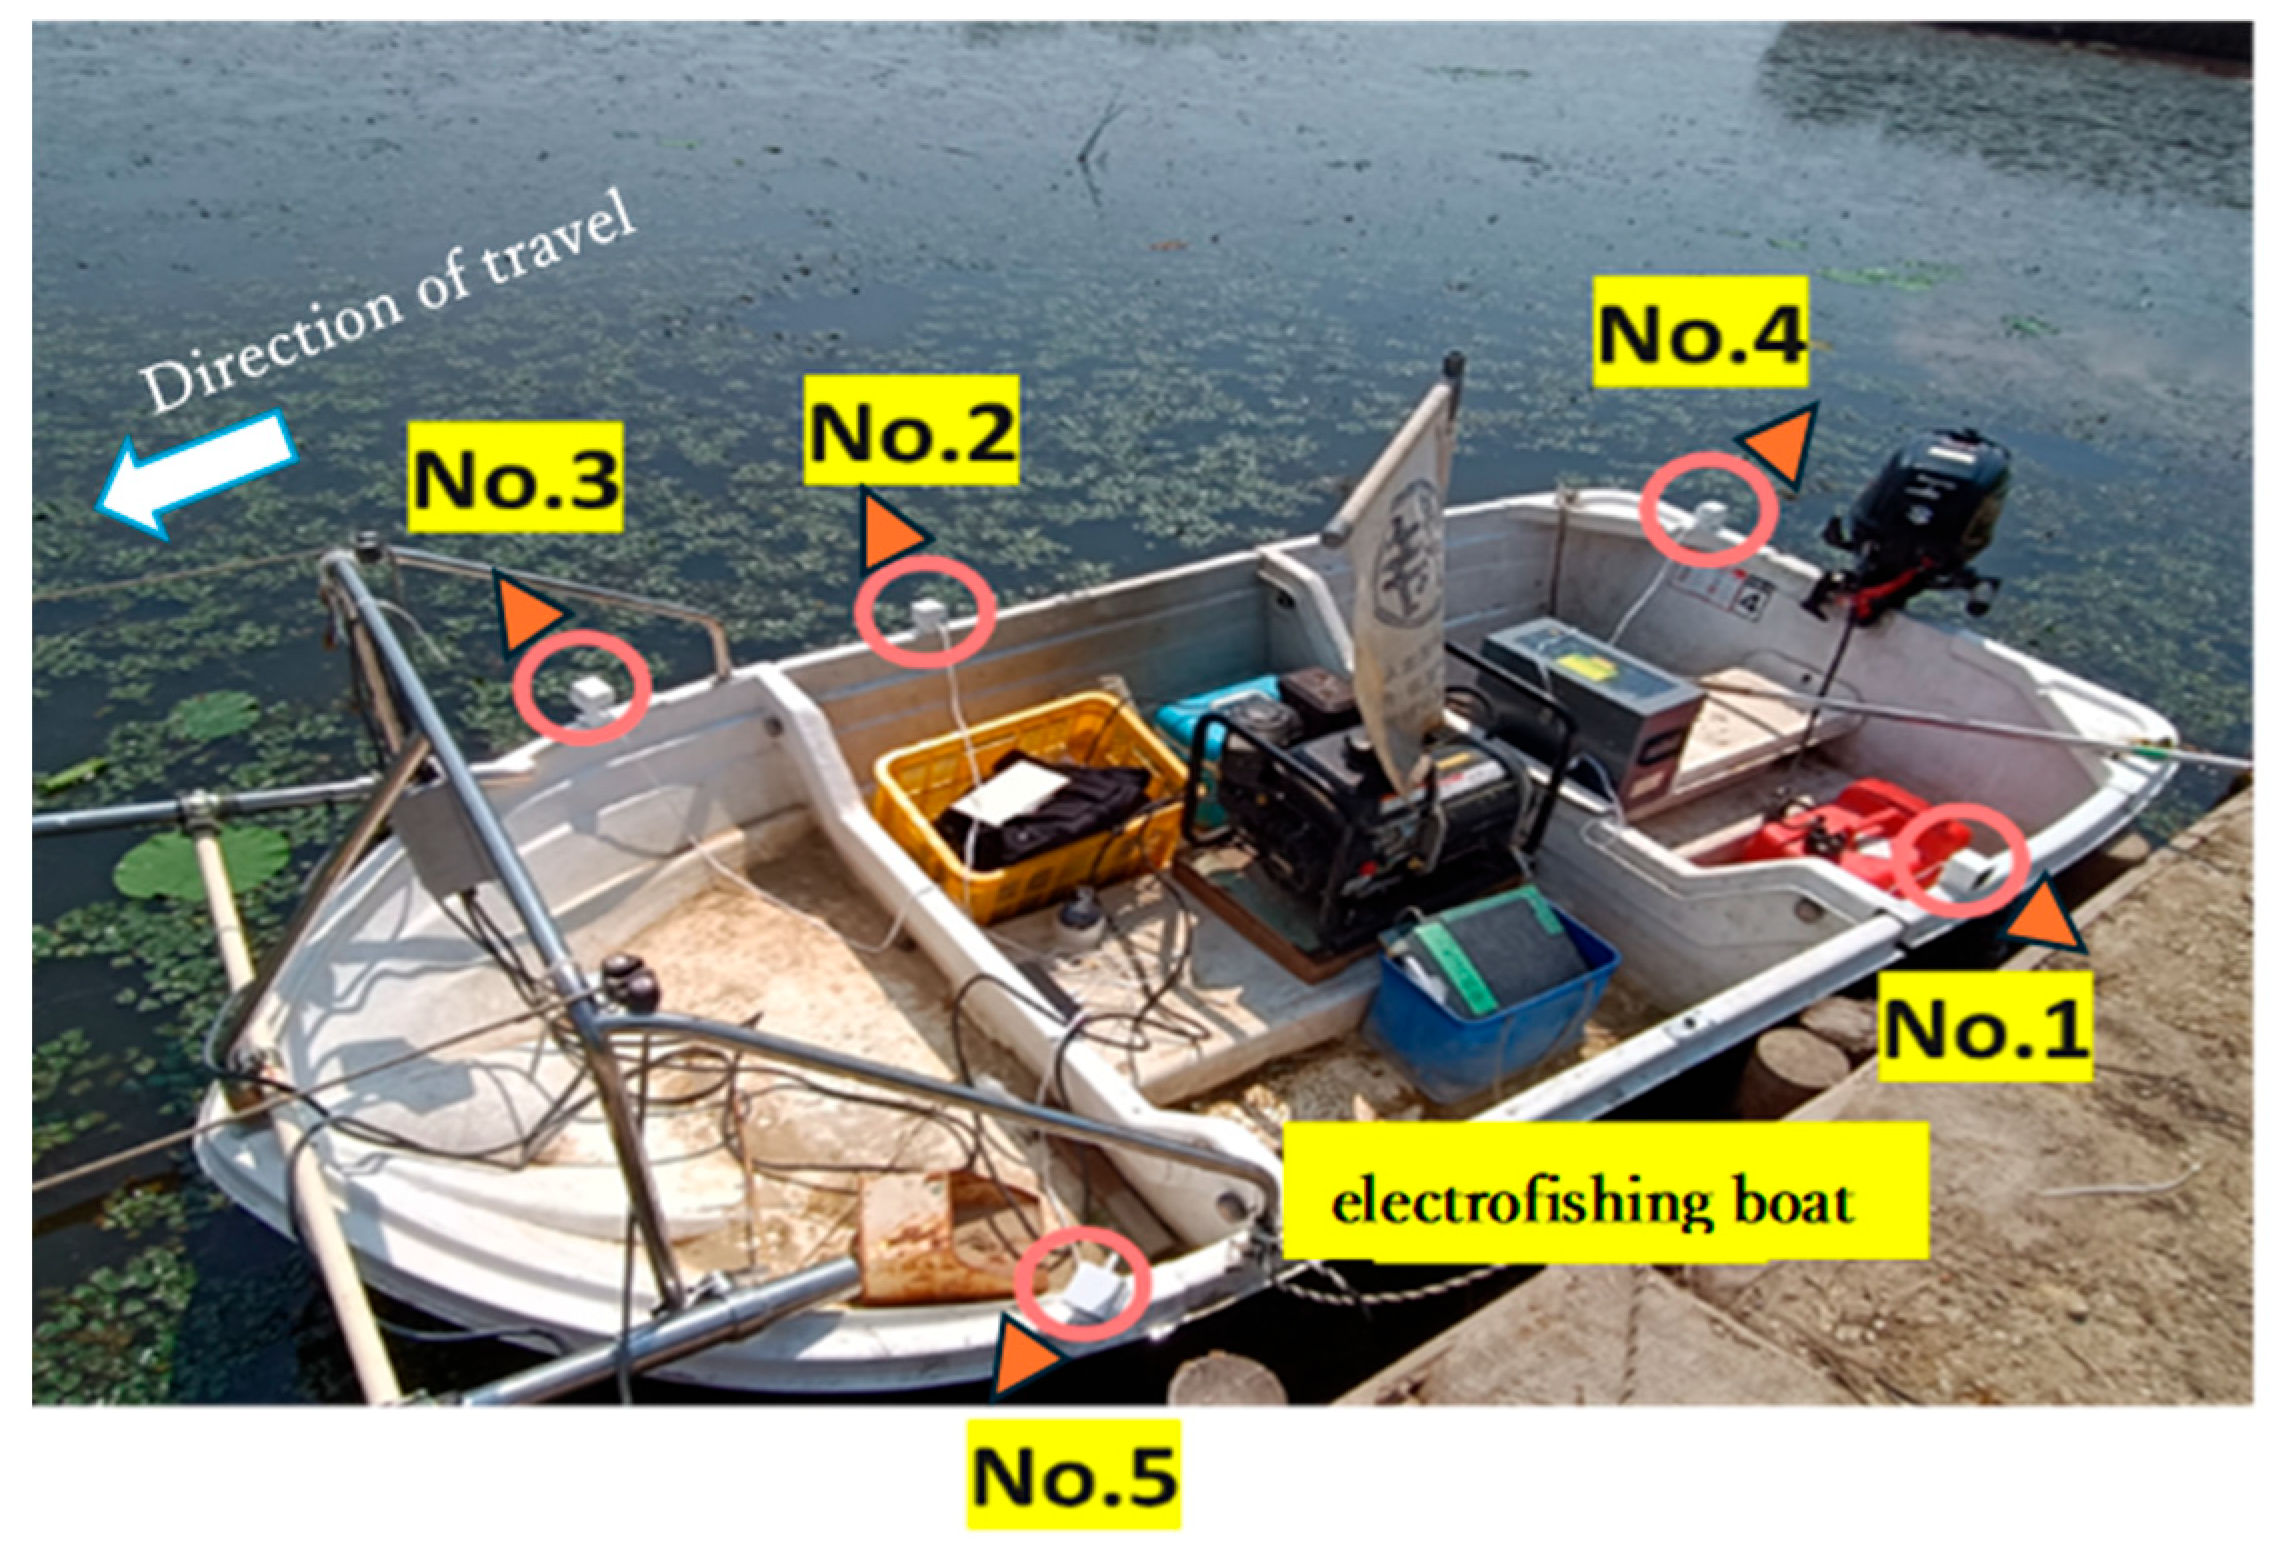
2.1. Study Site
2.2. Dataset
2.3. PaDiM
2.4. Data Augmentation
2.4.1. Affine Transformation
2.4.2. Neural Filter
2.4.3. SinGAN
2.4.4. Evaluation Methods
2.4.5. Experimental Setup
3. Results
4. Discussion
4.1. Contributions and Limitations of This Study
4.2. Scope for Future Research
5. Conclusions
Author Contributions
Funding
Institutional Review Board Statement
Informed Consent Statement
Data Availability Statement
Acknowledgments
Conflicts of Interest
Abbreviations
| YOLO | You Only Look Once |
| PaDiM | Patch Distribution Modeling |
| Org | Original dataset |
| AT | Affine transformation |
| NF | Neural Filter |
| SinGAN | Single Image Generative Adversarial Network |
| AUROC | Area Under the Receiver Operating Characteristic Curve |
| ROC | Receiver Operating Characteristic |
| TPR | True Positive Rate |
| FPR | False Positive Rate |
| TP | True Positive |
| FP | False Positive |
| FN | False Negative |
| CNNs | Convolutional Neural Networks |
| GANs | Generative Adversarial Networks |
References
- Naiman, R.; Latterell, J. Principles for Linking Fish Habitat to Fisheries Management and Conservation. J. Fish Biol. 2005, 67, 166–185. [Google Scholar] [CrossRef]
- Copp, G.H. The Habitat Diversity and Fish Reproductive Function of Floodplain Ecosystems. Environ. Biol. Fish. 1989, 26, 1–27. [Google Scholar] [CrossRef]
- Inoue, M.; Nakano, S. Physical environment structure of a small stream with special reference to fish microhabitat. Jpn. J. Ecol. 1994, 44, 151–160. [Google Scholar] [CrossRef]
- Hubert, W.A. Passive Capture Techniques. In Fisheries Techniques, 2nd ed.; Murphy, B.R., Willis, D.W., Eds.; American Fisheries Society: Bethesda, MD, USA, 1996; pp. 157–192. [Google Scholar]
- Moyle, P.B.; Vondracek, B. Persistence and structure of the fish assemblage in a small California stream. Ecology 1985, 66, 1–13. [Google Scholar] [CrossRef]
- Fujimoto, Y.; Kurosaka, K.; Ojima, D.; Iwata, M. Habitat Use and Shift of Two Sympatric Freshwater Sculpins (Cottus pollux and Cottus hangiongensis) during the Spawning and Non-spawning Seasons. J. Freshwat. Ecol. 2008, 23, 341–346. [Google Scholar] [CrossRef]
- Fujimoto, Y.; Iwata, M. Effect of Natural Light Conditions on the Use of Cover in Concrete Block Structures by Japanese Dace Tribolodon hakonensis. Fish. Sci. 2005, 71, 1017–1026. [Google Scholar] [CrossRef]
- Holmes, J.A.; Cronkite, G.M.W. Using Underwater Video to Count Migratory Salmon: A Cautionary Note. Fish. Res. 2008, 93, 57–61. [Google Scholar]
- Sward, D.; Monk, J.; Barrett, N. A systematic review of remotely operated vehicle surveys for visually assessing fish assemblages. Front. Mar. Sci. 2019, 6, 134. [Google Scholar] [CrossRef]
- Lyons, J.; Hateley, J.; Peirson, G.; Eley, F.; Manwaring, S.; Twine, K. An assessment of hydroacoustic and electric fishing data to evaluate long term spatial and temporal fish population change in the River Thames, UK. Water 2021, 13, 2932. [Google Scholar] [CrossRef]
- Mizuno, K.; Liu, X.; Asada, A.; Ashizawa, J.; Fujimoto, Y.; Shimada, T. Application of a High-resolution Acoustic Video Camera to Fish Classification: An Experimental Study. In Proceedings of the 2015 IEEE Underwater Technology (UT), Chennai, India, 23–25 February 2015; pp. 1–4. [Google Scholar]
- Taberlet, P.; Coissac, E.; Hajibabaei, M.; Rieseberg, L.H. Environmental DNA. Mol. Ecol. 2012, 21, 1789–1793. [Google Scholar] [CrossRef]
- Oya, Y.; Kawasue, K. Development of the Automatic Fish Monitoring Techniques Using Stereoscopic Images. Eco-Engineering 2010, 22, 49–54. [Google Scholar]
- Hanson, N.; Ounsley, J.; Henry, J.; Terzić, K.; Caneco, B. Automatic Detection of Fish Scale Circuli Using Deep Learning. Biol. Methods Protoc. 2024, 9, bpae056. [Google Scholar] [CrossRef]
- Szegedy, C.; Toshev, A.; Erhan, D. Deep Neural Networks for Object Detection. Adv. Neural Inf. Process. Syst. 2013, 26, 2553–2561. [Google Scholar]
- Zhao, Z.Q.; Zheng, P.; Xu, S.T.; Wu, X. Object Detection with Deep Learning: A Review. IEEE Trans. Neural Netw. Learn. Syst. 2019, 30, 3212–3232. [Google Scholar] [CrossRef]
- Wang, N.; Wang, Y.; Er, M.J. Review on Deep Learning Techniques for Marine Object Recognition: Architectures and Algorithms. Control Eng. Pract. 2020, 118, 104458. [Google Scholar] [CrossRef]
- Sun, M.; Yang, X.; Xie, Y. Deep Learning in Aquaculture: A Review. J. Comput. 2020, 31, 294–319. [Google Scholar]
- Redmon, J.; Farhadi, A. YOLOv3: An Incremental Improvement. arXiv 2018, arXiv:1804.02767. [Google Scholar]
- Stavelin, H.; Rasheed, A.; San, O.; Hestnes, A.J. Applying Object Detection to Marine Data and Exploring Explainability of a Fully Convolutional Neural Network Using Principal Component Analysis. Ecol. Inform. 2021, 62, 101269. [Google Scholar] [CrossRef]
- Berg, P.; Maia, D.; Pham, M.; Lefèvre, S. Weakly Supervised Detection of Marine Animals in High Resolution Aerial Images. Remote Sens. 2022, 14, 339. [Google Scholar] [CrossRef]
- Takahashi, Y.; Fujimoto, Y. Survey of Shape and Area of Lake Izunuma-Uchinuma, Miyagi Prefecture, Japan Using Aerial Photographs Taken in 2007. Izunuma-Uchinuma Wetland Res. 2018, 12, 17–25. [Google Scholar]
- Fujimoto, Y.; Hayami, H.; Yokoyama, J. Changes in Lakeside Vegetation Communities in Lake Izunuma-Uchinuma in Northeast Japan from 1976 to 2012. Wetland Res. 2019, 9, 29–37, (In Japanese with English Abstract). [Google Scholar]
- Fujimoto, Y.; Shimada, T.; Inoue, K.; Takahashi, Y.; Hayami, H. Below-average Water Level in Lake Izunuma-Uchinuma in Miyagi Prefecture, Japan, in the Winter of 2016/17 Induced Whooper Swan Feeding Activity, Leading to Reduced Coverage of Lotus Vegetation and Increased Dissolved Oxygen in the Water. J. Conserv. Ecol. 2020, 25, 99–108. (In Japanese) [Google Scholar]
- Fujimoto, Y.; Kawagishi, M.; Shindo, K. Freshwater Fishes in Lake Izunuma-Uchinuma Basin, Japan: Distribution Patterns of Native Species and Invasive Species. Izunuma-Uchinuma Wetland Res. 2008, 2, 13–25, (In Japanese with English Abstract). [Google Scholar]
- Fujimoto, Y.; Shindo, K. Small Scale Bitterling Acheilognathus typus: A Floodplain Fish Surviving in the Irrigation Pond. J. Ichthyol. 2012, 59, 78–82. (In Japanese) [Google Scholar]
- Fujimoto, Y.; Takahashi, K.; Shindo, K.; Fujiwara, T.; Arita, K.; Saitoh, K.; Shimada, T. Success in Population Control of the Invasive Largemouth Bass Micropterus salmoides through Removal at Spawning Sites in a Japanese Shallow Lake. Manag. Biol. Invas. 2021, 12, 997–1011. [Google Scholar] [CrossRef]
- Fujimoto, Y.; Takahashi, K.; Shinto, K.; Saito, K.; Mitsuka, M.; Shimada, T. Recovery of the Endangered Bitterling Acheilognathus typus in Lake Izunuma-Uchinuma after the Removal of Largemouth Bass (Micropterus salmoides). J. Ichthyol. 2021, 68, 61–66. (In Japanese) [Google Scholar] [CrossRef]
- Fujimoto, Y. Comparison of the Efficacy of Electrofishing Boat, Setnet, and Gillnet for the Control of Largemouth Bass. In Manual of Control of Alien Fish and Recovery of Native Fishes for the Restoration of Lake Ecosystems: Based on the Studies in Lake Izunuma-Uchinuma; Fujimoto, Y., Shimada, T., Takahashi, K., Saitoh, K., Eds.; The Miyagi Prefectural Izunuma-Uchinuma Environmental Foundation: Kurihara, Japan, 2013; pp. 77–82. Available online: http://izunuma.org/pdf/kujyo_manual_2_4.pdf (accessed on 29 April 2025). (In Japanese)
- Defard, T.; Setkov, A.; Loesch, A.; Audigier, R. PaDiM: A Patch Distribution Modeling Framework for Anomaly Detection and Localization. arXiv 2020, arXiv:2011.08785. [Google Scholar] [CrossRef]
- Krizhevsky, A.; Sutskever, I.; Hinton, G.E. ImageNet Classification with Deep Convolutional Neural Networks. Adv. Neural Inf. Process. Syst. 2012, 25, 1097–1105. Available online: https://proceedings.neurips.cc/paper/2012/file/c399862d3b9d6b76c8436e924a68c45b-Paper.pdf (accessed on 29 April 2025). [CrossRef]
- Shaham, T.R.; Dekel, T.; Michaeli, T. SinGAN: Learning a Generative Model from a Single Natural Image. arXiv 2019, arXiv:1905.01164. [Google Scholar] [CrossRef]
- Bergmann, P.; Löwe, S.; Fauser, M.; Sattlegger, D.; Steger, C. Improving Unsupervised Defect Segmentation by Applying Structural Similarity to Autoencoders. In Proceedings of the 14th International Joint Conference on Computer Vision, Imaging and Computer Graphics Theory and Applications (VISIGRAPP 2019); SCITEPRESS—Science and Technology Publications, Lda.: Lisbon, Portugal, 2019; pp. 372–380. [Google Scholar]
- Shorten, C.; Khoshgoftaar, T.M. Image Data Augmentation for Deep Learning: A Survey. J. Big Data 2019, 6, 1–48. [Google Scholar] [CrossRef]
- Rombach, R.; Blattmann, A.; Lorenz, D.; Esser, P.; Ommer, B. High-Resolution Image Synthesis with Latent Diffusion Models. In Proceedings of the IEEE/CVF Conference on Computer Vision and Pattern Recognition (CVPR) 2022, New Orleans, LA, USA, 18–24 June 2022; pp. 10674–10685. [Google Scholar] [CrossRef]
- Zhang, L. Deep Learning for Fish Classification: A Survey. J. Mar. Sci. Eng. 2017, 5, 41–56. [Google Scholar]
- Goodfellow, I.J.; Pouget-Abadie, J.; Mirza, M.; Xu, B.; Warde-Farley, D.; Ozair, S.; Courville, A.; Bengio, Y. Generative Adversarial Networks. arXiv 2014, arXiv:1406.2661. [Google Scholar] [CrossRef]


| Camera No. | Recording Time | Conversion Method | Normal Images | Anomalous Images | Resolution | |
|---|---|---|---|---|---|---|
| Org | 5 | 11:13~11:59 | All frame conversion | 3902 | 66 | 1390 × 550 |
| Validation | 5 | 11:13~11:59 | All frame conversion | 332 | 11 | 1390 × 550 |
| Test | 1 | 11:32~11:49 | All frame conversion | 0 | 100 | 1700 × 850 |
| NFbase | 5 | 11:21~11:46 | 1 frame per second | 0 | 20 | 1920 × 1080 |
| 5 | 10:00~10:06, 11:00~11:55 | 1 frame per minute | 61 | 1 | 1920 × 1080 |
| Task | Library or Tool Name | Version |
|---|---|---|
| NF | Adobe Photoshop 2024 | 25.1.0 |
| SinGAN | Github | https://github.com/kligvasser/SinGAN.git (accessed on 29 April 2025) |
| Torch | 2.5.0+cu124 | |
| Torchvision | 0.20.0+cu124 | |
| Pillow | 11.0.0 | |
| tensorboardX | 2.6.2.2 | |
| PaDiM | Anomalib | 0.7.0 |
| Pydantic | 2.4.2 |
| Model Name | Normal Images | Anomalous Images | Resolution |
|---|---|---|---|
| Org | 3902 | 66 | 1390 × 550 |
| Org+AT | 7804 | 102 | 1390 × 550 |
| Org+NF | 11,771 | 2130 | 1390 × 550 |
| Org+SinGAN | 13,902 | 66 | 1390 × 550 |
| Org+SinGAN_pass | 13,902 | 66 | 1390 × 550 |
| Model Name | AUROC | F1Score |
|---|---|---|
| Org | 0.836 | 0.483 |
| Org+AT | 0.942 | 0.766 |
| Org+NF | 0.940 | 0.879 |
| Org+SinGAN | 0.836 | 0.483 |
| Org+SinGAN_pass | 0.763 | 0.474 |
Disclaimer/Publisher’s Note: The statements, opinions and data contained in all publications are solely those of the individual author(s) and contributor(s) and not of MDPI and/or the editor(s). MDPI and/or the editor(s) disclaim responsibility for any injury to people or property resulting from any ideas, methods, instructions or products referred to in the content. |
© 2025 by the authors. Licensee MDPI, Basel, Switzerland. This article is an open access article distributed under the terms and conditions of the Creative Commons Attribution (CC BY) license (https://creativecommons.org/licenses/by/4.0/).
Share and Cite
Watanabe, K.; Nguyen-Nhu, T.; Takano, S.; Mori, D.; Fujimoto, Y. Data Augmentation for Enhanced Fish Detection in Lake Environments: Affine Transformations, Neural Filters, SinGAN. Animals 2025, 15, 1466. https://doi.org/10.3390/ani15101466
Watanabe K, Nguyen-Nhu T, Takano S, Mori D, Fujimoto Y. Data Augmentation for Enhanced Fish Detection in Lake Environments: Affine Transformations, Neural Filters, SinGAN. Animals. 2025; 15(10):1466. https://doi.org/10.3390/ani15101466
Chicago/Turabian StyleWatanabe, Kidai, Thao Nguyen-Nhu, Saya Takano, Daisuke Mori, and Yasufumi Fujimoto. 2025. "Data Augmentation for Enhanced Fish Detection in Lake Environments: Affine Transformations, Neural Filters, SinGAN" Animals 15, no. 10: 1466. https://doi.org/10.3390/ani15101466
APA StyleWatanabe, K., Nguyen-Nhu, T., Takano, S., Mori, D., & Fujimoto, Y. (2025). Data Augmentation for Enhanced Fish Detection in Lake Environments: Affine Transformations, Neural Filters, SinGAN. Animals, 15(10), 1466. https://doi.org/10.3390/ani15101466