
The Sympatric Coexistence Mechanism: A Case Study of Two Penahia Species in the Beibu Gulf, South China Sea


 ,
,
Abstract
Simple Summary
Abstract
1. Introduction
2. Materials and Methods
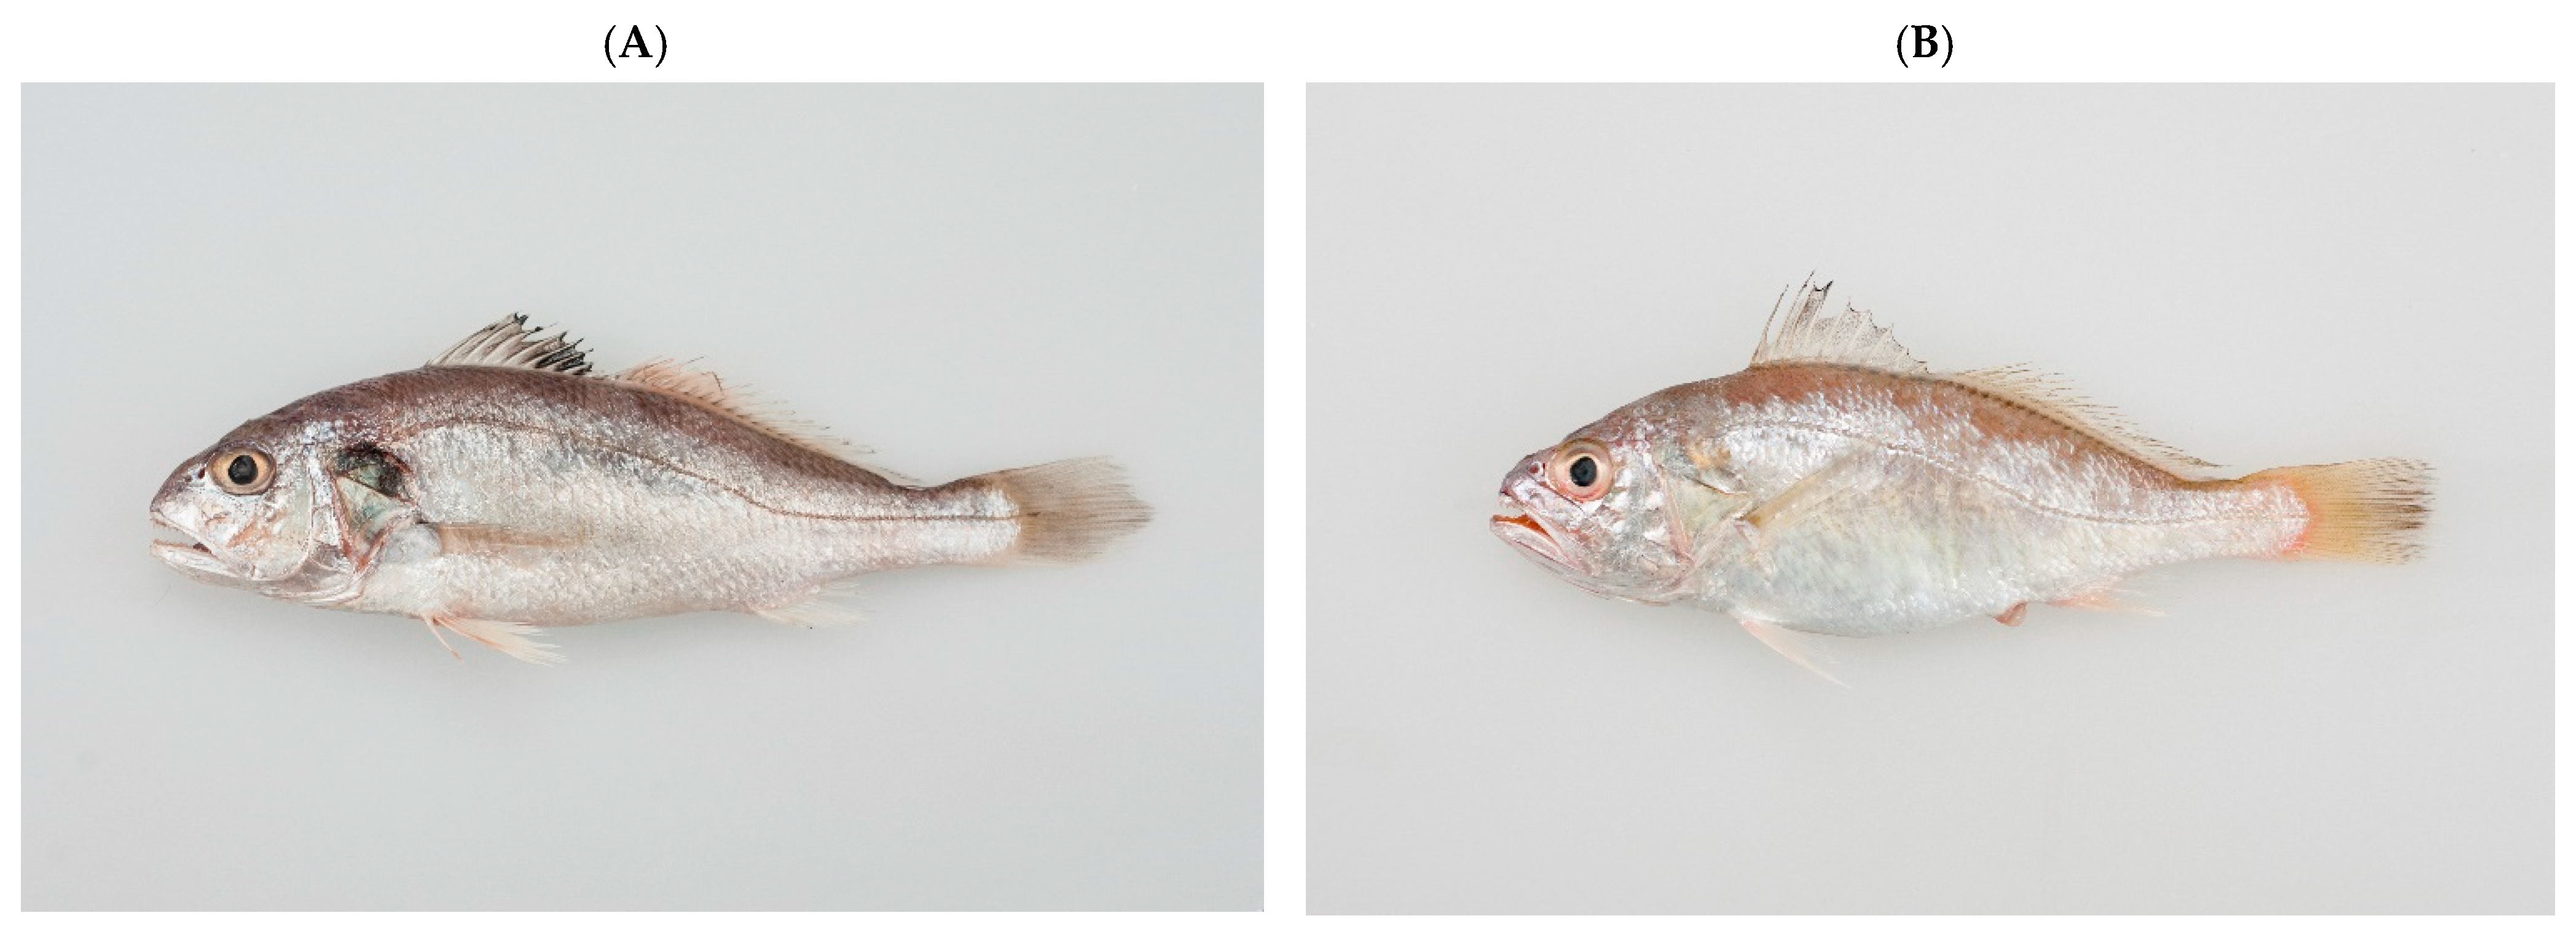
2.1. Sample Collection and Processing
2.2. Stomach Contents Analysis
2.3. Carbon and Nitrogen Stable Isotope Analysis
2.4. Spatial Niche
2.5. Data Processing
3. Results
3.1. Feeding Habit
3.1.1. Differences in Feeding Habits within Species
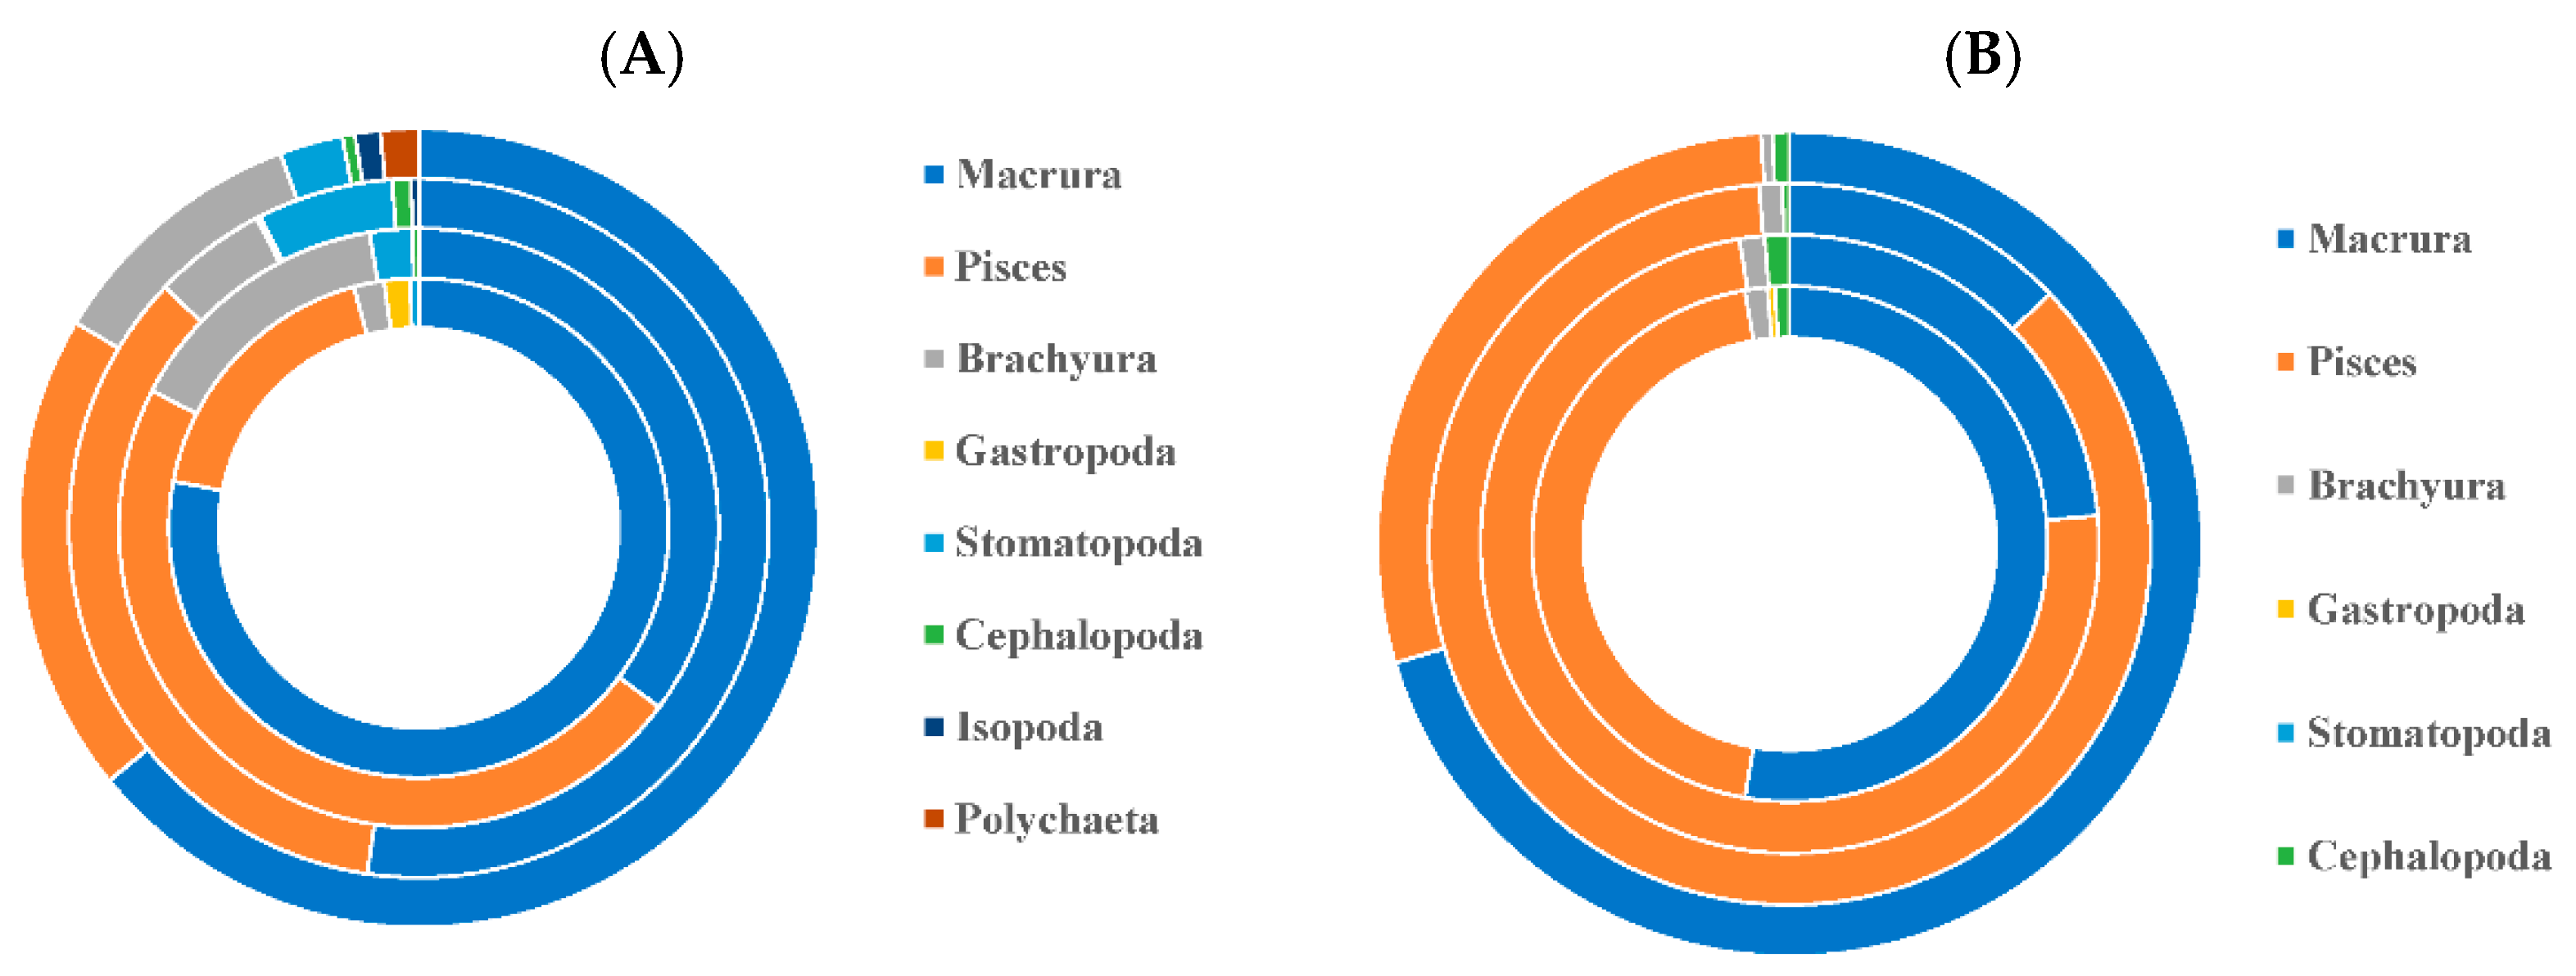
3.1.2. Differences in Feeding Habits between Species
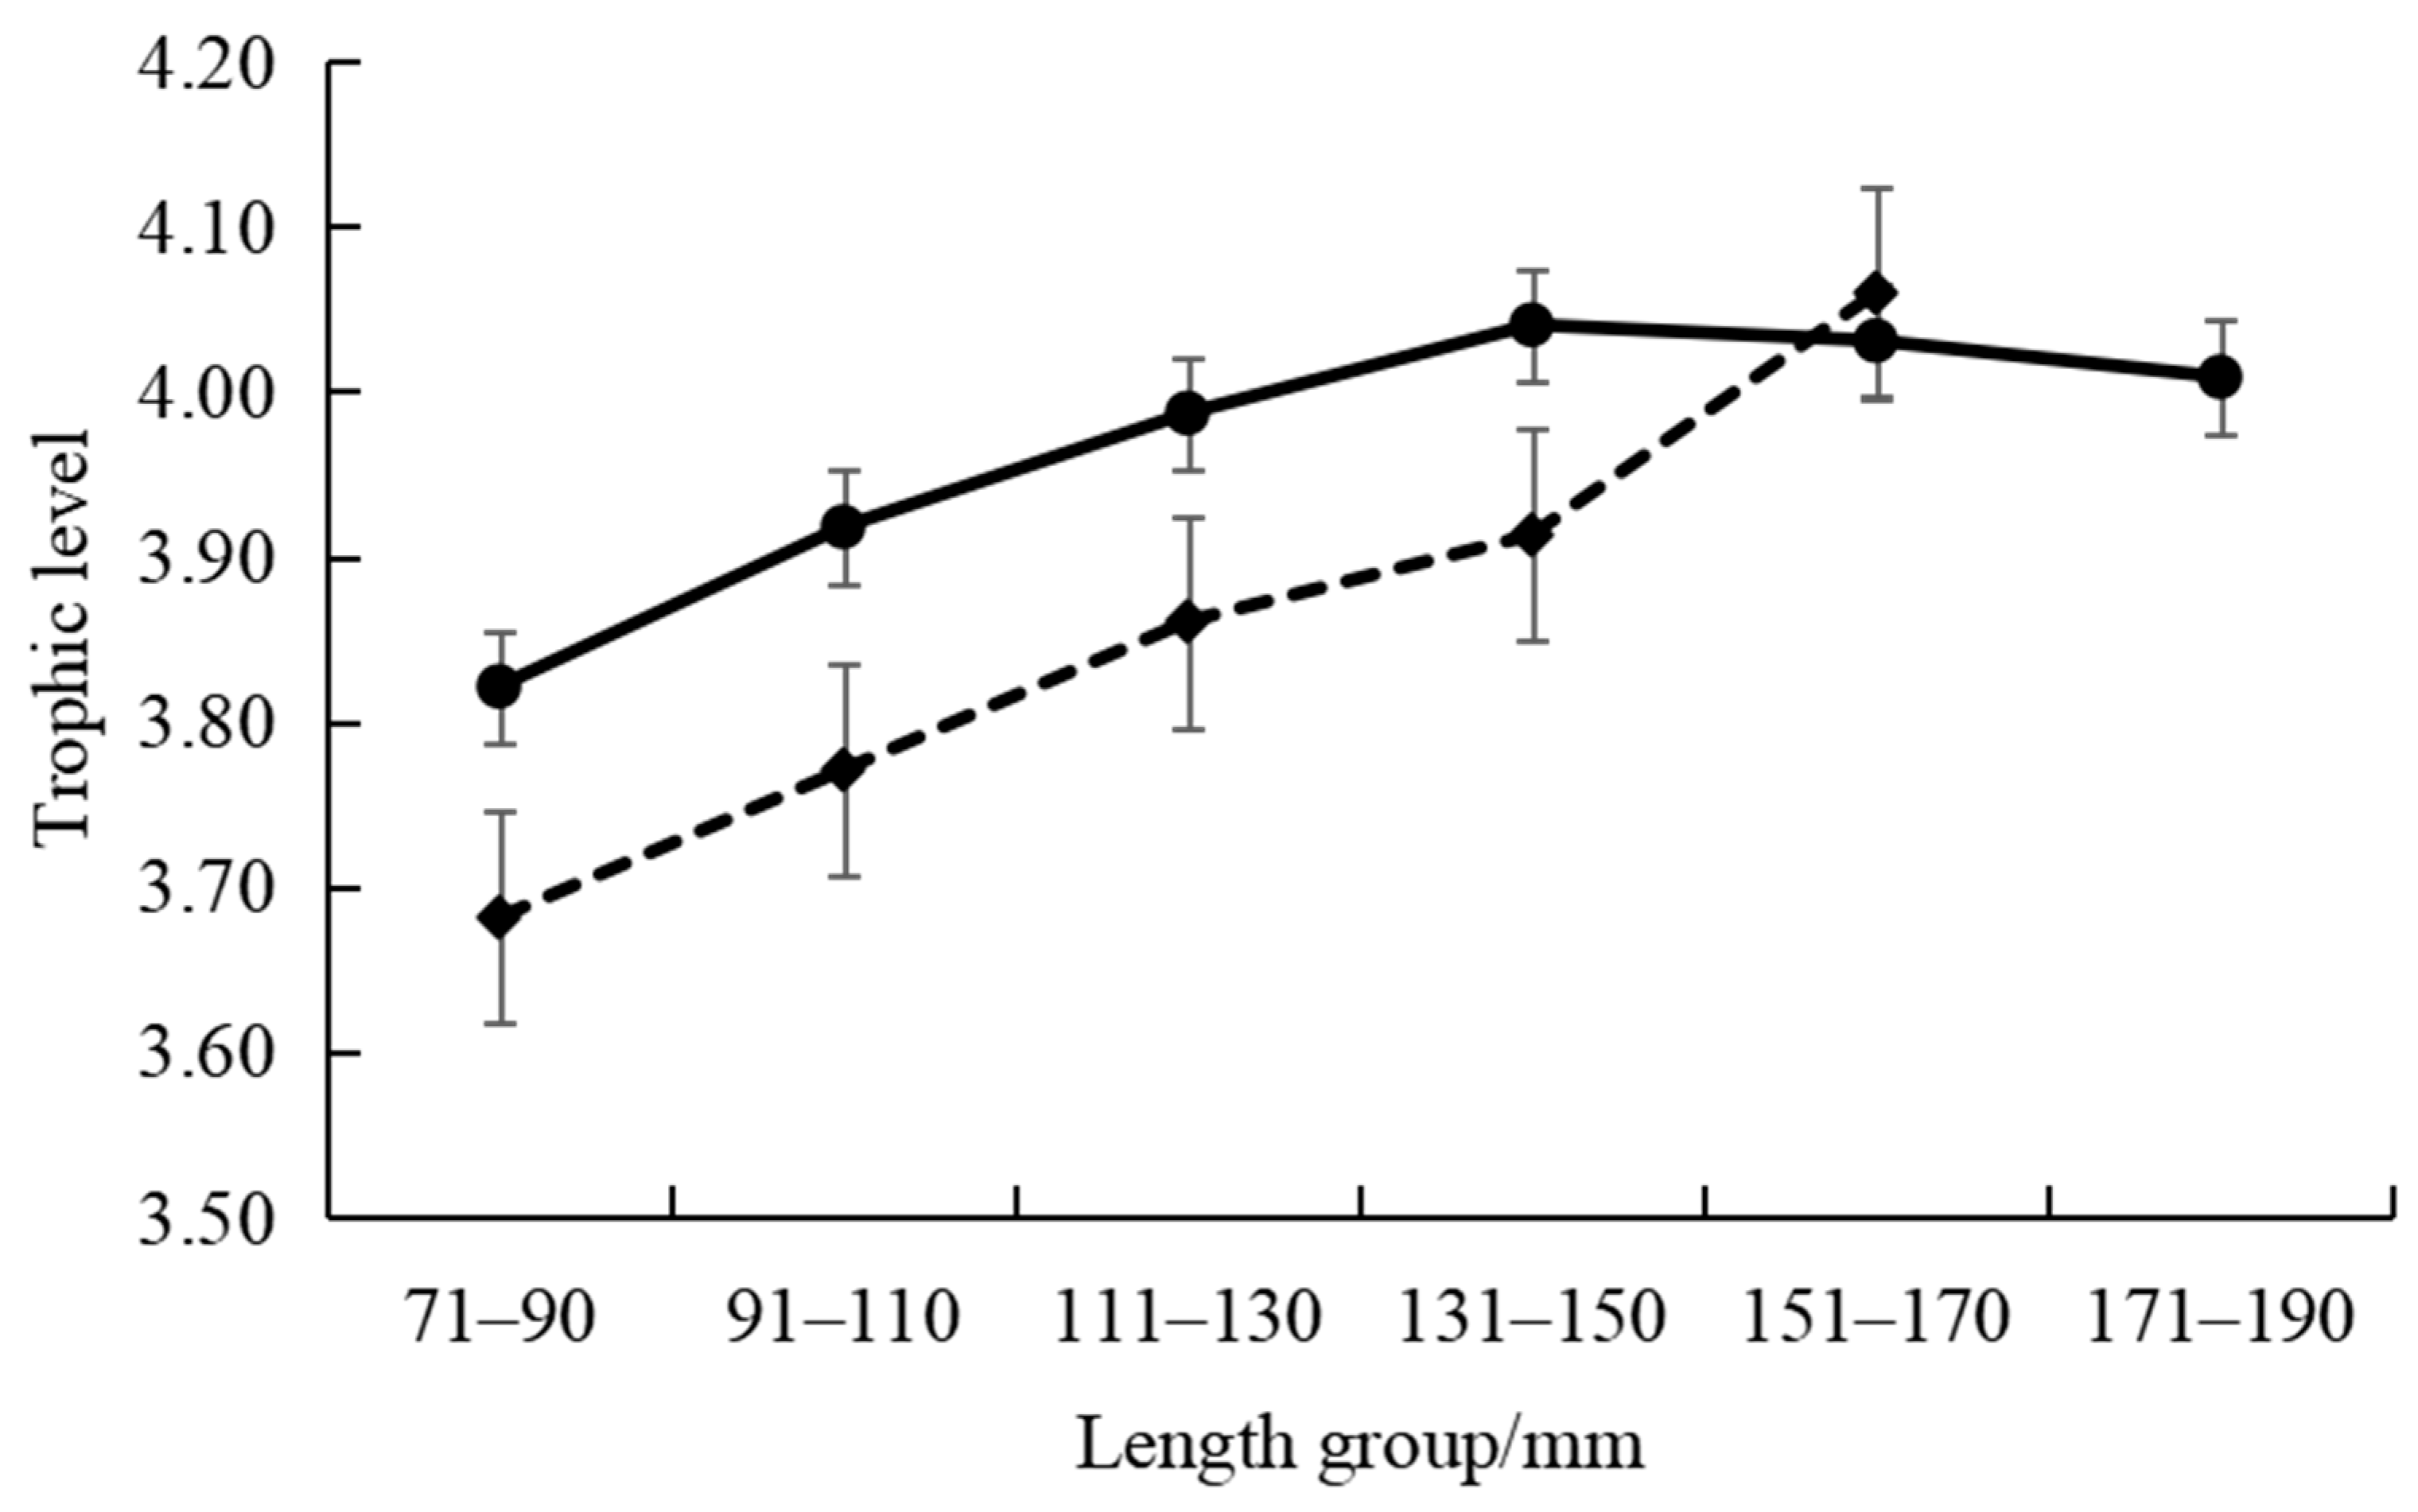
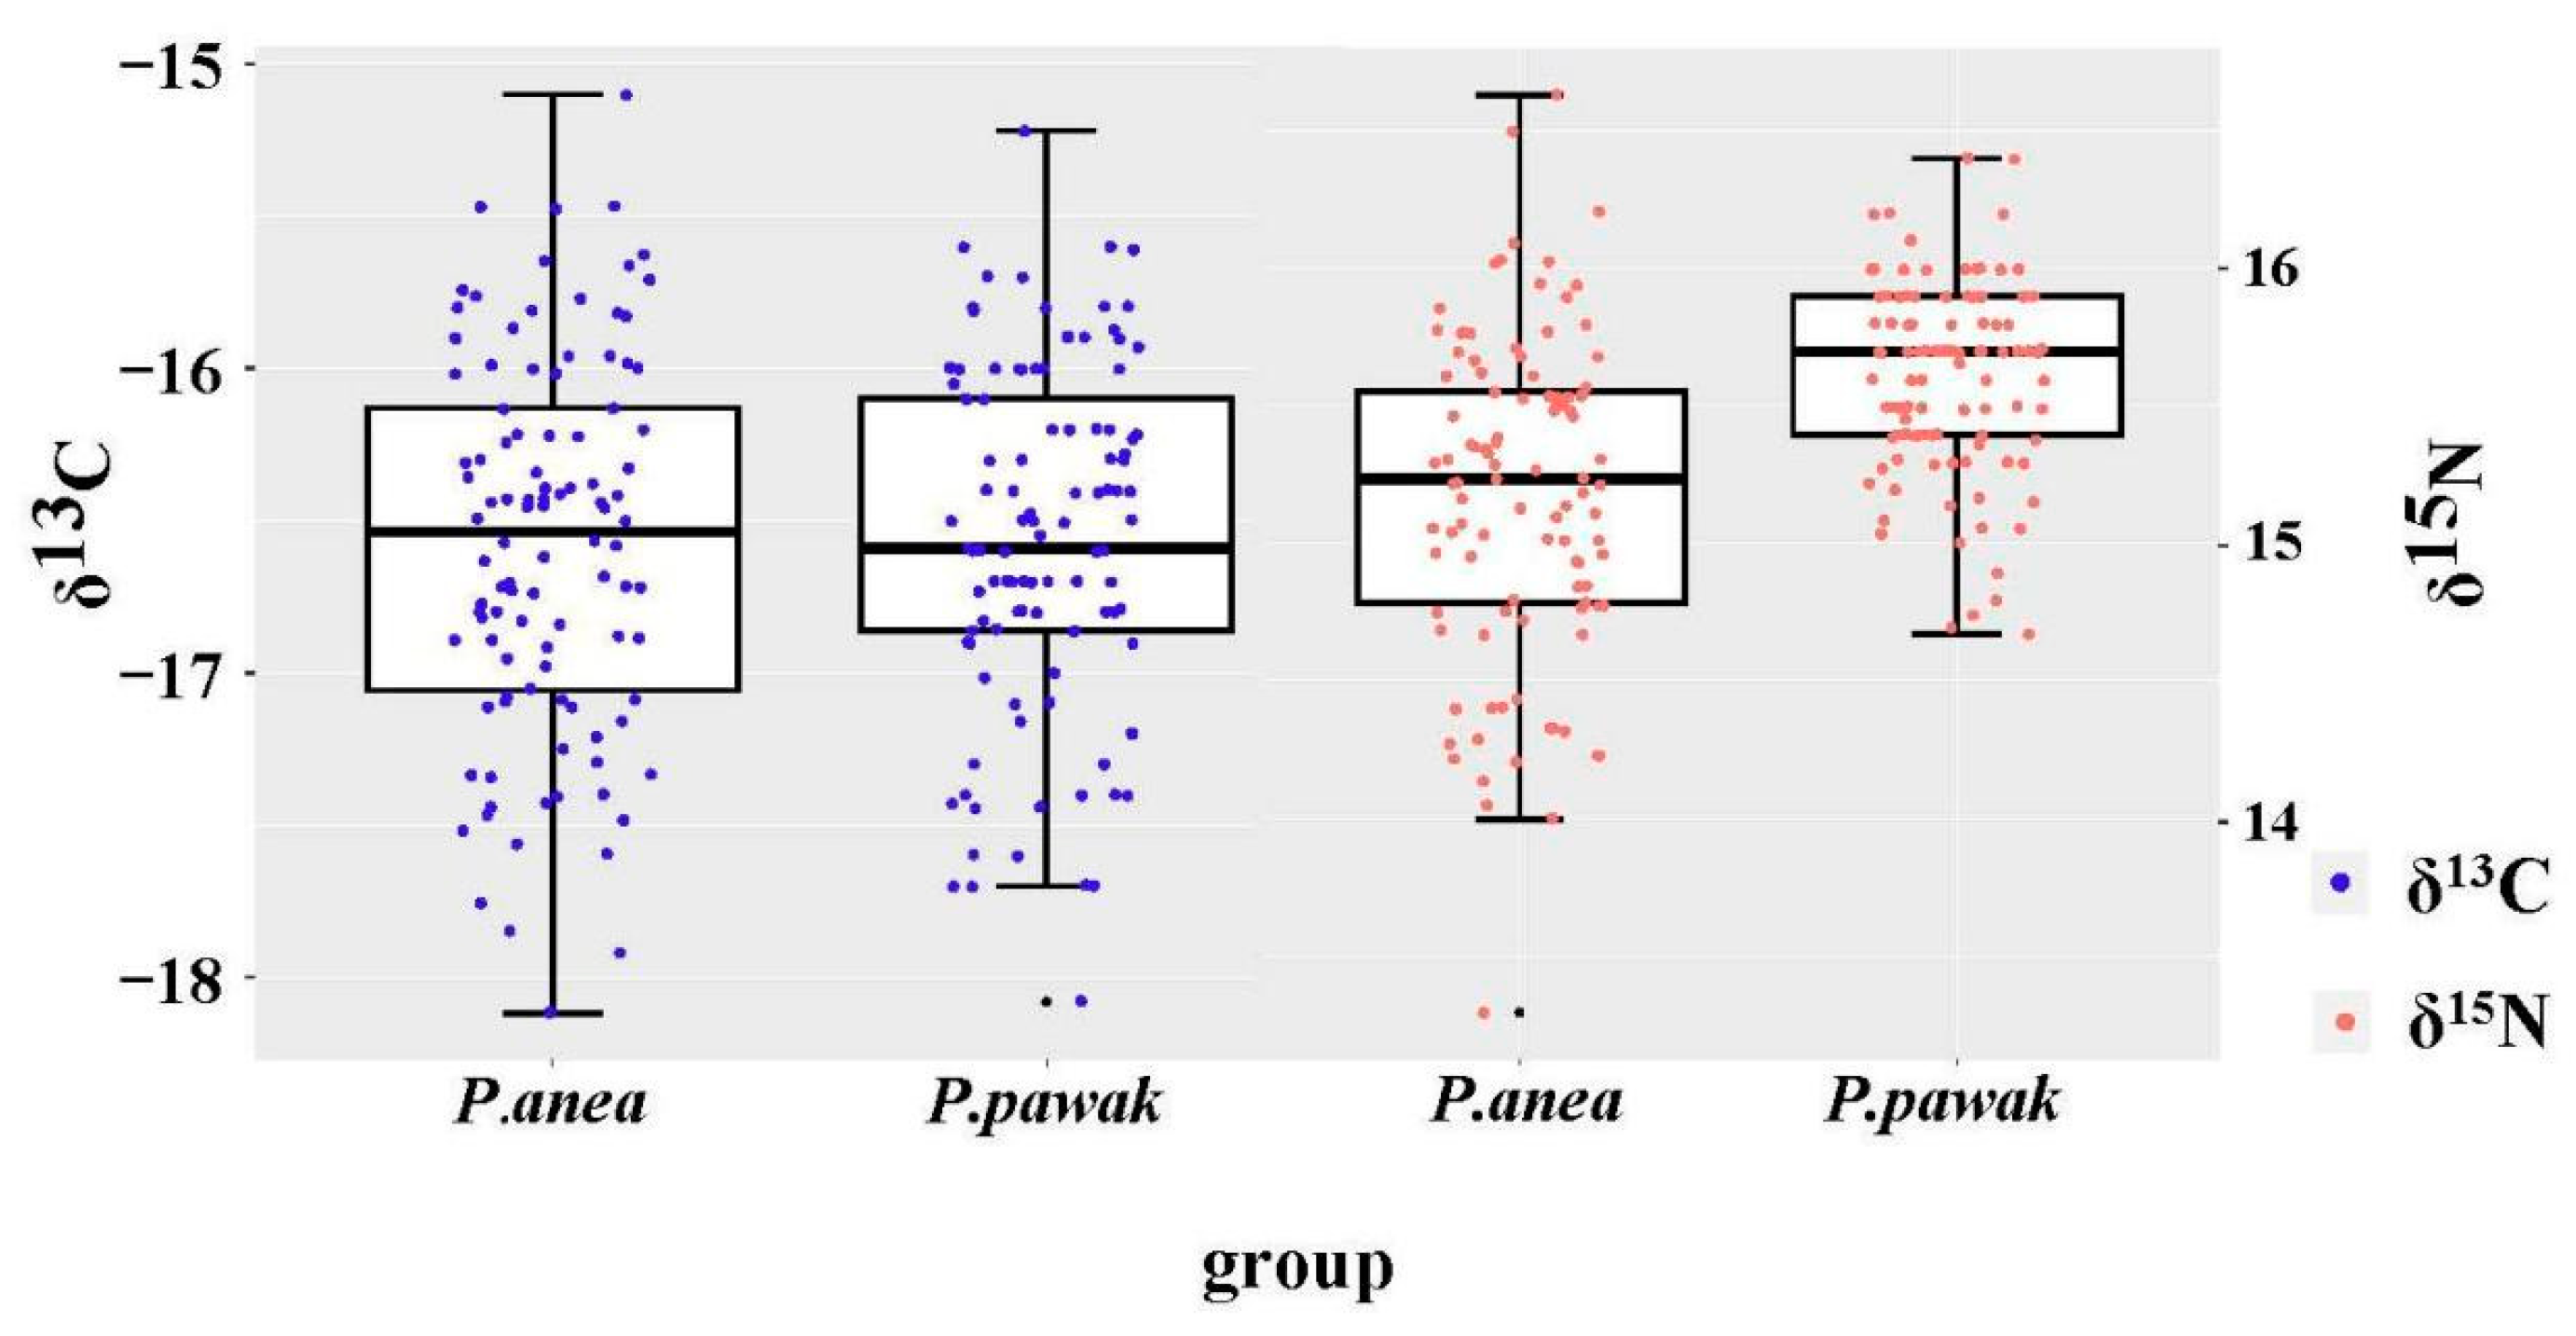
3.2. Isotopic Characteristics and Trophic Levels
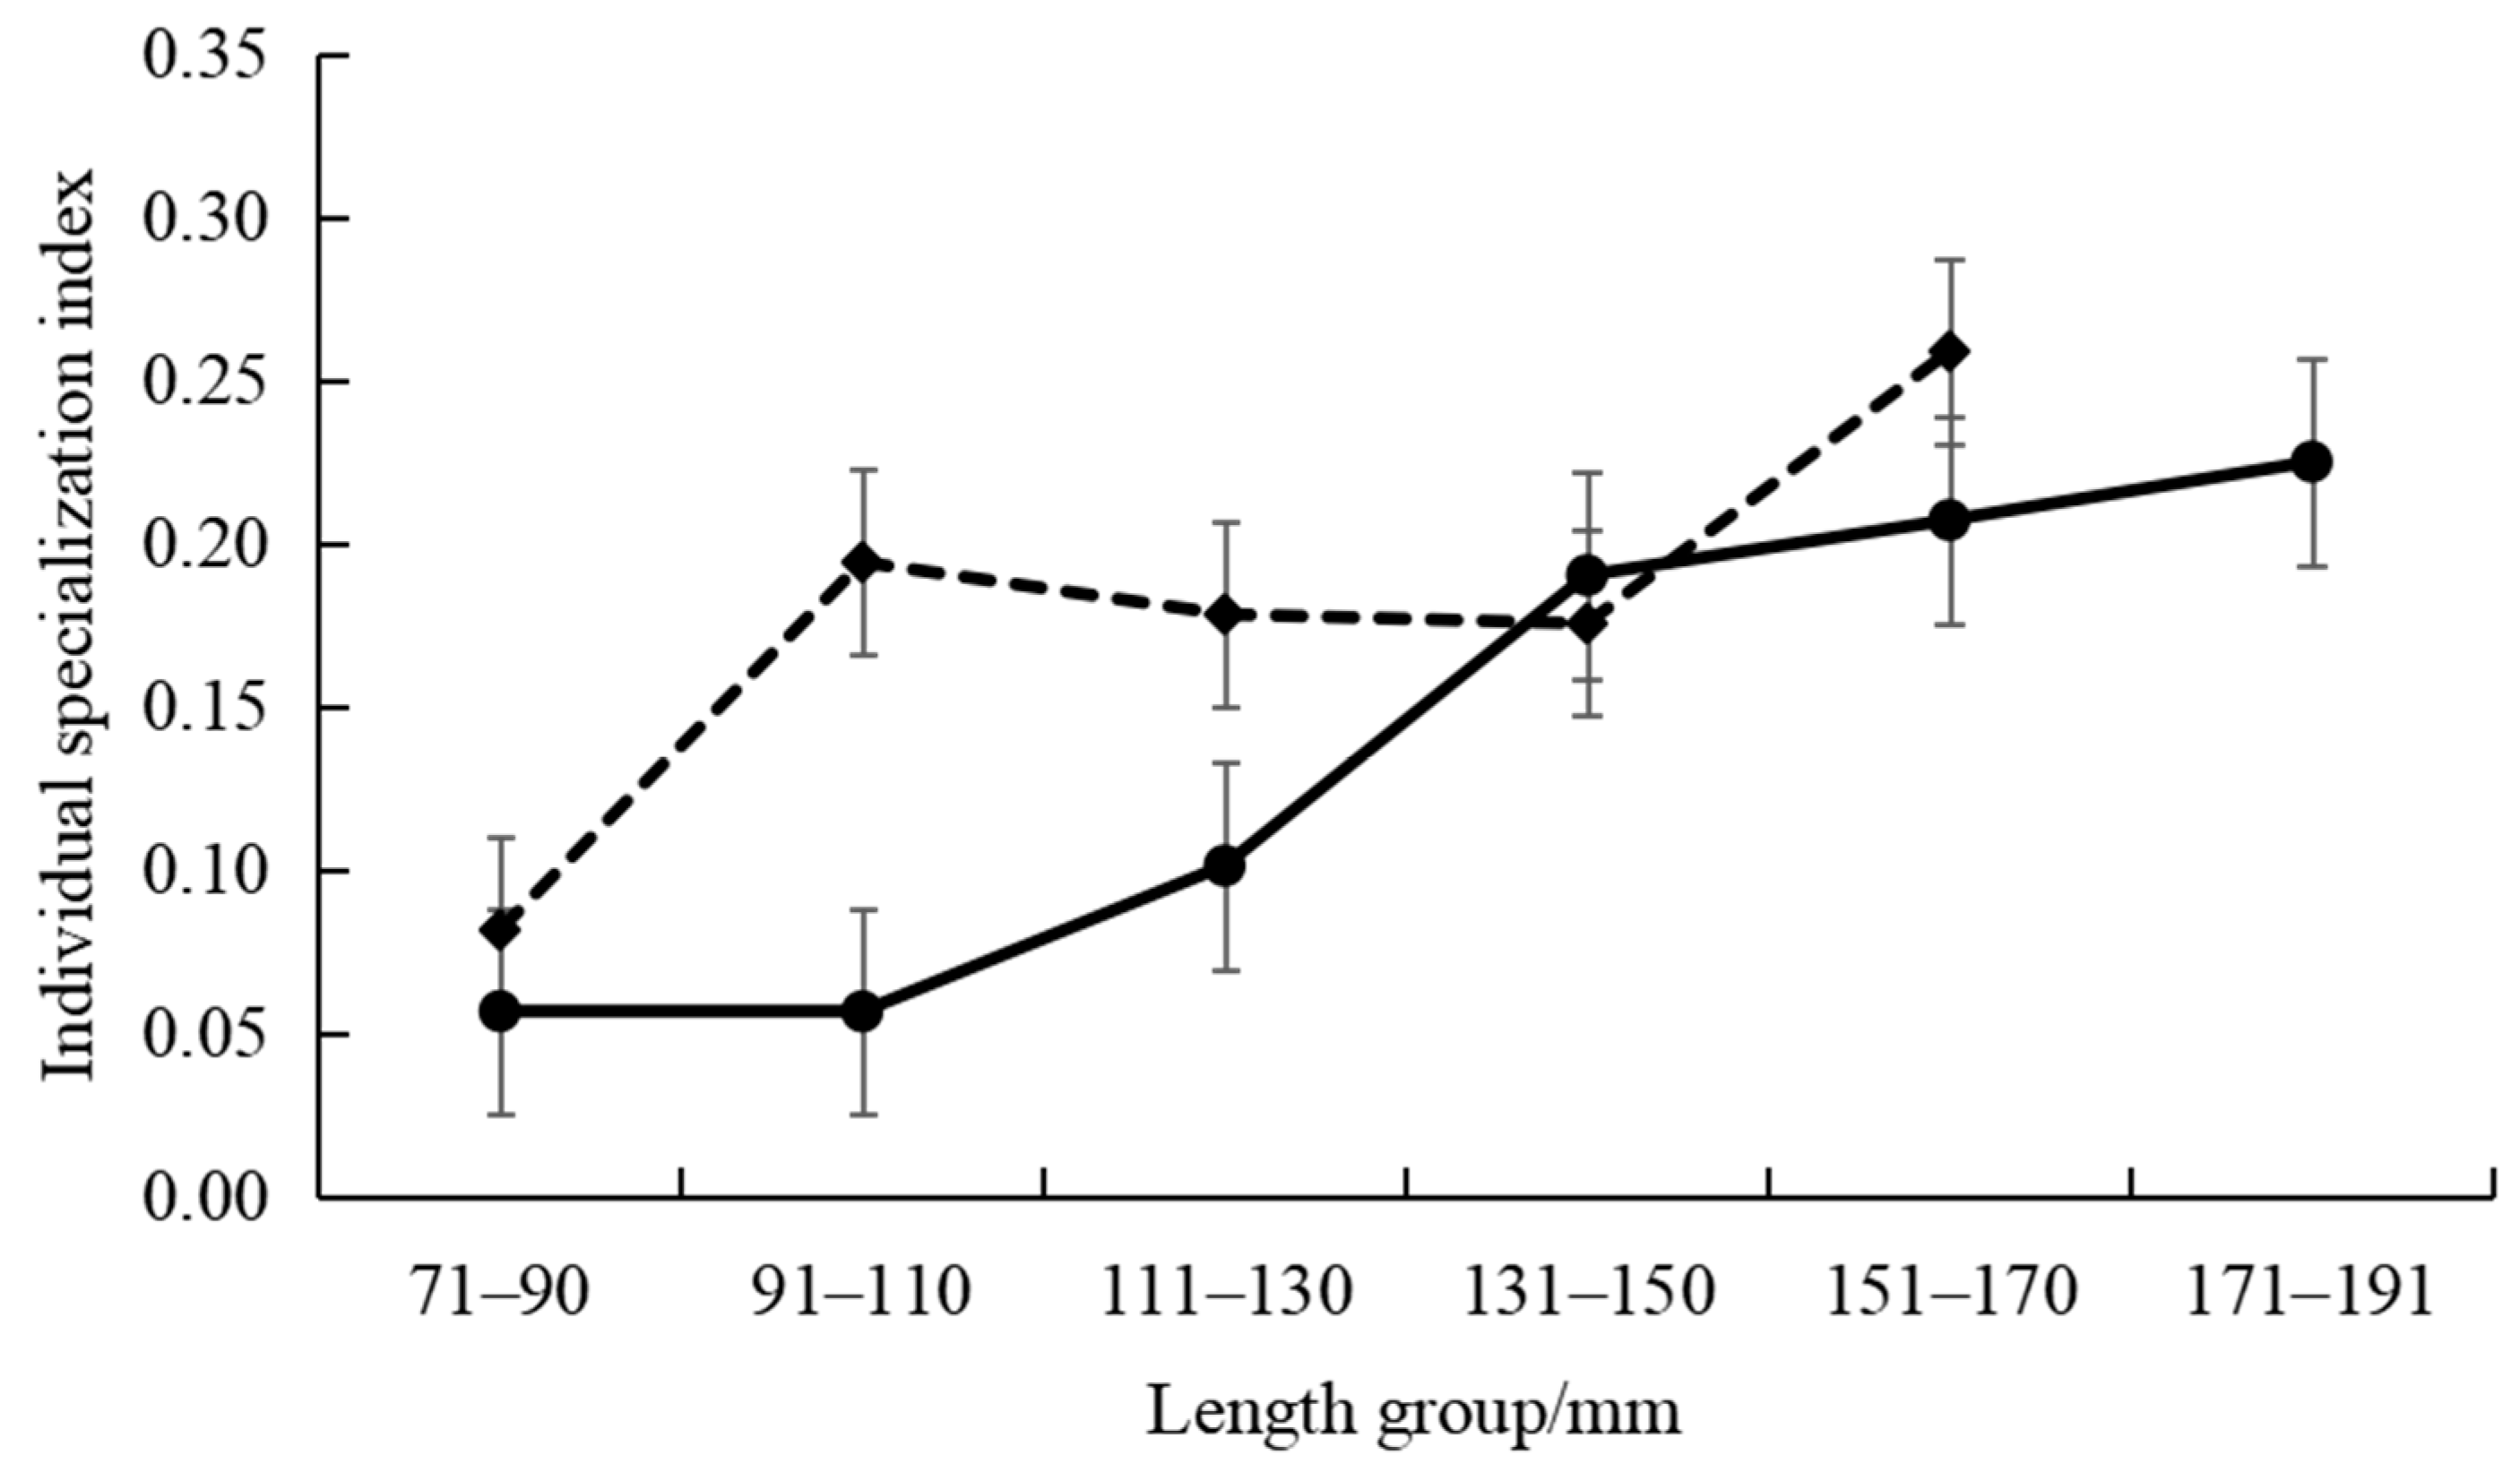
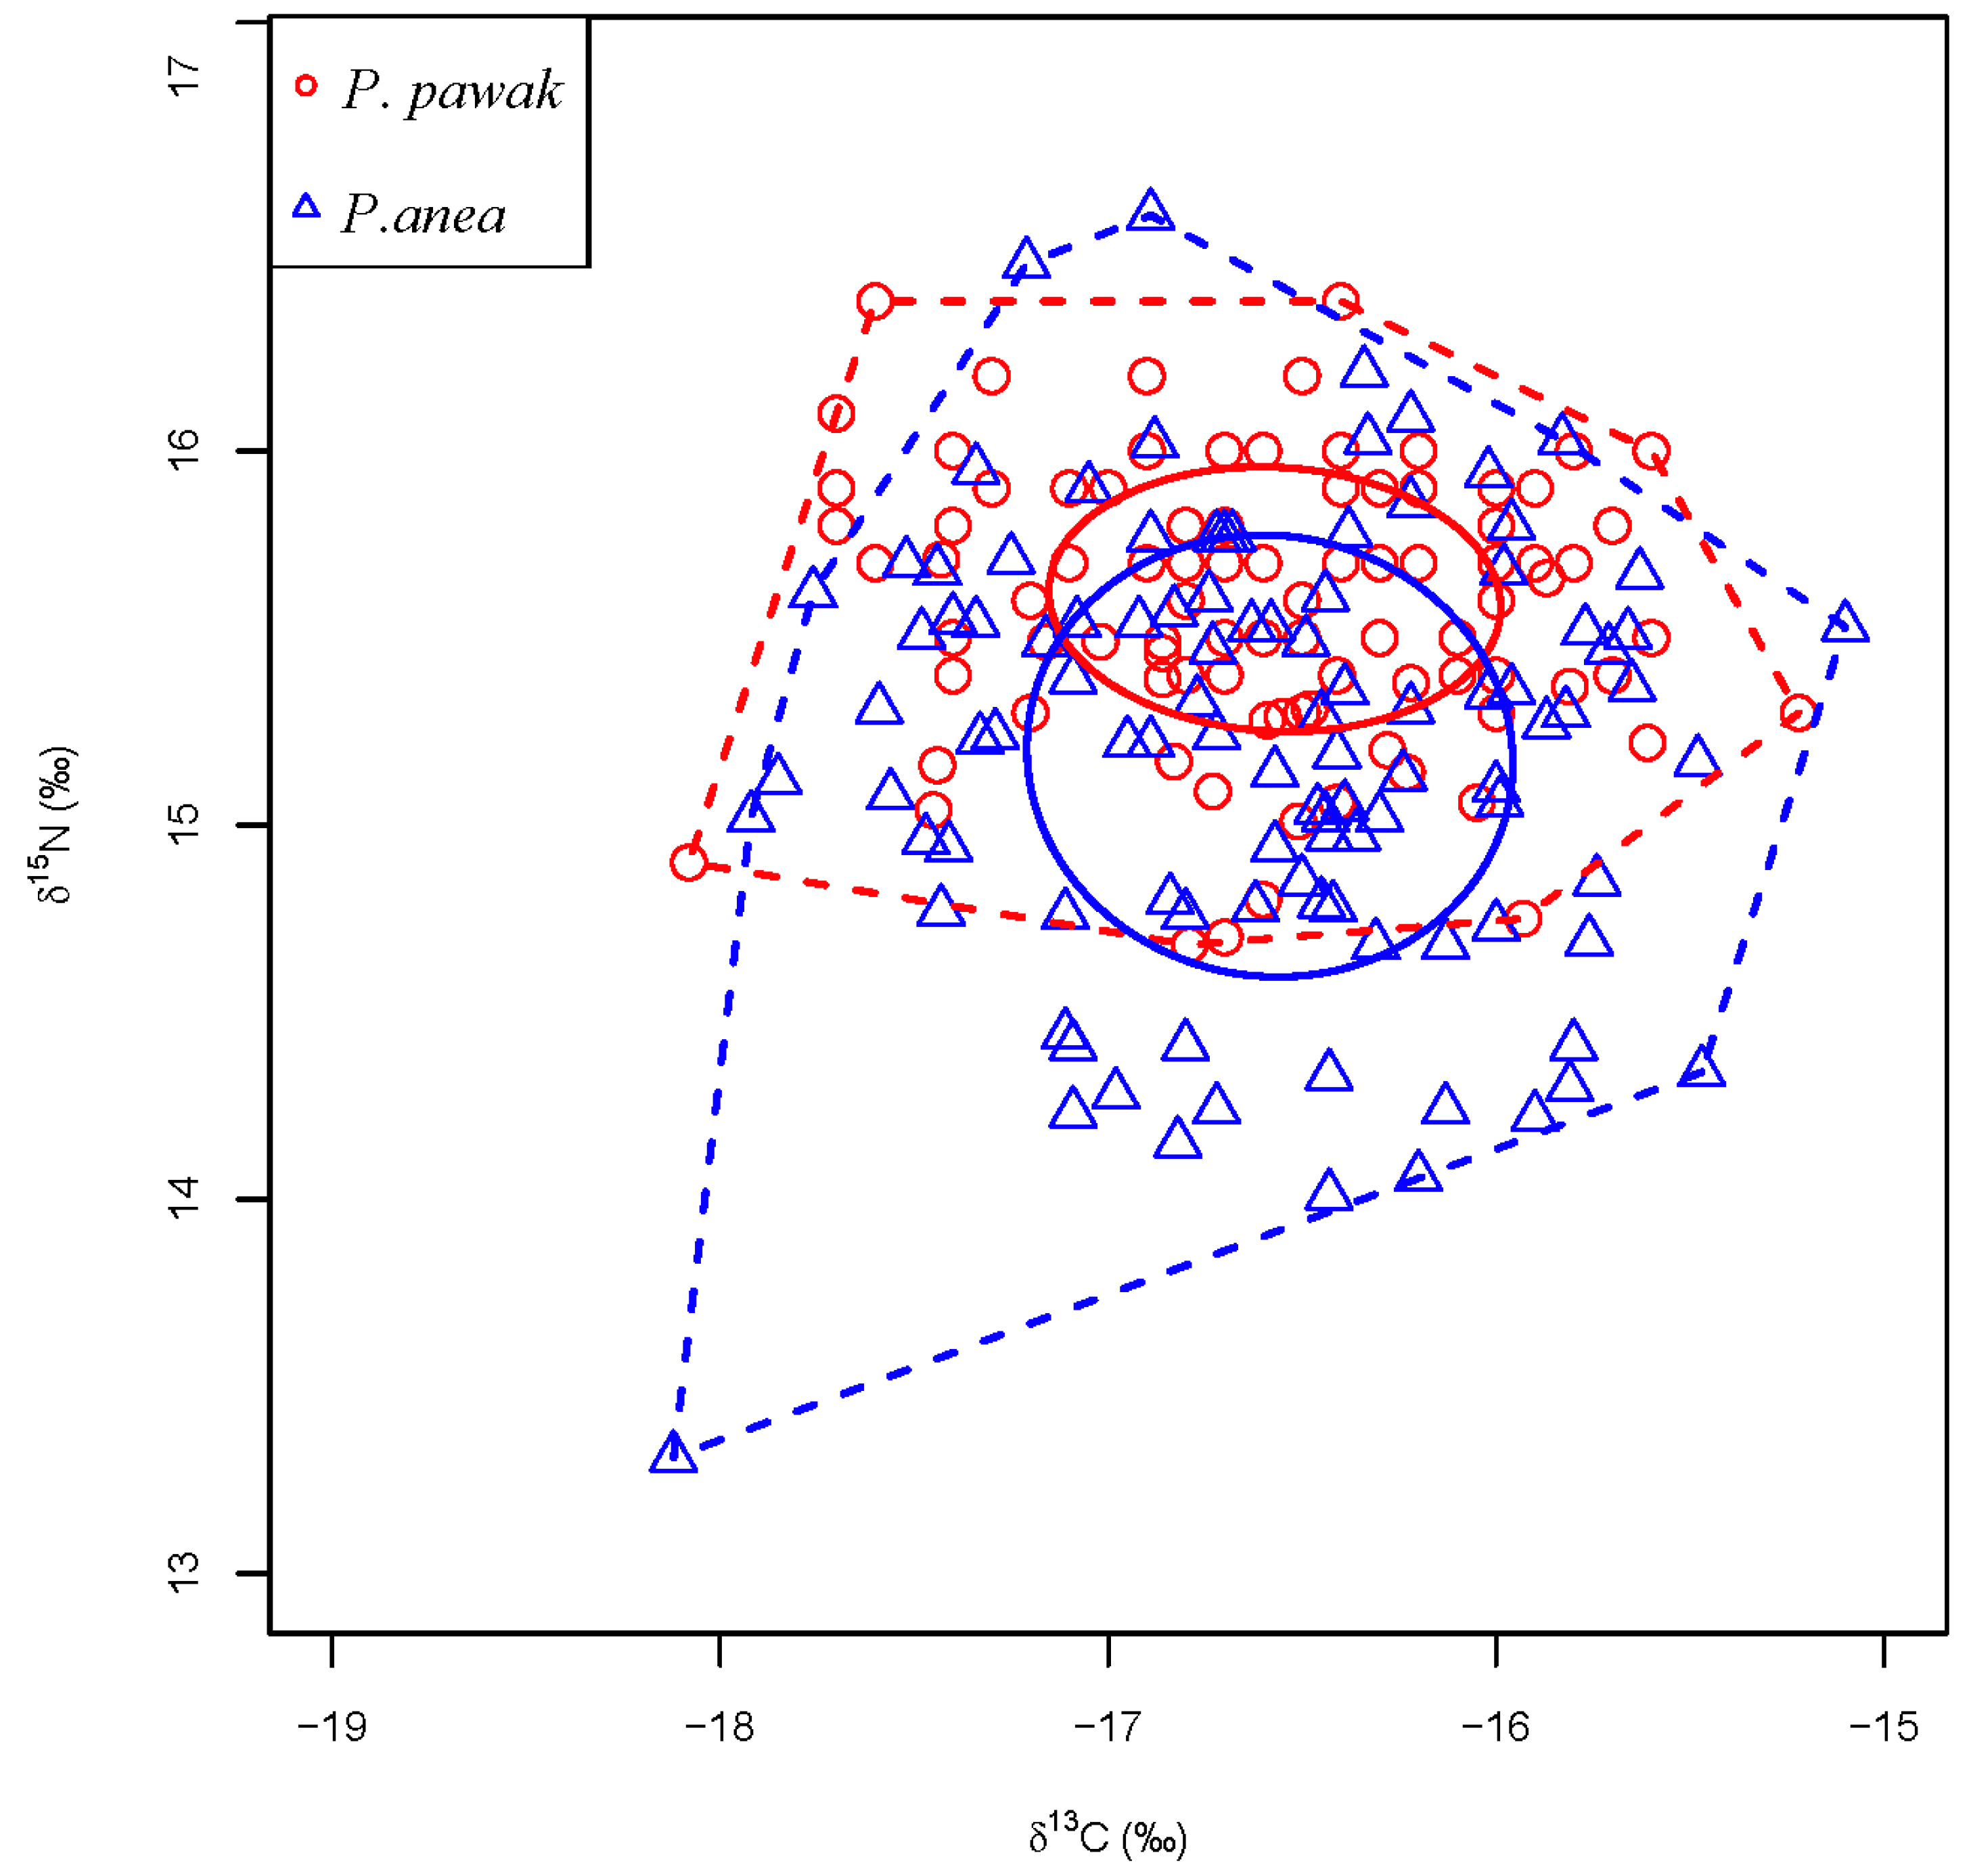
3.3. Trophic Niche
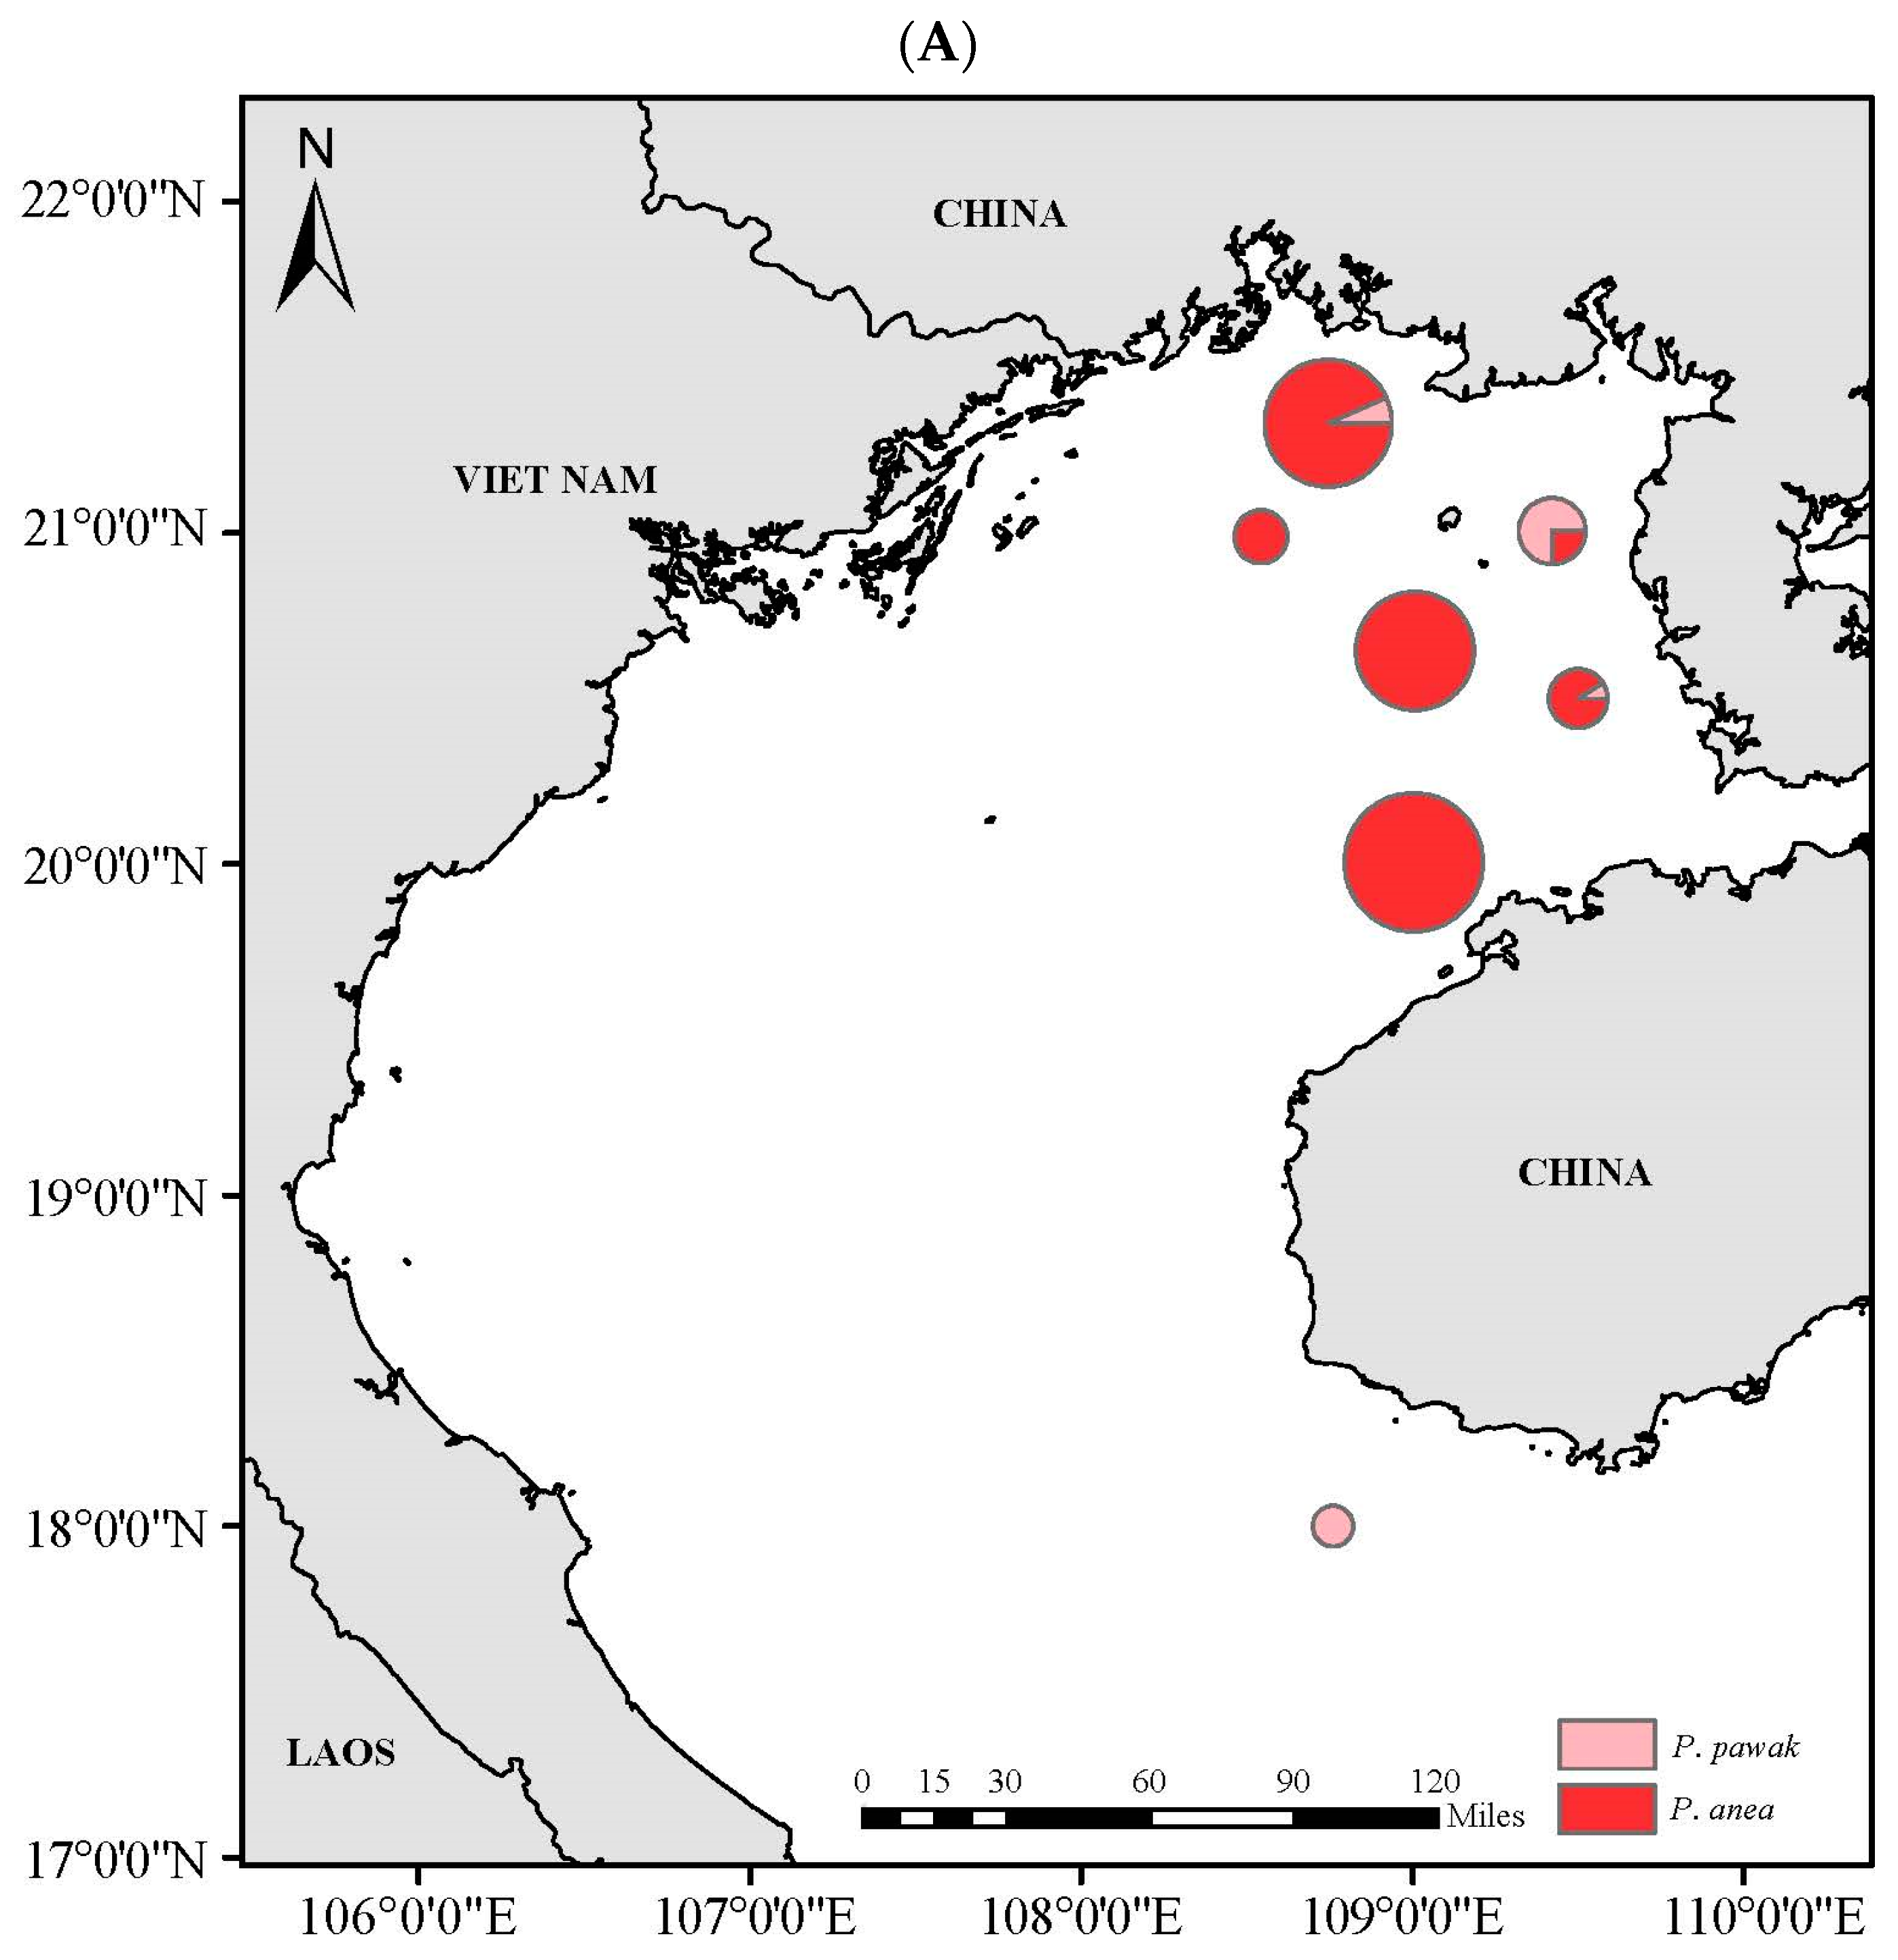
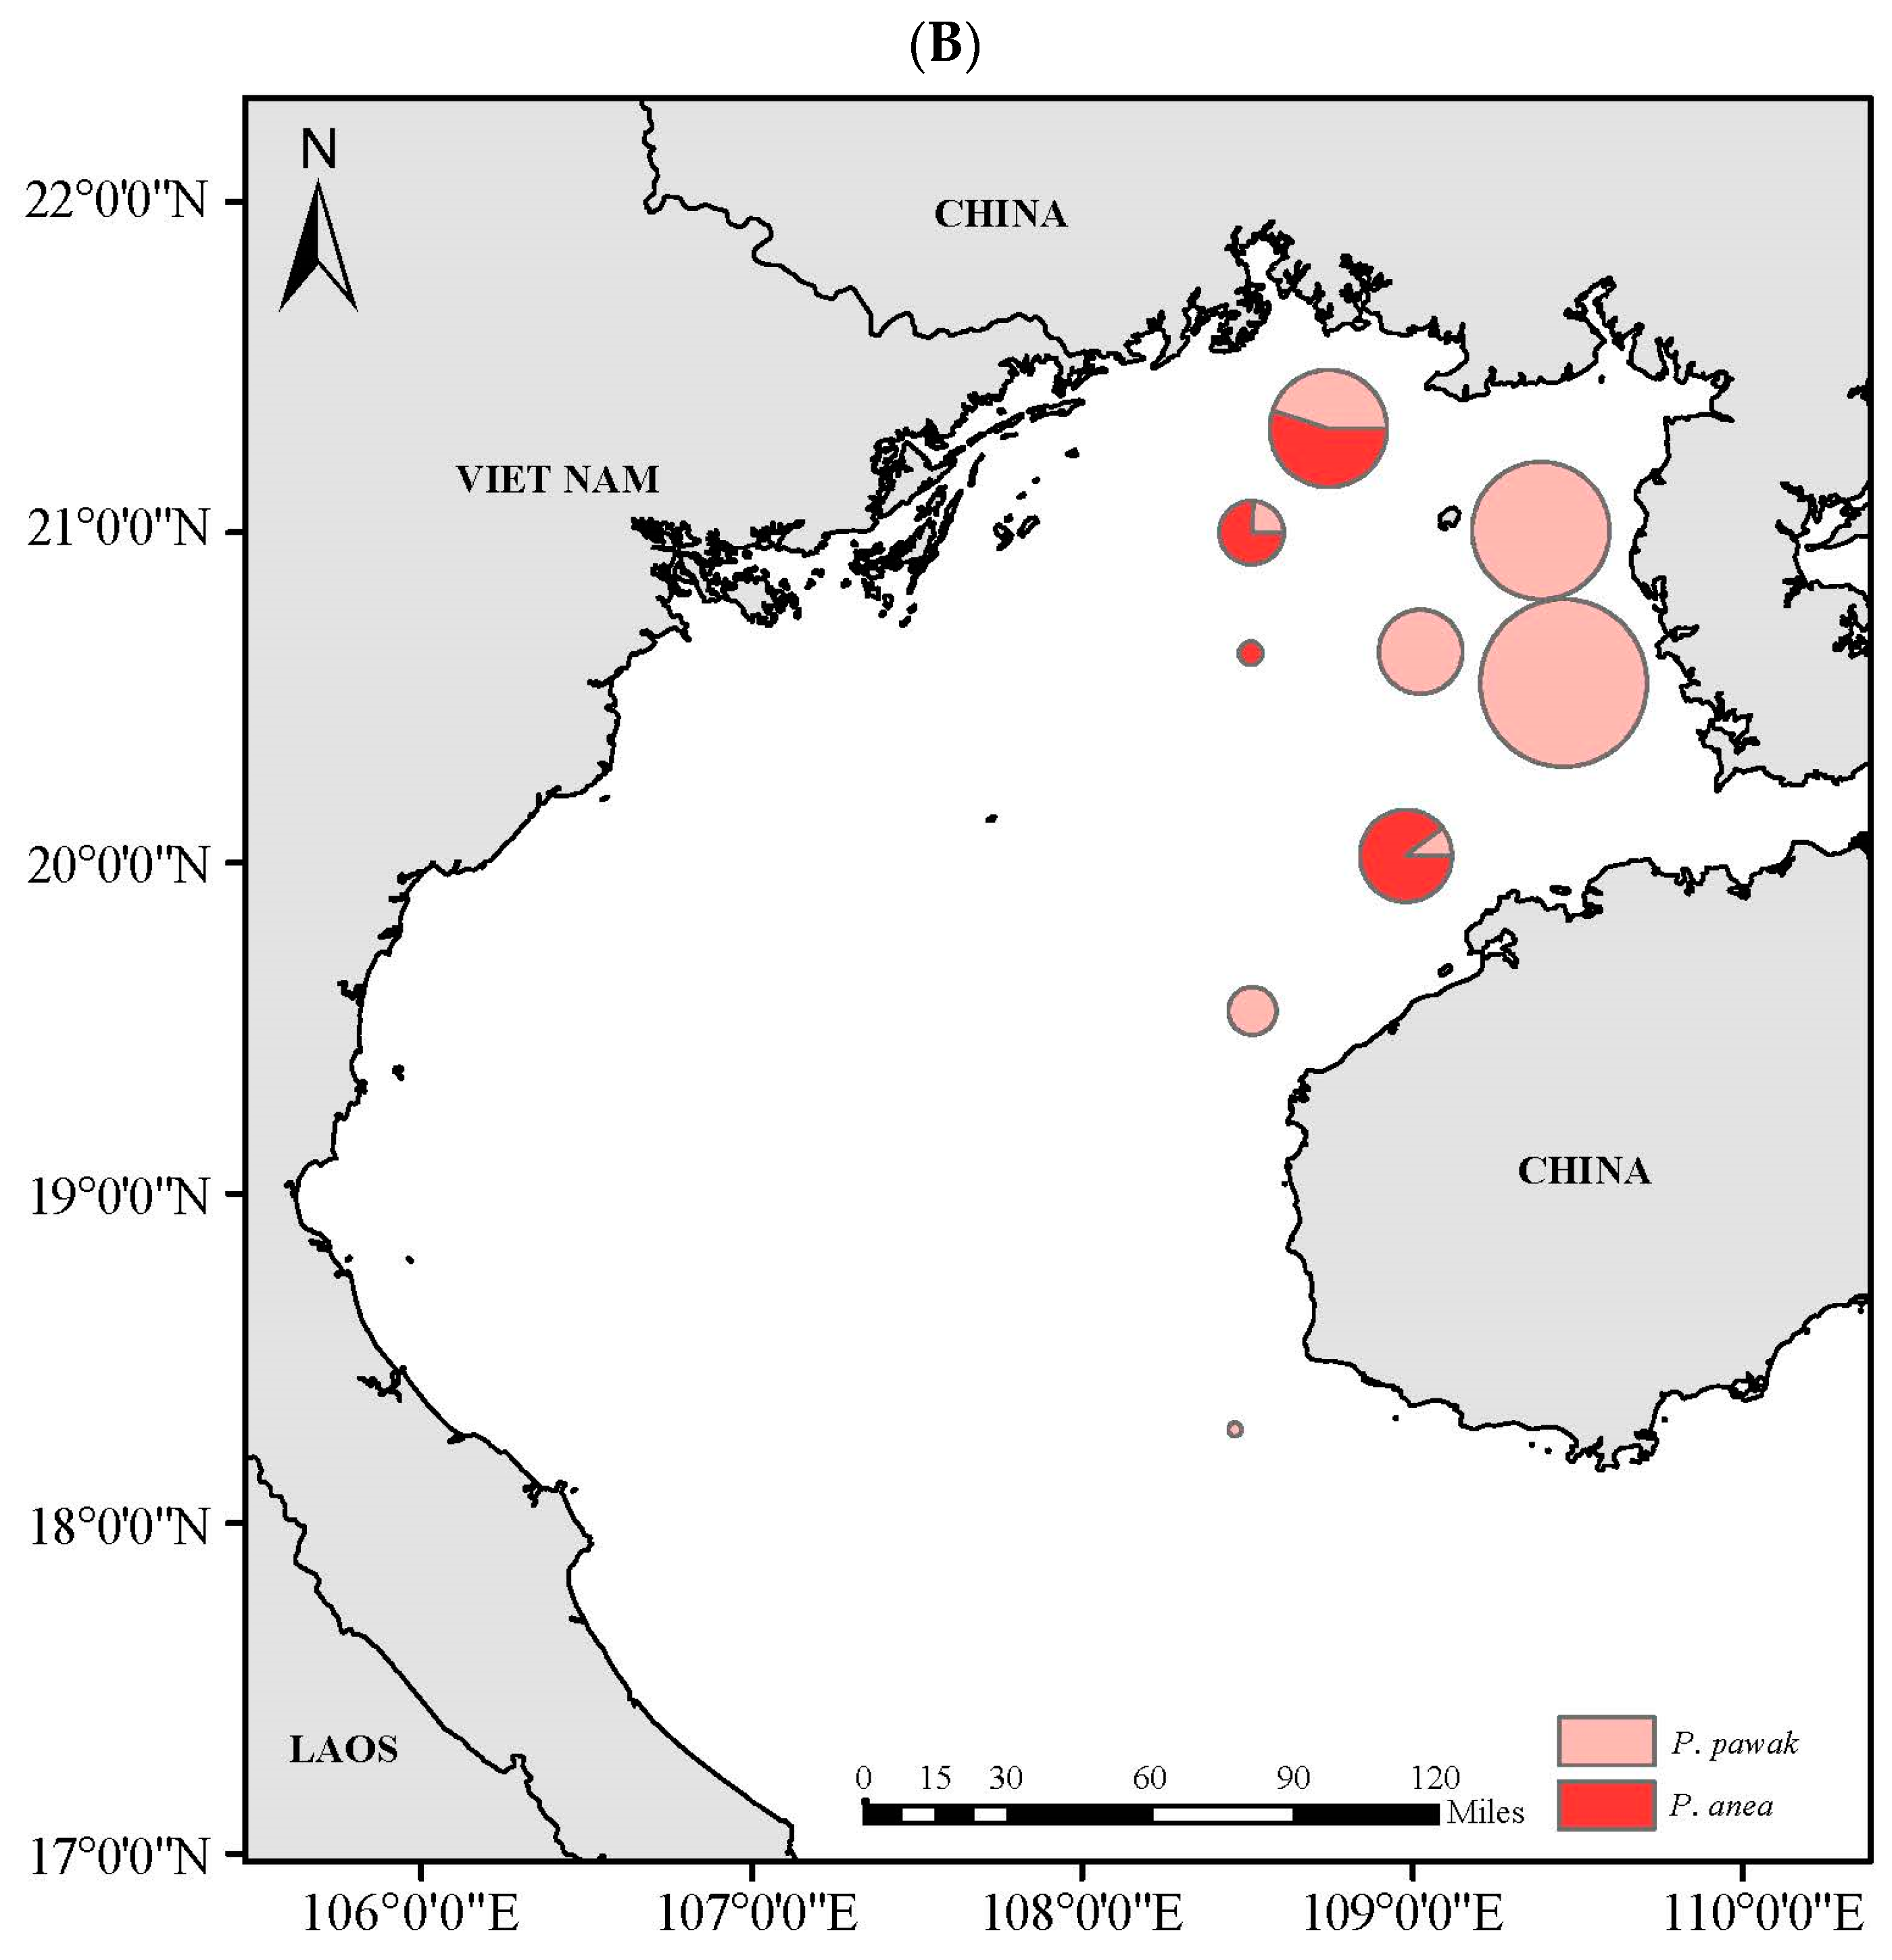
3.4. Spatial Niche
4. Discussion
5. Conclusions
Author Contributions
Funding
Institutional Review Board Statement
Informed Consent Statement
Data Availability Statement
Acknowledgments
Conflicts of Interest
References
- Liu, J. Advanced Aquatic Biology; Science Press: Beijing, China, 1999. [Google Scholar]
- Brönmark, C.; Hansson, L. The Biology of Lakes and Ponds; Oxford University Press: New York, NY, USA, 2005. [Google Scholar]
- Ward, A.; Webster, M.; Hart, P. Intraspecific Food Competition in Fishes. Fish Fish. 2006, 7, 231–261. [Google Scholar] [CrossRef]
- Deng, J.; Jiang, W.; Yang, J.; Li, J. Species Interaction and Food Web of Major Predatory Species in the Bohai Sea. J. Fish. Sci. China 1997, 4, 2–8. [Google Scholar]
- Tang, Q.; Fan, Y.; Lin, H. Initial Inquiring Into the Developmental Strategy of Chinese Ocean Ecosystem Dynamics Research. Adv. Earth Sci. 1996, 2, 160–168. [Google Scholar]
- Wang, J.; Su, Y.; Liu, J.; Qiu, X. The Feeding Habits of Five Sciaenids Fishes in Louyuan Bay. J. Jimei Univ. (Nat. Sci.) 1994, 26, 34–39. [Google Scholar]
- Li, Z.; Dai, Q.; Zuo, T.; Jin, X.; Zhuang, Z. Studies On Food Competition between Pseudosciaena polyactis and Johnius belengerii From Changjian Estuary and Adjacent Southern Yellow Sea in Autumn. J. Hydroecol. 2009, 30, 67–72. [Google Scholar]
- Matley, J.; Heupel, M.; Fisk, A.; Simpfendorfer, C.; Tobin, A. Measuring Niche Overlap Between Co-Occurring Plectropomus spp. Using Acoustic Telemetry and Stable Isotopes. Mar. Freshw. Res. 2017, 68, 1468. [Google Scholar] [CrossRef]
- Wang, Q.; Liu, M.; Zhu, F.; Li, Z.; Liu, S.; Duan, X.; Chen, D.; Yang, R. Comparative Study of Three Species of Schizothoracine On Feeding and Digestive Organs in Upper Nujiang River. Chin. J. Zool. 2019, 54, 207–221. [Google Scholar]
- Zhang, Y.; Xu, B.; Zhang, C.; Ji, Y.; Cheng, Y.; Xue, Y. Spatial Heterogeneity in the Feeding Habits and Feeding Ground Distribution of Johnius belangerii in Haizhou Bay During Spring. J. Fish. Sci. China 2020, 27, 315–326. [Google Scholar]
- Olesen, J.M.; Bascompte, J.; Dupont, Y.L.; Jordano, A.P. The Modularity of Pollination Networks. Proc. Natl. Acad. Sci. USA 2007, 104, 19891–19896. [Google Scholar] [CrossRef]
- Raul, C.P.; MaRcio, S.A.; Souza, F.L.; Ingram, T. Competition and Resource Breadth Shape Niche Variation and Overlap in Multiple Trophic Dimensions. Proc. Biol. Sci. 2019, 1902, 20190369. [Google Scholar]
- Yunkai, L.; Huiqiong, W.; Xinjun, C.; Yi, G. Trophic Niches and Interspecific Relationships Between Closely Related Ommastrephidae Species, Dosidicus gigas and Sthenoteuthis oualaniensis. Acta Ecol. Sin. 2020, 40, 5418–5423. [Google Scholar]
- Xiao, Y.; Jiang, R.; Yin, R.; Wang, J.; Yang, F.; Wang, H.; Li, Z. Trophic Niche and Interspecific Relationship of Five Eels in the Waters of the Zhoushan Islands. J. Fish. China 2023, 47, 65–74. [Google Scholar]
- Yang, Z.; Chen, X.; Zhao, N.; Tang, H.; Tao, J.; Zhang, P.; Fang, S.; Wan, C. The Effect of Different Habitat Types and Ontogenetic Stages On the Diet Shift of a Critically Endangered Fish Species, Coreius guichenoti (Sauvage and Dabry De Thiersant, 1874). Int. J. Environ. Res. Public Health 2018, 15, 2240. [Google Scholar] [CrossRef]
- Hyslop, E.J. Stomach Contents Analysis—A Review of Methods and their Application. J. Fish Biol. 1980, 17, 411–429. [Google Scholar] [CrossRef]
- Xue, Y.; Jin, X. Review of the Study On Feeding Habits of Fishes and Food Webs. Prog. Fish. Sci. 2003, 24, 76–87. [Google Scholar]
- Dixon, H.; Dempson, J.; Sheehan, T.; Renkawitz, M.; Power, M. Assessing the Diet of North American Atlantic Salmon (Salmo salar L.) Off the West Greenland Coast Using Gut Content and Stable Isotope Analyses. Fish Ocean. 2017, 26, 555–568. [Google Scholar] [CrossRef]
- Wang, X.; Qiu, Y.; Du, F.; Lin, Z.; Sun, D.; Huang, S. Dynamics of Demersal Fish Species Diversity and Biomass of Dominant Species in Autumn in the Beibu Gulf, Northwestern South China Sea. Acta Ecol. Sin. 2012, 32, 333–342. [Google Scholar] [CrossRef]
- Yi, X.; Qiu, K.; Zhou, X.; Zhao, C.; Deng, Y.; He, X.; Yan, Y. Analysis of Fishery Biology of Pennahia pawak in Beibu Gulf. J. Shanghai Ocean Univ. 2021, 30, 515–524. [Google Scholar]
- Wang, X.; Du, F.; Qiu, Y. Length-Weight Relationships of Important Commercial Fishes in Northern South China Sea. J. Appl. Oceanogr. 2006, 262–266. [Google Scholar]
- Wagiyo, K.; Tirtadanu; Chodriyah, U. Biology Characteristic, Abundance Index and Fishing Aspect of Donkey Croaker (Pennahia anea Bloch, 1793) in the Tangerang Waters. E3S Web Conf. 2020, 4, 1011. [Google Scholar] [CrossRef]
- Tuuli, C.; de Mitcheson, Y.; Liu, M. Reproductive Biology of the Greyfin Croaker Pennahia anea in the Northern South China Sea. Ichthyol. Res. 2011, 58, 302–309. [Google Scholar] [CrossRef]
- He, X.; Tao, Y.; Hou, G.; Lu, H.; Yan, Y. Population Structure and Spatio-Temporal Distribution of Pennahia pawak in the Beibu Gulf, South China Sea. J. Guangdong Ocean Univ. 2015, 35, 35–42. [Google Scholar]
- Yan, Y.; Hou, G.; Lu, H.; Yin, Q. Age and Growth of Pawak Croaker Pennahia pawak in Beibu Gulf. J. Fish. Sci. China 2011, 18, 145–155. [Google Scholar] [CrossRef]
- Yi, X. Feeding Ecology of Pawak Croaker (Pennahia pawak) in the Beibu Gulf. Master’s Thesis, Guangdong Ocean University, Zhanjiang, China, 2021. [Google Scholar]
- Third Institute of Oceanography State Oceanic Administration. Specifications for Oceanographic Survey—Part 6: Marine Biological Survey. In General Administration of Quality Supervision, Inspection and Quarantine of the People’s Republic of China; Standardization Administration: Beijing, China, 2007. [Google Scholar]
- Figueiredo, M.; Morato, T.; Barreiros, J.P.; Afonso, P.; Santos, R.S. Feeding Ecology of the White Seabream, Diplodus sargus, and the Ballan Wrasse, Labrus bergylta, in the Azores. Fish. Res. 2005, 75, 107–119. [Google Scholar] [CrossRef]
- Dou, S. Fish-Stomach Content Analysis: Methods and Application. Mar. Sci. Bull. 1992, 11, 28–31. [Google Scholar]
- Pianka, E. The Structure of Lizard Communities. Annu. Rev. Ecol. Evol. Syst. 1973, 4, 53–74. [Google Scholar] [CrossRef]
- Shannon, C. The Mathematical Theory of Communication. MD Comput. 1997, 14, 306–317. [Google Scholar]
- Roughgarden, J. Evolution of Niche Width. Am. Nat. 1972, 106, 683–718. [Google Scholar] [CrossRef]
- Bolnick, D.I.; Yang, L.H.; Fordyce, J.A.; Davis, J.M.; Svanbäck, R. Measuring Individual-Level Resource Specialization. Ecology 2002, 83, 2936–2941. [Google Scholar] [CrossRef]
- McKinney, C.; McCrea, J.; Epstein, S.; Allen, H.; Urey, H. Improvements in Mass Spectrometers for the Measurement of Small Differences in Isotope Abundance Ratios. Rev. Sci. Instrum. 1950, 21, 724–730. [Google Scholar] [CrossRef]
- Post, D. Using Stable Isotopes to Estimate Trophic Position: Models, Methods, and Assumptions. Ecology 2002, 83, 703–718. [Google Scholar] [CrossRef]
- He, X.; Zhu, D.; Zhao, C.; Yan, Y.; Kang, B. Feeding Habit of Asian Moon Scallop (Amusium pleuronectes) and as an Isotopic Baseline Indicator in the Beibu Gulf, South China Sea. J. Shellfish Res. 2019, 38, 245–252. [Google Scholar] [CrossRef]
- Jackson, A.; Inger, R.; Parnell, A.; Bearhop, S. Comparing Isotopic Niche Widths among and within Communities: Siber-Stable Isotope Bayesian Ellipses in R. J. Anim. Ecol. 2011, 80, 595–602. [Google Scholar] [CrossRef]
- Schoener, T.W. Sizes of Feeding Territories Among Birds. Ecology 1968, 49, 123–141. [Google Scholar] [CrossRef]
- Zhan, B. Fishery Resources Assessment; China Agriculture Press: Beijing, China, 1995. [Google Scholar]
- Jensen, H.; Kiljunen, M.; Amundsen, P.A. Dietary Ontogeny and Niche Shift to Piscivory in Lacustrine Brown Trout Salmo Trutta Revealed by Stomach Content and Stable Isotope Analyses. J. Fish Biol. 2012, 80, 2448–2462. [Google Scholar] [CrossRef] [PubMed]
- Schoener, T. Resource Partitioning in Ecological Communities: Research On How Similar Species Divide Resources Helpsreveal the Natural Regulation of Species Diversity. Science 1974, 185, 27–39. [Google Scholar] [CrossRef] [PubMed]
- Svanbäck, R.; Bolnick, D.I. Intraspecific Competition Affects the Strength of Individual Specialization: An Optimal Diet Theory Method. Evol. Ecol. Res. 2005, 7, 993–1012. [Google Scholar]
- Xia, Y.; Li, Y.; Zhu, S.; Li, J.; Li, S.; Li, X. Individual Dietary Specialization Reduces Intraspecific Competition, Rather than Feeding Activity, in Black Amur Bream (Megalobrama terminalis). Sci. Rep. 2020, 10, 17961. [Google Scholar] [CrossRef] [PubMed]
- Sun, D. A Study On Fishery Resources and Sustainable Fishery Development in the Beibu Bay. Master’s Thesis, Ocean University of China, Qingdao, China, 2008. [Google Scholar]
- Su, L.; Chen, Z.; Zhang, K.; Xu, Y.; Qiu, Y. Establishment of Quality Status Evaluation System of Fishery Resourcesin Beibu Gulf Based On Bottom Trawl Survey Data. J. Guangdong Ocean Univ. 2021, 41, 10–16. [Google Scholar]
- Zhang, B.; Yuan, W.; Dai, F. Study On Feeding Ecology of Fish Community in Laoshan Bay During Summer Using Stable Carbon and Nitrogen Isotopes. J. Fish. China 2016, 40, 585–594. [Google Scholar]
- Ji, W.; Chen, X.; Jiang, Y.; Liu, Y.; Hu, F.; Li, S. Stable Isotope Analysis of some Representative Nektonic Organisms in the Central and Northern Part of East China Sea. Mar. Fish. 2011, 33, 241–250. [Google Scholar]
- Gao, Y.; Sui, H.; Ren, X.; Xu, B.; Zhang, C.; Ren, Y.; Xue, Y. Feeding Habits of Saurida elongata in Haizhou Bay, Shandong, China, Based On Stomach Contents and Stable Isotope. Chin. J. Appl. Ecol. 2020, 31, 4277–4283. [Google Scholar]
- Lu, H.; Ou, F.; Yan, Y.; Zhang, J. Study On Trophie Level of Main Fishes in the Leizhou Baywith Stable Nitrogen Isotope Techniques. Acta Ocean. Sin. 2009, 31, 167–174. [Google Scholar]
- Li, Y.; Gao, X.; Wang, L.; Fang, L. Trophic Niche Partitioning of Pelagic Sharks in Central Eastern Pacific Inferred From Stable Isotope Analysis. Chin. J. Appl. Ecol. 2018, 29, 309–313. [Google Scholar]
- Li, Y.; Chen, Z.; Gong, Y.; Chen, X. A Review On the Methods Used in Trophic Niche Studies of Marine Animals and their Applications. J. Trop. Oceanogr. 2021, 40, 143–156. [Google Scholar]
- SVANBÄCK, R.; PERSSON, L. Individual Diet Specialization, Niche Width and Population Dynamics: Implications for Trophic Polymorphisms. J. Anim. Ecol. 2004, 73, 973–982. [Google Scholar] [CrossRef]
- Li, L.; Jin, X.; Ma, B.; Wu, S.; Tang, S. Trophie Niche and Interspecifie Diet Relationship of Gymnocypris in Autumn from Langcuo Lake of Tibet, China. Chin. J. Appl. Ecol. 2020, 31, 4284–4290. [Google Scholar]
- Ge, S.; Zhao, W.; Song, J.; Yu, D.; Liu, Y.; Wang, Q.; Zhou, J. Study On Trophic Niches of Sebastes schlegelii and Hexagrammos otakii in the Artificial Reef Area of Xiaoheishan Island. Acta Ecol. Sin. 2019, 39, 6923–6931. [Google Scholar]
- Abrams, P. Some Comments On Measuring Niche Overlap. Ecology 1980, 61, 44–49. [Google Scholar] [CrossRef]
- Yang, X.; Ma, J. A Review On some Terms Related to Niche and their Measurements. Chin. J. Ecol. 1992, 11, 46–51. [Google Scholar]
- Hurlbert, S.H. The Measurement of Niche Overlap and some Relatives. Ecology 1978, 1, 66–77. [Google Scholar] [CrossRef]
- Yu, Z.; Jin, X.; Li, X. Analysis of Ecological Niche for Major Fish Species in the Central and Southern Yellow Sea. Prog. Fish. Sci. 2010, 31, 1–8. [Google Scholar]
- Nan, C.; Dong, S. A Review On Resource Competition Theory. Chin. J. Ecol. 2003, 22, 36–42. [Google Scholar]
- Svanback, R.; Bolnick, D.I. Intraspecific Competition Drives Increased Resource Use Diversity within a Natural Population. Proc. R. Soc. B Biol. Sci. 2007, 274, 839–844. [Google Scholar] [CrossRef] [PubMed]


| Species | Number of Sample | |||
|---|---|---|---|---|
| Spring | Summer | Autumn | Winter | |
| P. pawak | 417 | 226 | 579 | 284 |
| P. anea | 317 | 241 | 788 | 388 |
| P. anea | 71–90 | 91–110 | 111–130 | 131–150 | 151–170 | 171–190 | |
|---|---|---|---|---|---|---|---|
| P. pawak | |||||||
| 71–90 | 0.82 | 0.66 | 0.68 | 0.61 | 0.93 | ||
| 91–110 | 0.99 | 0.88 | 0.83 | 0.77 | 0.63 | ||
| 111–130 | 0.99 | 0.99 | 0.84 | 0.87 | 0.38 | ||
| 131–150 | 0.83 | 0.85 | 0.88 | 0.91 | 0.55 | ||
| 151–170 | 0.78 | 0.80 | 0.84 | 0.98 | 0.40 | ||
| 171–190 | 0.59 | 0.61 | 0.65 | 0.89 | 0.90 | ||
| Prey | P. pawak | P. anea | ||||||
|---|---|---|---|---|---|---|---|---|
| Science Name | W% | N% | F% | IRI% | W% | N% | F% | IRI% |
| Pisces | ||||||||
| Leiognathidae | 0.46 | 0.22 | 0.56 | 0.02 | 0.42 | 0.92 | 3.86 | 0.03 |
| Trichiuridae | 0.87 | 0.88 | 2.22 | 0.18 | 0.47 | 0.23 | 0.97 | + |
| Thrissa dussumieri | 2.90 | 0.44 | 1.11 | 0.17 | 3.02 | 0.69 | 2.90 | 0.07 |
| Champsodon atridorsalis | 0.35 | 0.66 | 1.67 | 0.08 | 0.10 | 0.12 | 0.48 | + |
| Photopectoralis bindus | 1.98 | 2.84 | 7.22 | 1.60 | 1.09 | 0.69 | 2.90 | 0.03 |
| Stolephorus heterolobas | 0.66 | 0.44 | 1.11 | 0.06 | 0.23 | 0.12 | 0.48 | + |
| Secutor ruconius | 0.23 | 0.22 | 0.56 | 0.01 | 0.83 | 0.35 | 1.45 | 0.01 |
| Bregmaceros rarisquamosus | 1.54 | 6.35 | 16.11 | 5.82 | 8.07 | 23.44 | 98.07 | 19.14 |
| Apogonidae | 4.52 | 6.13 | 15.56 | 7.60 | 0.21 | 0.12 | 0.48 | + |
| Bregmaceros | 3.25 | 7.88 | 20.00 | 10.20 | 9.07 | 28.52 | 119.32 | 27.79 |
| Gobiidae | 2.44 | 3.50 | 8.89 | 2.42 | 0.05 | 0.12 | 0.48 | + |
| Atherinidae | 0.33 | 0.22 | 0.56 | 0.01 | 1.55 | 0.46 | 1.93 | 0.02 |
| Bregmaceros nectabanus | 3.08 | 3.94 | 10.00 | 3.22 | 6.20 | 7.51 | 31.40 | 2.67 |
| Stolephorus indicus | 0.23 | 0.22 | 0.56 | 0.01 | 1.26 | 0.35 | 1.45 | 0.01 |
| Stolephorus | 2.75 | 2.41 | 6.11 | 1.45 | 47.16 | 26.10 | 109.18 | 49.55 |
| Champsodon | 0.63 | 0.88 | 2.22 | 0.15 | - | - | - | - |
| Jaydia striata | 0.11 | 0.22 | 0.56 | 0.01 | - | - | - | - |
| Trypauchen vagina | 0.94 | 0.66 | 1.67 | 0.12 | - | - | - | - |
| Thryssa | 0.21 | 0.22 | 0.56 | 0.01 | - | - | - | - |
| Bregmaceros macclellandii | 0.59 | 0.22 | 0.56 | 0.02 | - | - | - | - |
| Diaphus knappi | 0.11 | 0.22 | 0.56 | 0.01 | - | - | - | - |
| Parachaeturichthys polynema | 2.56 | 1.53 | 3.89 | 0.73 | - | - | - | - |
| Carangidae | 0.54 | 0.22 | 0.56 | 0.02 | - | - | - | - |
| Leiognathus berbis | 0.67 | 0.22 | 0.56 | 0.02 | - | - | - | - |
| Sirembo imberbis | 0.22 | 0.22 | 0.56 | 0.01 | - | - | - | - |
| Callionymus octostigmatus | 1.15 | 0.22 | 0.56 | 0.03 | - | - | - | - |
| Sirembo | 0.04 | 0.22 | 0.56 | 0.01 | - | - | - | - |
| Hypoatherina valenciennei | - | - | - | - | 0.64 | 0.12 | 0.48 | + |
| Leiognathus nuchalis | - | - | - | - | 0.08 | 0.12 | 0.48 | + |
| Stolephorus commersonnii | - | - | - | - | 4.59 | 1.62 | 6.76 | 0.26 |
| Stolephorus zollingeri | - | - | - | - | 0.60 | 0.23 | 0.97 | + |
| Sardinella | - | - | - | - | 6.18 | 0.92 | 3.86 | 0.17 |
| Stolephorus chinensis | - | - | - | - | 0.56 | 0.35 | 1.45 | 0.01 |
| Macrura | ||||||||
| Alpheus | 5.16 | 16.19 | 41.11 | 40.26 | 1.05 | 1.50 | 6.28 | 0.10 |
| Metapenaeopsis palmensis | 0.85 | 1.09 | 2.78 | 0.25 | 0.48 | 0.23 | 0.97 | + |
| Alpheus bisincisus | 3.57 | 5.47 | 13.89 | 5.76 | 0.70 | 0.35 | 1.45 | 0.01 |
| Metapenaeopsis barbata | 9.47 | 7.00 | 17.78 | 13.43 | 0.52 | 0.12 | 0.48 | - |
| Solenocera crassicornis | 2.55 | 1.75 | 4.44 | 0.88 | 0.46 | 0.12 | 0.48 | - |
| Metapenaeopsis | 0.70 | 1.31 | 3.33 | 0.31 | - | - | - | - |
| Alpheus brevicristatus | 0.84 | 1.31 | 3.33 | 0.33 | - | - | - | - |
| Penaeidae | 1.59 | 1.31 | 3.33 | 0.44 | - | - | - | - |
| Parapenaeopsis | 0.10 | 0.44 | 1.11 | 0.03 | - | - | - | - |
| Parapenaeopsis | 0.51 | 0.22 | 0.56 | 0.02 | - | - | - | - |
| Metapenaeopsis acclivis | 0.56 | 0.22 | 0.56 | 0.02 | - | - | - | - |
| Parapenaeus sextuberculatus | 0.43 | 0.44 | 1.11 | 0.04 | - | - | - | - |
| Parapenaeus | 0.17 | 0.22 | 0.56 | 0.01 | - | - | - | - |
| Alpheus japonicus | 0.22 | 0.44 | 1.11 | 0.03 | - | - | - | - |
| Alpheus distinguendus | 1.21 | 1.75 | 4.44 | 0.60 | - | - | - | - |
| Metapenaeus | 0.06 | 0.22 | 0.56 | 0.01 | - | - | - | - |
| Trachypenaeus curvirostris | 0.26 | 0.44 | 1.11 | 0.04 | - | - | - | - |
| Palaemonidae | 0.03 | 0.22 | 0.56 | 0.01 | - | - | - | - |
| Miyadiella podophthalmus | 0.02 | 0.44 | 1.11 | 0.02 | - | - | - | - |
| Parapenaeus longipes | 0.68 | 0.88 | 2.22 | 0.16 | - | - | - | |
| Parapenaeopsis cornuta | - | - | - | - | 0.54 | 0.46 | 1.93 | 0.01 |
| Trachypenaeus pescadoreensis | - | - | - | - | 0.52 | 0.12 | 0.48 | + |
| Parapenaeopsis incisa | - | - | - | - | 0.21 | 0.23 | 0.97 | + |
| Brachyura | ||||||||
| Portunus | 0.18 | 1.31 | 3.33 | 0.23 | 0.03 | 0.12 | 0.48 | - |
| Eucrate alcocki | 0.06 | 0.22 | 0.56 | 0.01 | - | - | - | - |
| Typhlocarcinops canaliculata | 0.05 | 0.22 | 0.56 | 0.01 | - | - | - | - |
| Charybdis hellerii | 0.21 | 0.44 | 1.11 | 0.03 | - | - | - | - |
| Charybdis variegata brevispinosa | 0.55 | 0.66 | 1.67 | 0.09 | - | - | - | - |
| Lissocarcinus laevis | 0.03 | 0.22 | 0.56 | 0.01 | - | - | - | - |
| Portunus hastatoides | 0.58 | 2.19 | 5.56 | 0.70 | - | - | - | - |
| Jonas | 0.04 | 0.22 | 0.56 | 0.01 | - | - | - | - |
| Eucrate solaris | 0.12 | 0.22 | 0.56 | 0.01 | - | - | - | - |
| Charybdis | 0.25 | 0.88 | 2.22 | 0.11 | - | - | - | - |
| Petrolisthes | 0.05 | 0.22 | 0.56 | 0.01 | - | - | - | - |
| Portunus argentatus | 1.43 | 2.41 | 6.11 | 1.07 | - | - | - | - |
| Charybdis truncata | 0.07 | 0.22 | 0.56 | 0.01 | - | - | - | - |
| Carcinoplax purpurea | 0.10 | 0.22 | 0.56 | 0.01 | - | - | - | - |
| Charybdis vadorum | 0.06 | 0.22 | 0.56 | 0.01 | - | - | - | - |
| Charybdis variegata | 0.10 | 0.44 | 1.11 | 0.03 | - | - | - | - |
| Typhlocarcinus villosusStimpson | - | - | - | - | 0.03 | 0.12 | 0.48 | - |
| Stomatopoda | ||||||||
| Gryllotalpidae | 0.16 | 0.22 | 0.56 | 0.01 | 0.09 | 0.12 | 0.48 | + |
| Oratosquillina interrupta | 0.48 | 0.44 | 1.11 | 0.05 | - | - | - | - |
| Oratosquilla oratoria | 0.35 | 0.44 | 1.11 | 0.04 | - | - | - | - |
| Anchisquilla fasciata | 0.16 | 0.22 | 0.56 | 0.01 | - | - | - | - |
| Oratosquillina | 0.28 | 0.44 | 1.11 | 0.04 | - | - | - | - |
| kempina stridulans | 0.77 | 0.66 | 1.67 | 0.11 | - | - | - | - |
| Squillidae | - | - | - | - | 0.23 | 0.92 | 3.86 | 0.03 |
| Cephalopoda | ||||||||
| Cephalopoda | 0.17 | 1.53 | 3.89 | 0.30 | 2.00 | 0.69 | 2.90 | 0.05 |
| Isopoda | ||||||||
| isopoda | 0.15 | 0.88 | 2.22 | 0.10 | 0.04 | 0.23 | 0.97 | + |
| Gastropoda | ||||||||
| Turritella terebra | 0.32 | 1.53 | 3.89 | 0.33 | - | - | - | - |
| Polychaeta | ||||||||
| Nereis | 0.14 | 0.22 | 0.56 | 0.01 | - | - | - | - |
| Sipunculs nudus | 0.23 | 0.44 | 1.11 | 0.03 | - | - | - | - |
| Species | CD | CR | NR | MNND | SDNND | SEAc | TA | Overlap Index |
|---|---|---|---|---|---|---|---|---|
| P. pawak | 0.59 | 2.86 | 1.72 | 0.09 | 0.09 | 0.65 | 3.70 | 0.29 |
| P. anea | 0.76 | 3.02 | 3.32 | 0.13 | 0.15 | 1.16 | 6.09 |
| Total | Before SCS | After SCS | ||
|---|---|---|---|---|
| Spatial niche width | P. pawak | 1.19 | 0.10 | 1.22 |
| P. anea | 0.58 | 0.85 | 0.50 | |
| Overlap index | 0.20 | 0.16 | 0.13 |
Disclaimer/Publisher’s Note: The statements, opinions and data contained in all publications are solely those of the individual author(s) and contributor(s) and not of MDPI and/or the editor(s). MDPI and/or the editor(s) disclaim responsibility for any injury to people or property resulting from any ideas, methods, instructions or products referred to in the content. |
© 2024 by the authors. Licensee MDPI, Basel, Switzerland. This article is an open access article distributed under the terms and conditions of the Creative Commons Attribution (CC BY) license (https://creativecommons.org/licenses/by/4.0/).
Share and Cite
Luo, K.; Yang, X.; Zhou, Y.; Yi, X.; Zhao, C.; Wang, J.; He, X.; Yan, Y. The Sympatric Coexistence Mechanism: A Case Study of Two Penahia Species in the Beibu Gulf, South China Sea. Animals 2024, 14, 849. https://doi.org/10.3390/ani14060849
Luo K, Yang X, Zhou Y, Yi X, Zhao C, Wang J, He X, Yan Y. The Sympatric Coexistence Mechanism: A Case Study of Two Penahia Species in the Beibu Gulf, South China Sea. Animals. 2024; 14(6):849. https://doi.org/10.3390/ani14060849
Chicago/Turabian StyleLuo, Konglan, Xiaodong Yang, Yan Zhou, Xiaoying Yi, Chunxu Zhao, Jinxi Wang, Xiongbo He, and Yunrong Yan. 2024. "The Sympatric Coexistence Mechanism: A Case Study of Two Penahia Species in the Beibu Gulf, South China Sea" Animals 14, no. 6: 849. https://doi.org/10.3390/ani14060849
APA StyleLuo, K., Yang, X., Zhou, Y., Yi, X., Zhao, C., Wang, J., He, X., & Yan, Y. (2024). The Sympatric Coexistence Mechanism: A Case Study of Two Penahia Species in the Beibu Gulf, South China Sea. Animals, 14(6), 849. https://doi.org/10.3390/ani14060849