
Natural Patterns in the Dawn and Dusk Choruses of a Neotropical Songbird in Relation to an Urban Sound Environment
Abstract
Simple Summary
Abstract
1. Introduction
2. Materials and Methods
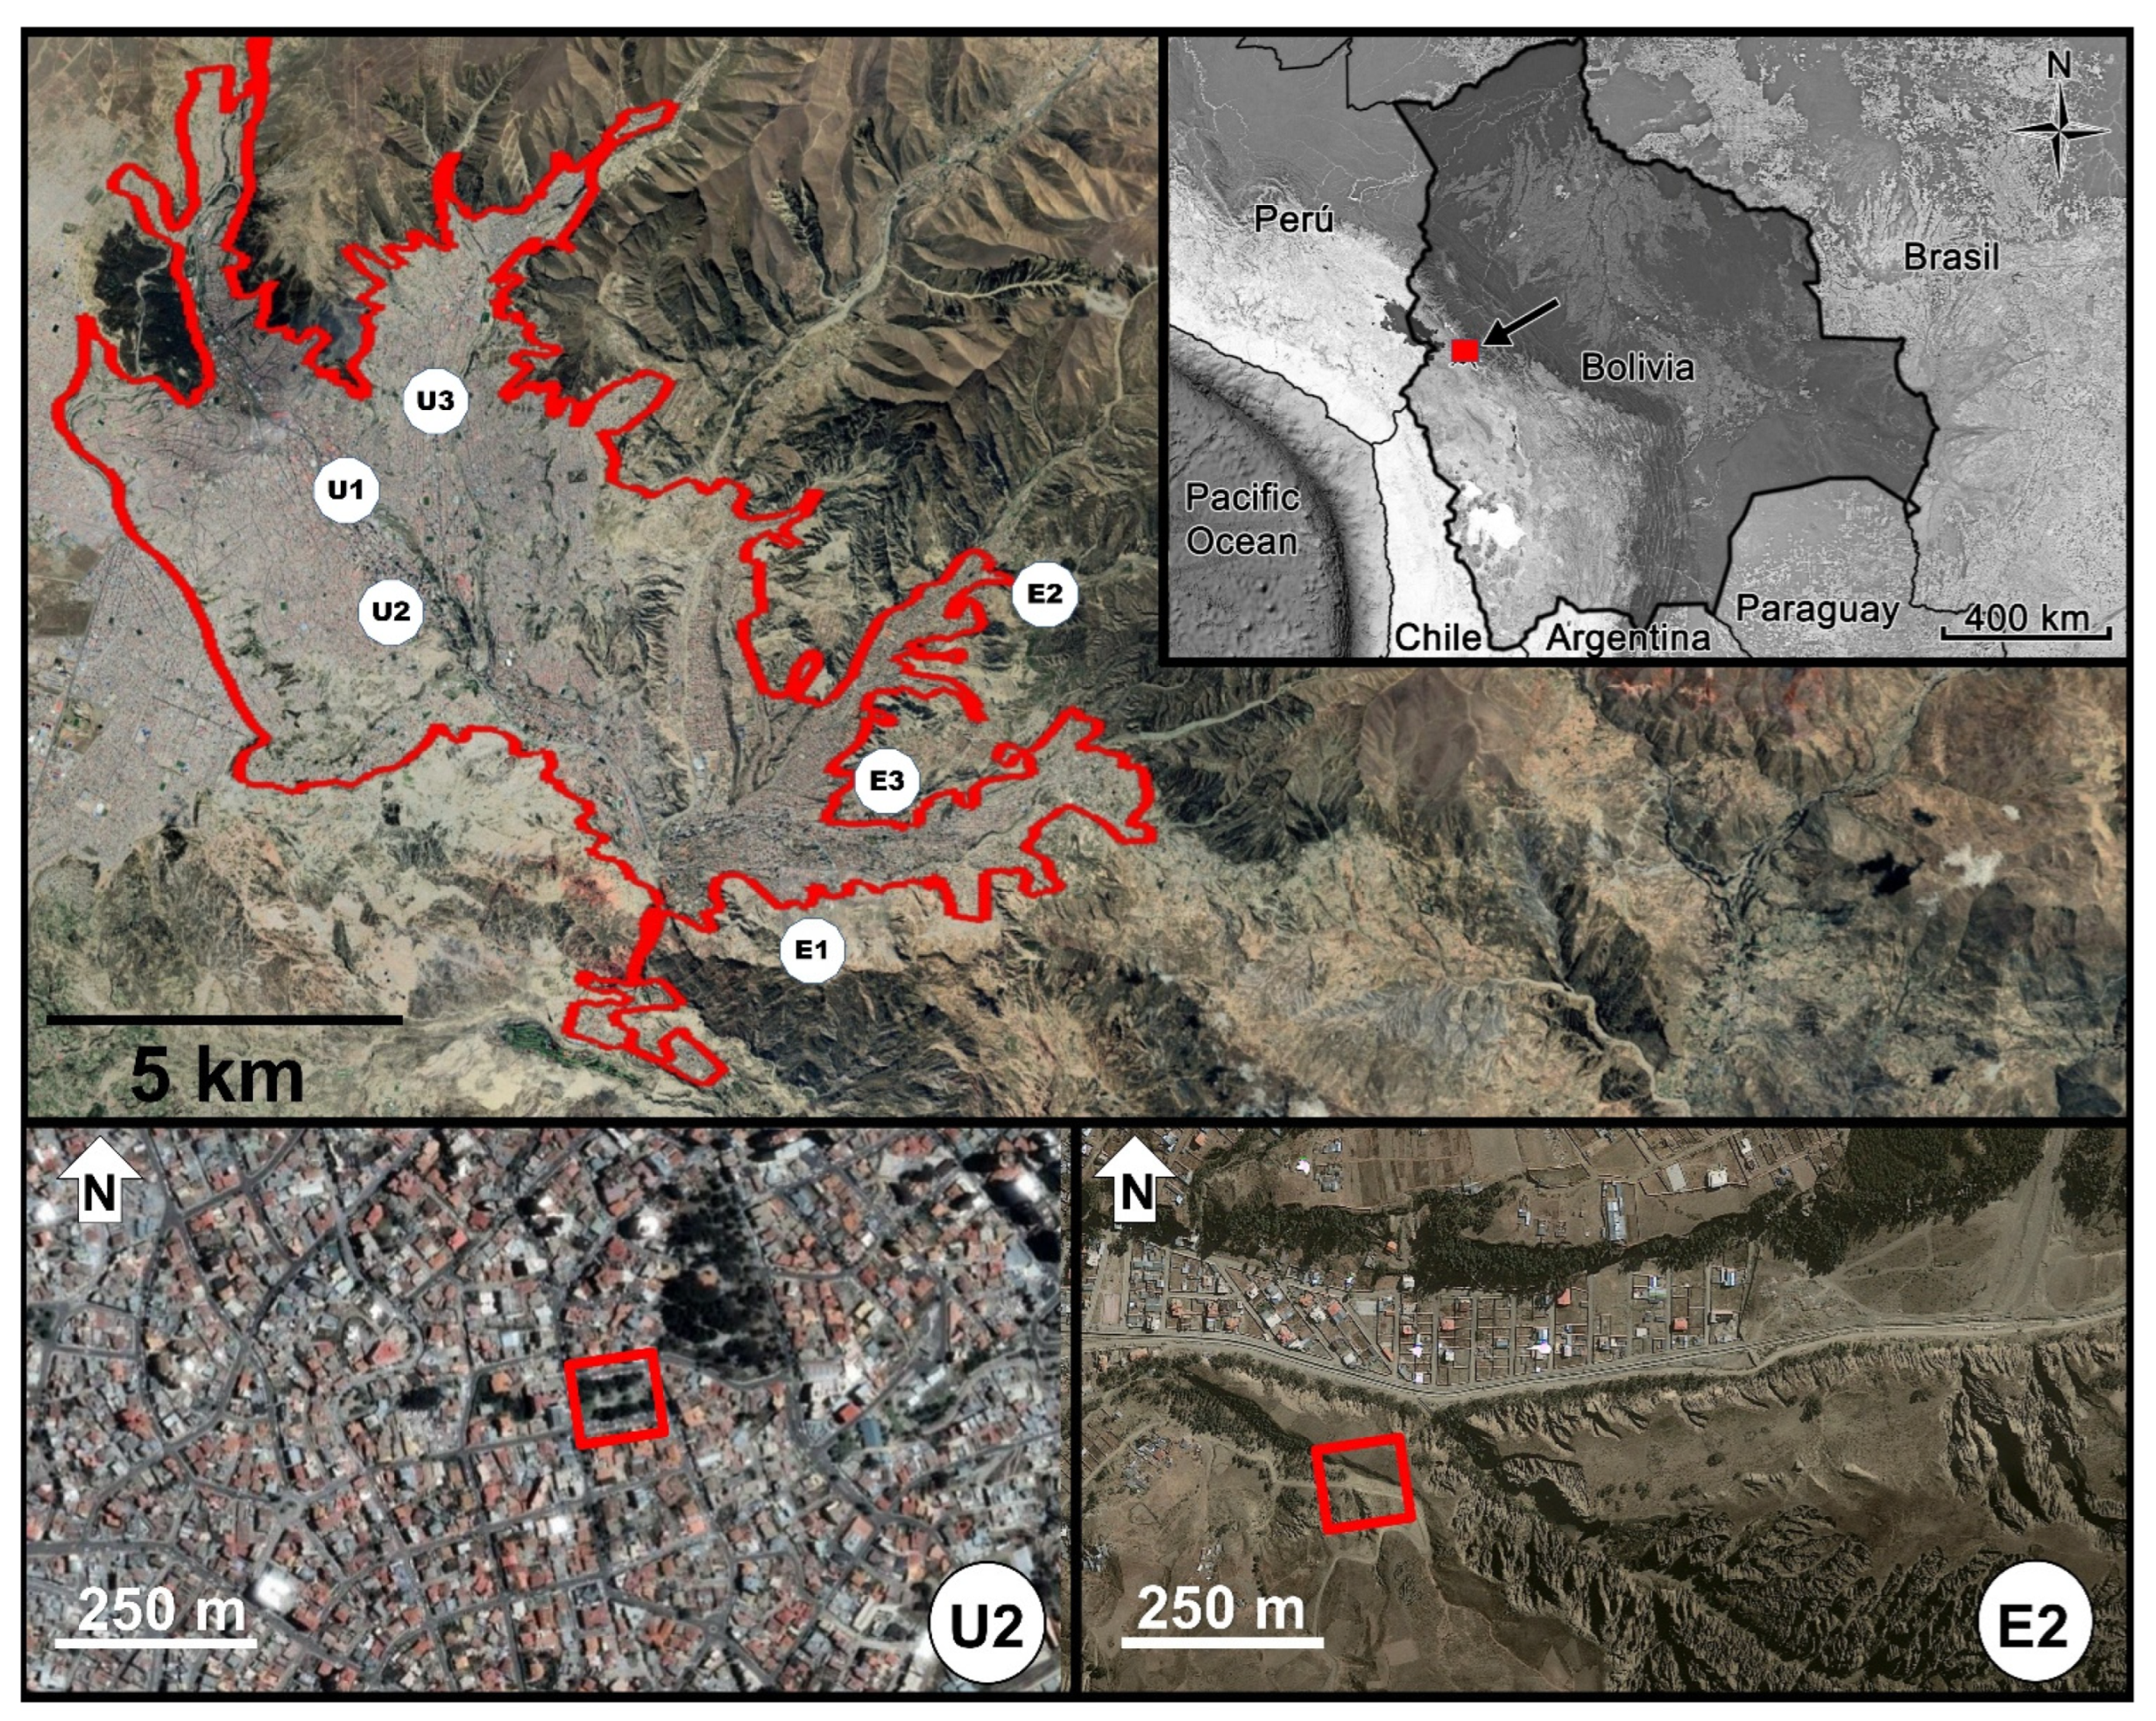
2.1. Study Area
2.2. Spatial and Temporal Design
2.3. Obtaining Song Sound Parameters and Environmental Sound Pressure Level
2.4. Analysis of Sound Parameters of the Song
2.5. Data Analysis
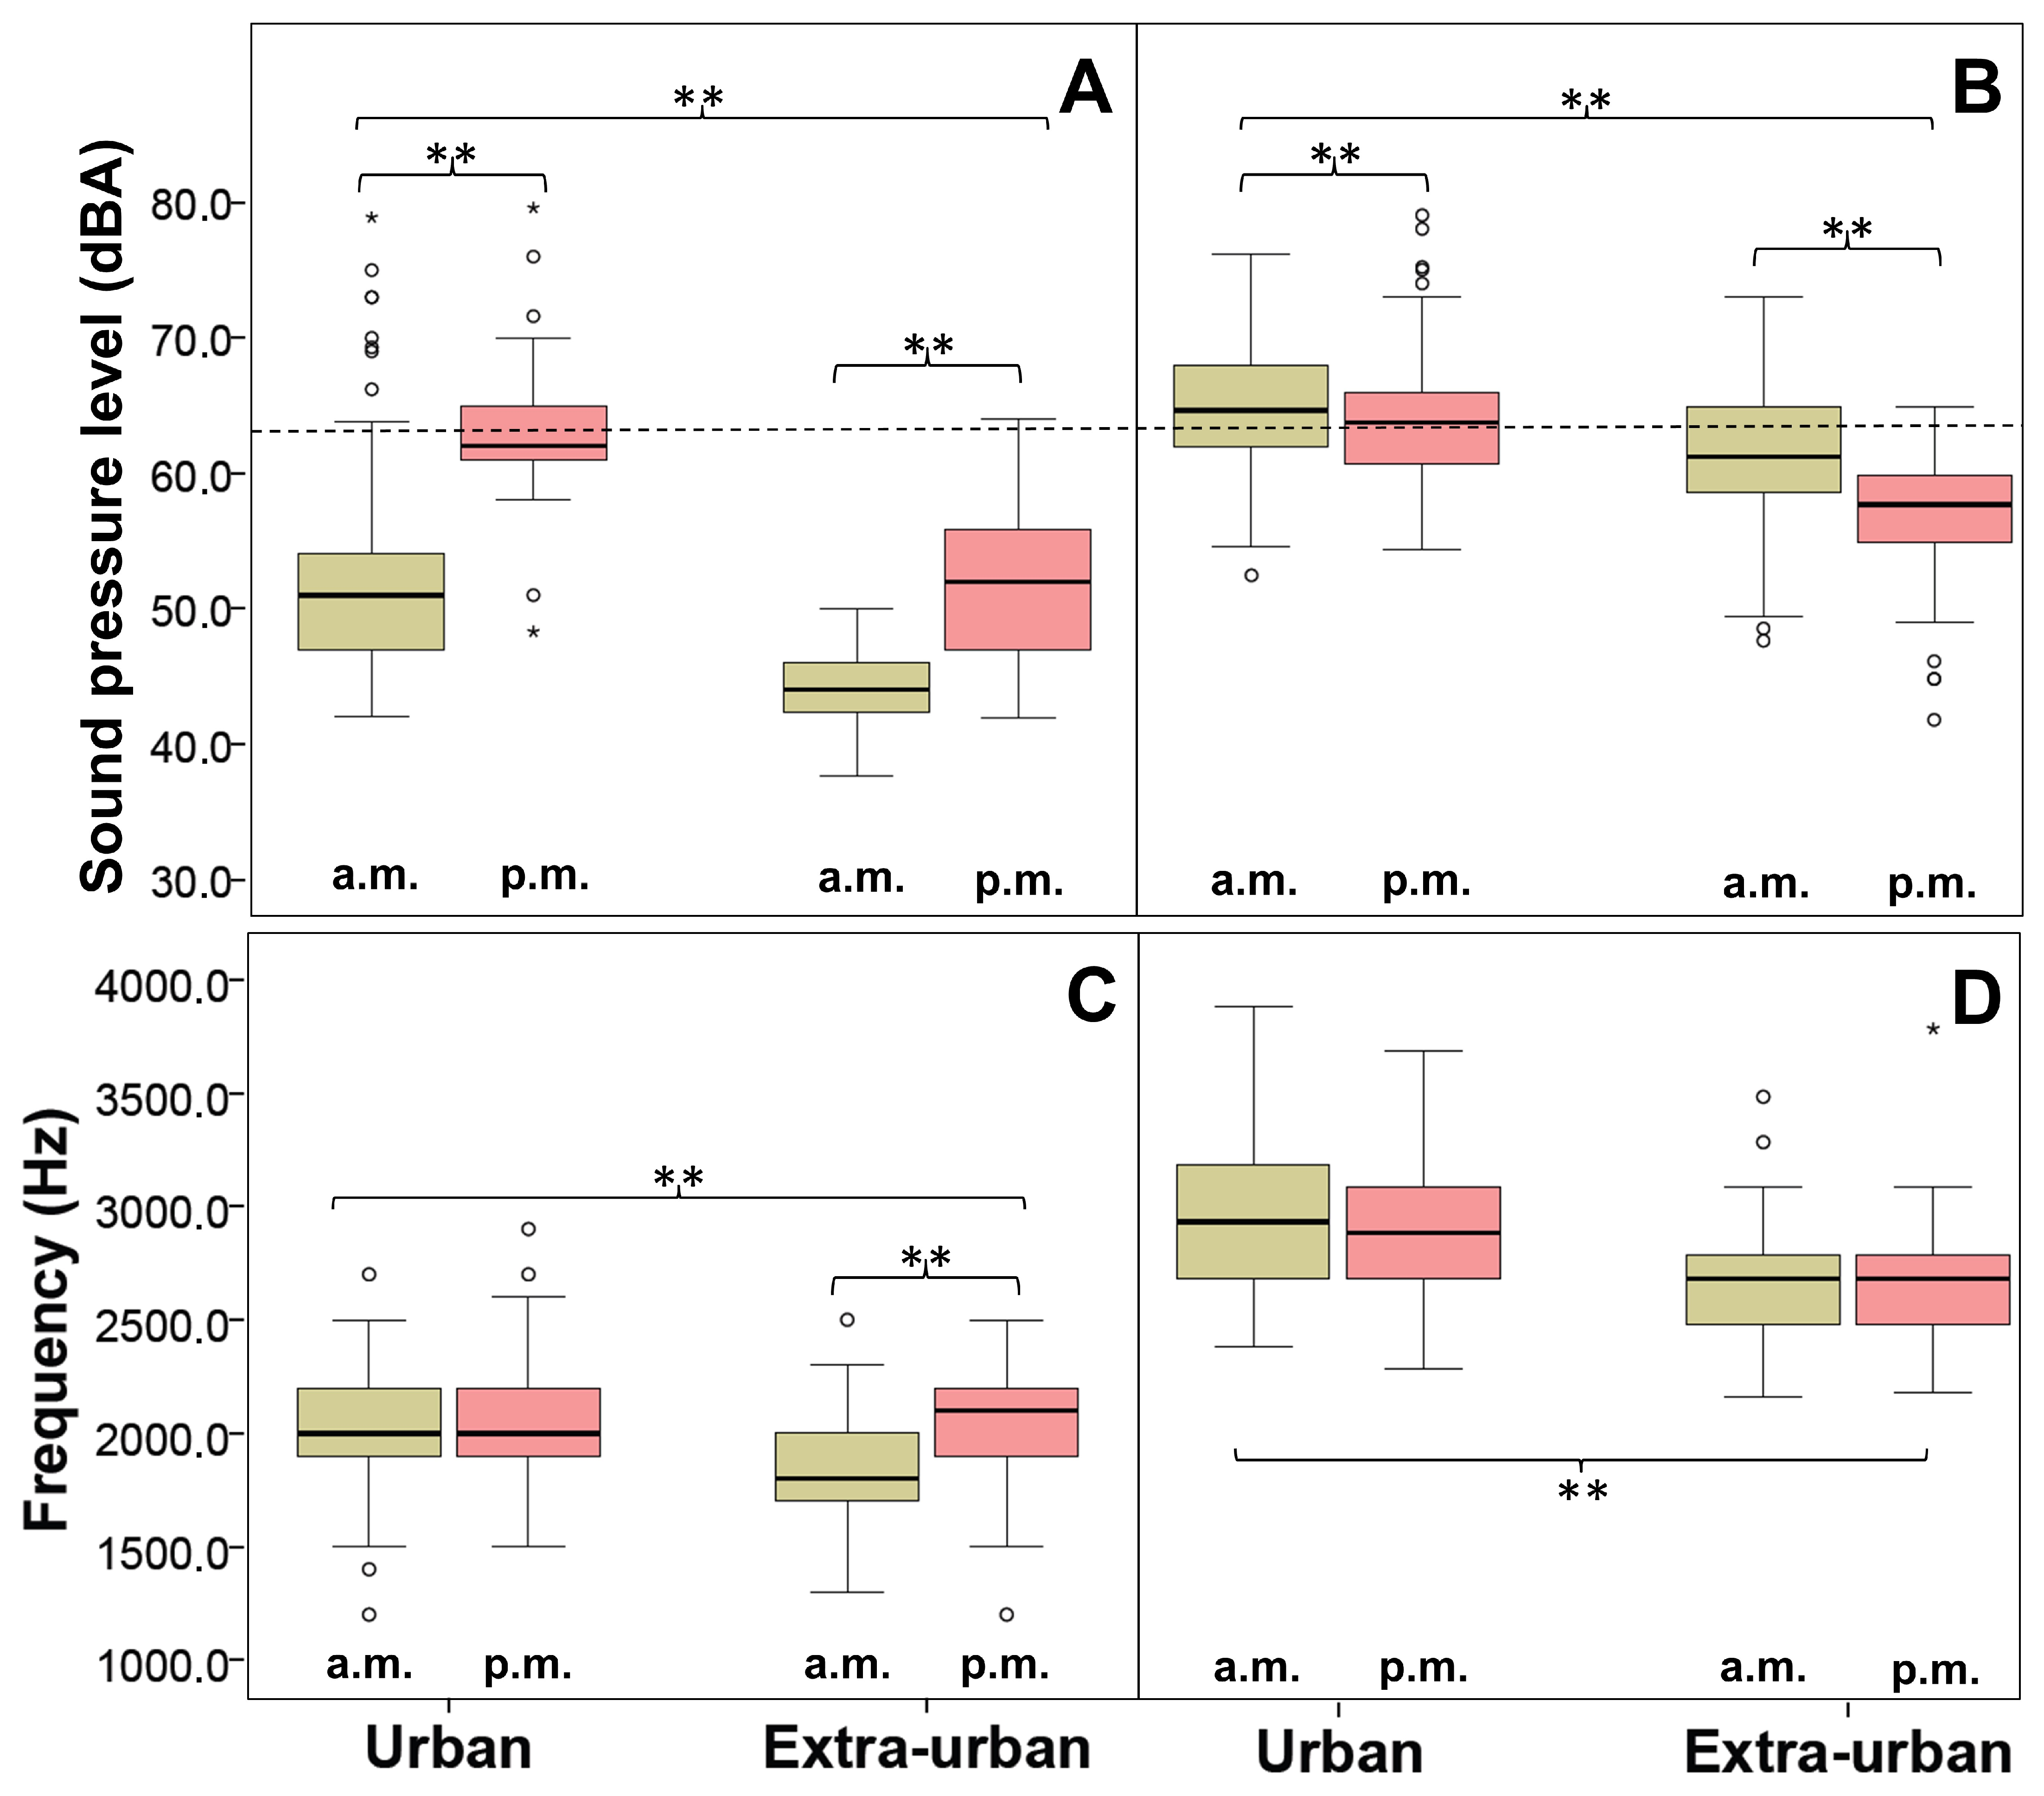
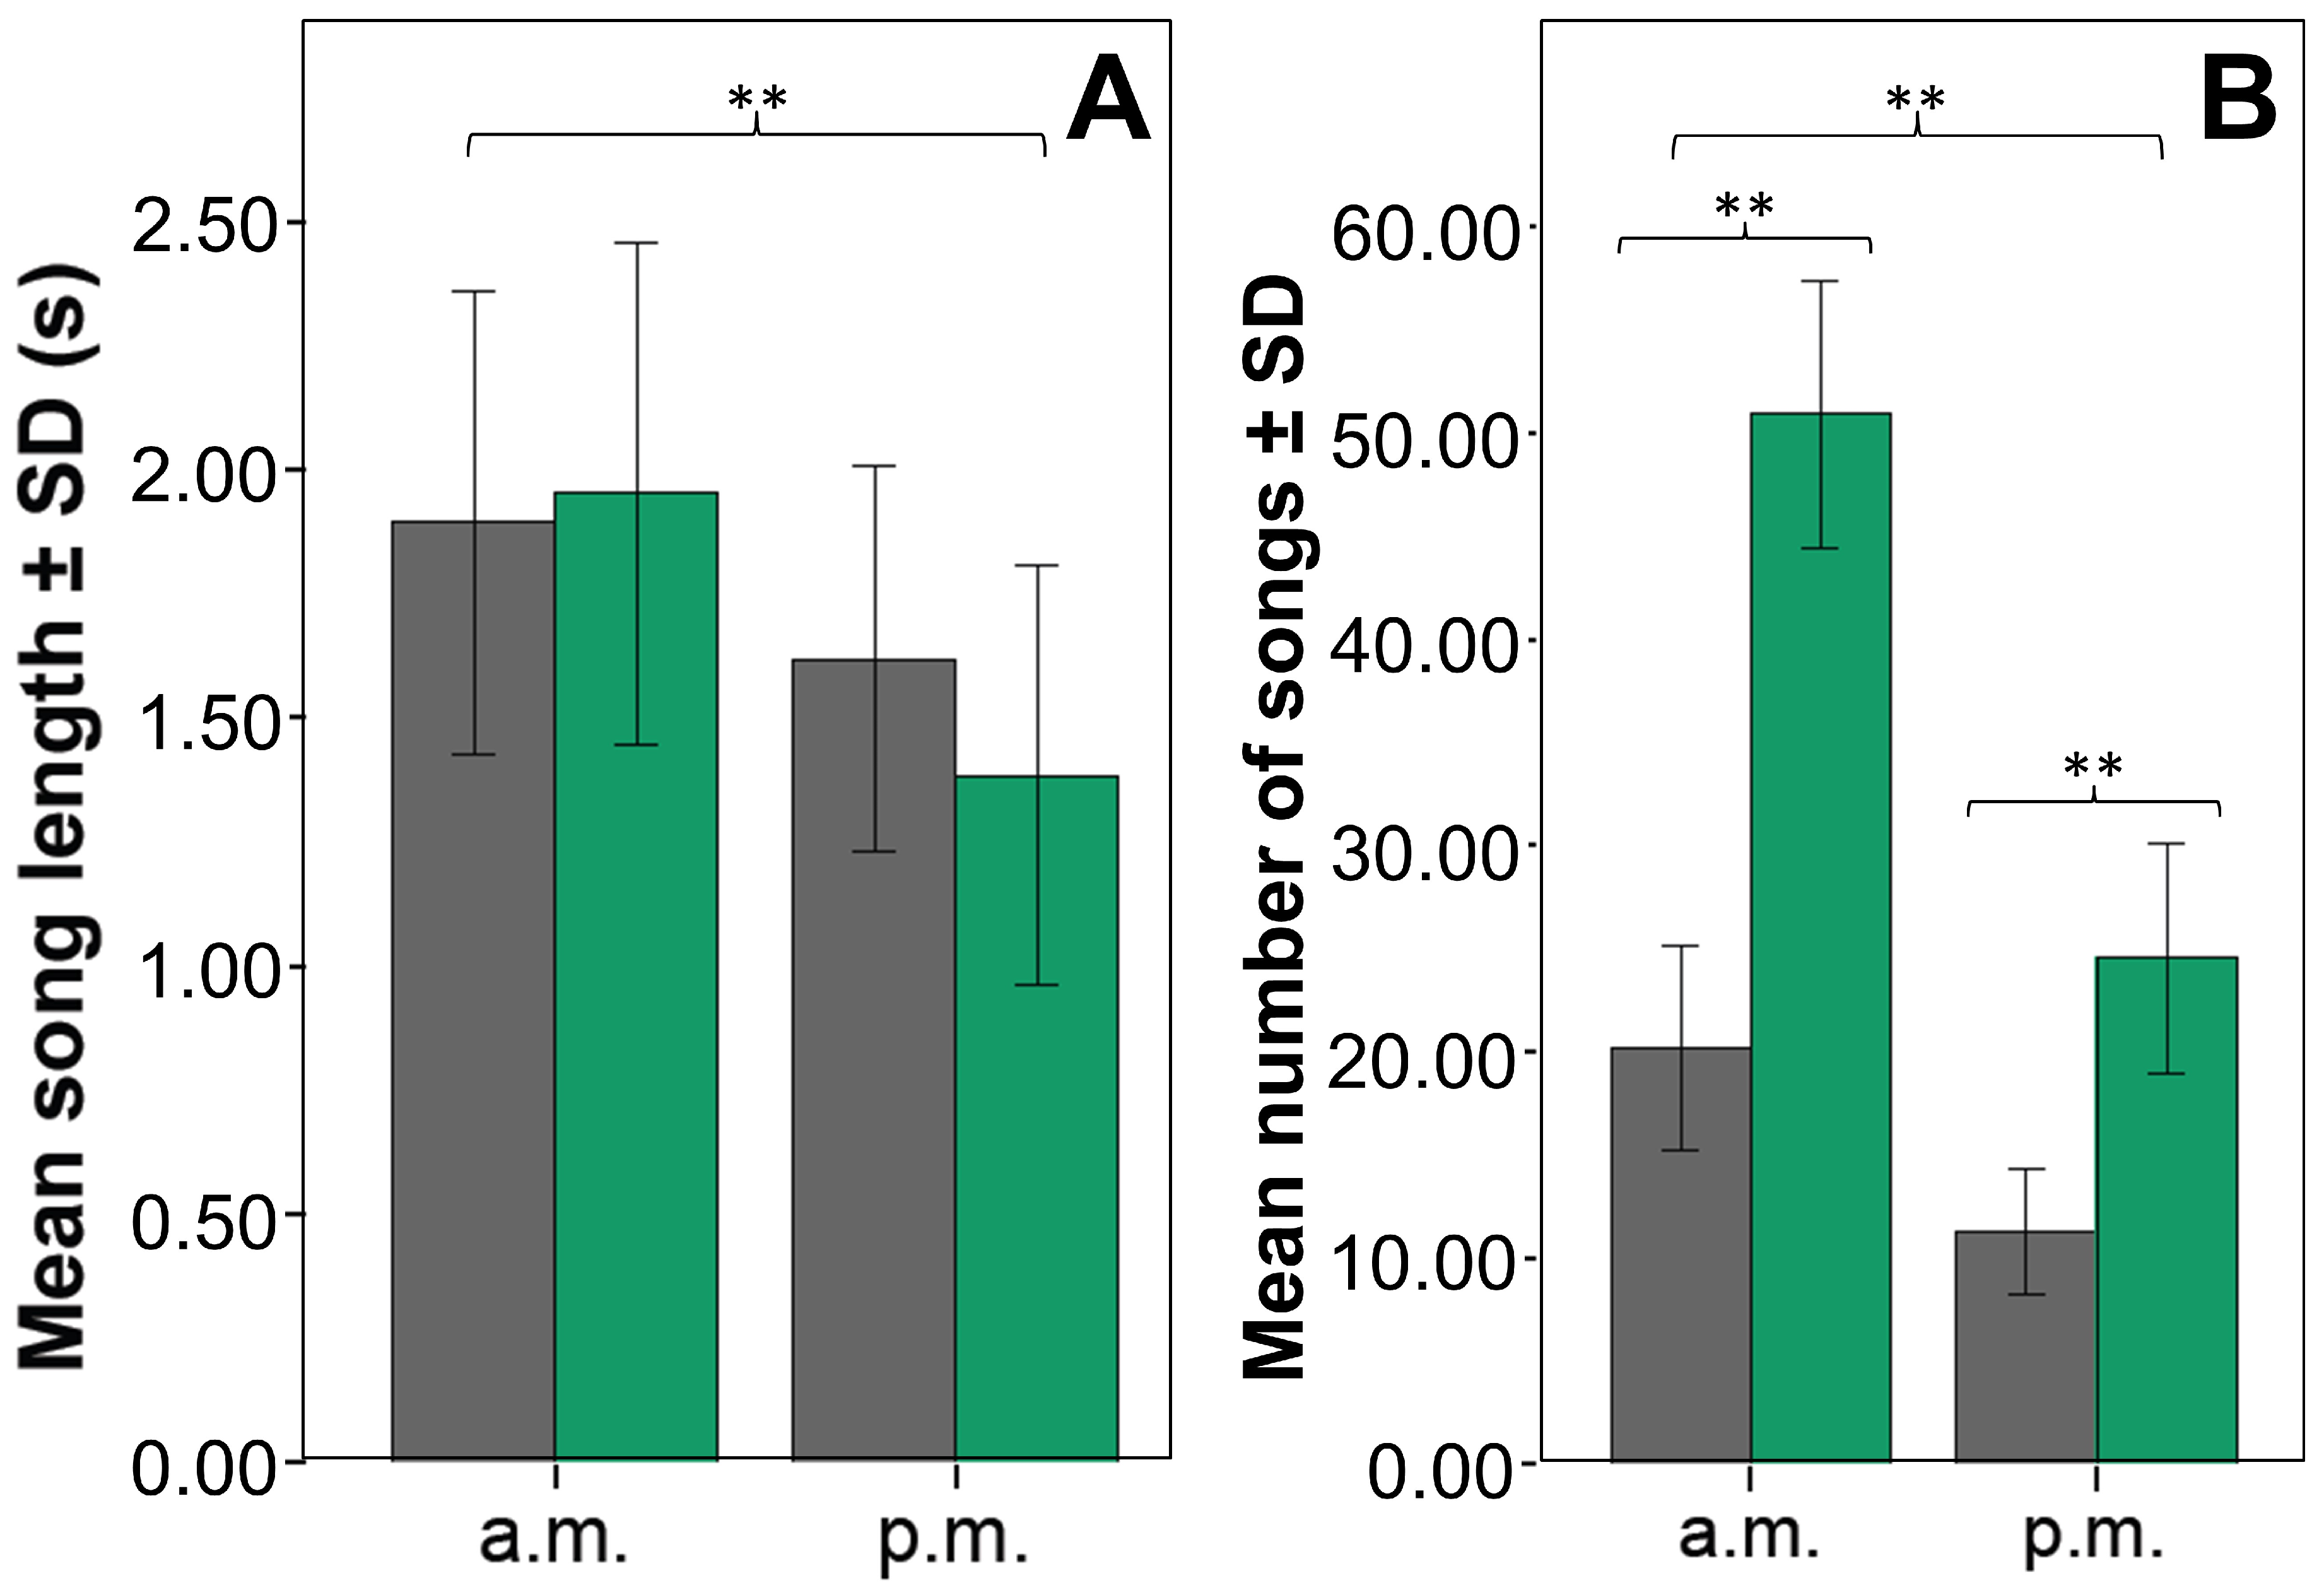
3. Results
4. Discussion
4.1. There Are Natural Variations in Song Parameters between Dawn and Dusk Choruses in the Chiguanco Thrush
4.2. The Chiguanco Thrushes Respond to Urban Noise by Increasing the Frequency and Amplitude of Their Songs in Dawn and Dusk Choruses
4.3. Acoustic Communication Responses to Urbanization Are Likely to Represent Serious Tradeoffs for Urban Chiguanco Thrush Individuals
5. Conclusions
Supplementary Materials
Author Contributions
Funding
Institutional Review Board Statement
Informed Consent Statement
Data Availability Statement
Acknowledgments
Conflicts of Interest
References
- Alberti, M. Cities of the Anthropocene: Urban sustainability in an eco-evolutionary perspective. Philos. Trans. Roy. Soc. B 2023, 379, 20220264. [Google Scholar] [CrossRef]
- Luck, G.W.; Smallbone, L.T. Species diversity and urbanisation: Patterns, drivers and implications. In Urban Ecology; Gaston, K.J., Ed.; Cambridge University Press: New York, NY, USA, 2010; pp. 88–119. [Google Scholar]
- Faeth, S.H.; Bang, C.; Saari, S. Urban biodiversity: Patterns and mechanisms. Ann. N. Y. Acad. Sci. 2011, 1223, 69–81. [Google Scholar] [CrossRef]
- Swan, C.M.; Brown, B.; Borowy, D.; Cavender-Bares, J.; Jeliazkov, A.; Knapp, S.; Lososovà, Z.; Padullés Cubino, J.; Pavoine, S.; Rocotta, C.; et al. A framework for understanding how biodiversity patterns unfold across multiple spatial scales in urban ecosystems. Ecosphere 2021, 12, e03650. [Google Scholar] [CrossRef]
- Richardson, J.; Lees, A.C.; Miller, E.T.; Marsden, S.J. Avian diversity and function across the world’s most populous cities. Ecol. Lett. 2023, 26, 1301–1313. [Google Scholar] [CrossRef] [PubMed]
- Aronson, M.F.J.; Nilon, C.H.; Lepczyk, C.A.; Parker, T.S.; Warren, P.S.; Cilliers, S.S.; Goddard, M.A.; Hahs, A.K.; Herzog, C.; Katti, M.; et al. Hierarchical filters determine community assembly of urban species pools. Ecology 2016, 97, 2952–2963. [Google Scholar] [CrossRef]
- Lepczyk, C.A.; La Sorte, F.A.; Aronson, M.F.; Goddard, M.A.; MacGregor-Fors, I.; Nilon, C.H.; Warren, P.S. Global patterns and drivers of urban bird diversity. In Ecology and Conservation of Birds in Urban Environments; Murgui, E., Hedblom, M., Eds.; Springer: Cham, Switzerland, 2017; pp. 13–33. [Google Scholar] [CrossRef]
- Cardoso, G.C.; Hu, Y.; Francis, C.D. The comparative evidence for urban species sorting by anthropogenic noise. Roy. Soc. Open Sci. 2018, 5, 172059. [Google Scholar] [CrossRef]
- Morelli, F.; Tryjanowski, P.; Ibáñez-Álamo, J.D.; Díaz, M.; Suhonen, J.; Møller, A.P.; Prosek, J.; Moravec, D.; Bussière, R.; Mägi, M.; et al. Effects of light and noise pollution on avian communities of European cities are correlated with the species’ diet. Sci. Rep. 2023, 13, 4361. [Google Scholar] [CrossRef] [PubMed]
- Neate-Clegg, M.H.; Tonelli, B.A.; Youngflesh, C.; Wu, J.X.; Montgomery, G.A.; Şekercioğlu, Ç.H.; Tingley, M.W. Traits shaping urban tolerance in birds differ around the world. Curr. Biol. 2023, 33, 1677–1688. [Google Scholar] [CrossRef]
- Sol, D.; Lapiedra, O.; Gonález-Lagos, C. Behavioural flexibility for a life in the city. Anim. Behav. 2013, 85, 1101–1112. [Google Scholar] [CrossRef]
- Alberti, M.; Correa, C.; Marzluff, J.M.; Hendry, A.P.; Palkovacs, E.P.; Gotanda, K.M.; Hunt, V.M.; Apgar, T.M.; Zhou, Y. Global urban signatures of phenotypic change in animal and plan populations. Proc. Natl. Acad. Sci. USA 2017, 114, 8951–8956. [Google Scholar] [CrossRef] [PubMed]
- Caspi, T.; Johnson, J.R.; Lambert, M.R.; Schell, C.J.; Sih, A. Behavioral plasticity can facilitate evolution in urban environments. Trends Ecol. Evol. 2022, 37, 1092–1103. [Google Scholar] [CrossRef]
- Slabbekoorn, H. Songs of the city: Noise-dependent spectral plasticity in the acoustic phenotype of urban birds. Anim. Behav. 2013, 85, 1089–1099. [Google Scholar] [CrossRef]
- Nemeth, E.; Pieretti, N.; Zollinger, S.A.; Geberzahn, N.; Partecke, J.; Miranda, A.C.; Brumm, H. Bird song and anthropogenic noise: Vocal constraints may explain why birds sing higher-frequency songs in cities. Proc. R. Soc. B Biol. Sci. 2013, 280, 20122798. [Google Scholar] [CrossRef] [PubMed]
- Reichard, D.G.; Atwell, J.W.; Pandit, M.M.; Cardoso, G.C.; Price, T.D.; Ketterson, E.D. Urban birdsongs: Higher minimum song frequency of an urban colonist persists in a common garden experiment. Anim. Behav. 2020, 170, 33–41. [Google Scholar] [CrossRef]
- Derryberry, E.P.; Luther, D. What is known—And not known—About acoustic communication in an urban soundscape. Integr. Comp. Biol. 2021, 61, 1783–1794. [Google Scholar] [CrossRef] [PubMed]
- Evans, K.L.; Hatchwell, B.J.; Parnell, M.; Gaston, K.J. A conceptual framework for the colonization of urban areas: The blackbird Turdus merula as a case study. Biol. Rev. 2010, 85, 643–667. [Google Scholar] [CrossRef] [PubMed]
- Hu, Y.; Cardoso, G.C. Which birds adjust the frequency of vocalizations in urban noise? Anim. Behav. 2010, 79, 863–867. [Google Scholar] [CrossRef]
- Halfwerk, W.; Lohr, B.; Slabbekoorn, H. Impact of man-made sound on birds and their songs. In Effects of Anthropogenic Noise on Animals; Slabbekoorn, H., Dooling, R.J., Popper, A.N., Fay, R.R., Eds.; Springer: New York, NY, USA, 2018; pp. 209–242. [Google Scholar]
- Brumm, H.; Zollinger, S.A. Avian vocal production in noise. In Animal Communication and Noise; Brumm, H., Ed.; Springer: Berlin/Heidelberg, Germany, 2013; pp. 187–227. [Google Scholar] [CrossRef]
- Brewer, D.E.; Fudickar, A.M. A preliminary comparison of a songbird’s song repertoire size and other song measures between an urban and a rural site. Ecol. Evol. 2022, 12, e8602. [Google Scholar] [CrossRef]
- Nemeth, E.; Brumm, H. Birds and anthropogenic noise: Are urban songs adaptive? Am. Nat. 2010, 176, 465–475. [Google Scholar] [CrossRef]
- Cardoso, G.C.; Atwell, J.W. On the relation between loudness and the increased song frequency of urban birds. Anim. Behav. 2011, 82, 831–836. [Google Scholar] [CrossRef]
- Deoniziak, K.; Osiejuk, T.S. Habitat-related differences in song structure and complexity in a songbird with a large repertoire. BMC Ecol. 2019, 19, 40. [Google Scholar] [CrossRef]
- Bermúdez-Cuamatzin, E.; Delamore, Z.; Verbeek, L.; Kremer, C.; Slabbekoorn, H. Variation in diurnal patterns of singing activity between urban and rural great tits. Front. Ecol. Evol. 2020, 8, 246. [Google Scholar] [CrossRef]
- Marín-Gómez, O.H.; MacGregor-Fors, I. A global synthesis of the impacts of urbanization on bird dawn choruses. Ibis 2021, 163, 1133–1154. [Google Scholar] [CrossRef]
- Da Silva, A.; Samplonius, J.M.; Schlicht, E.; Valcu, M.; Kempenaers, B. Artificial night lighting rather than traffic noise affects the daily timing of dawn and dusk singing in common European songbirds. Behav. Ecol. 2014, 25, 1037e1047. [Google Scholar] [CrossRef]
- Da Silva, A.; Valcu, M.; Kempenaers, B. Light pollution alters the phenology of dawn and dusk singing in common European songbirds. Philos. Trans. Roy. Soc. B 2015, 370, 20140126. [Google Scholar] [CrossRef] [PubMed]
- Dickerson, A.L.; Hall, M.L.; Jones, T.M. Effects of variation in natural and artificial light at night on acoustic communication: A review and prospectus. Anim. Behav. 2023, 198, 93–105. [Google Scholar] [CrossRef]
- Catchpole, C.K.; Slater, P.J.B. Bird Song: Biological Themes and Variations, 2nd ed.; Cambridge University Press: Cambridge, UK, 2008. [Google Scholar]
- Farina, A.; Ceraulo, M. The acoustic chorus and its ecological significance. In Ecoacoustics: The Ecological Role of Sounds; Farina, A., Gage, S.H., Eds.; John Wiley & Sons: Hoboken, NJ, USA, 2017; pp. 81–94. [Google Scholar] [CrossRef]
- Gil, D.; Llusia, D. The bird dawn chorus revisited. In Coding Strategies in Vertebrate Acoustic Communication; Aubin, T., Mathevon, N., Eds.; Springer: London, UK, 2020; pp. 45–90. [Google Scholar]
- Villegas, M.; Garitano-Zavala, Á. Bird community responses to different urban conditions in La Paz, Bolivia. Urban Ecosyst. 2010, 13, 375–391. [Google Scholar] [CrossRef]
- Garitano-Zavala, Á.; Calbimonte, R.; Esteve-Herraiz, G. The behavioral responses of the Chiguanco Thrush to urbanization in a Neotropical city comes from preadapted behavioral traits. Front. Ecol. Evol. 2022, 10, 830902. [Google Scholar] [CrossRef]
- Nemeth, E.; Brumm, H. Blackbirds sing higher-pitched songs in cities: Adaptation to habitat acoustics or side-effect of urbanization? Anim. Behav. 2009, 78, 637–641. [Google Scholar] [CrossRef]
- Ripmeester, E.A.; Mulder, M.; Slabbekoorn, H. Habitat-dependent acoustic divergence affects playback response in urban and forest populations of the European blackbird. Behav. Ecol. 2010, 21, 876–883. [Google Scholar] [CrossRef]
- Mendes, S.; Colino-Rabanal, V.J.; Peris, S.J. Bird song variations along an urban gradient: The case of the European blackbird (Turdus merula). Landsc. Urban Plan. 2011, 99, 51–57. [Google Scholar] [CrossRef]
- Mendes, S.; Colino-Rabanal, V.J.; Peris, S.J. Adaptación acústica del canto de Turdus leucomelas (Passeriformes: Turdidae) a diferentes niveles de ruido antrópico, en el área metropolitana de Belém, Pará, Brasil. Rev. Biol. Trop. 2017, 65, 633–642. [Google Scholar] [CrossRef]
- Dowling, J.L.; Luther, D.A.; Marra, P.P. Comparative effects of urban development and anthropogenic noise on bird songs. Behav. Ecol. 2012, 23, 201–209. [Google Scholar] [CrossRef]
- United Nations. Demographic Yearbook 2019; 70th Issue; Department of Economic and Social Affairs: New York, NY, USA, 2020. [Google Scholar]
- Leveau, L.M.; Leveau, C.M.; Villegas, M.; Cursach, J.A.; Suazo, C.G. Bird communities along urbanization gradients: A comparative analysis among three Neotropical cities. Ornitol. Neotrop. 2017, 28, 77–87. [Google Scholar] [CrossRef]
- Marzluff, J.M.; Bowman, R.; Donnelly, R. A historical perspective on urban bird research: Trend, terms, and approaches. In Avian Ecology and Conservation in an Urbanizing World; Marzluff, J.M., Bowman, R., Donnelly, R., Eds.; Kluwer Academic Publisher: New York, NY, USA, 2001; pp. 20–47. [Google Scholar] [CrossRef]
- MacGregor-Fors, I. Misconceptions or misunderstandings? On the standardization of basic terms and definitions in urban ecology. Landsc. Urban Plan. 2011, 100, 347–349. [Google Scholar] [CrossRef]
- Brumm, H.; Todt, D. Noise-dependent song amplitude regulation in a territorial songbird. Anim. Behav. 2002, 63, 891–897. [Google Scholar] [CrossRef]
- Ripmeester, E.A.; Kok, J.S.; van Rijssel, J.C.; Slabbekoorn, H. Habitat-related birdsong divergence: A multi-level study on the influence of territory density and ambient noise in European blackbirds. Behav. Ecol. Sociobiol. 2010, 64, 409–418. [Google Scholar] [CrossRef]
- Tobias, J.A.; Sheard, C.; Seddon, N.; Meade, A.; Cotton, A.J.; Nakagawa, S. Territoriality, Social Bonds, and the Evolution of Communal Signaling in Birds. Front. Ecol. Evol. 2016, 4, 74. [Google Scholar] [CrossRef]
- Austin, V.I.; Dalziell, A.H.; Langmore, N.E.; Welbergen, J.A. Avian vocalisations: The female perspective. Biol. Rev. 2021, 96, 1484–1503. [Google Scholar] [CrossRef]
- Langmore, N.E. Female song can be over-looked in even the most intensively studied songbirds. Behav. Ecol. 2023, 31, 160–161. [Google Scholar] [CrossRef]
- GAMLP. Mapa de Contaminación Acústica (Emisión de Ruido de Fuentes Móviles-Promedio), Mapa 1.6; Oficialía Mayor de Planificación para el Desarrollo-Plan 2040, Gobierno Autónomo Municipal de La Paz: La Paz, Bolivia, 2012. [Google Scholar]
- Brumm, H.; Ritschard, M. Song amplitude affects territorial aggression of male receivers in chaffinches. Behav. Ecol. 2011, 22, 310–316. [Google Scholar] [CrossRef]
- Brumm, H. The impact of environmental noise on song amplitude in a territorial bird. J. Anim. Ecol. 2004, 73, 434–440. [Google Scholar] [CrossRef]
- Opaev, A.S.; Shishkina, E.M. Song amplitude and population density in two sympatric warblers, Phylloscopus schwarzi and P. fuscatus. Bioacoustics 2021, 30, 272–283. [Google Scholar] [CrossRef]
- Zollinger, S.A.; Podos, J.; Nemeth, E.; Goller, F.; Brumm, H. On the relationship between, and measurement of amplitude and frequency in birdsong. Anim. Behav. 2012, 84, e1–e9. [Google Scholar] [CrossRef]
- Gill, S.A.; Grabarczyk, E.E.; Baker, K.M.; Naghshineh, K.; Vonhof, M.J. Decomposing an urban soundscape to reveal patterns and drivers of variation in anthropogenic noise. Sci. Total Environ. 2017, 599, 1191–1201. [Google Scholar] [CrossRef] [PubMed]
- Araya-Salas, M.; Smith-Vidaurre, G.; Webster, M. Assessing the effect of sound file compression and background noise on measures of acoustic signal structure. Bioacoustics 2017, 28, 57–73. [Google Scholar] [CrossRef]
- Friis, J.I.; Sabino, J.; Santos, P.; Dabelsteen, T.; Cardoso, G.C. The Allometry of Sound Frequency Bandwidth in Songbirds. Am. Nat. 2021, 197, 607–614. [Google Scholar] [CrossRef] [PubMed]
- Sementili-Cardoso, G.; Donatelli, R.J. Vocal divergence between two disjunct populations of Giant Antshrike (Batara cinerea) is related to environmental conditions. Austral. Ecol. 2019, 44, 484–493. [Google Scholar] [CrossRef]
- Hernández-Herrera, C.I.; Pérez-Mendoza, H.A. Acoustic and morphological variation on two populations of Dryophytes arenicolor in central México. Bioacoustics 2021, 30, 366–377. [Google Scholar] [CrossRef]
- Sebastianelli, M.; Blumstein, D.T.; Kirschel, A.N. Higher-pitched bird song towards the coast supports a role for selection in ocean noise avoidance. Bioacoustics 2022, 31, 41–58. [Google Scholar] [CrossRef]
- Brumm, H.; Zollinger, S.A.; Niemelä, P.T.; Sprau, P. Measurement artefacts lead to false positives in the study of birdsong in noise. Meth. Ecol. Evol. 2017, 8, 1617–1625. [Google Scholar] [CrossRef]
- Ríos-Chelén, A.A.; McDonald, A.N.; Berger, A.; Perry, A.C.; Krakauer, A.H.; Patricelli, G.L. Do birds vocalize at higher pitch in noise, or is it a matter of measurement? Behav. Ecol. Sociob. 2017, 71, 29. [Google Scholar] [CrossRef]
- Winandy, G.S.; Félix, R.P.; Sacramento, R.A.; Mascarenhas, R.; Batalha-Filho, H.; Japyassú, H.F.; Izar, P.; Slabbekoorn, H. Urban Noise Restricts Song Frequency Bandwidth and Syllable Diversity in Bananaquits: Increasing Audibility at the Expense of Signal Quality. Front. Ecol. Evol. 2021, 9, 570420. [Google Scholar] [CrossRef]
- Staicer, C.A.; Spector, D.A.; Horn, A.G. The dawn chorus and other diel patterns in acoustic signaling. In Ecology and Evolution of Acoustic Communication in Birds; Kroodsma, D.E., Miller, E.H., Eds.; Cornell University Press: Ithaca, NY, USA, 1996; pp. 426–453. [Google Scholar]
- Henwood, K.; Fabrick, A. A quantitative analysis of the dawn chorus: Temporal selection for communicatory optimization. Am. Nat. 1979, 114, 260–274. [Google Scholar] [CrossRef]
- Thompson, M.J.; Pearse, K.A.; Foote, J.R. Seasonal and diel plasticity of song type use in individual ovenbirds (Seiurus aurocapilla). Ethology 2020, 126, 824–838. [Google Scholar] [CrossRef]
- Dabelsteen, T. An analysis of the full song of the blackbird Turdus merula with respect to message coding and adaptations for acoustic communication. Ornis Scand. 1984, 15, 227–239. [Google Scholar] [CrossRef]
- Brumm, H.; Zollinger, S.A. The evolution of the Lombard effect: 100 years of psychoacoustic research. Behaviour 2011, 148, 1173–1198. [Google Scholar] [CrossRef]
- Nemeth, E.; Zollinger, S.A.; Brumm, H. Effect Sizes and the Integrative Understanding of Urban Bird Song: (A Reply to Slabbekoorn et al.). Am. Nat. 2012, 180, 146–152. [Google Scholar] [CrossRef]
- Goller, F.; Riede, T. Integrative physiology of fundamental frequency control in birds. J. Physiol. Paris 2013, 107, 230–242. [Google Scholar] [CrossRef]
- Slabbekoorn, H.; Yang, X.J.; Halfwerk, W. Birds and Anthropogenic Noise: Singing Higher May Matter. Am. Nat. 2012, 180, 142–145. [Google Scholar] [CrossRef]
- Cardoso, G.C.; Atwell, J.W. On amplitude and frequency in birdsong: A reply to Zollinger et al. Anim. Behav. 2012, 84, e10–e15. [Google Scholar] [CrossRef]
- Walters, M.J.; Guralnick, R.P.; Kleist, N.J.; Robinson, S.K. Urban background noise affects breeding song frequency and syllable-type composition in the Northern Mockingbird. Condor 2019, 121, duz002. [Google Scholar] [CrossRef]
- Ríos-Chelén, A.A.; Salaberria, C.; Barbosa, I.; Macías Garcia, C.; Gil, D. The learning advantage: Bird species that learn their song show a tighter adjustment of song to noisy environments than those that do not learn. J. Evol. Biol. 2012, 25, 2171–2180. [Google Scholar] [CrossRef] [PubMed]
- Cardoso, G.C.; Klingbeil, B.T.; La Sorte, F.A.; Lepczyk, C.A.; Fink, D.; Flather, C.H. Exposure to noise pollution across North American passerines supports the noise filter hypothesis. Glob. Ecol. Biogeogr. 2020, 29, 1430–1434. [Google Scholar] [CrossRef]
- Rasmussen, R.; Dabelsteen, T. Song repertoires and repertoire sharing in a local group of blackbirds. Bioacoustics 2002, 13, 63–76. [Google Scholar] [CrossRef]
- Johnson, S.L. Do American Robins acquire songs by both imitating and inventing? Wilson J. Ornithol. 2006, 118, 341–352. [Google Scholar] [CrossRef]
- Vargas-Castro, L.E.; Sánchez, N.V.; Barrantes, G. Repertoire size and syllable sharing in the song of the Clay-colored Thrush (Turdus grayi). Wilson J. Ornithol. 2012, 124, 446–453. [Google Scholar] [CrossRef]
- Hesler, N.; Mundry, R.; Dabelsteen, T. Are there age-related differences in the song repertoire size of Eurasian blackbirds? Acta Ethol. 2012, 15, 203–210. [Google Scholar] [CrossRef]
- Sierro, J.; Schloesing, E.; Pavón, I.; Gil, D. European Blackbirds exposed to aircraft noise advance their chorus, modify their song and spend more time singing. Front. Ecol. Evol. 2017, 5, 68. [Google Scholar] [CrossRef]
- Hu, Y.; Cardoso, G.C. Are bird species that vocalize at higher frequencies preadapted to inhabit noisy urban areas? Behav. Ecol. 2009, 20, 1268–1273. [Google Scholar] [CrossRef]
- Francis, C.D.; Ortega, C.P.; Cruz, A. Noise Pollution Filters Bird Communities Based on Vocal Frequency. PLoS ONE 2011, 6, e27052. [Google Scholar] [CrossRef]
- Moiron, M.; González-Lagos, C.; Slabbekoorn, H.; Sol, D. Singing in the city: High song frequencies are no guarantee for urban success in birds. Behav. Ecol. 2015, 26, 843–850. [Google Scholar] [CrossRef]
- Klingbeil, B.T.; La Sorte, F.A.; Lepczyk, C.A.; Fink, D.; Flather, C.H. Geographical associations with anthropogenic noise pollution for North American breeding birds. Glob. Ecol. Biogeogr. 2020, 29, 148–158. [Google Scholar] [CrossRef]
- Dabelsteen, T.; Larsen, O.N.; Pedersen, S.B. Habitat-induced degradation of sound signals: Quantifying the effects of communication sounds and bird location on blur ratio, excess attenuation, and signal-to-noise ratio in blackbird song. J. Acoust. Soc. Am. 1993, 93, 2206–2220. [Google Scholar] [CrossRef]
- Gil, D.; Gahr, M. The honesty of bird song: Multiple constraints for multiple traits. Trends Ecol. Evol. 2002, 17, 133–141. [Google Scholar] [CrossRef]
- Cuthill, I.C.; Macdonald, W.A. Experimental manipulation of the dawn and dusk chorus in the blackbird Turdus merula. Behav. Ecol. Sociobiol. 1990, 26, 209–216. [Google Scholar] [CrossRef]
- Sanchez, K.A.; Fialko, K.; Benedict, L.; Cicero, C. Time alters urban singing strategies in a North American songbird. J. Urban Ecol. 2023, 9, juad001. [Google Scholar] [CrossRef]


| N | Song Length (s) | SSP (dBA) | ESP (dBA) | N | Songs Number | ||
|---|---|---|---|---|---|---|---|
| U | a.m. | 113 | 1.89 ± 0.47 | 64.70 ± 4.49 | 52.26 ± 7.34 | 3 | 20.18 ± 5.01 |
| p.m. | 86 | 1.62 ± 0.39 | 64.03 ± 4.95 | 63.01 ± 4.26 | 3 | 11.25 ± 3.07 | |
| E-u | a.m. | 162 | 1.95 ± 0.51 | 61.75 ± 4.80 | 44.17 ± 2.42 | 3 | 50.91 ± 6.52 |
| p.m. | 73 | 1.38 ± 0.42 | 56.70 ± 4.51 | 51.45 ± 5.72 | 3 | 24.52 ± 5.56 |
| Intercept | Zone | Time | Zone*Time | Plot (Zone) | |
|---|---|---|---|---|---|
| Minimum frequency | 1,419,631.481 (<0.001) | 24.626 (<0.001) | 23.483 (<0.001) | 11.390 (=0.001) | 60.804 (<0.001) |
| Maximum frequency | 325,706.139 (<0.001) | 9.795 (=0.002) | 19.175 (<0.001) | 2.461 (=0.117) | 3.718 (=0.445) |
| Frequency range | 104,510.041 (<0.001) | 5.619 (=0.018) | 23.450 (<0.001) | 4.005 (=0.045) | 4.757 (=0.313) |
| Dominant frequency | 1,650,781.477 (<0.001) | 58.045 (<0.001) | 0.938 (=0.333) | 1.517 (=0.218) | 11.712 (=0.020) |
| Song sound pressure level | 1,354,249.158 (<0.001) | 139.820 (<0.001) | 49.586 (<0.001) | 32.400 (<0.001) | 90.647 (<0.001) |
| Environmental sound pressure level | 775,722.214 (<0.001) | 450.657 (<0.001) | 353.687 (<0.001) | 4.299 (=0.038) | 55.149 (<0.001) |
| Song length | 1630.271 (<0.001) | 2.445 (=0.118) | 95.284 (<0.001) | 13.342 (<0.001) | 37.315 (<0.001) |
| N | Minimum (Hz) | Maximum (Hz) | Range (Hz) | Dominant (Hz) | ||
|---|---|---|---|---|---|---|
| U | a.m. | 113 | 2018.58 ± 266.11 | 6028.76 ± 1569.94 | 4010.18 ± 1615.72 | 2963.70 ± 315.83 |
| p.m. | 86 | 2058.14 ± 287.47 | 5582.56 ± 1542.82 | 3524.42 ± 1593.01 | 2881.11 ± 320.38 | |
| E-u | a.m. | 162 | 1843.21 ± 241.41 | 5765.12 ± 1688.91 | 3921.91 ± 1739.82 | 2655.14 ± 217.89 |
| p.m. | 73 | 2049.31 ± 245.59 | 4835.62 ± 1634.30 | 2786.30 ± 1644.97 | 2671.74 ± 292.62 |
Disclaimer/Publisher’s Note: The statements, opinions and data contained in all publications are solely those of the individual author(s) and contributor(s) and not of MDPI and/or the editor(s). MDPI and/or the editor(s) disclaim responsibility for any injury to people or property resulting from any ideas, methods, instructions or products referred to in the content. |
© 2024 by the authors. Licensee MDPI, Basel, Switzerland. This article is an open access article distributed under the terms and conditions of the Creative Commons Attribution (CC BY) license (https://creativecommons.org/licenses/by/4.0/).
Share and Cite
Bustamante, N.; Garitano-Zavala, Á. Natural Patterns in the Dawn and Dusk Choruses of a Neotropical Songbird in Relation to an Urban Sound Environment. Animals 2024, 14, 646. https://doi.org/10.3390/ani14040646
Bustamante N, Garitano-Zavala Á. Natural Patterns in the Dawn and Dusk Choruses of a Neotropical Songbird in Relation to an Urban Sound Environment. Animals. 2024; 14(4):646. https://doi.org/10.3390/ani14040646
Chicago/Turabian StyleBustamante, Noelia, and Álvaro Garitano-Zavala. 2024. "Natural Patterns in the Dawn and Dusk Choruses of a Neotropical Songbird in Relation to an Urban Sound Environment" Animals 14, no. 4: 646. https://doi.org/10.3390/ani14040646
APA StyleBustamante, N., & Garitano-Zavala, Á. (2024). Natural Patterns in the Dawn and Dusk Choruses of a Neotropical Songbird in Relation to an Urban Sound Environment. Animals, 14(4), 646. https://doi.org/10.3390/ani14040646