

Unlocking Phytate with Phytase: A Meta-Analytic View of Meat-Type Chicken Muscle Growth and Bone Mineralization Potential

 ,
,  , , , ,
  ,
, 
Abstract
Simple Summary
Abstract
1. Introduction
2. Materials and Methods
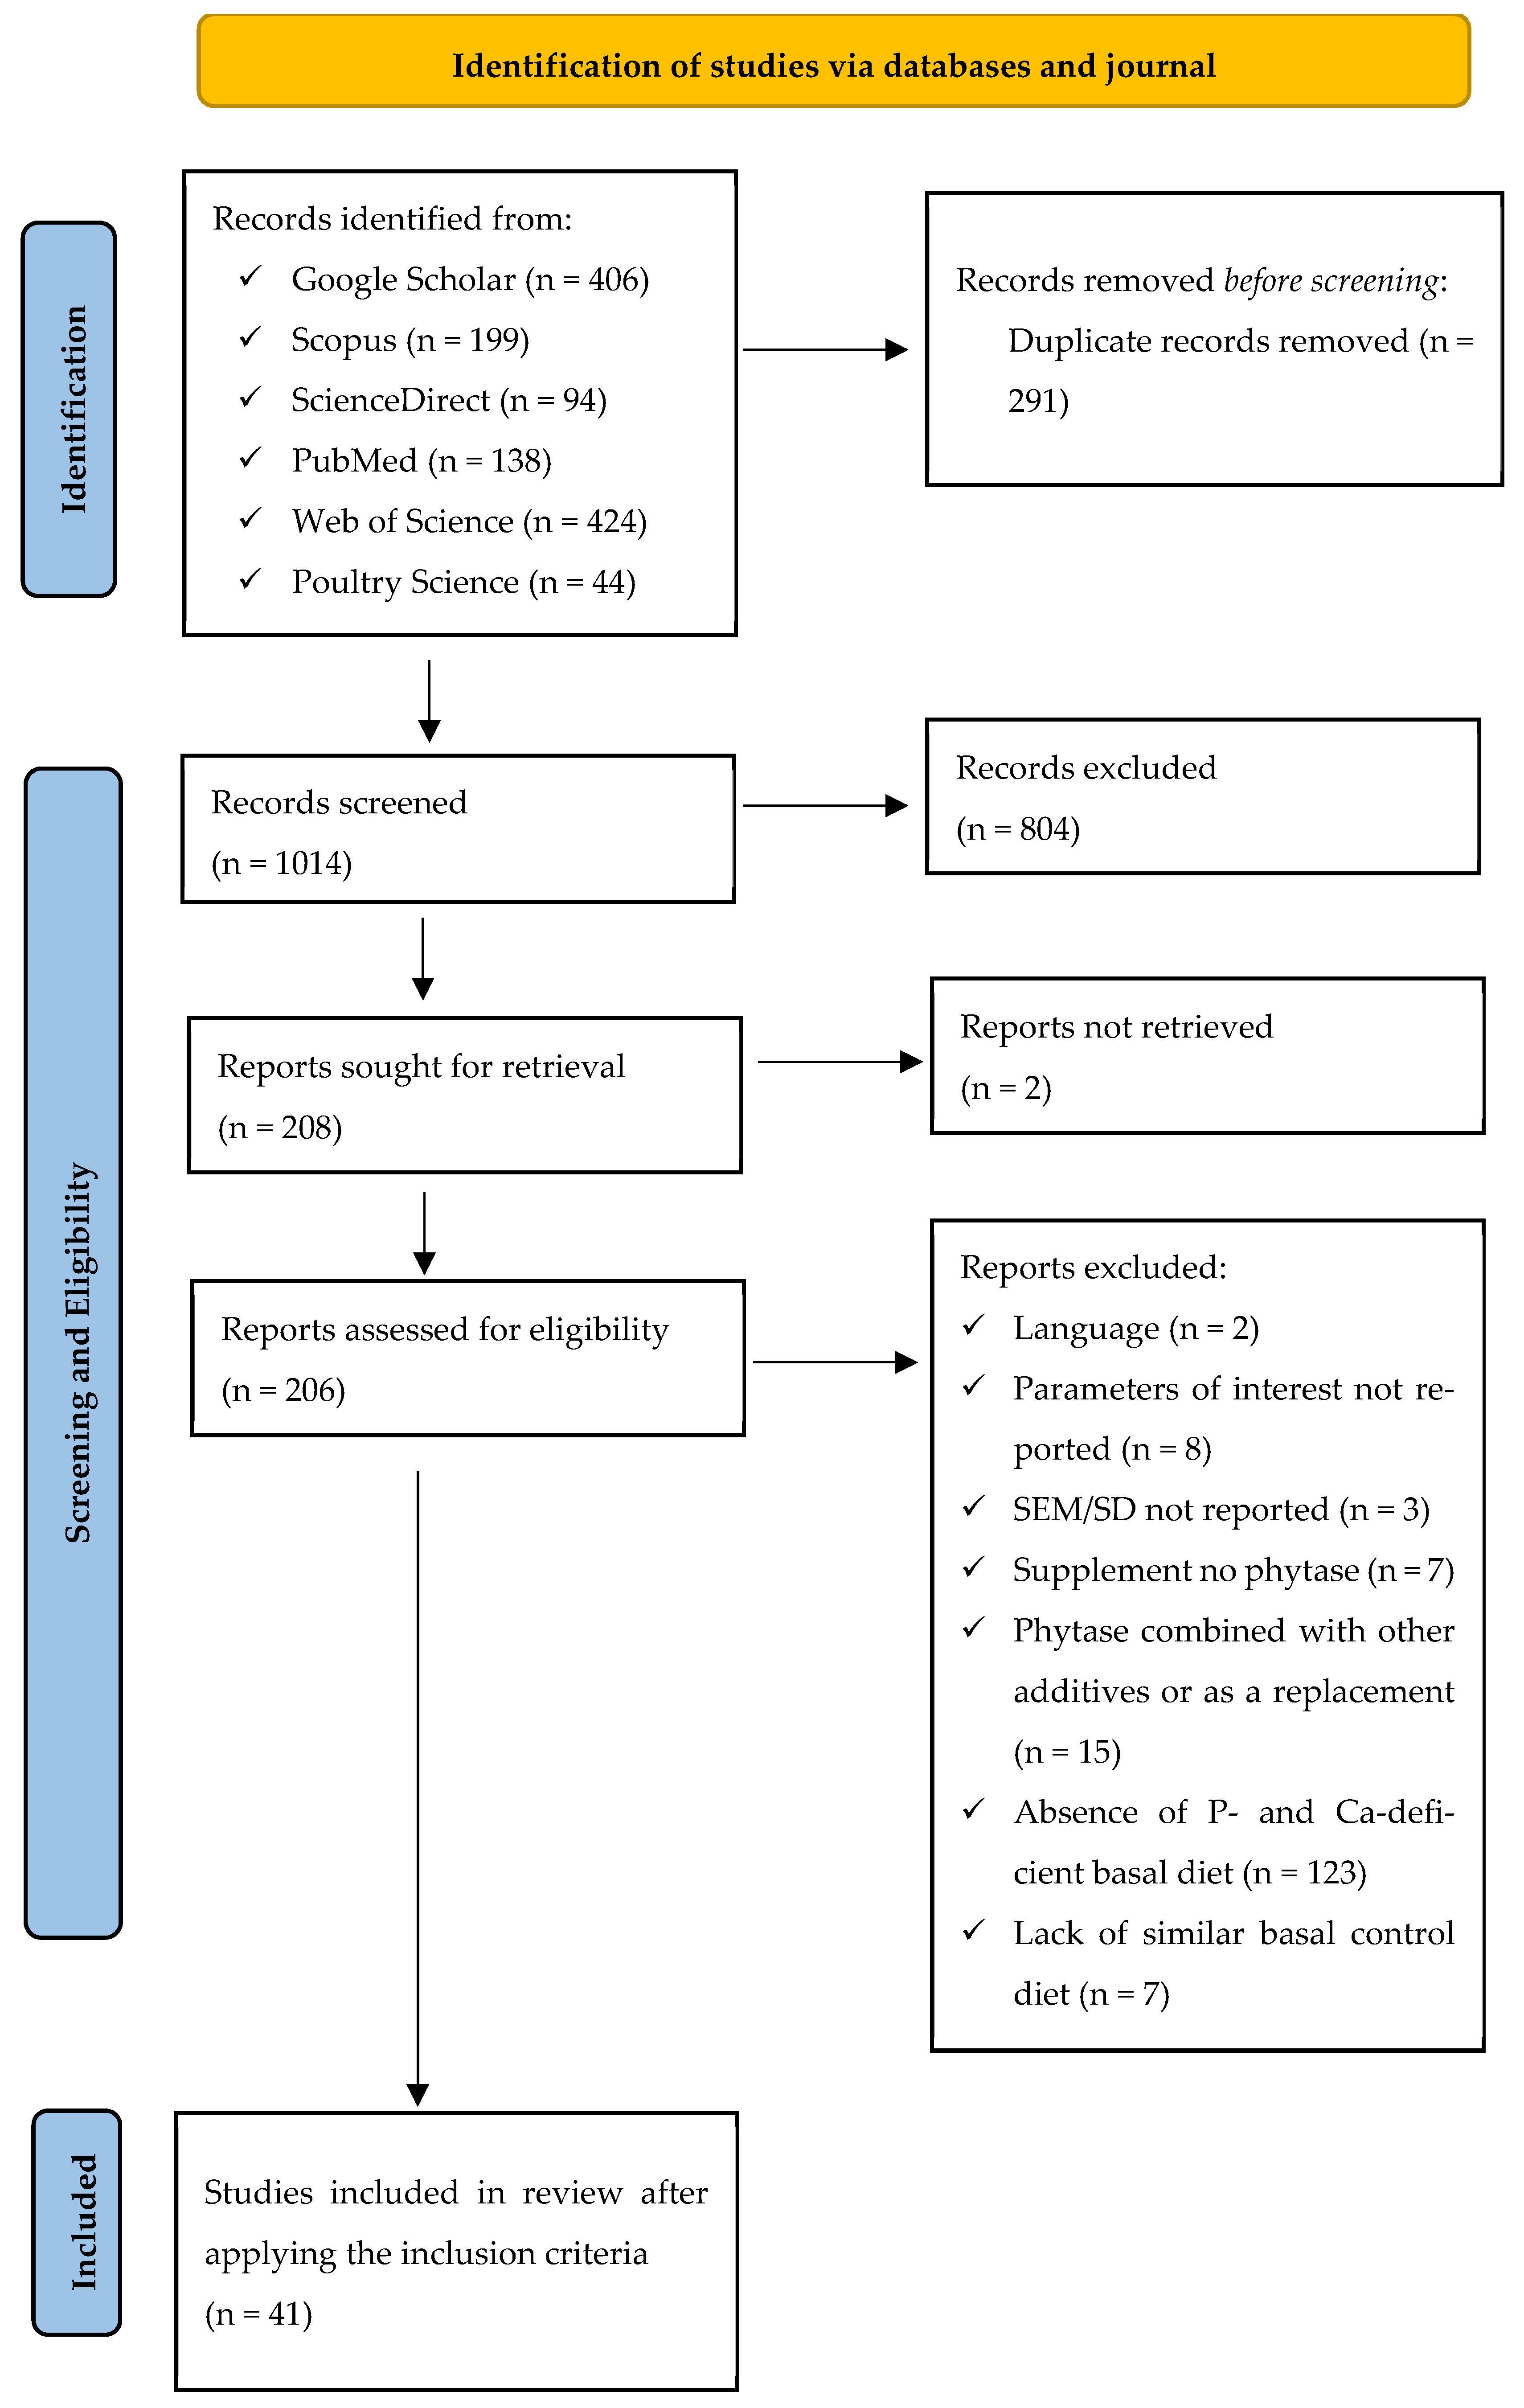
2.1. Literature Search and Study Screening
2.2. Criteria for Inclusion and Exclusion
2.3. Extraction of Data
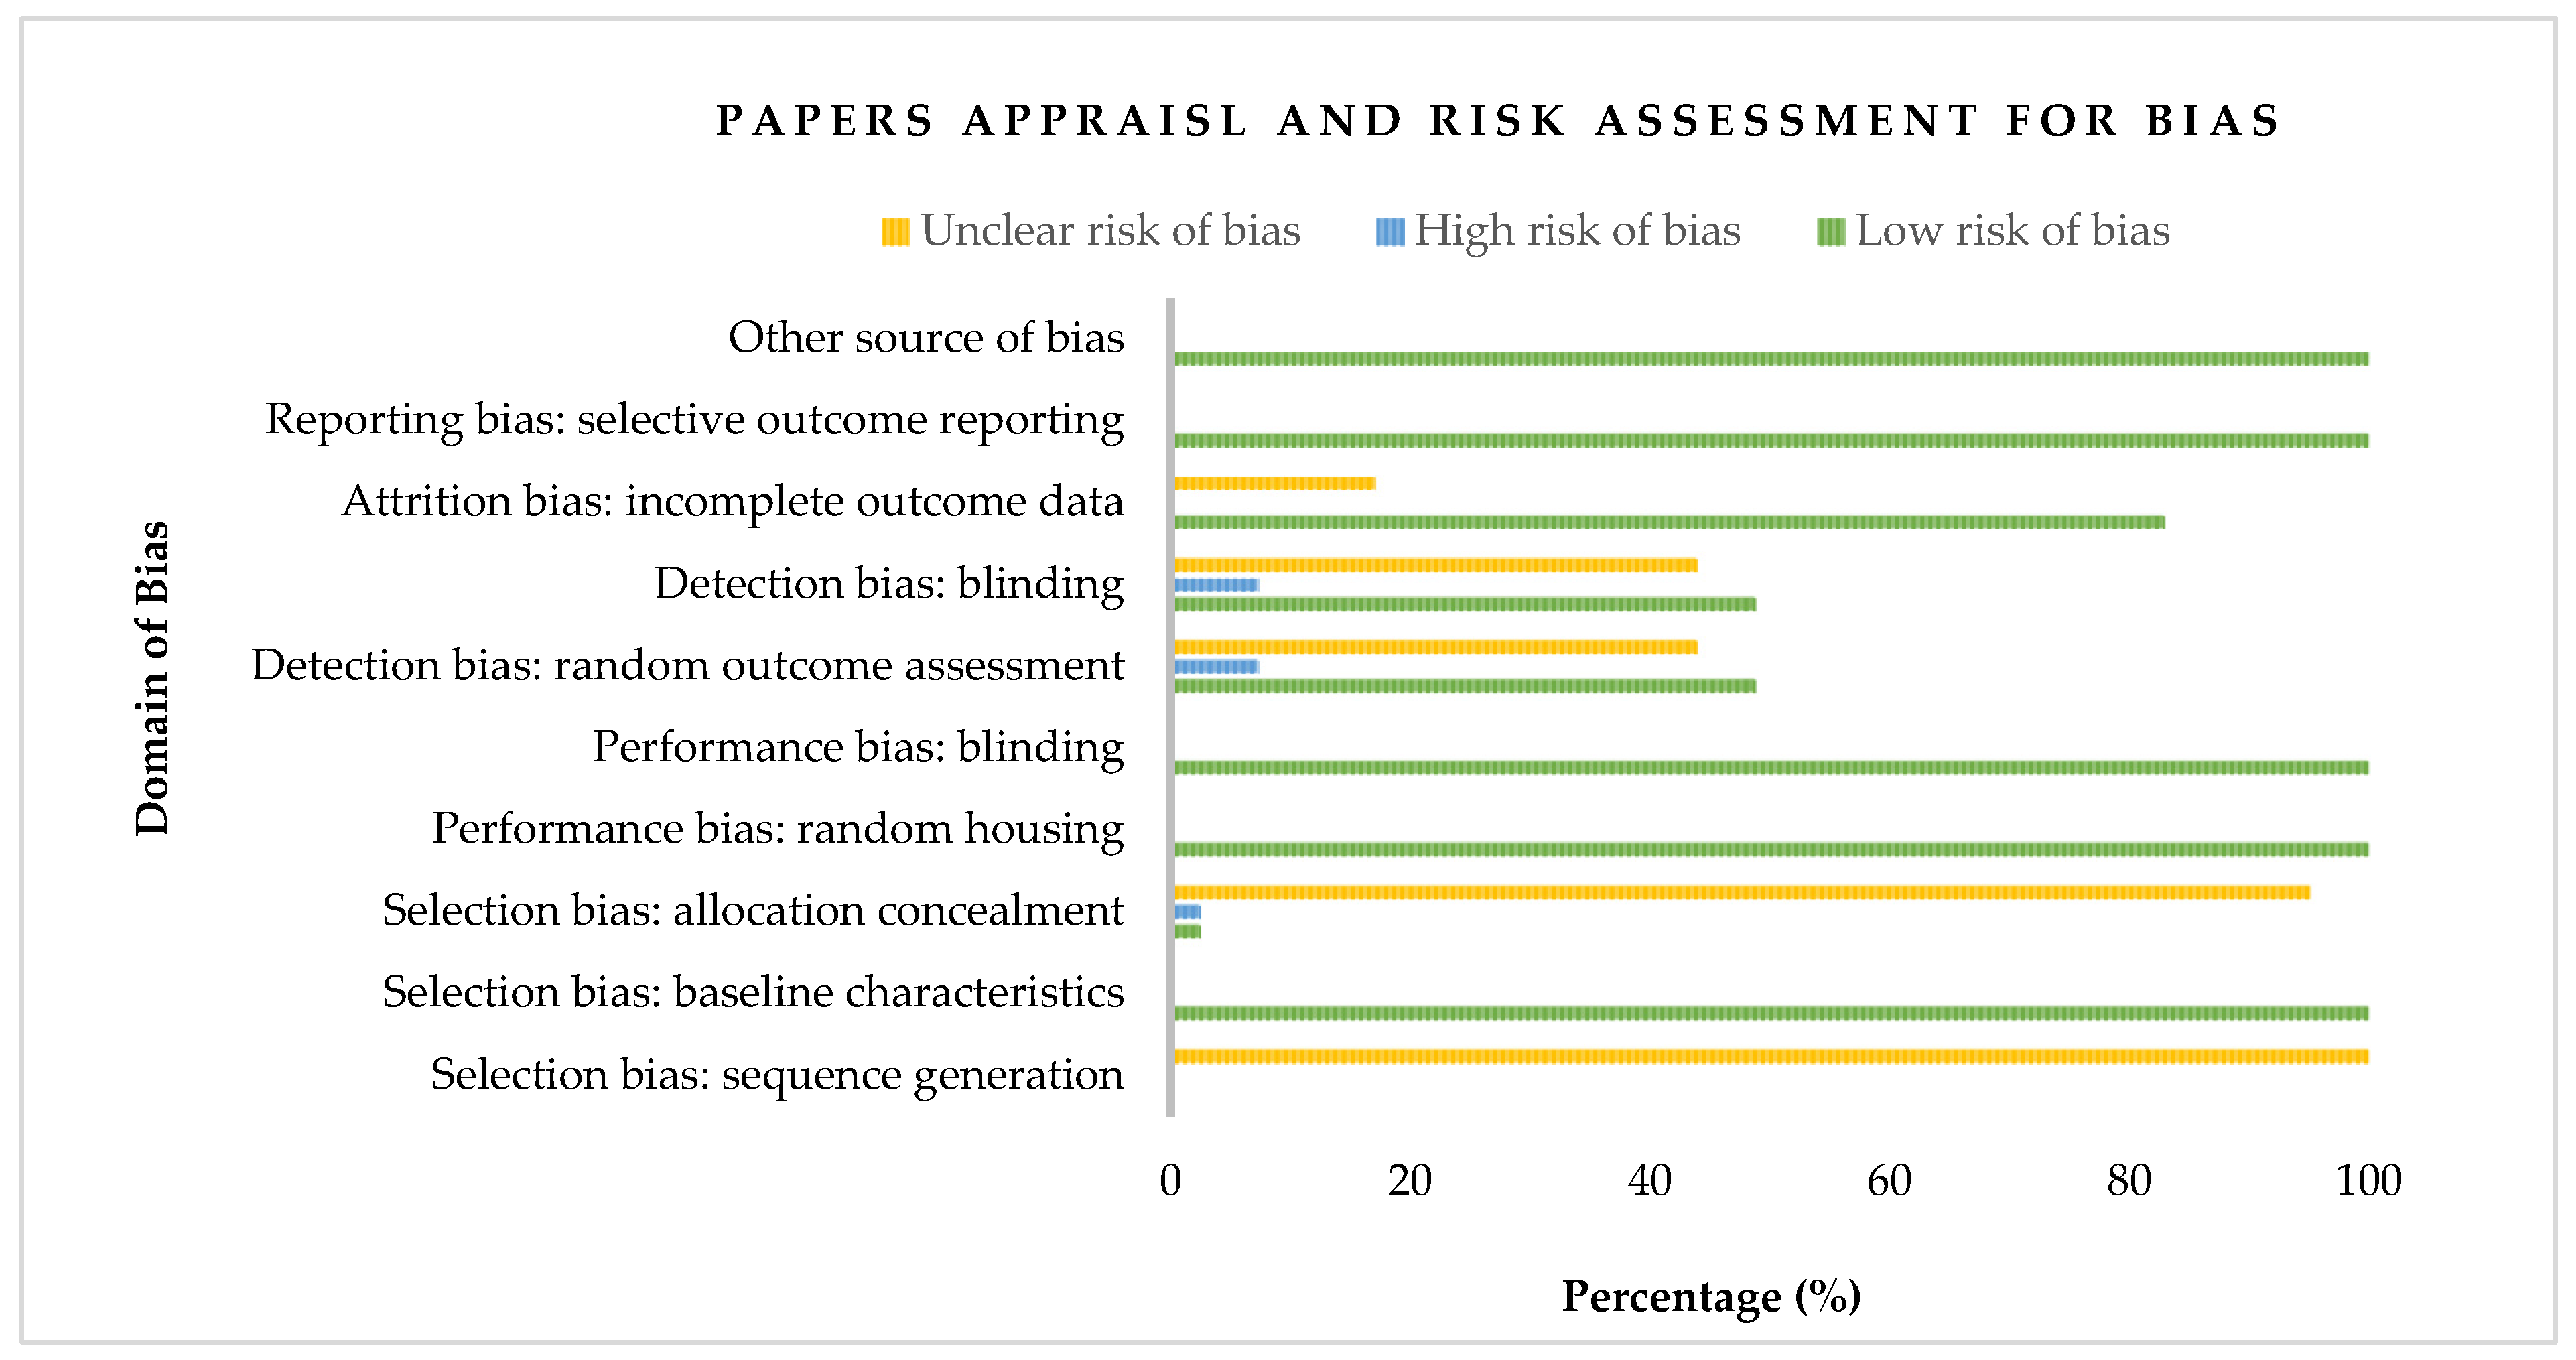
2.4. Appraisal of Study and Risk Assessment for Bias
2.5. Statistical Analysis
2.5.1. Meta-Analysis (MA)
2.5.2. Heterogeneity Assessment

| Studies | Country | Broiler Strain | Dietary P Source 1 | Origin | Phytase Expression Host | Category of Phytase |
|---|---|---|---|---|---|---|
| Ajuwon et al. [54] | Germany | Ross 308 | Corn–Soybean | Bacteria | Escherichia coli | 6-phytase |
| Beeson et al. [4] | UK | Ross 308 | Corn–Soybean | Bacteria | Escherichia coli | 6-phytase |
| Bello et al. [55] | Canada | Ross 308 | Corn–Soybean | Bacteria | Buttiauxella sp. Citrobacter braakii | 6-phytase 6-phytase |
| Borda-Molina et al. [56] | Germany | Ross 308 | Corn–Soybean | Bacteria | Escherichia coli | 6-phytase |
| Bowen et al. [57] | USA | Ross 708 | Corn–Soybean | Bacteria | Escherichia coli | 6-phytase |
| Broch et al. [33] | Brazil | Cobb 500 | Corn–Soybean | Bacteria | Escherichia coli | 6-phytase |
| Broch et al. [34] | Brazil | Cobb 500 | Corn–Soybean | Fungi | Aspergillus oryzae | 3-phytase |
| Broch et al. [58] | Brazil | Cobb 500 | Corn–Soybean | Fungi | -- | 3-phytase |
| Campasino et al. [35] | USA | Hubbard × Cobb 500 | Corn–Soybean | Fungi | Aspergillus oryzae | 6-phytase |
| Cowieson et al. [36] | UK | Ross | Corn–Soybean | Fungi | Aspergillus oryzae | 6-phytase |
| Cowieson et al. [37] | Poland | Ross 308 | WCS | Bacteria | Escherichia coli | 6-phytase |
| Dersjant-Li et al. [59] | USA | Cobb 500 | Corn–Soybean | Bacteria | Buttiauxella sp. | 6-phytase |
| Dersjant-Li et al. [38] | New Zealand | Ross 308 | CSRRB | Bacteria | Trichoderma reesei | 6-phytase |
| Dessimoni et al. [39] | Brazil | Cobb 500 | Corn–Soybean | Bacteria | Escherichia coli | 6-phytase |
| Ennis et al. [60] | USA | Ross × Ross 708 | Corn–Soybean | Bacteria Bacteria Fungi | Escherichia coli Buttiauxella sp. Aspergillus niger | 6-phytase 6-phytase 3-phytase |
| Gehring et al. [61] | USA | Ross × Ross 708 | WCS | Fungi | Aspergillus niger | 6-phytase |
| Ghahri et al. [62] | Iran | Ross 308 | Corn–Soy–DDGS | Bacteria | Escherichia coli | 6-phytase |
| Gulizia et al. [40] | USA | Ross 708 × YPM | Corn–Soybean | Bacteria | Escherichia coli | 6-phytase |
| Hernandez et al. [63] | USA | Cobb 500 | Corn–Soybean | Bacteria | Escherichia coli | 6-phytase |
| Houshyar et al. [64] | Iran | Ross 308 | WCS | Bacteria | Serratia odorifera | 3-phytase |
| Javadi eta al. [65] | Spain | Ross | WCS | Bacteria | Trichoderma reesei | 6-phytase |
| Jlali et al. [66] | France | Ross 308 | Wheat–Soybean | Bacteria | Escherichia coli | 6-phytase |
| Józefiak et al. [67] | Poland | Ross 308 | Corn–Soybean | Bacteria | Escherichia coli | 6-phytase |
| Karami et al. [68] | Germany | Ross 308 | Corn–Soybean | Bacteria | Buttiauxella sp. | 6-phytase |
| Kiarie et al. [69] | Canada | Ross 308 | Corn–Soybean | Bacteria | Escherichia coli | 6-phytase |
| Kriseldi et al. [70] | USA | Yield Plus × Ross 708 | Corn–Soybean | Bacteria | Escherichia coli | 6-phytase |
| Kwon et al. [71] | Korea | Ross 308 | Corn–Soybean | Bacteria | Escherichia coli | 6-phytase |
| Liu et al. [72] | Australia | Ross 308 | Corn–Soybean | Fungi | Aspergillus oryzae | 6-phytase |
| Moita et al. [73] | USA | Ross 308 | Corn–Soybean | Fungi | Aspergillus niger | 6-phytase |
| Powell et al. [74] | USA | Ross × Ross 508 | Corn–Soybean | Bacteria | Escherichia coli | 6-phytase |
| Ptak et al. [75] | Poland | Ross 308 | WRES | Fungi Bacteria | Aspergillus ficcum Escherichia coli | 3-phytase 6-phytase |
| Ptak et al. [76] | Poland | Ross 308 | WRES | Bacteria | Escherichia coli | 6-phytase |
| Shang et al. [77] | Canada | Ross × Ross 308 | WCS | Bacteria | -- | 6-phytase |
| Shi et al. [78] | USA | Cobb 500 | Corn–Soybean | Bacteria | Buttiauxella sp. | 6-phytase |
| Walk et al. [79] | UK | Ross 308 | Wheat–Soybean | Bacteria | Escherichia coli | 6-phytase |
| Walk et al. [13] | USA | Cobb 500 | Corn–Soybean | Bacteria | Escherichia coli | 6-phytase |
| Walk and Olukosi, [80] | UK | Ross 308 | Wheat–Soybean | Bacteria | Escherichia coli | 6-phytase |
| Walk and Poernama, [81] | UK | Lohman Indian River Straight-run | Corn–Soybean | Bacteria | Escherichia coli | 6-phytase |
| Walk et al. [82] | USA | Cobb 500 | Corn–Soybean | Bacteria | Escherichia coli | 6-phytase |
| Woyengo et al. [83] | Canada | Ross | Corn–Soybean | Bacteria | -- | 6-phytase |
| Zhang et al. [84] | China | Cobb 500 | Corn–Soybean | Bacteria | Escherichia coli | 6-phytase |
| China | Ross 308 | Corn–Soybean | Bacteria | Citrobacter braakii | 6-phytase |
2.5.3. Publication Bias
2.5.4. Meta-ANOVA (Subgroup Analysis) and Meta-Regression
2.5.5. Descriptive Statistics
3. Results
3.1. Appraisal of Study and Risk Assessment for Bias
3.2. Analysis of Independent Variables Using Descriptive Statistics
3.3. Meta-Analysis
3.3.1. Growth Performance
3.3.2. Bone Strength and Mineralization
3.4. Heterogeneity and Sensitivity Analysis (Publication Bias)
3.5. Subgroup Analysis of Broiler Strain and Basal Diet’s Dietary P Source Association with Phytase Efficacy on Growth Performance, Bone Strength, and Mineralization
3.5.1. Broiler Strain and Growth Performance
3.5.2. Broiler Strain and Bone Strength and Mineralization
3.5.3. Basal Diets’ Dietary P Source and Growth Performance
3.5.4. Basal Diets’ Dietary P Source and Bone Strength and Mineralization
3.6. Effects of Phytase Dosage and Supplementation Duration on Mineralization, Bone Strength, and Growth Performance in Broilers
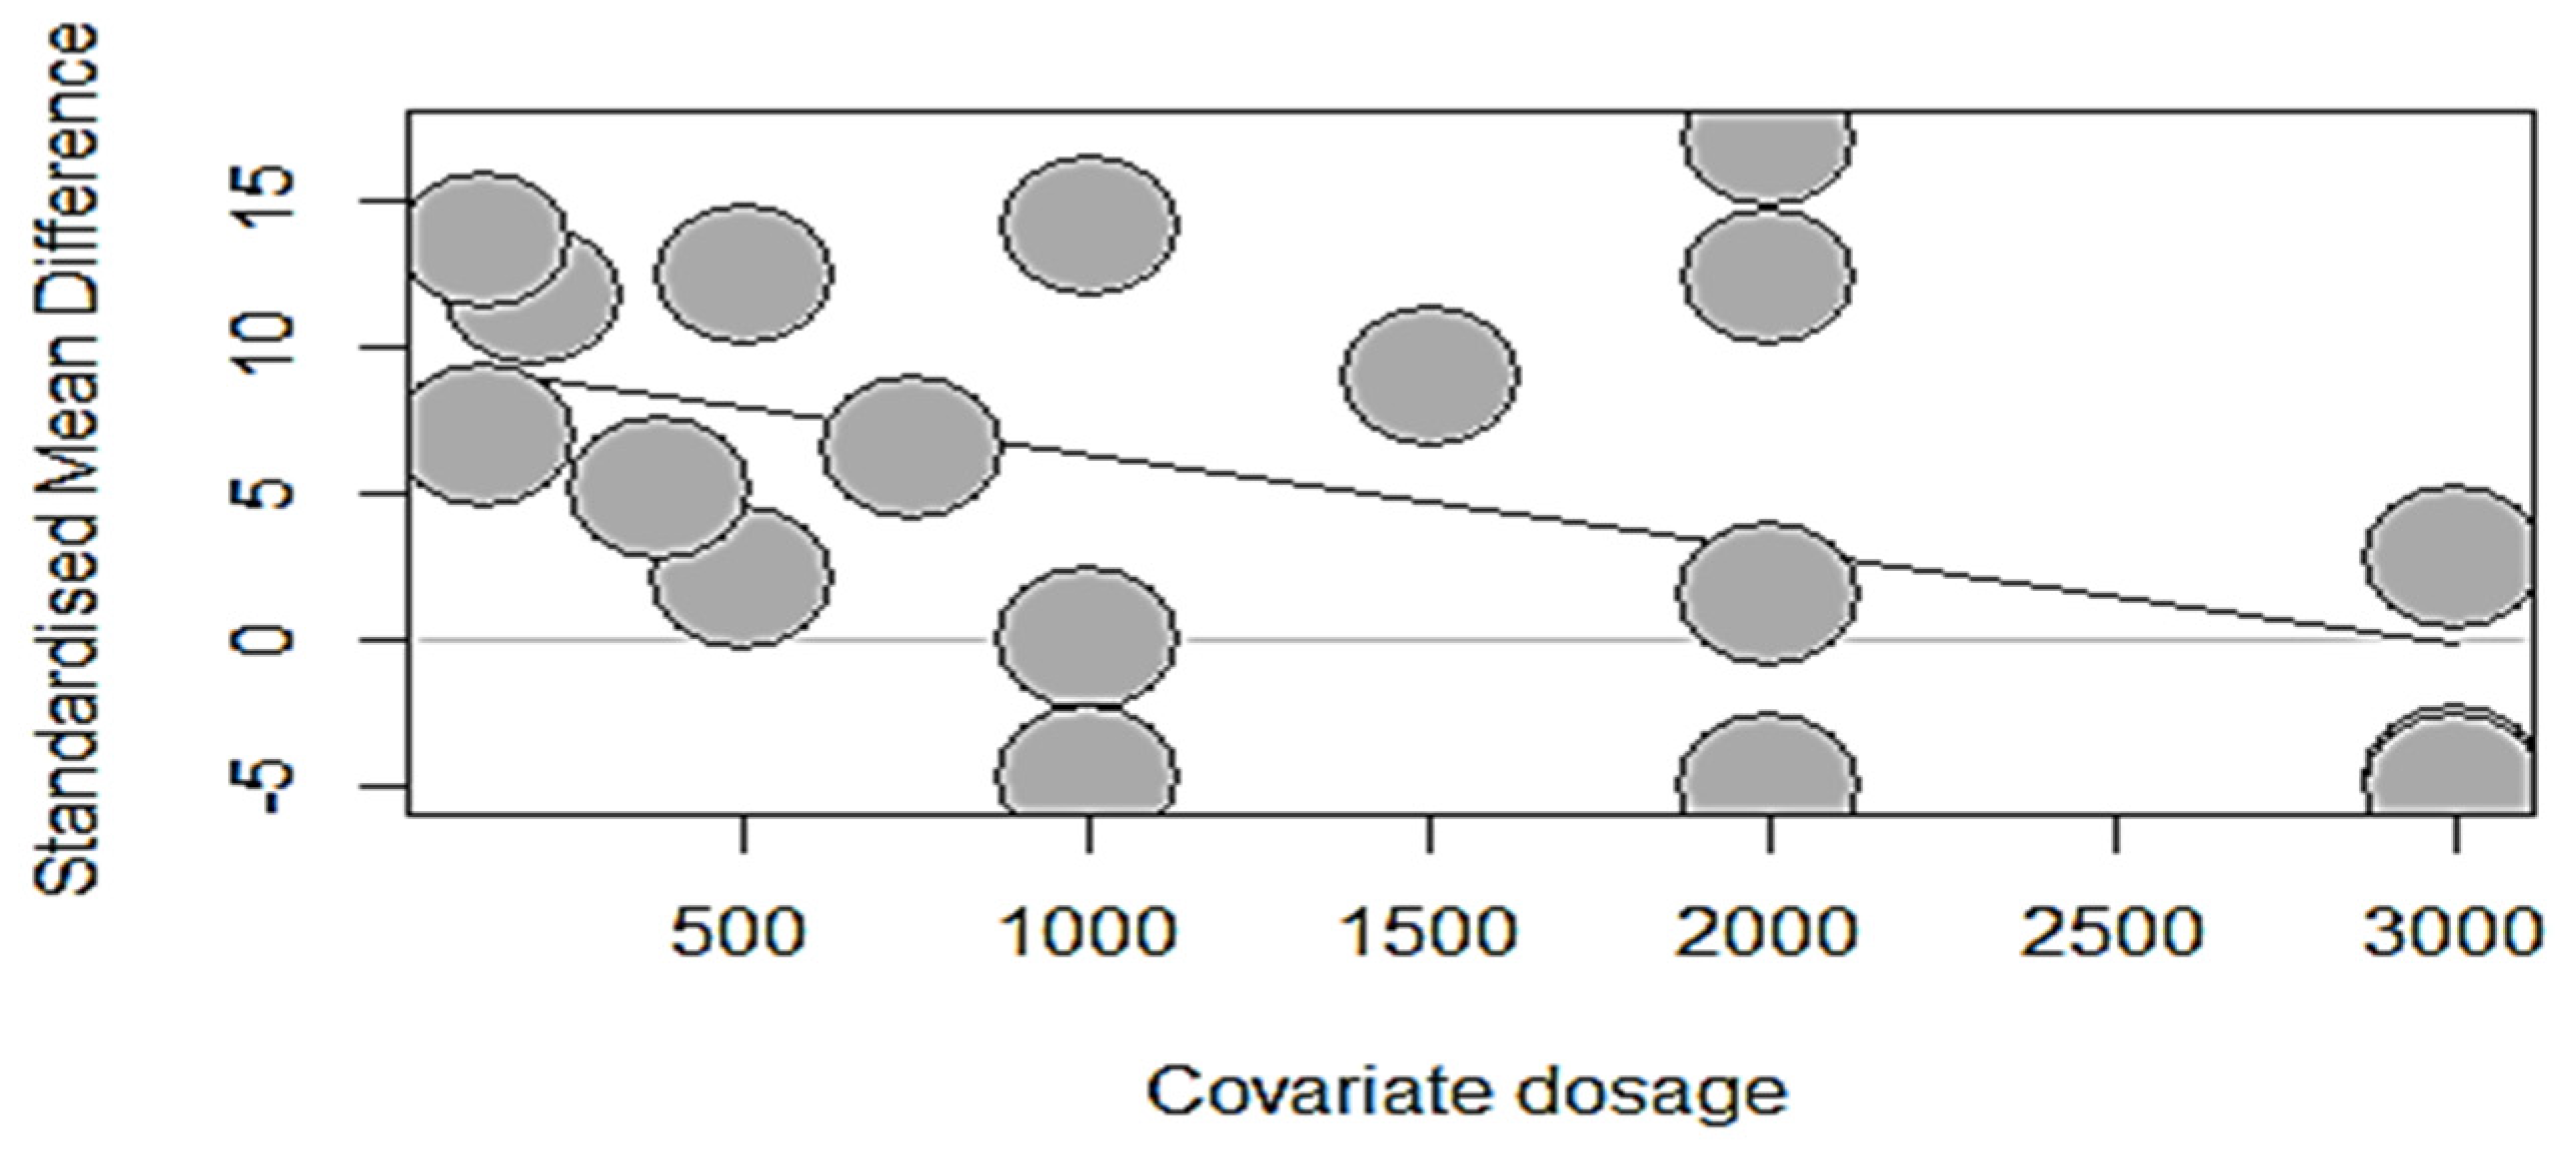
3.6.1. Meta-Regression Analysis of Phytase Dose Response
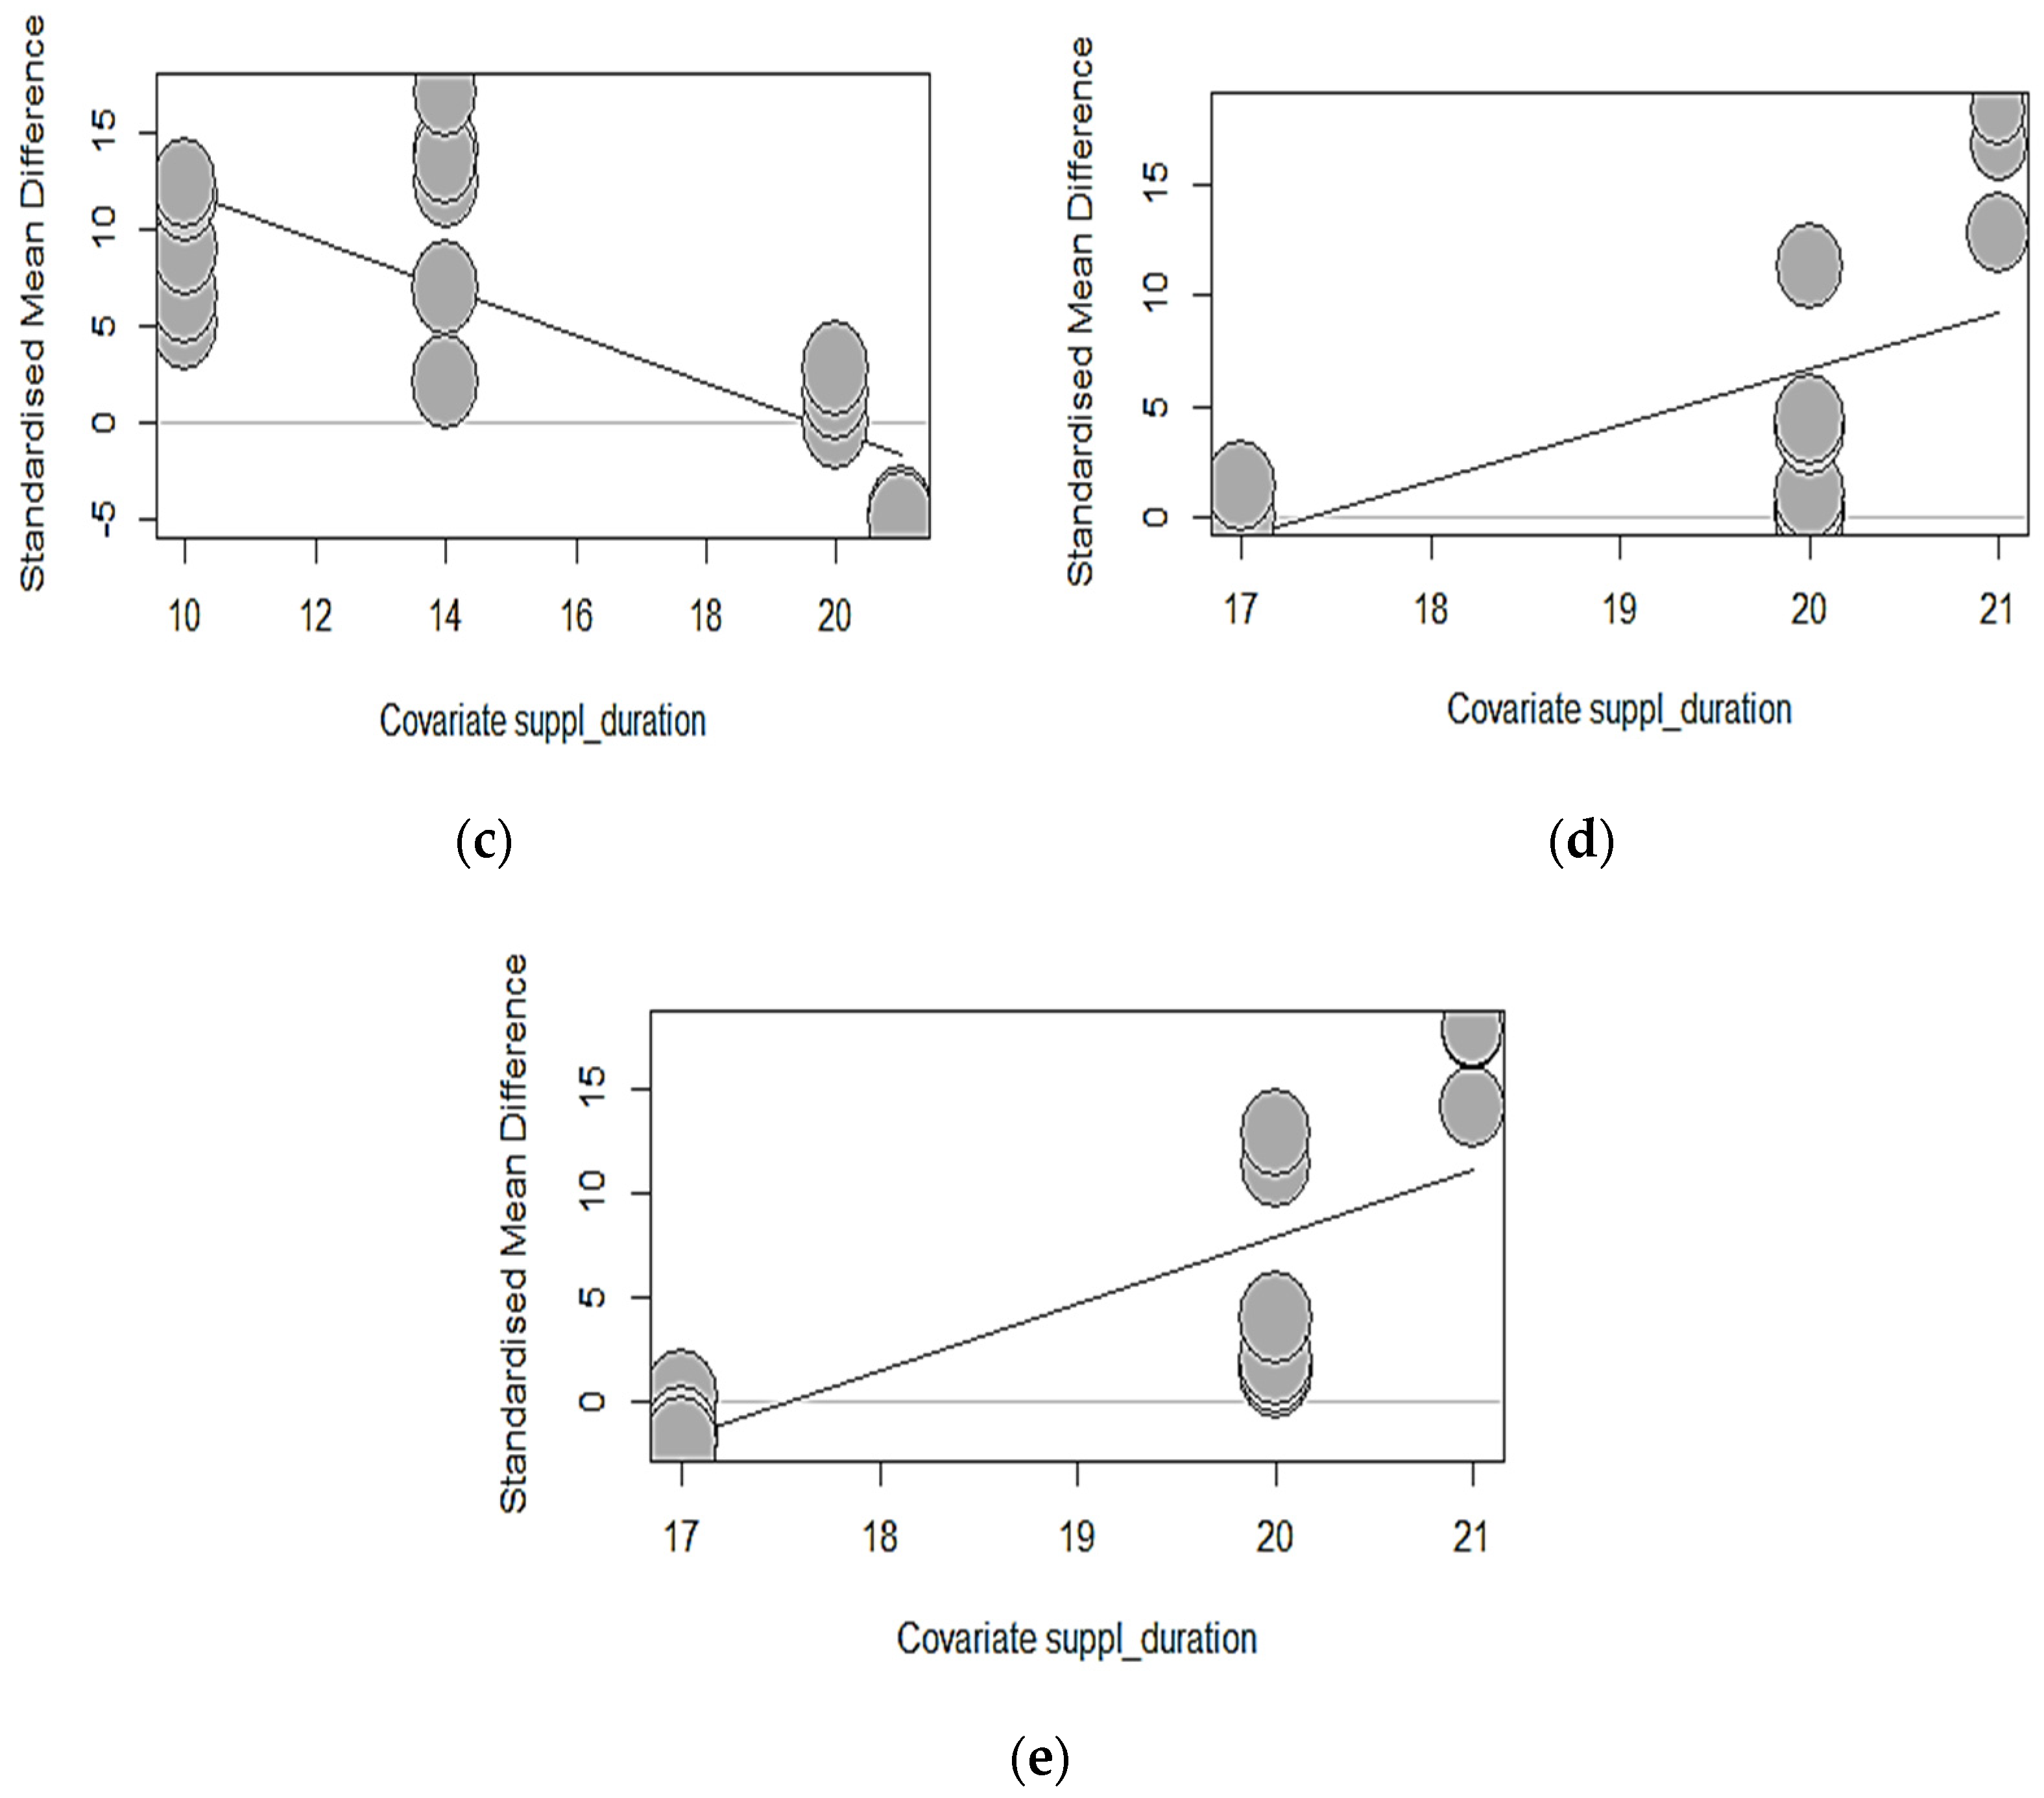
3.6.2. Phytase Exposure Duration
4. Discussion
4.1. Appraisal of Study and Assessment of Risk of Bias
4.2. Impact of Exogenous Phytase on Growth Performance
4.3. Impact of Exogenous Phytase on Bone Strength and Mineralization
5. Conclusions
Supplementary Materials
Author Contributions
Funding
Institutional Review Board Statement
Informed Consent Statement
Data Availability Statement
Acknowledgments
Conflicts of Interest
References
- Suttle, N. Mineral Nutrition of Livestock; Cabi GB: Wallingford, UK, 2022. [Google Scholar]
- National Research Council. Nutrient Requirements of Poultry; National Academies Press: Washington, DC, USA, 1994. [Google Scholar]
- Babatunde, O.O.; Adeola, O. A time-series effect of phytase supplementation on phosphorus utilization in growing and finishing pigs fed a low-phosphorus diet. J. Anim. Sci. 2022, 100, skab350. [Google Scholar] [CrossRef] [PubMed]
- Beeson, L.; Walk, C.; Bedford, M.; Olukosi, O. Hydrolysis of phytate to its lower esters can influence the growth performance and nutrient utilization of broilers with regular or super doses of phytase. Poult. Sci. 2017, 96, 2243–2253. [Google Scholar] [CrossRef] [PubMed]
- Witzig, M.; Camarinha da Silva, A.; Green-Engert, R.; Hoelzle, K.; Zeller, E.; Seifert, J.; Hoelzle, L.E.; Rodehutscord, M. Spatial variation of the gut microbiota in broiler chickens as affected by dietary available phosphorus and assessed by T-RFLP analysis and 454 pyrosequencing. PLoS ONE 2015, 10, e0143442. [Google Scholar]
- Zeller, E.; Schollenberger, M.; Witzig, M.; Shastak, Y.; Kühn, I.; Hoelzle, L.E.; Rodehutscord, M. Interactions between supplemented mineral phosphorus and phytase on phytate hydrolysis and inositol phosphates in the small intestine of broilers. Poult. Sci. 2015, 94, 1018–1029. [Google Scholar] [CrossRef] [PubMed]
- Kiarie, E.; Walsh, M.; Nyachoti, C. Performance, digestive function, and mucosal responses to selected feed additives for pigs. J. Anim. Sci. 2016, 94, 169–180. [Google Scholar] [CrossRef]
- Babatunde, O.; Cowieson, A.; Wilson, J.; Adeola, O. Influence of age and duration of feeding low-phosphorus diet on phytase efficacy in broiler chickens during the starter phase. Poult. Sci. 2019, 98, 2588–2597. [Google Scholar] [CrossRef] [PubMed]
- Nelson, T.S. The hydrolysis of phytate phosphorus by chicks and laying hens. Poult. Sci. 1976, 55, 2262–2264. [Google Scholar] [CrossRef] [PubMed]
- Li, W.; Angel, R.; Kim, S.-W.; Brady, K.; Yu, S.; Plumstead, P. Impacts of dietary calcium, phytate, and nonphytate phosphorus concentrations in the presence or absence of phytase on inositol hexakisphosphate (IP6) degradation in different segments of broilers digestive tract. Poult. Sci. 2016, 95, 581–589. [Google Scholar] [CrossRef] [PubMed]
- Orban, J.; Adeola, O.; Stroshine, R. Microbial phytase in finisher diets of White Pekin ducks: Effects on growth performance, plasma phosphorus concentration, and leg bone characteristics. Poult. Sci. 1999, 78, 366–377. [Google Scholar] [CrossRef] [PubMed]
- Selle, P.H.; Cowieson, A.J.; Ravindran, V. Consequences of calcium interactions with phytate and phytase for poultry and pigs. Livest. Sci. 2009, 124, 126–141. [Google Scholar] [CrossRef]
- Walk, C.; Bedford, M.; Santos, T.; Paiva, D.; Bradley, J.; Wladecki, H.; Honaker, C.; McElroy, A. Extra-phosphoric effects of superdoses of a novel microbial phytase. Poult. Sci. 2013, 92, 719–725. [Google Scholar] [CrossRef] [PubMed]
- Tamim, N.M.; Angel, R. Phytate phosphorus hydrolysis as influenced by dietary calcium and micro-mineral source in broiler diets. J. Agric. Food Chem. 2003, 51, 4687–4693. [Google Scholar] [CrossRef] [PubMed]
- Adeola, O. Nutrient management procedures to enhance environmental conditions: An introduction. J. Anim. Sci. 1999, 77, 427–429. [Google Scholar] [CrossRef] [PubMed]
- Maguire, R.O.; Sims, J.T. Soil testing to predict phosphorus leaching. J. Environ. Qual. 2002, 31, 1601–1609. [Google Scholar] [CrossRef] [PubMed]
- Sims, J.; Simard, R.; Joern, B. Phosphorus loss in agricultural drainage: Historical perspective and current research. J. Environ. Qual. 1998, 27, 277–293. [Google Scholar] [CrossRef]
- Denbow, D.; Ravindran, V.; Kornegay, E.; Yi, Z.; Hulet, R. Improving phosphorus availability in soybean meal for broilers by supplemental phytase. Poult. Sci. 1995, 74, 1831–1842. [Google Scholar] [CrossRef] [PubMed]
- Harper, A.; Kornegay, E.; Schell, T. Phytase supplementation of low-phosphorus growing-finishing pig diets improves performance, phosphorus digestibility, and bone mineralization and reduces phosphorus excretion. J. Anim. Sci. 1997, 75, 3174–3186. [Google Scholar] [CrossRef] [PubMed]
- Huff, W.; Moore, P., Jr.; Waldroup, P.; Waldroup, A.; Balog, J.; Huff, G.; Rath, N.; Daniel, T.; Raboy, V. Effect of dietary phytase and high available phosphorus corn on broiler chicken performance. Poult. Sci. 1998, 77, 1899–1904. [Google Scholar] [CrossRef] [PubMed]
- Yi, Z.; Kornegay, E.; Ravindran, V.; Denbow, D. Improving phytate phosphorus availability in corn and soybean meal for broilers using microbial phytase and calculation of phosphorus equivalency values for phytase. Poult. Sci. 1996, 75, 240–249. [Google Scholar] [CrossRef] [PubMed]
- Cowieson, A.; Hruby, M.; Pierson, E.M. Evolving enzyme technology: Impact on commercial poultry nutrition. Nutr. Res. Rev. 2006, 19, 90–103. [Google Scholar] [CrossRef]
- Selle, P.H.; Ravindran, V. Microbial phytase in poultry nutrition. Anim. Feed. Sci. Technol. 2007, 135, 1–41. [Google Scholar] [CrossRef]
- Borda-Molina, D.; Zuber, T.; Siegert, W.; Camarinha-Silva, A.; Feuerstein, D.; Rodehutscord, M. Effects of protease and phytase supplements on small intestinal microbiota and amino acid digestibility in broiler chickens. Poult. Sci. 2019, 98, 2906–2918. [Google Scholar] [CrossRef] [PubMed]
- Zanu, H.; Keerqin, C.; Kheravii, S.; Morgan, N.; Wu, S.; Bedford, M.; Swick, R. Influence of meat and bone meal, phytase, and antibiotics on broiler chickens challenged with subclinical necrotic enteritis: 1. growth performance, intestinal pH, apparent ileal digestibility, cecal microbiota, and tibial mineralization. Poult. Sci. 2020, 99, 1540–1550. [Google Scholar] [CrossRef] [PubMed]
- Kebreab, E.; Hansen, A.V.; Strathe, A.B. Animal production for efficient phosphate utilization: From optimized feed to high efficiency livestock. Curr. Opin. Biotechnol. 2012, 23, 872–877. [Google Scholar] [CrossRef] [PubMed]
- Adeola, O.; Cowieson, A. Board-invited review: Opportunities and challenges in using exogenous enzymes to improve nonruminant animal production. J. Anim. Sci. 2011, 89, 3189–3218. [Google Scholar] [CrossRef] [PubMed]
- Akter, M.; Iji, P.; Graham, H. Increasing zinc levels in phytase-supplemented diets improves the performance and nutrient utilization of broiler chickens. South Afr. J. Anim. Sci. 2017, 47, 648–660. [Google Scholar] [CrossRef]
- Batal, A.; Parsons, C. Effects of age on nutrient digestibility in chicks fed different diets. Poult. Sci. 2002, 81, 400–407. [Google Scholar] [CrossRef] [PubMed]
- Nitsan, Z.; Ben-Avraham, G.; Zoref, Z.; Nir, I. Growth and development of the digestive organs and some enzymes in broiler chicks after hatching. Br. Poult. Sci. 1991, 32, 515–523. [Google Scholar] [CrossRef] [PubMed]
- Perryman, K.; O’Neill, H.M.; Bedford, M.; Dozier III, W. Methodology affects measures of phosphorus availability in growing broilers: Effects of calcium feeding strategy and dietary adaptation period length on true ileal phosphorus digestibility and predicted endogenous phosphorus losses. Poult. Sci. 2017, 96, 611–621. [Google Scholar] [CrossRef] [PubMed]
- Dersjant-Li, Y.; Awati, A.; Schulze, H.; Partridge, G. Phytase in non-ruminant animal nutrition: A critical review on phytase activities in the gastrointestinal tract and influencing factors. J. Sci. Food Agric. 2015, 95, 878–896. [Google Scholar] [CrossRef] [PubMed]
- Broch, J.; dos Santos, E.C.; Damasceno, J.L.; Nesello, P.d.O.; de Souza, C.; Eyng, C.; Pesti, G.M.; Nunes, R.V. Phytase and phytate interactions on broilers’ diet at 21 days of age. J. Appl. Poult. Res. 2020, 29, 240–250. [Google Scholar] [CrossRef]
- Broch, J.; Savaris, V.; Wachholz, L.; Cirilo, E.; Tesser, G.; Pacheco, W.; Eyng, C.; Pesti, G.; Nunes, R. Influence of phytate and phytase on performance, bone, and blood parameters of broilers at 42 days old. South Afr. J. Anim. Sci. 2021, 51, 160–171. [Google Scholar] [CrossRef]
- Campasino, A.; York, T.; Wyatt, C.; Bedford, M.; Dozier III, W. Effect of increasing supplemental phytase concentration in diets fed to Hubbard× Cobb 500 male broilers from 1 to 42 days of age. J. Appl. Poult. Res. 2014, 23, 705–714. [Google Scholar] [CrossRef]
- Cowieson, A.; Acamovic, T.; Bedford, M. Supplementation of corn–soy-based diets with an Eschericia coli-derived phytase: Effects on broiler chick performance and the digestibility of amino acids and metabolizability of minerals and energy. Poult. Sci. 2006, 85, 1389–1397. [Google Scholar] [CrossRef] [PubMed]
- Cowieson, A.; Ptak, A.; Maćkowiak, P.; Sassek, M.; Pruszyńska-Oszmałek, E.; Żyła, K.; Świątkiewicz, S.; Kaczmarek, S.; Józefiak, D. The effect of microbial phytase and myo-inositol on performance and blood biochemistry of broiler chickens fed wheat/corn-based diets. Poult. Sci. 2013, 92, 2124–2134. [Google Scholar] [CrossRef] [PubMed]
- Dersjant-Li, Y.; Abdollahi, M.R.; Bello, A.; Waller, K.; Marchal, L.; Ravindran, V. Effects of a novel consensus bacterial 6-phytase variant on the apparent ileal digestibility of amino acids, total tract phosphorus retention, and tibia ash in young broilers. J. Anim. Sci. 2022, 100, skac037. [Google Scholar] [CrossRef] [PubMed]
- Dessimoni, G.V.; Sakomura, N.K.; Donato, D.C.Z.; Goldflus, F.; Ferreira, N.T.; Dalólio, F.S. Effect of supplementation with Escherichia coli phytase for broilers on performance, nutrient digestibility, minerals in the tibia and diet cost. Semin. Ciências Agrárias 2019, 40, 767–780. [Google Scholar] [CrossRef]
- Gulizia, J.; Rueda, M.; Ovi, F.; Bonilla, S.; Prasad, R.; Jackson, M.; Gutierrez, O.; Pacheco, W. Evaluate the effect of a commercial heat stable phytase on broiler performance, tibia ash, and mineral excretion from 1 to 49 days of age assessed using nutrient reduced diets. J. Appl. Poult. Res. 2022, 31, 100276. [Google Scholar] [CrossRef]
- Khan, S. Meta-Analysis; Springer Nature Singapore Pte Ltd.: Singapore, 2020; Volume 1, p. 15. [Google Scholar]
- Bougouin, A.; Appuhamy, J.; Kebreab, E.; Dijkstra, J.; Kwakkel, R.; France, J. Effects of phytase supplementation on phosphorus retention in broilers and layers: A meta-analysis. Poult. Sci. 2014, 93, 1981–1992. [Google Scholar] [CrossRef] [PubMed]
- Faridi, A.; Gitoee, A.; France, J. A meta-analysis of the effects of nonphytate phosphorus on broiler performance and tibia ash concentration. Poult. Sci. 2015, 94, 2753–2762. [Google Scholar] [CrossRef]
- Kermani, Z.A.; Taheri, H.; Faridi, A.; Shahir, M.; Baradaran, N. Interactive effects of calcium, vitamin D3, and exogenous phytase on phosphorus utilization in male broiler chickens from 1 to 21 days post-hatch: A meta-analysis approach. Anim. Feed Sci. Technol. 2023, 295, 115525. [Google Scholar] [CrossRef]
- Letourneau-Montminy, M.-P.; Narcy, A.; Lescoat, P.; Bernier, J.; Magnin, M.; Pomar, C.; Nys, Y.; Sauvant, D.; Jondreville, C. Meta-analysis of phosphorus utilization by broilers receiving corn-soyabean meal diets: Influence of dietary calcium and microbial phytase. Animal 2010, 4, 1844–1853. [Google Scholar] [CrossRef] [PubMed]
- Shi, H.; Wang, J.; Kim, W.K. Interactive effects of calcium, phosphorus, and exogenous phytase on growth performance and bone ash in broilers under Eimeria or necrotic enteritis infections: A systemic review and meta-analysis. J. Appl. Poult. Res. 2024, 100422. [Google Scholar] [CrossRef]
- Schmid, C.H.; Stijnen, T.; White, I. Handbook of Meta-Analysis; CRC Press: Boca Raton, FL, USA, 2020. [Google Scholar]
- Page, M.J.; McKenzie, J.E.; Bossuyt, P.M.; Boutron, I.; Hoffmann, T.C.; Mulrow, C.D.; Shamseer, L.; Tetzlaff, J.M.; Akl, E.A.; Brennan, S.E. The PRISMA 2020 statement: An updated guideline for reporting systematic reviews. Int. J. Surg. 2021, 88, 105906. [Google Scholar] [CrossRef] [PubMed]
- Hooijmans, C.R.; Rovers, M.M.; De Vries, R.B.; Leenaars, M.; Ritskes-Hoitinga, M.; Langendam, M.W. SYRCLE’s risk of bias tool for animal studies. BMC Med. Res. Methodol. 2014, 14, 43. [Google Scholar] [CrossRef] [PubMed]
- Fleiss, J.L. Review papers: The statistical basis of meta-analysis. Stat. Methods Med. Res. 1993, 2, 121–145. [Google Scholar] [CrossRef] [PubMed]
- Riley, R.D.; Higgins, J.P.; Deeks, J.J. Interpretation of random effects meta-analyses. BMJ 2011, 342, d549. [Google Scholar] [CrossRef] [PubMed]
- Egger, M.; Davey Smith, G. Principles and procedures. In Systematic Reviews in Health Care: Meta-Analysis in Context; BMJ Books: London, UK, 2001. [Google Scholar]
- Borenstein, M.; Higgins, J.P.; Hedges, L.V.; Rothstein, H.R. Basics of meta-analysis: I2 is not an absolute measure of heterogeneity. Res. Synth. Methods 2017, 8, 5–18. [Google Scholar] [CrossRef] [PubMed]
- Ajuwon, K.M.; Sommerfeld, V.; Paul, V.; Däuber, M.; Schollenberger, M.; Kühn, I.; Adeola, O.; Rodehutscord, M. Phytase dosing affects phytate degradation and Muc2 transporter gene expression in broiler starters. Poult. Sci. 2020, 99, 981–991. [Google Scholar] [CrossRef] [PubMed]
- Bello, A.; Dersjant-Li, Y.; Korver, D. The efficacy of 2 phytases on inositol phosphate degradation in different segments of the gastrointestinal tract, calcium and phosphorus digestibility, and bone quality of broilers. Poult. Sci. 2019, 98, 5789–5800. [Google Scholar] [CrossRef] [PubMed]
- Borda-Molina, D.; Vital, M.; Sommerfeld, V.; Rodehutscord, M.; Camarinha-Silva, A. Insights into broilers’ gut microbiota fed with phosphorus, calcium, and phytase supplemented diets. Front. Microbiol. 2016, 7, 228625. [Google Scholar] [CrossRef] [PubMed]
- Bowen, K.; Jackson, M.; Ayres, V.; Boltz, T.; Lynch, E.; Moritz, J. Performance, carcass quality, tibia ash, and mineral digestibility responses of Ross 708 broilers to increasing dose of two commercially available mixer-added phytases. J. Appl. Poult. Res. 2022, 31, 100264. [Google Scholar] [CrossRef]
- Broch, J.; Nunes, R.V.; Eyng, C.; Pesti, G.M.; de Souza, C.; Sangalli, G.G.; Fascina, V.; Teixeira, L. High levels of dietary phytase improves broiler performance. Anim. Feed Sci. Technol. 2018, 244, 56–65. [Google Scholar] [CrossRef]
- Dersjant-Li, Y.; Archer, G.; Stiewert, A.; Brown, A.; Sobotik, E.; Jasek, A.; Marchal, L.; Bello, A.; Sorg, R.; Christensen, T. Functionality of a next generation biosynthetic bacterial 6-phytase in enhancing phosphorus availability to broilers fed a corn-soybean meal-based diet. Anim. Feed Sci. Technol. 2020, 264, 114481. [Google Scholar] [CrossRef]
- Ennis, C.; Gehring, C.; Bedford, M.; Wyatt, C.; Wamsley, K. Strategies to determine the efficacy of multiple phytase use at low activities using Ross x Ross 708 male broilers from 0 to 14 d. J. Appl. Poult. Res. 2020, 29, 977–994. [Google Scholar] [CrossRef]
- Gehring, C.; Bedford, M.; Dozier III, W. Effects of step-up and step-down phytase regimens on performance and processing yields of male broilers from 1 to 35 d of age. J. Appl. Poult. Res. 2014, 23, 252–259. [Google Scholar] [CrossRef]
- Ghahri, H.; Rostami, D.; Zandiyeh, M.A.; Abbasi, R.H. The effects of phytase on performance, serum mineral levels, enzyme activities and immune function of broilers fed nutritionally marginal diets. Middle East J. Sci. Res. 2012, 11, 1481–1490. [Google Scholar]
- Hernandez, J.R.; Gulizia, J.P.; Adkins, J.B.; Rueda, M.S.; Haruna, S.I.; Pacheco, W.J.; Downs, K.M. Effect of Phytase Level and Form on Broiler Performance, Tibia Characteristics, and Residual Fecal Phytate Phosphorus in Broilers from 1 to 21 Days of Age. Animals 2022, 12, 1952. [Google Scholar] [CrossRef]
- Houshyar, M.; Saki, A.A.; Alikhani, M.Y.; Bedford, M.R.; Soleimani, M.; Kamarehei, F. Approaches to determine the efficiency of novel 3-phytase from Klebsiella pneumoniae and commercial phytase in broilers from 1 to 14 d of age. Poult. Sci. 2023, 102, 103014. [Google Scholar] [CrossRef] [PubMed]
- Javadi, M.; Cerisuelo, A.; Cambra-López, M.; Macías-Vidal, J.; Donadeu, A.; Dupuy, J.; Carpintero, L.; Ferrer, P.; Pascual, J.J. The Duration of the Trial Influences the Effects of Mineral Deficiency and the Effective Phytase Dose in Broilers’ Diets. Animals 2022, 12, 1418. [Google Scholar] [CrossRef] [PubMed]
- Jlali, M.; Kidd, M.T.; Cozannet, P.; Yavuz, B.; Preynat, A. Efficacy of a new biosynthetic 6-phytase in broilers on phosphorus balance and growth efficiency. Anim. Feed Sci. Technol. 2024, 309, 115886. [Google Scholar] [CrossRef]
- Józefiak, D.; Ptak, A.; Kaczmarek, S.; Maćkowiak, P.; Sassek, M.; Slominski, B. Multi-carbohydrase and phytase supplementation improves growth performance and liver insulin receptor sensitivity in broiler chickens fed diets containing full-fat rapeseed. Poult. Sci. 2010, 89, 1939–1946. [Google Scholar] [CrossRef] [PubMed]
- Karami, M.; Karimi, A.; Sadeghi, A.; Zentek, J.; Goodarzi Boroojeni, F. Evaluation of interactive effects of phytase and benzoic acid supplementation on performance, nutrients digestibility, tibia mineralisation, gut morphology and serum traits in male broiler chickens. Ital. J. Anim. Sci. 2020, 19, 1428–1438. [Google Scholar] [CrossRef]
- Kiarie, E.; Woyengo, T.; Nyachoti, C. Efficacy of new 6-phytase from Buttiauxella spp. on growth performance and nutrient retention in broiler chickens fed corn soybean meal-based diets. Asian-Australas. J. Anim. Sci. 2015, 28, 1479. [Google Scholar] [CrossRef] [PubMed]
- Kriseldi, R.; Walk, C.; Bedford, M.; Dozier III, W. Inositol and gradient phytase supplementation in broiler diets during a 6-week production period: 1. effects on growth performance and meat yield. Poult. Sci. 2021, 100, 964–972. [Google Scholar] [CrossRef] [PubMed]
- Kwon, C.; Lee, J.; Kim, D.; Kil, D.Y. Determination and validation of available phosphorus equivalency of Escherichia coli-derived phytase in broiler diets. J. Appl. Poult. Res. 2022, 31, 100298. [Google Scholar] [CrossRef]
- Liu, S.Y.; Cowieson, A.J.; Selle, P.H. The influence of meat-and-bone meal and exogenous phytase on growth performance, bone mineralisation and digestibility coefficients of protein (N), amino acids and starch in broiler chickens. Anim. Nutr. 2016, 2, 86–92. [Google Scholar] [CrossRef] [PubMed]
- Moita, V.H.C.; Duarte, M.E.; Kim, S.W. Supplemental effects of phytase on modulation of mucosa-associated microbiota in the jejunum and the impacts on nutrient digestibility, intestinal morphology, and bone parameters in broiler chickens. Animals 2021, 11, 3351. [Google Scholar] [CrossRef] [PubMed]
- Powell, S.; Johnston, S.; Gaston, L.; Southern, L. The effect of dietary phosphorus level and phytase supplementation on growth performance, bone-breaking strength, and litter phosphorus concentration in broilers. Poult. Sci. 2008, 87, 949–957. [Google Scholar] [CrossRef] [PubMed]
- Ptak, A.; Józefiak, D.; Kierończyk, B.; Rawski, M.; Żyła, K.; Świątkiewicz, S. Effect of different phytases on the performance, nutrient retention and tibia composition in broiler chickens. Arch. Anim. Breed. 2013, 56, 1028–1038. [Google Scholar] [CrossRef]
- Ptak, A.; Bedford, M.R.; Świątkiewicz, S.; Żyła, K.; Jozefiak, D. Phytase modulates ileal microbiota and enhances growth performance of the broiler chickens. PLoS ONE 2015, 10, e0119770. [Google Scholar] [CrossRef]
- Shang, Y.; Rogiewicz, A.; Patterson, R.; Slominski, B.; Kim, W. The effect of phytase and fructooligosaccharide supplementation on growth performance, bone quality, and phosphorus utilization in broiler chickens. Poult. Sci. 2015, 94, 955–964. [Google Scholar] [CrossRef] [PubMed]
- Shi, H.; Wang, J.; White, D.; Martinez, O.J.T.; Kim, W.K. Impacts of phytase and coccidial vaccine on growth performance, nutrient digestibility, bone development, and intestinal gene expression of broilers fed a nutrient reduced diet. Poult. Sci. 2023, 102, 103062. [Google Scholar] [CrossRef] [PubMed]
- Walk, C.; Bedford, M.; Olukosi, O. Effect of phytase on growth performance, phytate degradation and gene expression of myo-inositol transporters in the small intestine, liver and kidney of 21 day old broilers. Poult. Sci. 2018, 97, 1155–1162. [Google Scholar] [CrossRef] [PubMed]
- Walk, C.; Olukosi, O. Influence of graded concentrations of phytase in high-phytate diets on growth performance, apparent ileal amino acid digestibility, and phytate concentration in broilers from hatch to 28 D post-hatch. Poult. Sci. 2019, 98, 3884–3893. [Google Scholar] [CrossRef] [PubMed]
- Walk, C.; Poernama, F. Evaluation of phytase, xylanase, and protease in reduced nutrient diets fed to broilers. J. Appl. Poult. Res. 2019, 28, 85–93. [Google Scholar] [CrossRef]
- Walk, C.; Santos, T.; Bedford, M. Influence of superdoses of a novel microbial phytase on growth performance, tibia ash, and gizzard phytate and inositol in young broilers. Poult. Sci. 2014, 93, 1172–1177. [Google Scholar] [CrossRef]
- Woyengo, T.; Slominski, B.; Jones, R. Growth performance and nutrient utilization of broiler chickens fed diets supplemented with phytase alone or in combination with citric acid and multicarbohydrase. Poult. Sci. 2010, 89, 2221–2229. [Google Scholar] [CrossRef] [PubMed]
- Zhang, Q.; Walk, C.L.; Sorbara, J.-O.B.; Cowieson, A.J.; Stamatopoulos, K. Comparative effects of two phytases on growth performance, bone mineralization, nutrient digestibility and phytate-P hydrolysis of broilers. J. Appl. Poult. Res. 2022, 3, 100247. [Google Scholar] [CrossRef]
- Egger, M.; Smith, G.D.; Schneider, M.; Minder, C. Bias in meta-analysis detected by a simple, graphical test. BMJ 1997, 315, 629–634. [Google Scholar] [CrossRef] [PubMed]
- Duval, S.; Tweedie, R. A nonparametric “trim and fill” method of accounting for publication bias in meta-analysis. J. Am. Stat. Assoc. 2000, 95, 89–98. [Google Scholar]
- Nuamah, E.; Poaty Ditengou, J.I.C.; Hirwa, F.; Cheon, I.; Chae, B.; Choi, N.-J. Dietary Supplementation of Tannins: Effect on Growth Performance, Serum Antioxidant Capacity, and Immunoglobins of Weaned Piglets—A Systematic Review with Meta-Analysis. Antioxidants 2024, 13, 236. [Google Scholar] [CrossRef] [PubMed]
- Borenstein, M.; Hedges, L.V.; Higgins, J.P.; Rothstein, H.R. Introduction to Meta-Analysis; John Wiley & Sons: Hoboken, NJ, USA, 2011. [Google Scholar]
- Higgins, J.P.; Green, S. Cochrane Handbook for Systematic Reviews of Interventions; Wiley: Hoboken, NJ, USA, 2008. [Google Scholar]
- Engelen, A.J.; Van Der Heeft, F.C.; Randsdorp, P.H.; Smtt, E.L. Simple and rapid determination of phytase activity. J. AOAC Int. 1994, 77, 760–764. [Google Scholar] [CrossRef] [PubMed]
- Macleod, M.R.; Fisher, M.; O’collins, V.; Sena, E.S.; Dirnagl, U.; Bath, P.M.; Buchan, A.; Van Der Worp, H.B.; Traystman, R.; Minematsu, K. Good laboratory practice: Preventing introduction of bias at the bench. Stroke 2009, 40, e50–e52. [Google Scholar] [CrossRef] [PubMed]
- Kilkenny, C.; Parsons, N.; Kadyszewski, E.; Festing, M.F.; Cuthill, I.C.; Fry, D.; Hutton, J.; Altman, D.G. Survey of the quality of experimental design, statistical analysis and reporting of research using animals. PLoS ONE 2009, 4, e7824. [Google Scholar] [CrossRef] [PubMed]
- Ncho, C.M.; Kim, S.-H.; Rang, S.A.; Lee, S.S. A Meta-analysis of probiotic interventions to mitigate ruminal methane emissions in cattle: Implications for sustainable livestock farming. Animal 2024, 18, 101180. [Google Scholar] [CrossRef] [PubMed]
- Dilger, R.; Onyango, E.; Sands, J.; Adeola, O. Evaluation of microbial phytase in broiler diets. Poult. Sci. 2004, 83, 962–970. [Google Scholar] [CrossRef] [PubMed]
- Onyango, E.; Bedford, M.; Adeola, O. Efficacy of an evolved Escherichia coli phytase in diets of broiler chicks. Poult. Sci. 2005, 84, 248–255. [Google Scholar] [CrossRef] [PubMed]
- Paiva, D.; Walk, C.; McElroy, A. Dietary calcium, phosphorus, and phytase effects on bird performance, intestinal morphology, mineral digestibility, and bone ash during a natural necrotic enteritis episode. Poult. Sci. 2014, 93, 2752–2762. [Google Scholar] [CrossRef] [PubMed]
- Proszkowiec-Weglarz, M.; Angel, R. Calcium and phosphorus metabolism in broilers: Effect of homeostatic mechanism on calcium and phosphorus digestibility. J. Appl. Poult. Res. 2013, 22, 609–627. [Google Scholar] [CrossRef]
- Olukosi, O.A.; Cowieson, A.J.; Adeola, O. Energy utilization and growth performance of broilers receiving diets supplemented with enzymes containing carbohydrase or phytase activity individually or in combination. Br. J. Nutr. 2008, 99, 682–690. [Google Scholar] [CrossRef] [PubMed]
- Pirgozliev, V.; Bedford, M.; Acamovic, T.; Mares, P.; Allymehr, M. The effects of supplementary bacterial phytase on dietary energy and total tract amino acid digestibility when fed to young chickens. Br. Poult. Sci. 2011, 52, 245–254. [Google Scholar] [CrossRef] [PubMed]
- Akyurek, H.; Ozduven, M.L.; Okur, A.A.; Koc, F.; Samli, H.E. The effects of supplementing an organic acid blend and/or microbial phytase to a corn-soybean based diet fed to broiler chickens. Afr. J. Agric. Res. 2011, 6, 642–649. [Google Scholar]
- Cowieson, A.; Wilcock, P.; Bedford, M. Super-dosing effects of phytase in poultry and other monogastrics. World’s Poult. Sci. J. 2011, 67, 225–236. [Google Scholar] [CrossRef]
- Liu, N.; Ru, Y.; Cowieson, A.; Li, F.; Cheng, X.C. Effects of phytate and phytase on the performance and immune function of broilers fed nutritionally marginal diets. Poult. Sci. 2008, 87, 1105–1111. [Google Scholar] [CrossRef] [PubMed]
- Tamim, N.; Angel, R.; Christman, M. Influence of dietary calcium and phytase on phytate phosphorus hydrolysis in broiler chickens. Poult. Sci. 2004, 83, 1358–1367. [Google Scholar] [CrossRef] [PubMed]
- Gifford, S.R.; Clydesdale, F.M. Interactions among calcium, zinc and phytate with three protein sources. J. Food Sci. 1990, 55, 1720–1724. [Google Scholar] [CrossRef]
- Mohammed, A.; Gibney, M.; Taylor, T. The effects of dietary levels of inorganic phosphorus, calcium and cholecalciferol on the digestibility of phytate-P by the chick. Br. J. Nutr. 1991, 66, 251–259. [Google Scholar] [CrossRef] [PubMed]
- Scheideler, S.E.; Sell, J. Utilization of phytate phosphorus in laying hens as influenced by dietary phosphorus and calcium. Nutr. Rep. Int. 1987, 35, 1073–1081. [Google Scholar]
- Singh, P. Significance of phytic acid and supplemental phytase in chicken nutrition: A review. World’s Poult. Sci. J. 2008, 64, 553–580. [Google Scholar] [CrossRef]
- Santos, F.; Hruby, M.; Pierson, E.; Remus, J.; Sakomura, N. Effect of phytase supplementation in diets on nutrient digestibility and performance in broiler chicks. J. Appl. Poult. Res. 2008, 17, 191–201. [Google Scholar] [CrossRef]
- Viveros, A.; Brenes, A.; Arija, I.; Centeno, C. Effects of microbial phytase supplementation on mineral utilization and serum enzyme activities in broiler chicks fed different levels of phosphorus. Poult. Sci. 2002, 81, 1172–1183. [Google Scholar] [CrossRef] [PubMed]
- Watson, B.; Matthews, J.; Southern, L.; Shelton, J. The effects of phytase on growth performance and intestinal transit time of broilers fed nutritionally adequate diets and diets deficient in calcium and phosphorus. Poult. Sci. 2006, 85, 493–497. [Google Scholar] [CrossRef] [PubMed]
- Selle, P.; Ravindran, V.; Caldwell, A.; Bryden, W. Phytate and phytase: Consequences for protein utilisation. Nutr. Res. Rev. 2000, 13, 255–278. [Google Scholar] [CrossRef] [PubMed]
- Amerah, A.; Plumstead, P.; Barnard, L.; Kumar, A. Effect of calcium level and phytase addition on ileal phytate degradation and amino acid digestibility of broilers fed corn-based diets. Poult. Sci. 2014, 93, 906–915. [Google Scholar] [CrossRef] [PubMed]
- Sibbald, I.R.; Wolynetz, M.S. Comparison of three methods of excreta collection used in estimation of energy and nitrogen excretion. Poult. Sci. 1986, 65, 78–84. [Google Scholar] [CrossRef]
- Humer, E.; Schwarz, C.; Schedle, K. Phytate in pig and poultry nutrition. J. Anim. Physiol. Anim. Nutr. 2015, 99, 605–625. [Google Scholar] [CrossRef] [PubMed]
- Abd El-Hack, M.E.; Alagawany, M.; Arif, M.; Emam, M.; Saeed, M.; Arain, M.A.; Siyal, F.A.; Patra, A.; Elnesr, S.S.; Khan, R.U. The uses of microbial phytase as a feed additive in poultry nutrition–A review. Ann. Anim. Sci. 2018, 18, 639–658. [Google Scholar] [CrossRef]
- Huber, K.; Zeller, E.; Rodehutscord, M. Modulation of small intestinal phosphate transporter by dietary supplements of mineral phosphorus and phytase in broilers. Poult. Sci. 2015, 94, 1009–1017. [Google Scholar] [CrossRef] [PubMed]
- Lee, S.; Bedford, M. Inositol-An effective growth promotor? World’s Poult. Sci. J. 2016, 72, 743–760. [Google Scholar] [CrossRef]
- El Enshasy, H.; Dailin, D.J.; Abd Manas, N.H.; Azlee, N.İ.W.; Eyahmalay, J.; Yahaya, S.A.; Abd Malek, R.; Siwapiragam, V.; Sukmawati, D. Current and future applications of phytases in poultry industry: A critical review. J. Adv. VetBio Sci. Tech. 2018, 3, 65–74. [Google Scholar] [CrossRef]
- Edwards, H.M., Jr.; Palo, P.; Sooncharernying, S.; Elliot, M. Factors influencing the bioavailability of phytate phosphorus to chickens. In Nutrient Availability: Chemical and Biological Aspects; Southgate, D., Johnson, I., Fenwick, G.R., Eds.; The Royal Society of Chemistry Publ.: Cambridge, UK, 1989; pp. 271–276. [Google Scholar]
- Peeler, H. Biological availability of nutrients in feeds: Availability of major mineral ions. J. Anim. Sci. 1972, 35, 695–712. [Google Scholar] [CrossRef] [PubMed]
- Abudabos, A.M. Intestinal phytase activity in chickens (Gallus domesticus). Afr. J. Microbiol. Res 2012, 6, 4932–4938. [Google Scholar]
- Sebola, N.; Mlambo, V.; Mokoboki, H.; Muchenje, V. Growth performance and carcass characteristics of three chicken strains in response to incremental levels of dietary Moringa oleifera leaf meal. Livest. Sci. 2015, 178, 202–208. [Google Scholar] [CrossRef]
- Ravindran, V.; Bryden, W.; Kornegay, E. Phytates: Occurrence, bioavailability and implications in poultry nutrition. Poult. Avian Biol. Rev. 1995, 6, 125–143. [Google Scholar]
- Ravindran, V.; Selle, P.; Bryden, W. Effects of phytase supplementation, individually and in combination, with glycanase, on the nutritive value of wheat and barley. Poult. Sci. 1999, 78, 1588–1595. [Google Scholar] [CrossRef] [PubMed]
- Li, W.; Angel, R.; Kim, S.-W.; Jiménez-Moreno, E.; Proszkowiec-Weglarz, M.; Plumstead, P. Age and adaptation to Ca and P deficiencies: 2. Impacts on amino acid digestibility and phytase efficacy in broilers. Poult. Sci. 2015, 94, 2917–2931. [Google Scholar] [CrossRef] [PubMed]
- Li, W.; Angel, R.; Kim, S.-W.; Jiménez-Moreno, E.; Proszkowiec-Weglarz, M.; Plumstead, P. Impacts of age and calcium on phytase efficacy in broiler chickens. Anim. Feed Sci. Technol. 2018, 238, 9–17. [Google Scholar] [CrossRef]
- Yan, F.; Angel, R.; Ashwell, C.; Mitchell, A.; Christman, M. Evaluation of the broiler’s ability to adapt to an early moderate deficiency of phosphorus and calcium. Poult. Sci. 2005, 84, 1232–1241. [Google Scholar] [CrossRef] [PubMed]
- Shastak, Y.; Rodehutscord, M. Determination and estimation of phosphorus availability in growing poultry and their historical development. World’s Poult. Sci. J. 2013, 69, 569–586. [Google Scholar] [CrossRef]
- Pereira, R.; Menten, J.; Romano, G.; Silva, C.; Zavarize, K.; Barbosa, N. Efficiency of a bacterial phytase to release phytate phosphorus in broiler chicken diets. Arq. Bras. De Med. Veterinária E Zootec. 2012, 64, 137–144. [Google Scholar] [CrossRef]
- Gautier, A.; Walk, C.; Dilger, R. Effects of a high level of phytase on broiler performance, bone ash, phosphorus utilization, and phytate dephosphorylation to inositol. Poult. Sci. 2018, 97, 211–218. [Google Scholar] [CrossRef] [PubMed]
- Moss, A.F.; Chrystal, P.; Dersjant-Li, Y.; Liu, S.; Selle, P. The ranked importance of dietary factors influencing the performance of broiler chickens offered phytase-supplemented diets by the Plackett-Burman screening design. Br. Poult. Sci. 2019, 60, 439–448. [Google Scholar] [CrossRef] [PubMed]
- Sacakli, P.; Sehu, A.; Ergun, A.; Genc, B.; Selcuk, Z. The effect of phytase and organic acid on growth performance, carcass yield and tibia ash in quails fed diets with low levels of non-phytate phosphorus. Asian-Australas. J. Anim. Sci. 2006, 19, 198–202. [Google Scholar] [CrossRef]
- Karimi, A.; Bedford, M.; Sadeghi, G.; Ghobadi, Z. Influence of dietary non-phytate phosphorous levels and phytase supplementation on the performance and bone characteristics of broilers. Braz. J. Poult. Sci. 2011, 13, 43–51. [Google Scholar] [CrossRef]
- Talaty, P.; Katanbaf, M.; Hester, P. Life cycle changes in bone mineralization and bone size traits of commercial broilers. Poult. Sci. 2009, 88, 1070–1077. [Google Scholar] [CrossRef] [PubMed]
- WPSA. Mineral requirements for poultry- mineral requirements and recommendations for growing birds. World’s Poult. Sci. J. 1985, 41, 252–258. [Google Scholar] [CrossRef]
- Rath, N.; Huff, G.; Huff, W.; Balog, J. Factors regulating bone maturity and strength in poultry. Poult. Sci. 2000, 79, 1024–1032. [Google Scholar] [CrossRef] [PubMed]
- Olukosi, O.; Kong, C.; Fru-Nji, F.; Ajuwon, K.; Adeola, O. Assessment of a bacterial 6-phytase in the diets of broiler chickens. Poult. Sci. 2013, 92, 2101–2108. [Google Scholar] [CrossRef] [PubMed]
- Fernandes, J.; Horn, D.; Ronconi, E.; Buzim, R.; Lima, F.; Pazdiora, D. Effects of phytase superdosing on digestibility and bone integrity of broilers. J. Appl. Poult. Res. 2019, 28, 390–398. [Google Scholar] [CrossRef]

| Starter Phase (1–22 Days) | Grower-Finisher Phase (22–42) | |||||||
|---|---|---|---|---|---|---|---|---|
| Variable | Mean | SEM | Minimum | Maximum | Mean | SEM | Minimum | Maximum |
| Crude Protein, % of DM | 21.91 | 0.22 | 19.40 | 26.33 | 20.48 | 0.47 | 17.80 | 23.00 |
| Metabolizable energy (MJ/kg) | 12.44 | 0.24 | 11.97 | 14.10 | 12.82 | 0.15 | 12.18 | 13.34 |
| Digestible Met + Cys, % of DM | 0.92 | 0.02 | 0.77 | 1.19 | 0.80 | 0.05 | 0.65 | 0.86 |
| Digestible Lysine, % of DM | 1.11 | 0.05 | 0.10 | 1.42 | 0.81 | 0.19 | 0.10 | 1.19 |
| Digestible Thr, % of DM | 0.78 | 0.01 | 0.63 | 0.89 | 0.71 | 0.03 | 0.6175 | 0.76 |
| Digestible Val, % of DM | 0.93 | 0.04 | 0.77 | 1.30 | 0.86 | 0.10 | 0.76 | 1.05 |
| Available Phosphorus, % of DM | 0.26 | 0.01 | 0.10 | 0.35 | 0.21 | 0.03 | 0.17 | 0.29 |
| Total P, % of DM | 0.53 | 0.01 | 0.36 | 0.65 | 0.47 | 0.04 | 0.41 | 0.60 |
| Calcium, % of DM | 0.74 | 0.02 | 0.40 | 0.95 | 0.64 | 0.04 | 0.47 | 0.74 |
| NPP, % of DM | 0.30 | 0.02 | 0.20 | 0.43 | 0.30 | 0.04 | 0.21 | 0.42 |
| Phytase dosage (FTU per Kg of diet) | 1709 | 397 | 120 | 40,500 | 876 | 153 | 250 | 5000 |
| Supplementation Duration, day | 16 | 0.68 | 6.00 | 22.00 | 20 | 1.48 | 10.00 | 33.00 |
| Random Effects Model | Heterogeneity | Egger’s Test b | |||||||
|---|---|---|---|---|---|---|---|---|---|
| Parameter | n(NC) | SMD | 95% CI | p-Value | Chi-Squared (Q) | I2 (%) | τ2 | p-Value a | p-Value |
| Starter Phase (1–22 days) | |||||||||
| ADFI, g/day | 38(97) | 12.57 | 6.61, 18.54 | <0.0001 | 25,654.46 | 99.6 | 895.47 | 0.000 | <0.0001 |
| ADG, g/day | 6(13) | 11.31 | 4.85, 17.76 | 0.0006 | 22,789.26 | 99.8 | 140.72 | 0.000 | <0.0001 |
| BWG, g | 38(96) | 10.76 | 8.13, 13.78 | <0.0001 | 22,789.26 | 99.6 | 171.11 | 0.000 | <0.0001 |
| FCR, g/g | 33(90) | −8.99 | −12.59, −5.39 | <0.0001 | 18,235.57 | 99.5 | 300.91 | 0.000 | <0.0001 |
| Grower-Finisher Phase (22–42 days) | |||||||||
| ADFI, g/day | 11(26) | 47.35 | 10.27, 84.42 | 0.0123 | 7353.11 | 99.7 | 9285.23 | 0.000 | <0.0001 |
| ADG, g/day | 3(9) | 7.78 | −0.63, 16.19 | 0.0699 | 2676.45 | 99.7 | 165.52 | 0.000 | <0.0001 |
| BWG, g | 11(22) | 7.67 | 3.62, 11.73 | 0.0002 | 5297.35 | 99.6 | 93.53 | 0.000 | 0.0118 |
| FCR, g/g | 11(24) | −4.30 | −6.38, −2.21 | <0.0001 | 4387.11 | 99.5 | 26.65 | 0.000 | 0.0030 |
| Random Effects Model | Heterogeneity | Egger’s Test b | |||||||
|---|---|---|---|---|---|---|---|---|---|
| Parameter | n(NC) | SMD | 95% CI | p-Value | Chi-Squared (Q) | I2 (%) | τ2 | p-Value a | p-Value |
| Starter Phase (1–22 days) | |||||||||
| BBS, Kgf/mm | 4(17) | 4.68 | 2.81, 6.54 | <0.0001 | 225.00 | 92.9 | 14.41 | <0.0001 | <0.0001 |
| Tibia Ash, g/Kg DM | 16(51) | 11.78 | 8.65, 14.92 | <0.0001 | 7144.72 | 99.3 | 125.08 | 0.000 | <0.0001 |
| Tibia Ca, g/Kg DM | 4(17) | 4.35 | 0.64, 8.06 | 0.0217 | 550.00 | 97.1 | 59.77 | <0.0001 | 0.0030 |
| Tibia P, g/Kg DM | 4(18) | 5.26 | 1.87, 8.65 | 0.0024 | 862.39 | 98.0 | 52.72 | <0.0001 | 0.0089 |
| Grower-Finisher Phase (22–42 days) | |||||||||
| BBS, Kgf/mm | 3(11) | 4.33 | 2.59, 6.08 | <0.0001 | 191.72 | 94.8 | 7.92 | <0.0001 | 0.0013 |
| Tibia Ash, g/Kg DM | 6(21) | 5.88 | 3.13, 8.62 | <0.0001 | 716.64 | 97.2 | 39.13 | <0.0001 | 0.0005 |
| Tibia Ca, g/Kg DM | 4(13) | 4.94 | 1.51, 8.36 | 0.0047 | 179.30 | 93.3 | 37.63 | <0.0001 | <0.0001 |
| Tibia P, g/Kg DM | 4(13) | 5.72 | 1.86, 9.57 | 0.0036 | 229.97 | 94.8 | 47.75 | <0.0001 | 0.0002 |
| Random Effects Model | |||||
|---|---|---|---|---|---|
| Parameter | NC | d.f. | SMD b | 95% CI | p-Value c |
| Starter Phase (1–22 days) | |||||
| ADFI, g/d | 131 | 130 | 1.6779 | −5.04, 8.40 | 0.6244 |
| ADG, g/d | 18 | 17 | 1.8716 | −6.79, 10.53 | 0.6718 |
| BWG, g | 137 | 136 | 3.3592 | 0.31, 6.41 | 0.0307 |
| FCR, g/g | 124 | 123 | −2.0180 | −6.15, 2.11 | 0.3383 |
| BBS, Kgf/mm | 24 | 23 | 1.8186 | −0.59, 4.23 | 0.1387 |
| Tibia Ash, g/Kg DM | 74 | 73 | 2.0083 | −2.63, 6.65 | 0.3959 |
| Tibia Ca, g/Kg DM | 22 | 21 | 1.0343 | −2.93, 5.00 | 0.6093 |
| Tibia P, g/Kg DM | 24 | 23 | 0.9147 | −3.12, 4.95 | 0.6568 |
| Grower-Finisher Phase (22–42 days) | |||||
| ADFI, g/d | 35 | 34 | 1.1746 | −42.28, 44.62 | 0.9577 |
| ADG, g/d | 11 | 10 | 1.4517 | −9.31, 12.22 | 0.7916 |
| BWG, g | 29 | 28 | 2.0851 | −2.88, 7.05 | 0.4104 |
| FCR, g/g | 30 | 29 | −1.6657 | −4.26, 0.92 | −1.6657 |
| BBS, Kgf/mm | 16 | 15 | 2.2862 | 0.19, 4.38 | 0.0324 |
| Tibia Ash, g/Kg DM | 28 | 27 | 2.1719 | −1.74, 6.08 | 0.2761 |
| Tibia Ca, g/Kg DM | 16 | 15 | 1.7751 | −2.89, 6.44 | 0.4555 |
| Tibia P, g/Kg DM | 18 | 17 | 0.6856 | −4.28, 5.65 | 0.7868 |
| Random Effects Model | ||||||||
|---|---|---|---|---|---|---|---|---|
| Parameter | Covariate: Strain | NC | I2, % | SMD (95% CI) | τ2 | d.f | Q | p-Value a |
| Starter Phase (1–22 days) | ||||||||
| ADFI, g/d | Ross 308 | 41 | 99.4 | 5.61 (3.67, 7.55) | 39.71 | 10 | 737.59 | <0.0001 |
| Ross 708 | 6 | 98.8 | 1.35 (0.60, 2.09) | 0.86 | ||||
| Cobb 500 | 19 | 99.6 | 11.54 (5.09, 18.00) | 205.46 | ||||
| Hubbard × Cobb 500 | 4 | 83.4 | 151.73 (138.71, 164.75) | 146.01 | ||||
| Ross | 10 | 99.4 | 1.83 (−1.36, 5.02) | 26.32 | ||||
| Ross × Ross 708 | 5 | 99.6 | 1.70 (−1.51, 4.92) | 13.45 | ||||
| Ross 708 × YPM | 3 | 98.8 | 35.12 (23.05, 47.31) | 113.55 | ||||
| Yield Plus × Ross 708 | 5 | 99.6 | 2.56 (0.90, 4.23) | 3.60 | ||||
| Lohman Indian RSR | 2 | 96.1 | 11.54 (9.48, 13.60) | 2.12 | ||||
| ADG, g/d | Ross 308 | 6 | 99.9 | 15.52 (5.14, 25.91) | 168.09 | 3 | 264.88 | <0.0001 |
| Cobb 500 | 3 | 89.6 | 18.65 (16.23, 21.06) | 4.10 | ||||
| Ross | 3 | 99.4 | −0.31 (−3.06, 2.43) | 5.85 | ||||
| BWG, g | Ross 308 | 43 | 99.4 | 7.67 (5.26, 9.72) | 46.42 | 10 | 1122.71 | <0.0001 |
| Ross 708 | 6 | 96.0 | 7.69 (6.56, 8.81) | 1.90 | ||||
| Cobb 500 | 19 | 99.6 | 19.36 (8.12, 30.60) | 624.18 | ||||
| Hubbard × Cobb 500 | 4 | 83.4 | 20.70 (18.89, 22.52) | 2.86 | ||||
| Ross | 7 | 99.0 | 16.13 (11.23, 21.03) | 42.04 | ||||
| Ross × Ross 708 | 5 | 99.8 | 5.49 (−1.79, 12.77) | 68.80 | ||||
| Ross 708 × YPM | 3 | 97.4 | 2.81 (1.90, 3.73) | 0.63 | ||||
| Yield Plus × Ross 708 | 5 | 99.4 | 5.58 (3.42, 7.74) | 6.02 | ||||
| Lohman Indian RSR | 2 | 94.3 | 13.41 (11.31, 15.50) | 2.16 | ||||
| FCR, g/g | Ross 308 | 38 | 99.1 | −4.29 (−5.38, −3.21) | 11.37 | 10 | 1434.92 | <0.0001 |
| Ross 708 | 6 | 82.8 | −7.68 (−8.22, −7.14) | 0.39 | ||||
| Cobb 500 | 15 | 99.4 | −4.84 (−6.92, −2.75) | 16.97 | ||||
| Hubbard × Cobb 500 | 4 | 82.2 | −7.18 (−7.83, −6.53) | 0.37 | ||||
| Ross | 10 | 99.6 | −48.69 (−72.95, −24.43) | 1511.60 | ||||
| Ross × Ross 708 | 5 | 99.6 | −2.66 (−5.84, 0.53) | 13.20 | ||||
| Ross 708 × YPM | 3 | 99.2 | 0.37 (−0.90, 1.65) | 1.26 | ||||
| Yield Plus × Ross 708 | 5 | 98.0 | −4.06 (−5.06, −3.06) | 1.27 | ||||
| Lohman Indian RSR | 2 | 99.3 | −3.19 (−5.15, −1.24) | 1.98 | ||||
| Grower-Finisher Phase (22–42 days) | ||||||||
| ADFI, g/d | Cobb 500 | 8 | 99.7 | 139.58 (43.64, 235.50) | 19,111.51 | 3 | 13.11 | 0.0044 |
| Ross 308 | 12 | 99.0 | 10.46 (0.16, 20.76) | 328.99 | ||||
| Ross | 5 | 94.8 | −1.11 (−1.92, −0.29) | 0.80 | ||||
| ADG, g/d | Cobb 500 | 3 | 64.7 | 24.91 (23.24, 26.57) | 1.39 | 2 | 975.23 | <0.0001 |
| Ross | 5 | 95.1 | −0.52 (−120, 0.16) | 0.54 | ||||
| BWG, g | Cobb 500 | 6 | 99.3 | 19.74 (13.07, 26.41) | 68.90 | 3 | 25.56 | <0.0001 |
| Ross 308 | 11 | 99.4 | 4.16 (0.56, 7.76) | 36.26 | ||||
| Ross | 3 | 99.7 | 3.28 (−273.99, 842.31) | 242,927.9 | ||||
| FCR, g/g | Cobb 500 | 6 | 99.7 | −8.39 (−11.19, −5.59) | 12.15 | 3 | 442.11 | <0.0001 |
| Ross 308 | 12 | 98.7 | −4.72 (−7.63, −1.80) | 25.67 | ||||
| Ross | 5 | 17.4 | −0.13 (4.51, 5.46) | 0.0044 | ||||
| Random Effects Model | ||||||||
|---|---|---|---|---|---|---|---|---|
| Parameter | Covariate: Strain | NC | I2, % | SMD (95% CI) | τ2 | d.f | Q | p-Value a |
| Starter Phase (1–22 days) | ||||||||
| BBS, Kgf/mm | Cobb 500 | 10 | 93.5 | 4.12 (1.63, 6.60) | 15.31 | 1 | 0.50 | 0.4776 |
| Ross 308 | 7 | 91.1 | 5.52 (2.58, 8.46) | 14.56 | ||||
| Tibia Ash, g/Kg DM | Ross 708 | 3 | 89.2 | 4.11 (2.42, 5.79) | 1.92 | 5 | 20.68 | 0.0009 |
| Cobb 500 | 25 | 99.4 | 11.66 (7.84, 15.48) | 93.25 | ||||
| Ross × Ross 708 | 3 | 99.9 | 5.02 (−8.25, 18.28) | 137.28 | ||||
| Ross 708 × YPM | 3 | 0.0 | 4.88 (2.83, 6.92) | 0.00 | ||||
| Ross 308 | 16 | 95.5 | 19.00 (9.39, 28.62) | 366.62 | ||||
| Tibia Ca, g/Kg DM | Cobb 500 | 12 | 96.5 | 1.84 (−2.00, 5.68) | 45.13 | 1 | 5.38 | 0.0204 |
| Ross 308 | 5 | 97.3 | 10.50 (4.27, 16.72) | 48.66 | ||||
| Tibia P, g/Kg DM | Cobb 500 | 13 | 97.8 | 2.39 (−0.99, 5.77) | 37.91 | 1 | 17.67 | <0.0001 |
| Ross 308 | 5 | 90.4 | 12.72 (9.29, 16.15) | 13.14 | ||||
| Grower-Finisher Phase (22–42 days) | ||||||||
| BBS, Kgf/mm | Ross 308 | 8 | 96.2 | 4.88 (2.49, 7.27) | 10.91 | 1 | 1.73 | 0.19 |
| Cobb 500 | 3 | 68.7 | 3.07 (1.83, 4.32) | |||||
| Tibia Ash, g/Kg DM | Ross 308 | 7 | 93.8 | 2.38 (−0.13, 4.89) | 10.87 | 3 | 68.22 | <0.0001 |
| Ross 708 | 3 | 65.7 | 10.87 (8.60, 13.14) | 2.58 | ||||
| Cobb 500 | 6 | 91.3 | 13.00 (3.53, 22.46) | 133.92 | ||||
| Ross | 5 | 49.4 | 1.22 (0.51, 1.94) | 0.32 | ||||
| Tibia Ca, g/Kg DM | Ross 308 | 5 | 88.3 | 9.20 (1.27, 17.13) | 77.12 | 3 | 10.84 | 0.0044 |
| Cobb 500 | 3 | 27.5 | 6.28 (1.87, 10.70) | 14.05 | ||||
| Ross | 5 | 95.6 | 0.55 (0.02, 1.09) | 0.10 | ||||
| Tibia P, g/Kg DM | Cobb 500 | 3 | 93.6 | 9.20 (3.70, 14.69) | 21.37 | 2 | 13.41 | 0.0012 |
| Ross | 5 | 89.4 | 0.32 (−1.33, 1.97) | 3.17 | ||||
| Ross 308 | 5 | 95.5 | 9.61 (1.59, 17.62) | 78.58 | ||||
| Random Effects Model | ||||||||
|---|---|---|---|---|---|---|---|---|
| Parameter | Covariate: Dietary P Source a | NC | I2, % | SMD (95% CI) | τ2 | d.f | Q | p-Value b |
| Starter Phase (1–22 days) | ||||||||
| ADFI, g/d | Corn–Soybean | 69 | 99.6 | 15.33 (7.03, 23.62) | 1233.91 | 5 | 18.52 | 0.0024 |
| Wheat–Corn–Soybean | 9 | 99.6 | 1.86 (−0.24, 0.03) | 2249.25 | ||||
| CSRRB | 2 | 99.2 | 6.56 (3.27, 9.86) | 5.44 | ||||
| Corn–Soybean–DDGS | 3 | 98.9 | 8.99 (2.54, 15.45) | 31.98 | ||||
| Wheat–Soybean | 11 | 99.8 | 10.10 (4.92, 15.28) | 76.63 | ||||
| WRES | 3 | 95.9 | −0.32 (−4.88, 4.24) | 15.68 | ||||
| ADG, g/d | Corn–Soybean | 6 | 99.8 | 9.31 (1.03, 17.59) | 106.92 | 2 | 36.83 | <0.0001 |
| Wheat–Corn–Soybean | 3 | 99.4 | −0.31 (−3.06, 2.43) | 5.86 | ||||
| Wheat–Soybean | 4 | 99.4 | 23.02 (15.74, 30.31) | 54.77 | ||||
| BWG, g | Corn–Soybean | 72 | 99.6 | 11.35 (7.99, 14.70) | 209.70 | 5 | 5.89 | 0.3167 |
| Wheat-Corn–Soybean | 6 | 99.5 | 6.97 (2.06, 11.88) | 37.48 | ||||
| CSRRB | 2 | 90.5 | 8.61 (6.00, 11.23) | 3.23 | ||||
| Corn–Soybean–DDGS | 3 | 70.9 | 8.17 (6.84,9.51) | 0.98 | ||||
| Wheat–Soybean | 9 | 99.8 | 11.79 (4.20, 19.37) | 134.58 | ||||
| WRES | 4 | 92.8 | 6.40 (3.38,9.41) | 8.25 | ||||
| FCR, g/g | Corn–Soybean | 63 | 99.5 | −10.79 (−16.00, 5.58) | 442.82 | 6 | 488.97 | <0.0001 |
| Wheat–Corn–Soybean | 9 | 99.6 | −4.35 (−7.80, −0.91) | 27.58 | ||||
| CSRRB | 2 | 0.0 | −12.04 (−13.12, −10.95) | 0 | ||||
| Corn–Soybean–DDGS | 3 | 78.9 | −3.31 (−4.08, −2.54) | 0.36 | ||||
| Wheat–Soybean | 7 | 99.5 | −4.85 (−7.07, −2.64) | 8.91 | ||||
| WRES | 4 | 73.8 | −8.21 (−10.89, −5.54) | 5.41 | ||||
| Corn–Soybean | 2 | 0.0 | −0.50 (−0.75, −0.24) | 0 | ||||
| Grower-Finisher Phase (22–42 days) | ||||||||
| ADFI, g/d | Corn–Soybean | 13 | 99.8 | 86.28 (17.50, 155.05) | 15,976.48 | 3 | 30.93 | <0.0001 |
| Wheat–Corn–Soybean | 6 | 93.5 | −1.10 (−1.76, −0.44) | 0.62 | ||||
| Corn–Soybean–DDGS | 3 | 96.9 | 39.35 (23.13, 55.57) | 196.29 | ||||
| WRES | 4 | 95.1 | 0.62 (−2.75, 3.99) | 11.36 | ||||
| ADG, g/d | Corn–Soyabean | 4 | 99.9 | 18.18 (4.89, 31.47) | 183.31 | 1 | 7.59 | 0.0059 |
| Wheat–Corn–Soybean | 5 | 95.1 | −0.52 (−120, 0.16) | 0.54 | ||||
| BWG, g | Corn–Soybean | 11 | 99.8 | 11.61 (5.00, 18.22) | 124.72 | 3 | 19.30 | 0.0002 |
| Wheat–Corn–Soybean | 4 | 98.9 | −2.38 (−6.20, 1.43) | 15.02 | ||||
| Corn–Soybean–DDGS | 3 | 98.5 | 7.91 (2.41, 13.42) | 23.19 | ||||
| WRES | 4 | 90.1 | 6.43 (2.59, 10.26) | 13.61 | ||||
| FCR, g/g | Corn–Soybean | 11 | 99.7 | −4.73 (−7.89, −1.58) | 28.44 | 3 | 17.94 | 0.0005 |
| Wheat–Corn–Soybean | 6 | 98.7 | −2.66 (−7.42, 2.09) | 35.21 | ||||
| Corn–Soybean | 3 | 81.9 | −0.91 (−1.49, −0.34) | 0.21 | ||||
| WRES | 4 | 93.2 | −8.30 (−12.36, −4.25) | 14.57 | ||||
| Random Effects Model | ||||||||
|---|---|---|---|---|---|---|---|---|
| Parameter | Covariate: Dietary P Source a | NC | I2, % | SMD (95% CI) | τ2 | d.f | Q | p-Value b |
| Starter Phase (1–22 days) | ||||||||
| BBS, Kgf/mm | Corn–Soybean | 13 | 91.9 | 3.65 (1.78, 5.51) | 11.22 | 1 | 4.55 | 0.0330 |
| Wheat–Soybean | 4 | 90.5 | 8.16 (4.45, 11.88) | 12.27 | ||||
| Tibia Ash, g/Kg DM | Corn–Soybean | 45 | 99.4 | 4.11 (2.42, 5.79) | 1.92 | 2 | 38.83 | <0.0001 |
| Wheat–Soybean | 4 | 89.9 | 36.74 (30.47, 43.02) | 29.80 | ||||
| Tibia Ca, g/Kg DM | Corn–Soybean | 15 | 97.4 | 4.52 (0.27, 8.76) | 69.12 | 1 | 0.45 | 0.5041 |
| Wheat–Corn–Soybean | 2 | 0.0 | 3.05 (2.39, 3.73) | 0 | ||||
| Tibia P, g/Kg DM | Corn–Soybean | 16 | 98.0 | 4.65 (0.99, 8.31) | 54.70 | 1 | 2.04 | 0.1534 |
| Wheat–Corn–Soybean | 2 | 92.4 | 10.14 (3.55, 16.73) | 20.91 | ||||
| Grower-Finisher Phase (22–42 days) | ||||||||
| BBS, Kgf/mm | Corn–Soybean | 9 | 92.7 | 3.59 (2.27, 4.91) | 3.63 | 1 | 16.33 | <0.0001 |
| WRES | 2 | 0.0 | 9.03 (6.75, 11.32) | |||||
| Tibia Ash, g/Kg DM | Corn–Soybean | 16 | 97.8 | 7.53 (3.96, 11.09) | 50.60 | 1 | 11.54 | 0.0007 |
| Wheat–Corn–Soybean | 5 | 49.4 | 1.22 (0.51, 1.94) | 0.32 | ||||
| Tibia Ca, g/Kg DM | Corn–Soybean | 5 | 95.2 | 3.73 (−0.08, 7.55) | 18.188 | 2 | 68.87 | <0.0001 |
| Wheat–Corn–Soybean | 5 | 27.5 | 0.55 (0.02, 1.09) | 0.10 | ||||
| WRES | 3 | 13.7 | 15.44 (11.91, 18.97) | 2.02 | ||||
| Tibia P, g/Kg DM | Corn–Soybean | 5 | 96.0 | 5.55 (0.36, 10.74) | 33.66 | 2 | 72.40 | <0.0001 |
| Wheat–Corn–Soybean | 5 | 89.4 | 0.32 (−1.33, 1.97) | 3.17 | ||||
| WRES | 3 | 0.0 | 16.12 (12.86, 19.38) | 0 | ||||
| Dependent Parameter | Intercept | SE (p-Value a) | Dosage | QM | d.f. | p-Value b | R2 (%) |
|---|---|---|---|---|---|---|---|
| Starter Phase (1–22 days) | |||||||
| ADFI, g/d | 13.1238 | 3.27 (<0.0001) | −0.0003 | 0.2153 | 1 | 0.6426 | 0.00 |
| ADG, g/d | 9.6103 | 5.82 (0.0985) | 0.0016 | 0.1300 | 1 | 0.7185 | 0.00 |
| BWG, g | 10.7360 | 1.44 (<0.0001) | 0.0000 | 0.0015 | 1 | 0.9692 | 0.00 |
| FCR, g/g | −7.9007 | 1.95 (<0.0001) | −0.0006 | 2.4100 | 1 | 0.1206 | 1.32 |
| BBS, Kgf/mm | 6.2370 | 1.86 (0.0008) | −0.0010 | 0.9577 | 1 | 0.3278 | 0.00 |
| Tibia Ash, g/Kg DM | 10.2937 | 2.86 (0.0003) | 0.0015 | 0.3922 | 1 | 0.5311 | 0.00 |
| Tibia Ca, g/Kg DM | 7.9141 | 3.07 (0.0100) | −0.0029 | 2.0975 | 1 | 0.1475 | 5.78 |
| Tibia P, g/Kg DM | 9.5629 | 2.69 (0.0004) | −0.0032 | 3.9557 | 1 | 0.0467 | 15.50 |
| Grower-Finisher Phase (22–42 days) | |||||||
| ADFI, g/d | 38.0642 | 25.93 (0.1421) | 0.0037 | 0.0332 | 1 | 0.8555 | 0.00 |
| ADG, g/d | 9.8424 | 10.87 (0.3652) | −0.0033 | 0.0436 | 1 | 0.8345 | 0.00 |
| BWG, g | 62.2857 | 54.22 (0.2507) | −0.0167 | 0.1632 | 1 | 0.6862 | 0.00 |
| FCR, g/g | −4.5661 | 1.51 (0.0025) | 0.0003 | 0.0647 | 1 | 0.7992 | 0.00 |
| BBS, Kgf/mm | 6.8364 | 2.03 (0.0008) | −0.0031 | 1.6752 | 1 | 0.1956 | 3.38 |
| Tibia Ash, g/Kg DM | 0.6803 | 3.24 (0.8339) | 0.0063 | 3.1101 | 1 | 0.0778 | 3.15 |
| Tibia Ca, g/Kg DM | 5.0380 | 4.31 (0.2425) | −0.0001 | 0.0002 | 1 | 0.9886 | 0.00 |
| Tibia P, g/Kg DM | 5.3695 | 4.81 (0.2646) | 0.0005 | 0.0078 | 1 | 0.9297 | 0.00 |
| Dependent Parameter | Intercept | SE (p-Value a) | Duration | QM | d.f. | p-Value b | R2 (%) |
|---|---|---|---|---|---|---|---|
| Starter Phase (1–22 days) | |||||||
| ADFI, g/d | −15.3207 | 15.33 0.3177) | 1.5427 | 3.4411 | 1 | 0.0636 | 2.50 |
| ADG, g/d | −16.1756 | 35.67 (0.6502) | 1.3331 | 0.5988 | 1 | 0.4390 | 0.00 |
| BWG, g | 1.3602 | 6.32 (0.8296) | 0.5302 | 2.3123 | 1 | 0.1284 | 1.31 |
| FCR | −29.0970 | 8.31 (0.0005) | 1.1359 | 6.14 | 1 | 0.0132 | 5.28 |
| BBS, Kgf/mm | −57.8350 | 50.41 (0.2512) | 3.0031 | 1.5383 | 1 | 0.2149 | 1.95 |
| Tibia Ash, g/Kg DM | 6.2928 | 8.19 (0.4423) | 0.2953 | 0.3922 | 1 | 0.4965 | 0.00 |
| Tibia Ca, g/Kg DM | 19.4068 | 5.85 (0.0009) | −0.9962 | 312.37 | 1 | 0.0074 | 29.05 |
| Tibia P, g/Kg DM | 24.2718 | 4.17 (<0.0001) | −1.2321 | 22.8293 | 1 | <0.0001 | 58.00 |
| Grower-Finisher Phase (22–42 days) | |||||||
| ADFI, g/d | −91.3932 | 144.35 (0.5266) | 6.9971 | 0.8589 | 1 | 0.3540 | 0.00 |
| ADG, g/d | −60.0350 | 66.49 (0.3665) | 3.5078 | 1.0447 | 1 | 0.3067 | 0.49 |
| BWG, g | 511.5840 | 267.52 (0.0558) | −24.73 | 3.0712 | 1 | 0.0797 | 9.11 |
| FCR | −5.7871 | 8.25 (0.4830) | 0.0787 | 0.0331 | 1 | 0.8557 | 0.00 |
| BBS, Kgf/mm | 7.7524 | 3.53 (0.0282) | −0.1255 | 0.9370 | 1 | 0.3331 | 0.00 |
| Tibia Ash, g/Kg DM | 14.4573 | 5.32 (0.0065) | −0.3716 | 2.8099 | 1 | 0.0937 | 10.34 |
| Tibia Ca, g/Kg DM | −43.7178 | 16.60 (0.0084) | 2.5215 | 8.5614 | 1 | 0.0034 | 40.79 |
| Tibia P, g/Kg DM | −56.0797 | 16.19 (0.0005) | 3.2005 | 14.4598 | 1 | 0.0001 | 56.07 |
Disclaimer/Publisher’s Note: The statements, opinions and data contained in all publications are solely those of the individual author(s) and contributor(s) and not of MDPI and/or the editor(s). MDPI and/or the editor(s) disclaim responsibility for any injury to people or property resulting from any ideas, methods, instructions or products referred to in the content. |
© 2024 by the authors. Licensee MDPI, Basel, Switzerland. This article is an open access article distributed under the terms and conditions of the Creative Commons Attribution (CC BY) license (https://creativecommons.org/licenses/by/4.0/).
Share and Cite
Nuamah, E.; Okon, U.M.; Jeong, E.; Mun, Y.; Cheon, I.; Chae, B.; Odoi, F.N.A.; Kim, D.-w.; Choi, N.-J. Unlocking Phytate with Phytase: A Meta-Analytic View of Meat-Type Chicken Muscle Growth and Bone Mineralization Potential. Animals 2024, 14, 2090. https://doi.org/10.3390/ani14142090
Nuamah E, Okon UM, Jeong E, Mun Y, Cheon I, Chae B, Odoi FNA, Kim D-w, Choi N-J. Unlocking Phytate with Phytase: A Meta-Analytic View of Meat-Type Chicken Muscle Growth and Bone Mineralization Potential. Animals. 2024; 14(14):2090. https://doi.org/10.3390/ani14142090
Chicago/Turabian StyleNuamah, Emmanuel, Utibe Mfon Okon, Eungyeong Jeong, Yejin Mun, Inhyeok Cheon, Byungho Chae, Frederick Nii Ako Odoi, Dong-wook Kim, and Nag-Jin Choi. 2024. "Unlocking Phytate with Phytase: A Meta-Analytic View of Meat-Type Chicken Muscle Growth and Bone Mineralization Potential" Animals 14, no. 14: 2090. https://doi.org/10.3390/ani14142090
APA StyleNuamah, E., Okon, U. M., Jeong, E., Mun, Y., Cheon, I., Chae, B., Odoi, F. N. A., Kim, D.-w., & Choi, N.-J. (2024). Unlocking Phytate with Phytase: A Meta-Analytic View of Meat-Type Chicken Muscle Growth and Bone Mineralization Potential. Animals, 14(14), 2090. https://doi.org/10.3390/ani14142090