
The Impact of PRRS Eradication Program on the Production Parameters of the Hungarian Swine Sector
 ,
, 
Abstract
Simple Summary
Abstract
1. Introduction
- -
- Eliminating losses due to PRRS.
- -
- Decreasing antibiotic usage level during production.
- -
- Increasing the profitability of producers.
- -
- In a certain swine farm, which allows us to conduct the financial analysis of the depopulation –repopulation procedure on the farm level.
- -
- On the productivity of the Hungarian swine sector––namely, on the number of slaughter pigs per sow per year and the total live slaughter weight per sow per year.
2. Materials and Methods
2.1. Estimation of the Production and Financial Impact of the Depopulation–Repopulation in a Large Farrow-to-Finish Swine Farm
2.2. Estimation of the Economic Impact of the Depopulation–Repopulation Procedure on the Entire Swine Sector in Hungary
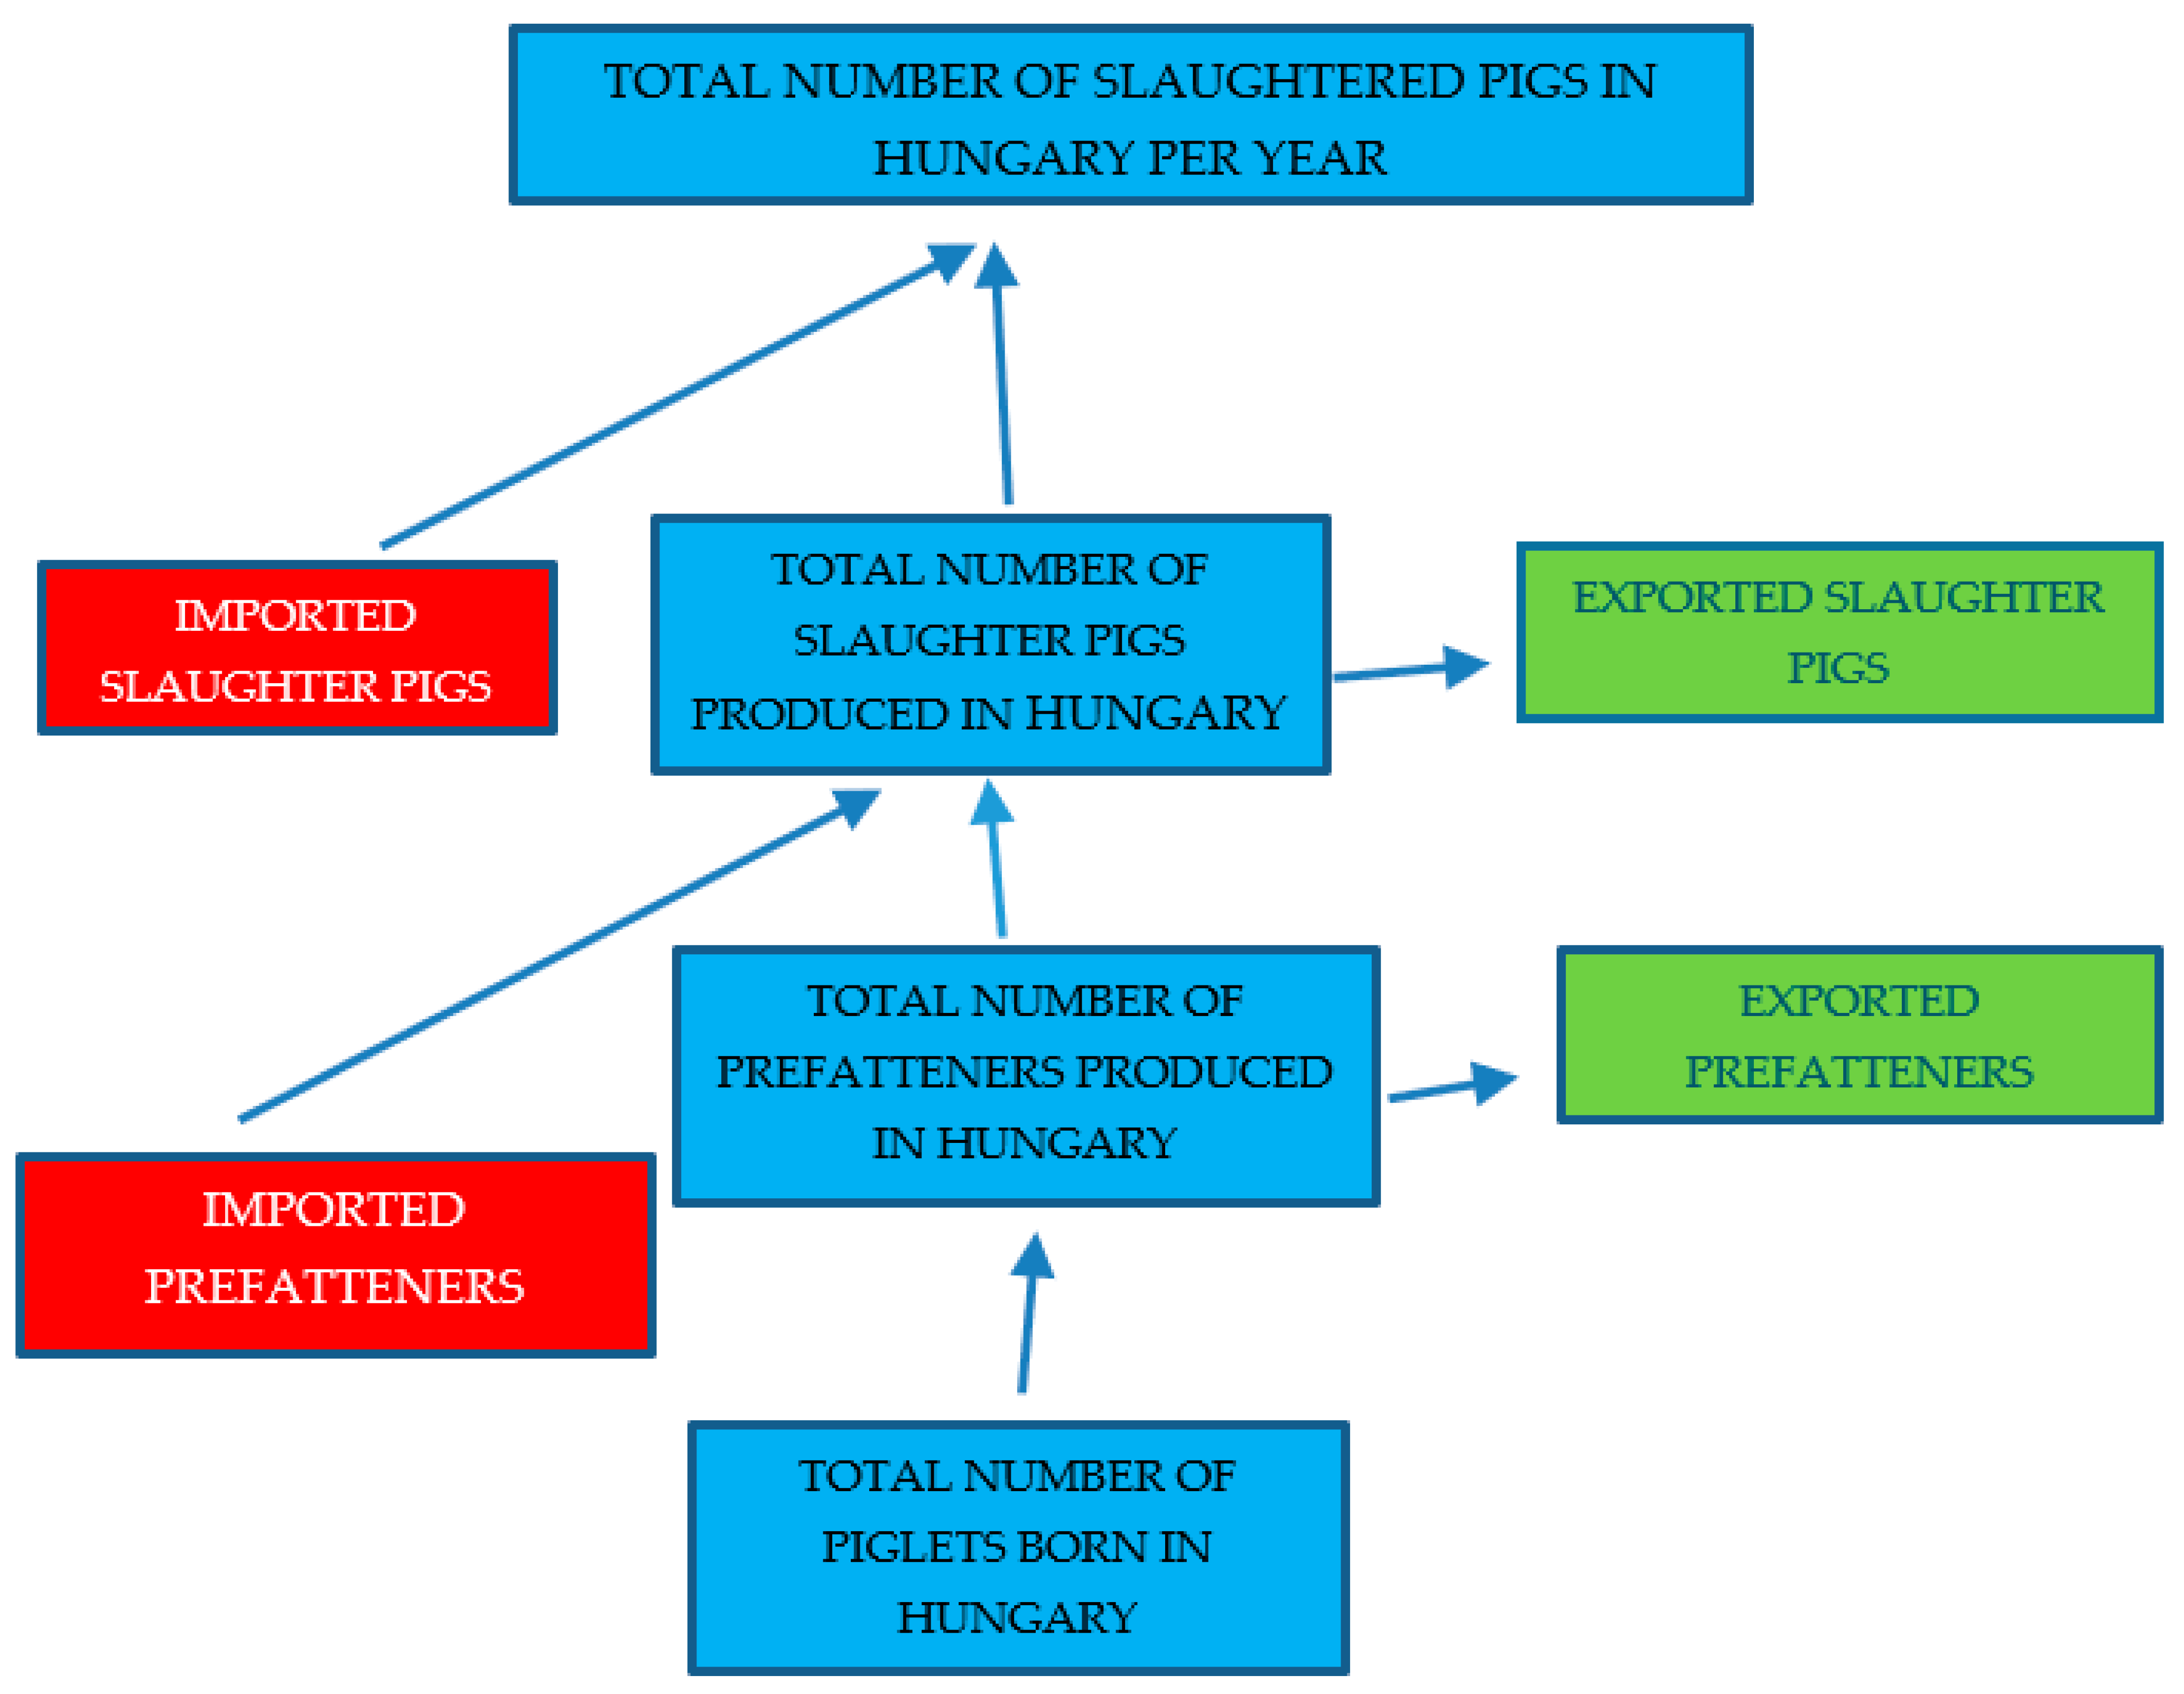
- The total number of pigs, including sows, in Hungary as of 1st of December, according to the Hungarian Central Statistical Office [16].
- Data available in the Agricultural Statistics Information System (ASIR) of the Institute of Agricultural Economics (AKI), which shows that from 2012 onwards, the total number of pigs slaughtered, including the culled sows, their average live slaughter weight, and the average carcass weight. The total number of slaughter pigs is the margin between the total number of pigs slaughtered and the total number of slaughtered (culled) sows in Hungary [17].
- The FELIR system of the National Food Chain Safety Office (NÉBIH) and the EU Sante Traces system give information about the annual number of imported live pigs for immediate slaughter and the annual number of exported live pigs for immediate slaughter from Hungary [18].
3. Results
3.1. Estimated Production and Financial Impact of the Depopulation–Repopulation in a Large Farrow-to-Finish Swine Farm
3.2. Estimated Economic Impact of the Depopulation–Repopulation Procedure on the Entire Swine Sector in Hungary
4. Discussion
5. Conclusions
Author Contributions
Funding
Institutional Review Board Statement
Informed Consent Statement
Data Availability Statement
Acknowledgments
Conflicts of Interest
References
- Central Statistical Office. The Role of Agriculture in the National Economy. 2018. Available online: https://www.ksh.hu/docs/hun/xftp/idoszaki/mezo/mezoszerepe18.pdf (accessed on 18 March 2022). (In Hungarian).
- Szabó, I.; Molnár, T. Az Aujeszky-betegségtől való mentesítés Magyarországon 1998–2002 között (Eradication of Aujeszky-disease in Hungary between 1998 and 2002). Magy. Áo. Lapja 2004, 126, 80–86. (In Hungarian) [Google Scholar]
- Pork Checkoff Study. Cost of PRRS Reaches $664 Million Annually. Available online: https://www.nationalhogfarmer.com/health-diseases/cost-prrs-reaches-millions-0817 (accessed on 12 April 2022).
- Valdes-Donoso, P.; Alvarez, J.; Jarvis, L.S.; Morrison, R.B.; Perez, A.M. Production losses from an endemic animal disease: Porcine reproductive and respiratory syndrome (PRRS) in selected Midwest US sow farms. Front. Vet. Sci. 2018, 5, 102. [Google Scholar] [CrossRef] [PubMed]
- Holtkamp, D.J.; Polson, D.D.; Torremorell, M.; Morrison, B.; Classen, D.M.; Becton, L.; Henry, S.; Rodibaugh, M.T.; Rowland, R.R.; Snelson, H.; et al. Terminology for classifying swine herds by porcine reproductive and respiratory syndrome virus status. J. Swine Health Prod. 2011, 19, 44–56. [Google Scholar]
- Innovative Farmers. Scottish PRRS Elimination Project. Available online: https://innovativefarmers.org/field-lab?id=f0ea179b-5ddc-e811-816f-005056ad0bd4 (accessed on 29 May 2022).
- Renken, C.; Nathues, C.; Swam, H.; Fiebig, K.; Weiss, C.; Eddicks, M.; Ritzmann, M.; Nathues, H. Application of an economic calculator to determine the cost of porcine reproductive and respiratory syndrome at farm-level in 21 pig herds in Germany. Porc. Health Manag. 2021, 7, 1–12. [Google Scholar] [CrossRef] [PubMed]
- Nemes, I.; Molnár, T.; Abonyi, T.; Terjék, Z.; Bálint, Á.; Szabó, I. Eradication of PRRS from backyard swine herds in Hungary between 2012 and 2018. Acta Vet. Hung. 2019, 67, 543–552. [Google Scholar] [CrossRef] [PubMed]
- Szabó, I.; Molnár, T.; Nemes, I.; Abonyi, T.; Terjék, Z.; Bálint, Á. PRRSV eradication on large-scale fattening pig farms in Hungary between 2014–2019. Acta Vet. Hung. 2019, 67, 529–542. [Google Scholar] [CrossRef] [PubMed]
- Szabó, I. The experience of the National PRRS eradication program in Hungary. In Proceedings of the 13th European Symposium of Porcine Health Management, Budapest, Hungary, 11–13 May 2022. [Google Scholar]
- Szabó, I.; Bognár, L.; Molnár, T.; Nemes, I.; Bálint, Á. PRRS eradication from swine farms in five regions of Hungary. Acta Vet. Hung. 2020, 68, 257–262. [Google Scholar] [CrossRef] [PubMed]
- Hoste, R.; International Comparison of Pig Production Costs 2018; Results of InterPIG. Wageningen, Wageningen Economic Research, Report 2020-007. Available online: https://edepot.wur.nl/511876 (accessed on 25 March 2022).
- Nyárs, L. A Magyar Sertéshústermelés Gazdasági Környezetének Vizsgálata. Ph.D. Thesis, Szent István University, Faculty of Economics and Social Sciences, Gödöllő, Hungary, 2005. (In Hungarian). [Google Scholar]
- Bartha, A. A Sertésdivertikum Stratégiai Elemzése, a Sertéságazat Versenypiaci Elemzése. Ph.D. Thesis, University of Debrecen, Faculty of Economics and Business, Institute of Applied Economics Sciences, Non-Independent Department of Business Economics and Business Development, Debrecen, Hungary, 2012. (In Hungarian). [Google Scholar]
- Nagy, L.; Aliczki, K.K. Competitiveness of pigmeat production in Hungary. In Proceedings of the Georgikon Scientific Conference, Keszthely, Hungary, 2–3 October 2014. (In Hungarian). [Google Scholar]
- Central Statistical Office. Livestock, December (1995–). Available online: https://www.ksh.hu/docs/hun/xstadat/xstadat_eves/i_oma003.html (accessed on 9 September 2022). (In Hungarian).
- Research Institute of Agricultural Economics, Information System of Agrostatistics. Slaughter of Live Animals in Slaughterhouses. Available online: https://asir.aki.gov.hu/web_public/general/home.do (accessed on 1 July 2022). (In Hungarian)
- The TRACES (IMSOC) System. Available online: https://portal.nebih.gov.hu/traces (accessed on 19 February 2023).
- R Core Team. R: A Language and Environment for Statistical Computing; R Foundation for Statistical Computing: Vienna, Austria, 2021; Available online: https://www.R-project.org/ (accessed on 28 April 2023).
- ECU/EUR Exchange Rates versus National Currencies. Available online: https://ec.europa.eu/eurostat/databrowser/view/tec00033/default/table?lang=en (accessed on 11 February 2023).
- Rathkjen, P.H.; Dall, J. Maximising the Chances of Success for PRRSV Area-Regional Control and Elimination Programmes: A 5-Step Process in Practice. J. Microb. Biochem. Technol. 2018, 10, 8–11. [Google Scholar] [CrossRef]
- Agriculture and Food Development Authority. National Pig Performance Report. Teagasc Pig Development Department, Fermoy, Ireland. Available online: https://www.teagasc.ie/media/website/publications/2020/teagasc_pig_herd_performance.pdf (accessed on 14 July 2022).
- National Hog Farmer. Productivity: The Key to Being Competitive. Available online: https://www.nationalhogfarmer.com/marketing/productivity-key-being-competitive (accessed on 5 July 2022).
- Teagasc Pig Conference. Focusing on the Future. Available online: https://www.teagasc.ie/news--events/news/2019/teagasc-national-pig-conf.php (accessed on 29 May 2022).


| Parameters | 2020 (before Depopulation) | 2022 (after Repopulation) | Difference | |
|---|---|---|---|---|
| Average number of live piglets per litter | 11.0 | 12.5 | +1.5 | |
| Preweaning mortality (%) | 7 | 8 | +1 | |
| Weaned piglets per litter | 10.2 | 11.5 | +1.3 | |
| Litters/sow/year | 2.36 | 2.40 | +0.04 | |
| Number of weaned piglets per sow per year | 24 | 27.6 | +3.6 | |
| Average sow number per farm | 1400 | 1420 | +20 | |
| Total number of weaned piglets per farm | 33,600 | 39,192 | +5592 | |
| ADG during nursery (g/day) | 425 | 440 | 15 | |
| FCR during nursery | 1.7 | 1.5 | −0.2 | |
| ADG during fattening (g/day) | 750 | 900 | +150 | |
| FCR during fattening | 3.0 | 2.7 | −0.3 | |
| Average number of days till slaughter | 175 | 155 | −20 | |
| Average number of slaughter pigs per sow per year | 21 | 25 | +4 | |
| Average live weight at slaughter (kg) | 109 | 110 | +1 | |
| Total weight of slaughtered pigs per farm (t) | 3205 | 3905 | +700 | |
| Total cost of vaccinations and curative treatments per farm (ths HUF) | 104,000 | 54,000 | −50,000 | |
| Total cost of vaccinations and curative treatments per farm (ths EUR) * | 290 | 150 | −139 | |
| Total feed consumption per farm per year (t) | 10,500 | 11,000 | +500 | |
| Annual income (ths HUF) | 1,291,194 | 1,613,205 | +322,011 | |
| Annual income (ths EUR) * | 3596 | 4493 | +897 | |
| Costs | n | Unit price (HUF) | Total cost (HUF) | Total cost (€) |
| Gilts | 1600 | 100,000 | 160,000,000 | 445,620 |
| Boars | 5 | 500,000 | 2,500,000 | 6963 |
| Biosecurity investments | 30,000,000 | 83,554 | ||
| Decrease in income in the transition period | 71,381,329 | 198,806 | ||
| State compensation for PRRS eradication | −110,932,720 | −308,962 | ||
| Total investment costs | 152,948,609 | 425,981 | ||
| Payback time (year) | 0.48 | |||
| Benefit/cost ratio | 2.11 | |||
| Year | Slaughtered Sows Due to PRRS Eradication | Slaughtered Sows Due to PRRS Eradication (%) | Total Number of Slaughtered Sows * | Slaughtered Sows Compared to 2012 (%) | Slaughtered Sows Due to PRRS Eradication/Total Slaughtered Sows (%) |
|---|---|---|---|---|---|
| 2012 | 0 | 0% | 77,317 | 100 | 0.00 |
| 2013 | 0 | 0% | 86,401 | 112 | 0.00 |
| 2014 | 0 | 0% | 71,353 | 92 | 0.00 |
| 2015 | 3318 | 5% | 96,847 | 125 | 3.43 |
| 2016 | 6340 | 9% | 105,703 | 137 | 6.00 |
| 2017 | 7860 | 11% | 83,614 | 108 | 9.40 |
| 2018 | 4973 | 7% | 92,950 | 120 | 5.35 |
| 2019 | 12,494 | 18% | 86,434 | 112 | 14.45 |
| 2020 | 7790 | 11% | 75,545 | 98 | 10.31 |
| 2021 | 25,697 | 38% | 91,084 | 118 | 28.21 |
| 2022 | 2300 | 3% | 66,032 | 85 | 3.48 |
| TOTAL | 70,772 | 769,562 | 9.20 |
| Year | Total Slaughtered Pigs (Ths Head) | Change (2012 = 100%) | Total Slaugh-Tered Sows (Head) | Total Slaugh-Tered Pigs (Head) | Imported Prefat-Teners (Head) | Imported Slaughter Pigs (Head) | Exported Prefat-Teners (Head) | Exported Slaughter Pigs (Head) | Total Exported Prefat-Teners and Slaughter Pigs (Head) | Slaughter Pigs Produced in Hungary (Head) | # of Sows (‘000 Heads) | # of Slaugh-Tered Pigs/ Sow/ Year | Change (2012 = 100%) | Change (2014 = 100%) * |
|---|---|---|---|---|---|---|---|---|---|---|---|---|---|---|
| 2012 | 3,836,044 | 100% | 77,317 | 3,758,727 | 126,812 | 675,293 | 9220 | 456,800 | 466,020 | 3,422,642 | 200.3 | 17.09 | 100% | 86% |
| 2013 | 3,749,825 | 98% | 86,401 | 3,663,424 | 255,925 | 668,774 | 2230 | 482,255 | 484,485 | 3,223,210 | 189.9 | 16.97 | 99% | 86% |
| 2014 | 4,077,531 | 106% | 71,353 | 4,006,178 | 212,857 | 389,131 | 283,947 | 271,150 | 555,097 | 3,959,287 | 200.2 | 19.78 | 116% | 100% |
| 2015 | 4,458,502 | 116% | 96,847 | 4,361,655 | 517,112 | 442,609 | 217,784 | 199,188 | 416,972 | 3,818,906 | 196.8 | 19.41 | 114% | 98% |
| 2016 | 4,675,646 | 122% | 105,703 | 4,569,943 | 765,384 | 414,392 | 252,439 | 209,420 | 461,859 | 3,852,026 | 177.4 | 21.71 | 127% | 110% |
| 2017 | 4,755,692 | 124% | 83,614 | 4,672,078 | 989,560 | 517,012 | 279,295 | 141,802 | 421,097 | 3,586,603 | 171.5 | 20.91 | 122% | 106% |
| 2018 | 4,704,599 | 123% | 92,950 | 4,611,649 | 750,291 | 498,917 | 185,992 | 265,530 | 451,522 | 3,813,963 | 177.9 | 21.44 | 125% | 108% |
| 2019 | 4,620,023 | 120% | 86,434 | 4,533,589 | 742,968 | 466,156 | 244,416 | 299,106 | 543,522 | 3,867,987 | 155.3 | 24.91 | 146% | 126% |
| 2020 | 4,701,729 | 123% | 75,545 | 4,626,184 | 592,127 | 558,929 | 161,595 | 303,778 | 465,373 | 3,940,501 | 163.6 | 24.09 | 141% | 122% |
| 2021 | 4,868,985 | 127% | 88,661 | 4,780,324 | 679,571 | 528,799 | 202,822 | 257,631 | 460,453 | 4,032,407 | 156.9 | 25.70 | 150% | 130% |
| 2022 | 4,532,370 | 118% | 66,032 | 4,466,338 | 634,469 | 485,593 | 294,336 | 220,004 | 514,340 | 3,860,616 | 147.8 | 26.12 | 153% | 132% |
| AKI ASIR Database | Calculated Value | NÉBIH ENAR Database | Calculated Value | KSH Database | Calculated Value | |||||||||
| Year | Total Slaughter Weight Production (t) | Change (2014 = 100%) | Total Live Weight of Slaughtered Sows (t) | Total Live Weight Slaughtered Pigs (t) | Total Live Weight of Imported Prefatteners * (t) | Total Live Weight of Imported Slaughter Pigs (t) | Total Live Weight of Exported Prefatteners * (t) | Total Live Weight of Exported Slaughter Pigs (t) | Total Live Weight of Slaughtered Pigs Produced in Hungary (t) | # of Sows (‘000 Heads) | Change (2014 = 100%) | Total Live Weight of Slaughtered Pigs (kg/sow/year) | Change (2014 = 100%) |
|---|---|---|---|---|---|---|---|---|---|---|---|---|---|
| 2014 | 455,935 | 100% | 15,295 | 440,640 | 6386 | 42,801 | 8518 | 29,824 | 429,796 | 200.2 | 100% | 2146.8 | 100% |
| 2015 | 463,948 | 102% | 19,046 | 444,902 | 15,513 | 45,147 | 6534 | 20,318 | 411,092 | 196.8 | 98% | 2088.9 | 97% |
| 2016 | 488,324 | 107% | 21,023 | 467,301 | 22,962 | 42,374 | 7573 | 21,414 | 430,954 | 177.4 | 89% | 2429.3 | 113% |
| 2017 | 491,039 | 108% | 16,325 | 474,714 | 29,687 | 52,532 | 8379 | 14,408 | 415,282 | 171.5 | 86% | 2421.5 | 113% |
| 2018 | 490,840 | 108% | 18,692 | 472,149 | 22,509 | 51,080 | 5580 | 27,185 | 431,325 | 177.9 | 89% | 2424.5 | 113% |
| 2019 | 495,546 | 109% | 16,749 | 478,797 | 22,289 | 49,231 | 7332 | 31,589 | 446,198 | 155.3 | 78% | 2873.1 | 134% |
| 2020 | 514,147 | 113% | 15,208 | 498,939 | 17,764 | 60,281 | 4848 | 32,763 | 458,505 | 163.6 | 82% | 2802.6 | 131% |
| 2021 | 575,017 | 126% | 19,690 | 555,327 | 20,387 | 61,430 | 6085 | 29,929 | 509,523 | 156.9 | 78% | 3247.4 | 151% |
| 2022 | 531,562 | 115% | 14,778 | 516,784 | 19,034 | 51,261 | 8831 | 23,224 | 478,544 | 147.8 | 74% | 3237.7 | 151% |
| AKI ASIR Database | Calculated Value | NÉBIH ENÁR Database | Calculated Value | KSH Database | Calculated Value | ||||||||
| Year | Slaughter Pigs per Sow per Year | Average Live Weight per Slaughter Pig (kg) | Average Market Price of Slaughter Pigs * (€/kg Live Weight) | Income/Sow/ Year (€) | Change (%) |
|---|---|---|---|---|---|
| 2014 | 19.78 | 111.82 | 1.25 | 2765 | +30 |
| 2021 | 25.70 | 118.10 | 1.25 | 3592 |
Disclaimer/Publisher’s Note: The statements, opinions and data contained in all publications are solely those of the individual author(s) and contributor(s) and not of MDPI and/or the editor(s). MDPI and/or the editor(s) disclaim responsibility for any injury to people or property resulting from any ideas, methods, instructions or products referred to in the content. |
© 2023 by the authors. Licensee MDPI, Basel, Switzerland. This article is an open access article distributed under the terms and conditions of the Creative Commons Attribution (CC BY) license (https://creativecommons.org/licenses/by/4.0/).
Share and Cite
Szabó, I.; Nemes, I.; Búza, L.; Polyák, F.; Bálint, Á.; Fitos, G.; Holtkamp, D.J.; Ózsvári, L. The Impact of PRRS Eradication Program on the Production Parameters of the Hungarian Swine Sector. Animals 2023, 13, 1565. https://doi.org/10.3390/ani13091565
Szabó I, Nemes I, Búza L, Polyák F, Bálint Á, Fitos G, Holtkamp DJ, Ózsvári L. The Impact of PRRS Eradication Program on the Production Parameters of the Hungarian Swine Sector. Animals. 2023; 13(9):1565. https://doi.org/10.3390/ani13091565
Chicago/Turabian StyleSzabó, István, Imre Nemes, László Búza, Ferenc Polyák, Ádám Bálint, Gábor Fitos, Derald J. Holtkamp, and László Ózsvári. 2023. "The Impact of PRRS Eradication Program on the Production Parameters of the Hungarian Swine Sector" Animals 13, no. 9: 1565. https://doi.org/10.3390/ani13091565
APA StyleSzabó, I., Nemes, I., Búza, L., Polyák, F., Bálint, Á., Fitos, G., Holtkamp, D. J., & Ózsvári, L. (2023). The Impact of PRRS Eradication Program on the Production Parameters of the Hungarian Swine Sector. Animals, 13(9), 1565. https://doi.org/10.3390/ani13091565