Article

Effects of Phage Cocktail, Probiotics, and Their Combination on Growth Performance and Gut Microbiota of Broiler Chickens

1
Department of Microbiology, Faculty of Biotechnology and Biomolecular Sciences, Universiti Putra Malaysia UPM, Seri Kembangan 43400, Malaysia
2
Institute of Bioscience, Universiti Putra Malaysia UPM, Seri Kembangan 43400, Malaysia
3
Department of Life Sciences, International Medical University, Jalan Jalil Perkasa 19, Taman Esplanade, Kuala Lumpur 57000, Malaysia
4
Department of Land Management, Faculty of Agriculture, Universiti Putra Malaysia UPM, Seri Kembangan 43400, Malaysia
5
School of Science, Monash University Malaysia, Jalan Lagoon Selatan, Bandar Sunway 47500, Malaysia
*
Author to whom correspondence should be addressed.
Animals 2023, 13(8), 1328; https://doi.org/10.3390/ani13081328
Submission received: 30 January 2023 / Revised: 14 March 2023 / Accepted: 28 March 2023 / Published: 13 April 2023
(This article belongs to the Special Issue Sustainable Poultry Production: Physiology and Nutrition)

Abstract

:

Simple Summary

The emergence of antibiotic-resistant bacteria and the growing demand for poultry products have led to an interest in finding alternatives to antibiotic growth promoters (AGPs) used in poultry farming. Probiotics, which have been shown to have positive effects on performance and health in chickens, are among the most recognised alternatives to AGPs. However, the use of probiotics in commercial farming has not been fully optimised. One of the major challenges arises from the competition of probiotics with other gut microbiota for adhesion and nutrients. This study investigated the use of a phage cocktail in combination with probiotics as a potential alternative to AGPs in poultry farming. The results showed that the combination of phage and probiotics improved growth performance in chickens and had a positive impact on the diversity and composition of gut microbiota. This study suggests that using a phage cocktail in combination with probiotics could be a promising alternative to AGPs for poultry production.

Abstract

Phages, which are often used therapeutically, have begun to receive interest as alternatives to antibiotic growth promoters (AGPs) for enhancing chicken growth. Another option that has been extensively studied as a growth promoter in chickens is probiotics. To the best of our knowledge, there is currently no study available on the use of phages and probiotics in combination as potential feed additives for broiler chickens. Therefore, this study demonstrated the effects of a phage cocktail, probiotics, and their combination on the growth performance and gut microbiota of broiler chickens. A total of 288 one-day-old male Cobb 500 broilers were randomly allotted to one of six treatments in a completely randomised design. The treatments were (i) C (basal diet (BD) only), (ii) 1ϕ (BD + 0.1% phage cocktail), (iii) 2ϕ (BD + 0.2% phage cocktail), (iv) P (BD + 0.1% probiotic), (v) 1ϕP (BD + 0.1% phage cocktail + 0.1% probiotic), and (vi) 2ϕP (BD + 0.2% phage cocktail + 0.1% probiotic). The 1ϕP treatment had significantly (p < 0.05) better BW (35 days), BWG (22–35 days, 1–35 days), and FCR (1–21 days, 22–35 days, 1–35 days) compared to C. Unique gut microbiota diversity was also found between the ϕP (1ϕP and 2ϕP) and non-ϕP groups (C, 1ϕ, 2ϕ, and P) in ilea, particularly in the 35-day-old chickens. Microorganisms associated with short-chain fatty acid (SCFA) producers were significantly (p < 0.05) more present in the ϕP group than in the non-ϕP group. The predicted genes related to carbohydrate and amino acid metabolism were significantly upregulated in ϕP groups compared to non-ϕP groups. These genes were involved in the digestion and absorption of nutrients, as well as the production of energy. Our findings showed that the 1ϕP treatment could be a potential alternative to AGPs for poultry, as growth performance was enhanced, and gut microbiota was positively modulated.

Graphical Abstract

1. Introduction

Poultry is the most important agricultural sector, providing the cheapest protein source to the global population. The use of antibiotic growth promoters (AGPs) in poultry production may be a significant factor that reduces production costs. AGPs are supplemented in feed at a subliminal amount, which can improve growth performance and reduce diseases in chickens [1,2,3]. The use of AGPs has been beneficial for animal production, but it has been reported to be one of the causes of antibiotic-resistant bacteria, resulting in serious health problems for humans due to the inefficacy of antibiotics to treat infections [4,5]. Hence, AGP use in livestock has been banned in certain parts of the world, such as European Union countries and South Korea [6,7,8]. The abolition of AGPs has affected the performance and health of broilers, necessitating the development of an effective substitute to provide the same level of sustainable chicken production as when AGPs are utilised [9,10]. Phage usage has, thus, begun to attract attention as a possible AGP replacement.
Phages are bacteria-infecting viruses that have recently attracted attention as an alternative to antibiotics. They have various advantages over antibiotics, including a narrow killing spectrum for targeting certain bacterial species, the ability to rapidly proliferate in the presence of a host and eventually kill the host, and easy isolation from the environment (Keen & Adhya, 2015; Rose et al., 2014; Ryan et al., 2011). Phages show similar mechanisms of action to AGPs, but the phage target is specific. Its application can reduce selected target bacterial species, thereby reducing competition with other normal gut microflora for adhesion sites and nutrient utilization. Phages are commonly employed for therapeutic purposes; however, they have recently been explored for gut modulation. Pathogens such as Escherichia coli, Salmonella spp., Clostridium spp., and coliforms were significantly reduced, and beneficial bacteria such as Bifidobacterium spp. and Lactobacillus spp. increased in pigs and chickens when phages were used to modulate the gut microbiota [11,12,13,14,15,16]. These studies indicate that phages could be utilised to modulate the gut microbiome to increase beneficial bacteria and decrease harmful bacteria. Probiotics, which are extensively studied as a potential AGP replacement, have never been used in conjunction with phage treatment in broiler chickens. Probiotics are live microorganisms that may benefit the host when administered sufficiently [17,18]. Previous studies have shown that probiotics improve the growth and health of broiler chickens [19,20,21,22].
In this study, the phage that targets non-pathogenic E. coli does not require thorough purification using caesium chloride (CsCl) and ultracentrifugation, in contrast to phages that target pathogens for therapeutic purposes [23,24]. In the case of phages that target non-pathogens, the bacterial debris present in the unpurified lysate may not provoke an immune response and kill the host. E. coli was also selected as the target bacterial host for the gut modification investigation because of its continuous presence in the ilea and caeca of broiler chickens at different ages [25,26]. Both E. coli host and phages were isolated previously from the ilea and caeca of healthy broiler chickens and characterised. Only non-pathogenic E. coli was selected for phage isolation, which was then used for further study. There is a paucity of knowledge about the impact of phages targeting non-pathogenic E. coli, probiotics, and their combination in chickens. Therefore, this study aimed to assess the effects of a phage cocktail that targets non-pathogenic E. coli, commercial probiotics, and their combination on the growth performance and gut microbiota of broiler chickens.

2. Materials and Methods

2.1. Probiotics and Phage Preparation

Escherichia coli P1, P2, P3, and P4 phages (prepared as a freeze-dried phage cocktail) at a titre of 1010 PFU/g each were prepared. Briefly, the carrier materials of skim milk (Oxoid, UK) for protecting phages from high temperature, along with industrial maltodextrin as a cryoprotectant and calcium carbonate (CaCO3) (Merck, Germany) as an antacid, were pre-dissolved with each diluted phage lysate at the ratio of 2:2:1:5, respectively. The phage lysate was diluted in sterile SM buffer (50 mM Tris-HCl [pH 7.5], 0.10 M NaCl, and 8 mM MgSO4·7H2O) to a final titre of ~1–5 × 10¹⁰ PFU/g. The mixture was then freeze-dried in a Labconco freeze-dryer (Labconco, Kansas City, MO, USA) by first pressing the vacuum when the temperature was at −40 °C or colder. Samples were then added when the vacuum was 1.33 × 10⁻³ mBar or lower. The titre of freeze-dried powder of each phage was quantified weekly until the week of the chicken trial. This was to ensure their survivability and concentration maintained at ~1010 PFU/g. The powder forms of each phage (C1, C2, C3, and C4 phages) were then mixed at the ratio of 1:1:1:1 to obtain a final phage cocktail form to be supplemented into the chicken feeds. Commercial PrimaLac® probiotic (Starlabs, Piscataway, NJ, USA) used in this study consisted of Lactobacillus acidophilus, Lactobacillus casei, Bifidobacterium termophilum, Enterococcus faecium, and Aspergillus oryzae at a concentration of 109 CFU/g each. The phage cocktail and commercial probiotic were mixed with basal feed fresh daily before being fed to the chickens.

2.2. Chicken Management

A total of 288 1 day old male Cobb 500 broiler chickens (initial body weight (BW) = 42.95 ± 2.26 g) were obtained from a local commercial hatchery. They were housed in stainless-steel three-tiered battery cages with raised wire floors (dimensions: 116 cm width × 89 cm length × 46 cm height) in an open-house facility at the Animal Research Centre (ARC), Institute of Tropical Agriculture, Universiti Putra Malaysia, Malaysia. The cages were cleaned and disinfected through fumigation beforehand, and strict hygiene and biosecurity measures were practiced throughout the experiment. The feeders and drinkers were cleaned and filled with fresh feed and water daily. The temperature and relative humidity were recorded twice daily in the morning and the afternoon. For the chicken brooding period, lasting for the first 14 days, lighting from a 100 W bulb per cage was provided for each replicate cage. The raised wire floors were covered with newspaper and cleaned daily. Procedures pertaining to chicken management, experimental design, and analyses were approved by the Institutional Animal Care and Use Committee (IACUC) Universiti Putra Malaysia (Ref: UPM/IACUC/AUP-R101/2015).

2.3. Experimental Design, Animals, and Diets

A total of 288 1 day old male Cobb 500 broilers were randomly allotted to one of six dietary treatments with six replicate cages containing eight chicks per cage in a completely randomised design. The dietary treatments were (i) basal diet only (BD) (control, C), (ii) BD + 1 g/kg phage cocktail (1ϕ), (iii) BD + 2 g/kg phage cocktail (2ϕ), (iv) BD + 1 g/kg probiotic (P), (v) BD + 1 g/kg phage cocktail + 1 g/kg probiotic (1ϕP), and (vi) BD + 2 g/kg phage cocktail + 1 g/kg probiotic (2ϕP). Both the phage cocktail and the probiotics for respective treatments were supplemented at the expense of corn to achieve a final equal percentage for each treatment group. The basal diets formulated for starter (1 to 21 days) (Table 1) and finisher (22 to 35 days) (Table 2) periods were antibiotic-free, in mash form, meeting or exceeding the energy and nutrient requirements as recommended by the NRC [27] for each growing phase. Both feeds and water were provided ad libitum.

2.4. Chemical Analysis of Experimental Diets

The formulated starter feed, finisher feed, phage cocktail, and probiotic were chemically analysed through feed proximate analyses (Malaysian Agricultural Research and Development Institute (MARDI)) on crude protein, crude fat, crude fibre, calcium, phosphorus, and sodium (Table 1 and Table 2).

2.5. Sampling

For every sampling period on day 21 and 35, 12 chickens per treatment (two chickens per replicate cage) were randomly selected, weighed, and euthanised by severing the jugular veins. The mucosal contents of ilea and caeca samples were used for the gut microbiota study based on high-throughput next-generation sequencing (HT-NGS) of 16S rRNA gene amplicons. All samples were kept on ice before the respective samples were processed. They were then frozen at −80 °C until analysis.

2.6. Growth Performance

The chicken body weight (BW) and body weight gain (BWG) were individually recorded on a weekly basis (at 1, 7, 14, 21, 28, and 35 days), while feed intake (FI) and replicate cages were recorded daily. The mortality rate was checked and recorded daily, while the number of chickens for FI calculation was then adjusted accordingly. The body weight gain (BWG), feed conversion ratio (FCR), and mortality rate were calculated as described by Naidoo, et al. [28] and Wang and Xu [29]:
Body   weight   gain   B W G = F i n a l   b o d y   w e i g h t I n i t i a l   b o d y   w e i g h t N u m b e r   o f   b i r d s .
Feed   conversion   ratio   ( FCR ) = F e e d   i n t a k e   ( F I ) B W G .
Mortality   rate = Number   of   dead   birds   in   treatment   group Number   of   initial   birds   in   each   treatment   group × 100 .

2.7. Chicken Gut Microbiota Study

2.7.1. DNA Extraction

Genomic DNA was extracted using a QIAamp Fast DNA Stool Mini Kit (QIAGEN, Stockach, Germany). The mucosal contents of the ilea and caeca (~180–220 mg) were treated with lysozyme lysis buffer (25 mg/mL lysozyme; 20 mM Tris-Cl, pH 8.0; 2 mM EDTA, pH 8.0; 1% Triton X-100) and incubated for 30 min at 37 °C to facilitate the lysis of Gram-positive bacteria. Then, 1 mL of InhibitEX Buffer was added to each sample and vortexed continuously for 1 min. The mixtures were then heated for 5 min at 95 °C and vortexed for 10 s to lyse Gram-positive bacteria. Subsequently, the solution was centrifuged at 16,100× g for 1 min to pellet the intestinal debris. The supernatants were treated with 4 µL of 5 µg/mL RNase A (Epicentre, WI, USA) and incubated for 30 min at 37 °C to remove RNA. The eluted genomic DNA was then stored at −20 °C before further use.

2.7.2. Illumina Sequencing of the V3–V4 Region of the 16S rRNA Gene

The V3–V4 hypervariable region of 16S rRNA gene was amplified using the forward primer (5′–TCGTCGGCAGCGTCAGATGTGTATAAGAGACAGNNNNCCTACGGGNG GCWGCAG–3′) and reverse primer (5′–GTCTCGTGGGCTATAAGAGACA GGACTACHVGGGTATCTAATCC–3′) (Integrated DNA Technologies (IDT), Singapore) as described by Klindworth, et al. [30], with some modifications. Four degenerate bases (N) were added to maximise the diversity for unique cluster identification. The purified amplicons were quantified using a Qubit Fluorometer (ThermoFisher Scientific, Waltham, MA, USA), normalised to 2 nM, and subjected to Illumina Miseq desktop sequencing using paired 300 bp reads with the Miseq Reagent Kit v3 (600-cycle) (Illumina, CA, USA) at Monash University Malaysia Genomic Facility.

2.7.3. Bioinformatics Analysis

Sequences in FASTQ format were assembled and quality-filtered using the Mothur software package (v. 1.38.1) [31]. The processed sequences were subsampled to 9998 prior to alpha diversity analyses. The table of raw OTUs was normalised using the “cumNorm” command. In addition, OTUs with significant differences in abundance were selected on the basis of a zero-inflated log-normal model using the “fitFeatureModel” command. Both “cumNorm” and “fitFeatureModel” were implemented in metagenomSeq package [32]. The table of normalised OTUs was exported into PRIMER7 with the PERMANOVA add-on programme package (Plymouth Marine Laboratory, Plymouth, UK) and converted to the Bray–Curtis similarity index for group comparison [i.e., permutational multivariate analysis of variance (PERMANOVA)] and statistical ordinations [i.e., canonical analysis of principal coordinates (CAP) and principal coordinate analysis (PCO)].

2.7.4. Microbial Predicted Functional Metagenomes Based on PICRUSt and STAMP

The prediction of metagenome function from the 16S rRNA marker gene was performed using Phylogenetic Investigation of Communities by Reconstruction of Unobserved States (PICRUSt) version 1.1.0 [33]. The Greengenes-based biom file was generated using Mothur software and uploaded into online galaxy PICRUSt (http://huttenhower.sph.harvard.edu/galaxy/ (accessed on 13 March 2023)). The OTU table was first normalised for multiple 16S copy numbers, where the genome was then predicted according to Kyoto Encyclopaedia of Genes and Genomes (KEGG) ortholog abundances. The output files were then analysed using the Statistical Analysis of Metagenomic Profiles (STAMP) version 2.1.3 bioinformatics software package [34]. Storey’s FDR multiple test correction method was used to calculate the statistical significance, and the features were filtered by an effect size at 0.05.

2.7.5. Nucleotide Sequence Accession Numbers

The V3–V4 regions of 16S rRNA gene sequences from this study were deposited in the NCBI sequence read archive (https://www.ncbi.nlm.nih.gov/sra (accessed on 13 March 2023)) under BioSample Accession numbers SAMN06027949–SAMN06028092.

2.8. Statistical Analysis

The experimental data were analysed with a one-way analysis of variance (ANOVA) and paired t-test using the Statistical Package for Social Science (SPSS) Statistics version 22 (IBM, New York, NY, USA). The replicate cage was used as the experimental unit for all parameters, unless stated otherwise. Results were stated as means or means ± standard error (SE). Significant means with p < 0.05 were compared within samples by Duncan’s multiple range test [35].

3. Results

3.1. Growth Performance

The effects of dietary treatments on growth performance are presented in Table 3. At 21 days of age, there were no significant differences in BW or BWG among the treatments (Table 3). After birds were selected and removed for sampling, there were still no differences among the treatments in these parameters, according to the remaining birds moving forward in the experiment (data not shown). Chickens fed with 1ϕP had significantly (p < 0.05) better BW (35 days), BWG (22–35 days, 1–35 days), and FCR (1–21 days, 22–35 days, 1–35 days) compared to the control. However, this was not the case for chickens fed with P, where the FCR was not significantly (p > 0.05) different compared to the control in the period of 1–21 days. The phage cocktail alone (1ϕ and 2ϕ) showed significantly better (p < 0.05) FCR (1–21 days, 22–35 days, 1–35 days) compared to the control group. The highest mortality rate was recorded in both the control and the 2ϕ groups at 4.17%, whereas no mortality was observed in the P group.

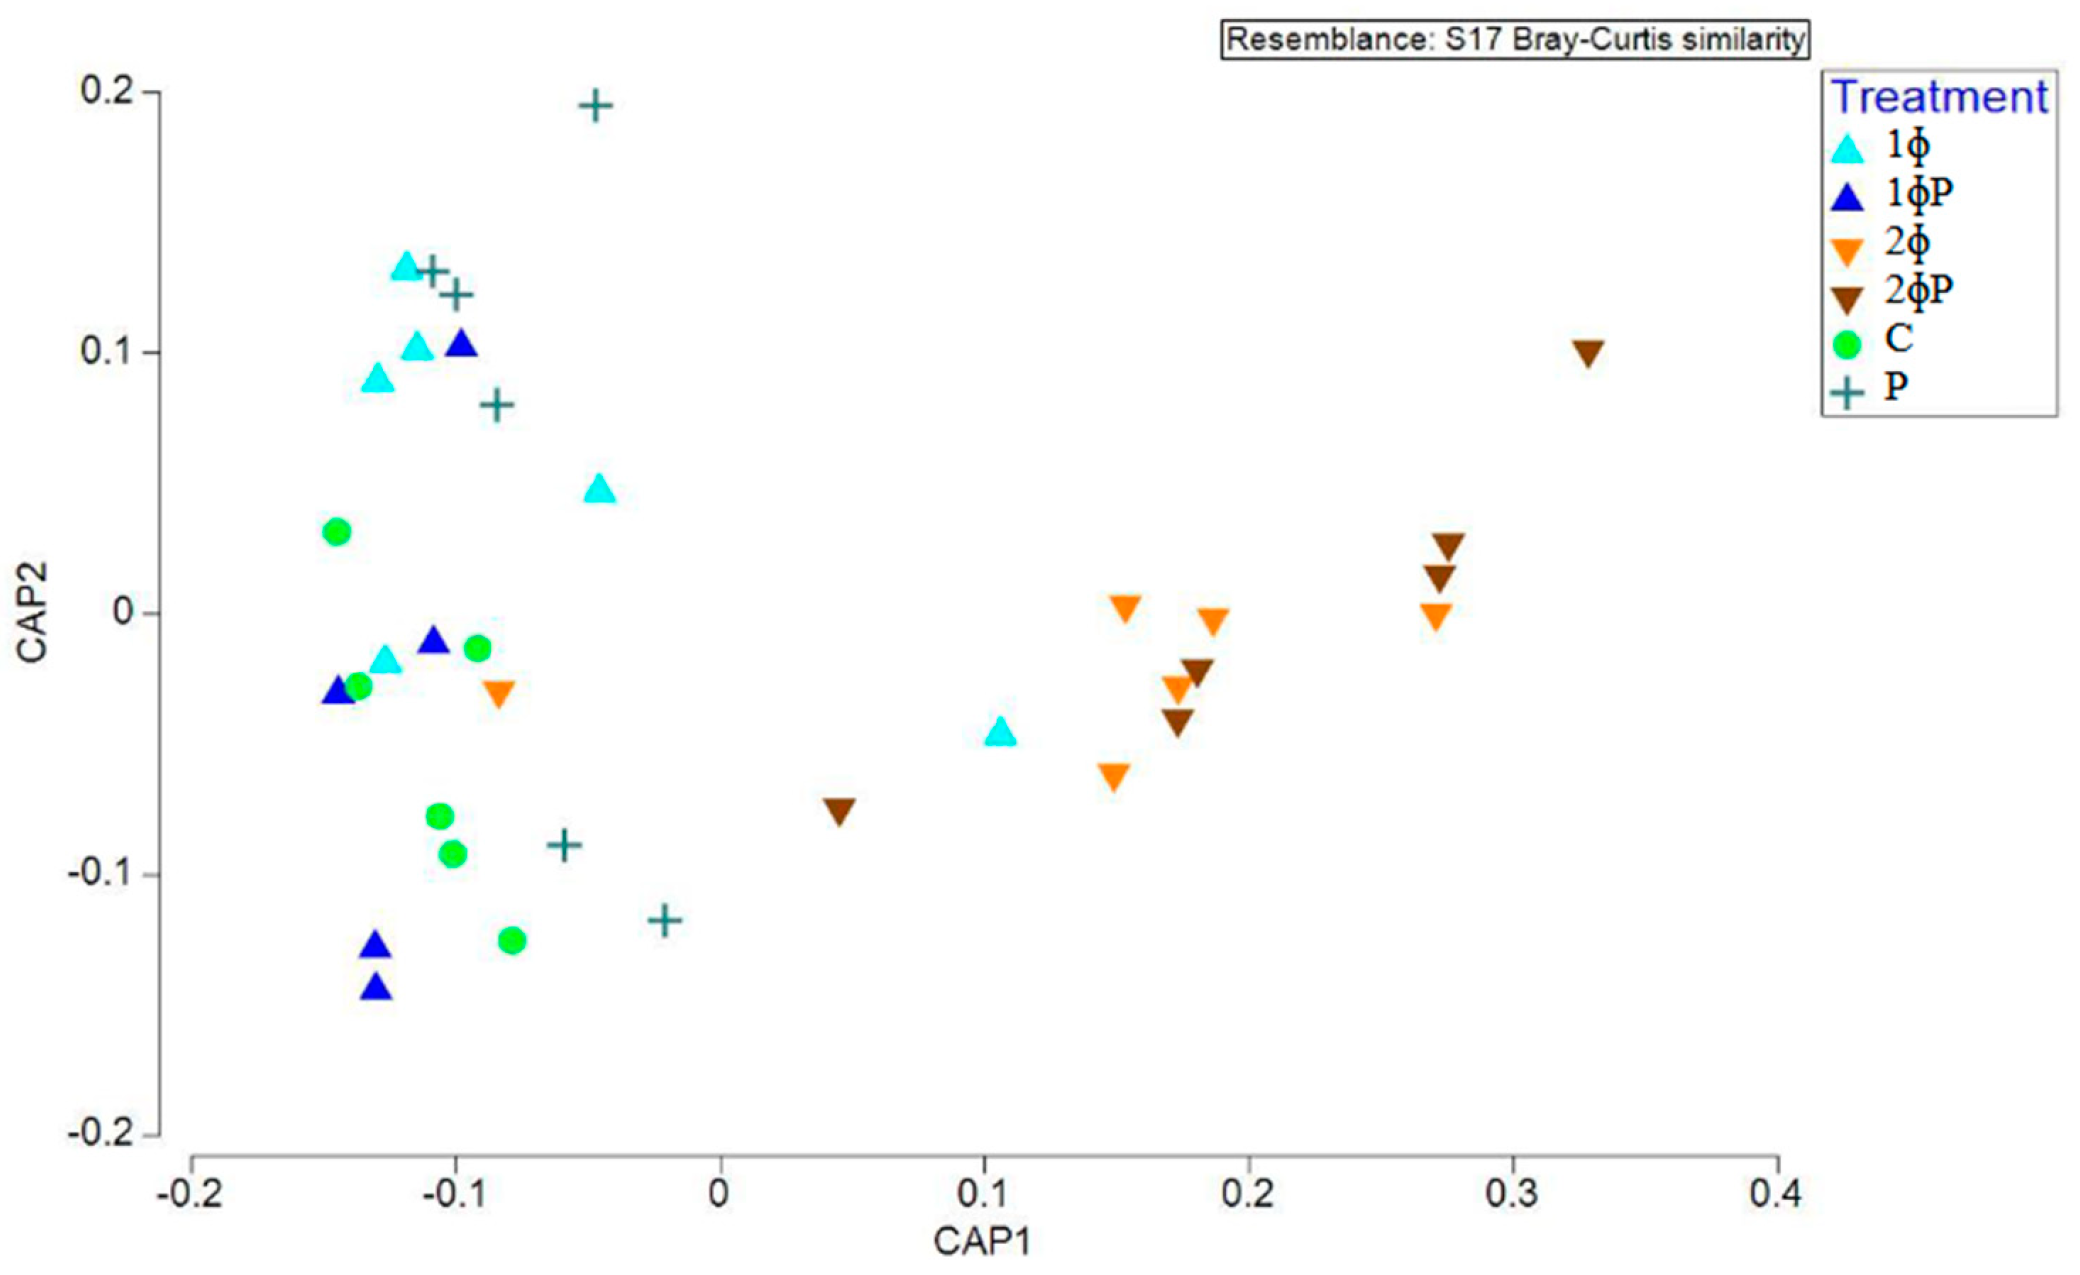
3.2. Multivariate Analysis on Gut Microbiota

The study employed a principal coordinate analysis (PCO) plot of the Bray-Curtis similarity index to investigate the structure of the gut microbiota. The analysis considered dietary treatment, age (21 and 35 days), and part of the intestine (ilea and caeca). The results showed a clear separation of chicken gut microbiota based on age (21 and 35 d) (Figure S2) and part of intestine (ilea and caeca) (Figure S3) was observed. Additionally, the ϕP (1ϕP and 2ϕP) gut microbiota was significantly different from the non-ϕP group (C, 1ϕ, 2ϕ, and P) (Figure S4).
Further analysis was conducted using the canonical analysis of principal coordinates (CAP) plot to investigate differences in the gut microbiota structure among the dietary treatments. The CAP plot revealed distinct differences between the ϕP gut microbiota and the non-ϕP group, particularly in the ilea of 21- and 35-day-old chickens (Figure S5), as well as in the ilea of 35-day-old chickens. (Figure 1).
Further verifications were performed to validate the earlier patterns observed from the PCA plot. The hypothesis test on the difference in gut microbiota according to age, part of the intestine, and dietary treatment was verified using the permutational multivariate analysis of variance (PERMANOVA) marginal test.
According to the PERMANOVA marginal test, the diversity of gut microbiota was found to be significantly different based on age (p = 0.002) (Table S2), part of intestine (p = 0.001) (Table S2), dietary treatment in the ilea (p = 0.005) (Table S3), and dietary treatment in the ilea of 35 day old chickens (p = 0.001) (Table 4). The patterns observed earlier in a CAP plot were further verified by the PERMANOVA pairwise test, which was conducted based on dietary treatment in the ilea of 21 and 35-day-old chickens (Table S3b) as well as the ilea of 35-day-old chickens (Table 4b). These tests revealed a significant difference in gut microbiota between the ϕP and non-ϕP groups.

3.3. Significant OTUs Present in the ϕP Compared to the Non-ϕP Groups

The OTUs that were significantly expressed in the phage cocktail and probiotic combination groups (ϕP) were identified using “fitFeatureModel” in the metagenomeSeq package (Table 5). The value of logFC is directly related to abundance in the ϕP groups. Of the top 50 OTUs selected, the most common bacterial genera or species that were significantly elevated in ϕP groups, compared to non-ϕP groups, were Bacteroides, Odoribacter, Alistipes, Anaerotruncus, Ruminococcaceae, Lachnospiraceae, Ruminococcus, Desulfovibrio, Anaerostipes, Clostridium, Coprobacillus, Butyricimonas, Faecalibacterium prausnitzii, and Oscillopira.

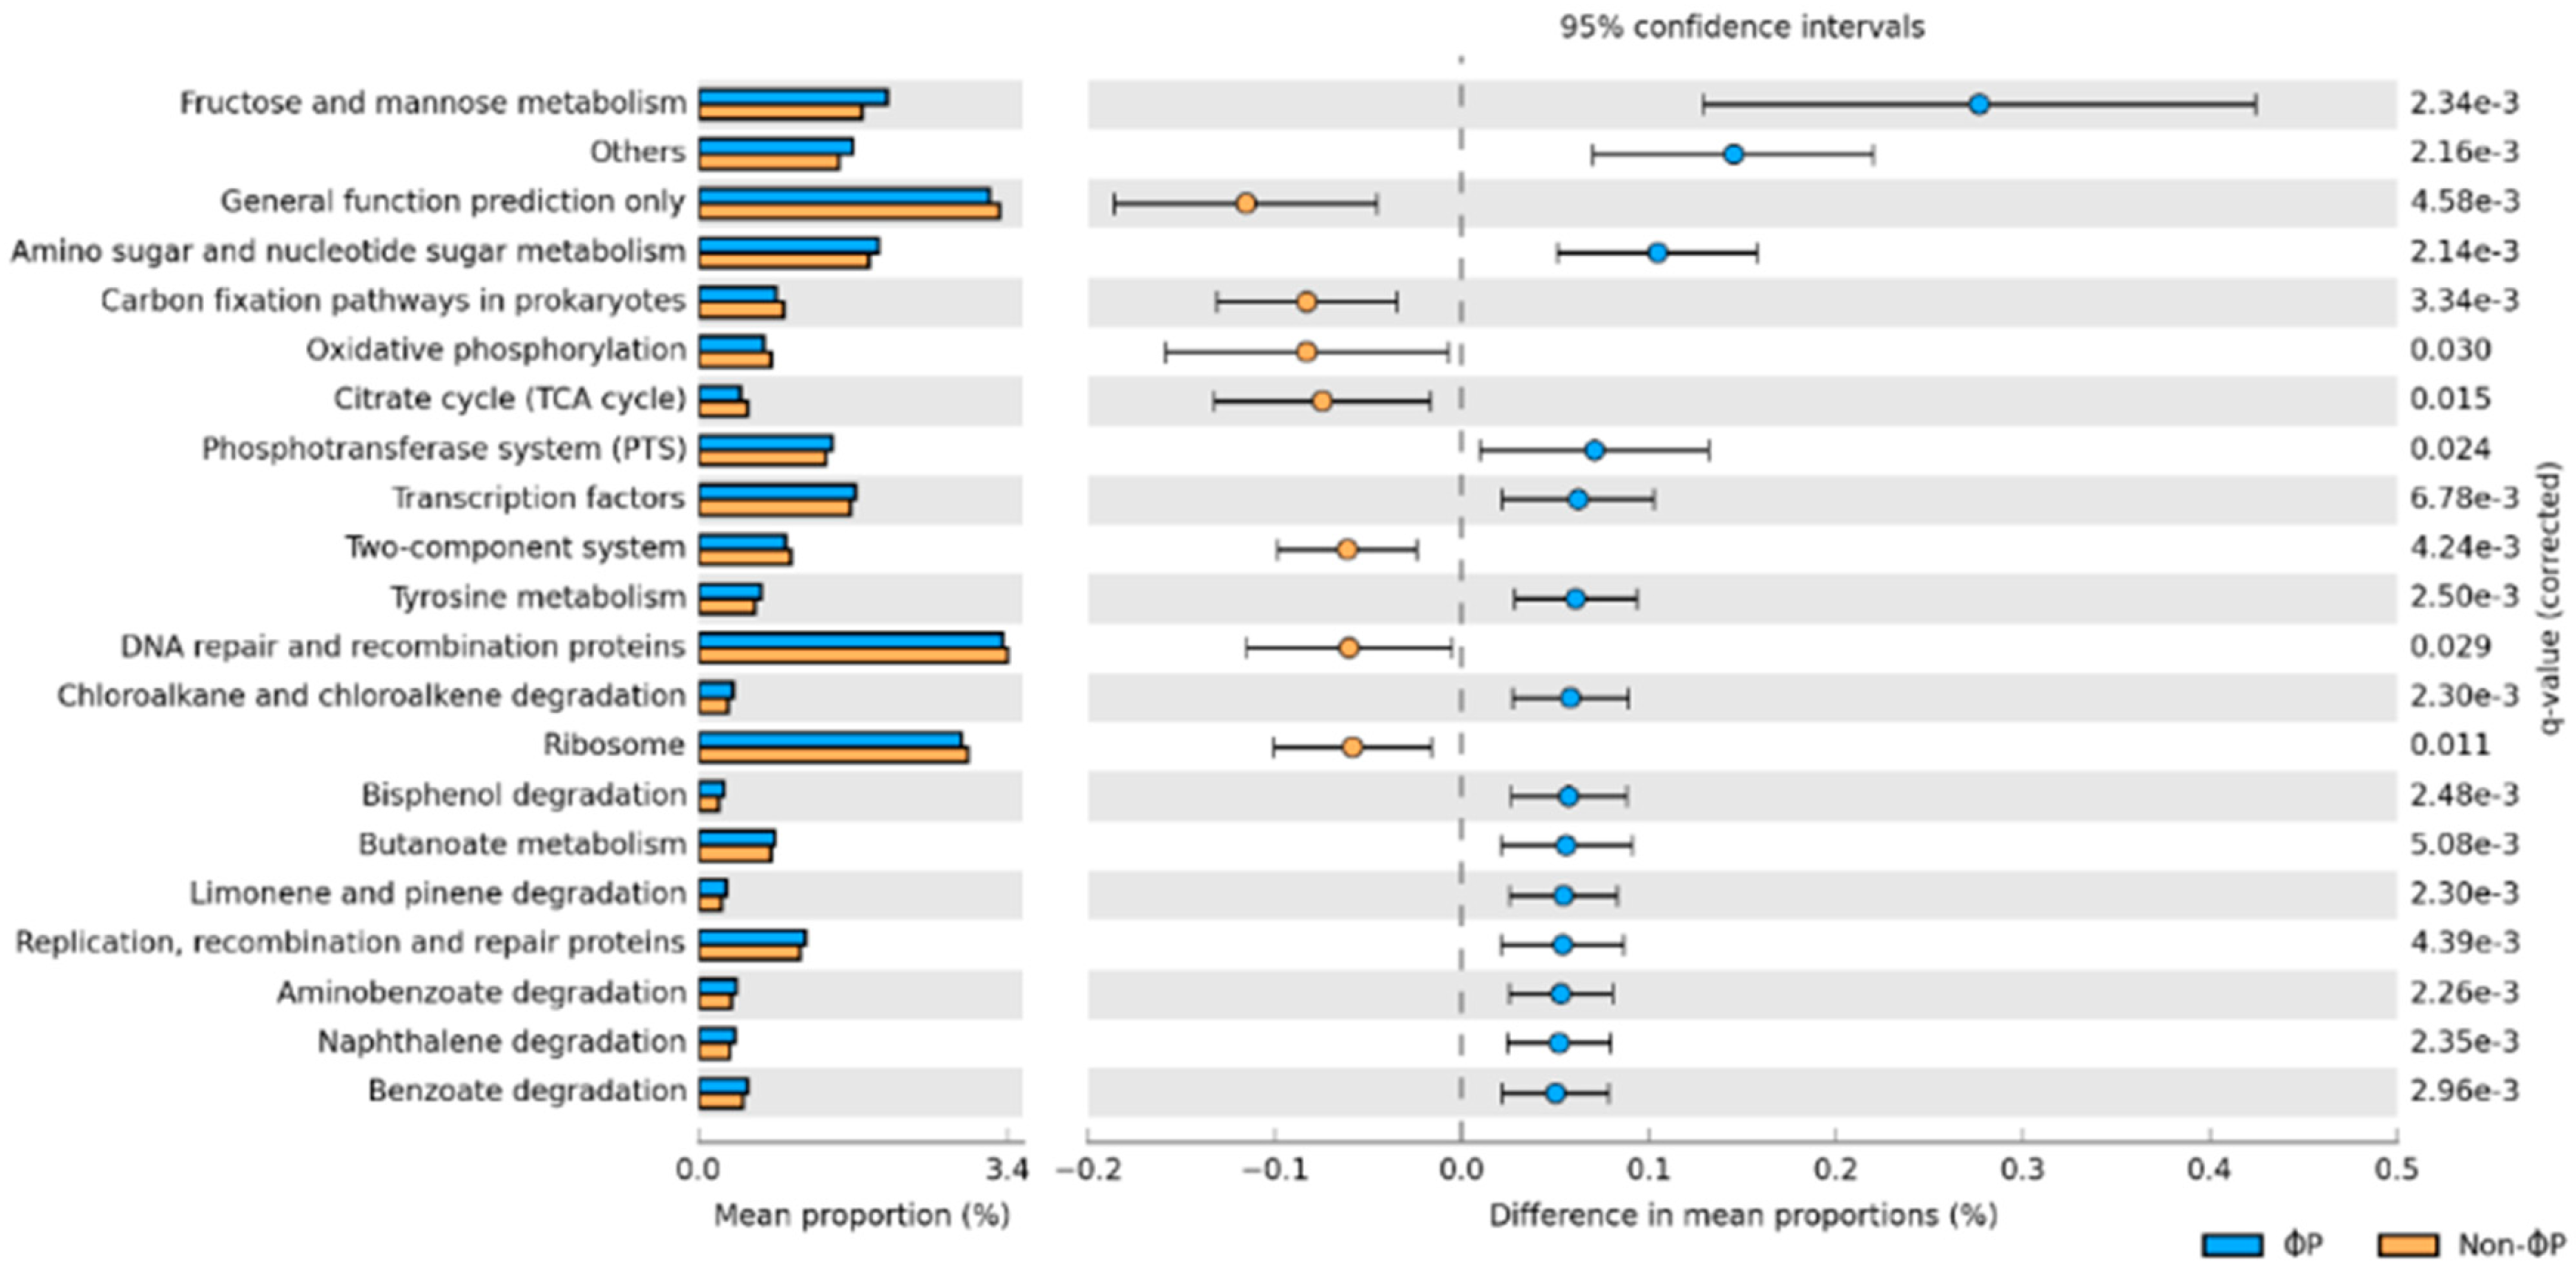
3.4. Microbial Predicted Functional Metagenomes

The gut microbiota was unique between ϕP and non-ϕP groups according to the functional metagenomes predicted by STAMP analysis (Figure 2). There were also significant differences in metabolic pathways between ϕP and non-ϕP groups according to functional metagenomes predicted from filtered Storey’s FDR multiple test correction analyses (Figure 3). Fourteen out of 21 KEGG features were significantly higher in ϕP compared to non-ϕP groups. The metabolic pathways of ϕP groups related to carbohydrate (e.g., fructose and mannose metabolism), amino-acid (e.g., amino sugar and nucleotide sugar metabolism), and tyrosine metabolism were significantly elevated compared to those of non-ϕP groups.

4. Discussion

This is the first study to investigate the effects of dietary supplementation with freeze-dried Escherichia coli phage cocktail at different dosages (four different phages that lyse four different E. coli strains at 1010 PFU/g each), commercial probiotics (Lactobacillus acidophilus, Lactobacillus casei, Bifidobacterium termophilum, Enterococcus faecium, and Aspergillus oryzae at 109 CFU/g each), and their combination on the growth performance and gut microbiota diversity of broiler chickens. The experiment was performed in normal physiological conditions without bacterial (E. coli) challenge. The present study also demonstrates, for the first time, the use of a phage targeting non-pathogenic E. coli. This study showed that supplementing chickens with a combination of phage cocktail and probiotics may have positively influenced growth performance and modulated the gut microbiota.
Growth performance parameters are the most important parameters to evaluate the efficacy of feed supplements in broiler production. High BW, BWG, FI, and low FCR indicate improved growth performance. The results of the present study showed that the growth performance of chickens fed with 1ϕP was significantly (p < 0.05) better than control (Table 3); 1ϕP also showed better FCR (1–21 days) compared to control than the P group. The group that received a higher dosage of the 2ϕP phage did not exhibit improved growth performance compared to the group that received 1ϕP, indicating a limit to the benefits of phage, and suggesting that increasing the dosage beyond a certain point does not provide any additional benefits. No previous study investigated the effects of a combination of phages and probiotics in chicken, hindering comparison. However, studies in pigs have shown that supplementation with 1 g/kg and 1.5 g/kg commercial phage cocktail (Salmonella typhimurium, Salmonella enteritidis, Salmonella cholerasuis, and Salmonella derby, Staphylococcus aureus, Escherichia coli (k88, k99, and f41), and Clostridium perfringens types A and C at 109 PFU/g each) without bacterial challenge and in combination with 3 g/kg probiotics (Lactobacillus acidophilus K31, Bacillus subtilis K 42, and Saccharomyces cerevisiae K47) at 108, 109, and 104 CFU/g, respectively) did not lead to any significant improvement in growth performance compared to phage alone (Kim et al., 2016). This contrasts the findings reported here because pigs and broilers have distinct physiological gut environments.
In the current study, 1ϕ and 2ϕ groups showed significantly (p < 0.05) better FCR (1–21 days, 22–35 days, 1–35 days) than the control, in accordance with other studies. A previous study demonstrated that the FCR of broilers supplemented with 1 mL of 1010 PFU/mL Salmonella typhimurium phage with the bacterial challenge was significantly better than that of the control [16]. This result is in contrast to the findings of Upadhaya, et al. [36], who found that broilers supplemented with 0.5 g/kg and 1 g/kg phage cocktail (S. gallinarum, S. typhimurium, S. enteritidis, and E. coli at 1.0 × 10⁸ PFU/g each, and C. perfringens at 1.0 × 10⁶ PFU/g) without bacterial challenge only showed slightly (not significant) better BWG, FI, and FCR than the control. In our study, there was no difference in growth performance between low (1 g/kg of 1010 PFU/g) and high (2 g/kg of 1010 PFU/g) dosages of phages. Our result is in contrast with a study by Wang, Yan, Lee and Kim [14], who reported that a higher dosage of 0.5 g/kg S. typhimurium phage (108 PFU/g) without bacterial challenge showed significantly better FCR (1–14 days) compared to control than the lower dosage of 0.25 g/kg S. typhimurium phage (108 PFU/g). This inconsistency may be because the concentration of phage used in our study was already very high at 1010 PFU/g compared to others at 108 PFU/g. A note of caution is also due here since previous studies mentioned earlier incorporated phages targeting pathogens such as S. typhimurium, S. gallinarum, S. enteritidis, C. perfringens, and E. coli. It is evidenced from this study that phage supplements that target non-pathogenic E. coli could also result in a significant improvement in growth performance.
According to the CAP plot and PERMANOVA pairwise test, a distinct gut microbiota was found between the ϕP (1ϕP and 2ϕP) and non-ϕP groups (C, 1ϕ, 2ϕ, and P) in the ilea of 35 day old chickens. No prior research has examined the effects of phages, probiotics, and their combination on the diversity of the gut microbiota based on 16S rRNA HT-NGS, hindering comparison. Upadhaya, Ahn, Cho, Kim, Kang, Kim, Kim and Kim [36], however, demonstrated that chickens supplied with 0.5 g/kg phage cocktail, 1 g/kg phage cocktail, and 0.25 g/kg Avilamix (antibiotic) had distinctively different gut microbiota according to unweighted UniFrac. This demonstrates that the diversity of the gut microbiota was altered by phage supplementation in broiler chickens. On the other note, in accordance with earlier studies, the chicken gut microbiota showed distinct differences based on age (p = 0.002) (21 days and 35 days) and section of the intestine (p = 0.001) (ilea and caeca) [25,37,38,39].
In the current study, the OTUs that were significantly (p < 0.05) present in the ϕP with respect to the non-ϕP groups were related to short-chain fatty acid (SCFA) producers (e.g., Bacteroides, Odoribacter, Alistipes, Anaerotruncus, Ruminococcus, Clostridiales, Clostridium, Desulfovibrio, Butyricimonas, Faecalibacterium prausnitzii, Anaerostipes, and Phascolarctobacterium). These SCFA producers have known roles for excreting various enzymes to facilitate the breakdown of non-starch polysaccharides (NSP) to SCFAs such as acetic, succinic, propionic, and butyric acid in chickens [40,41,42,43]. The presence of these SCFA producers is associated with better digestion and energy production that improved growth performance in chickens [44]. The SCFAs produced from the breakdown and fermentation of polysaccharides (e.g., cellulose and hemicellulose) have also been recognised as an important source of energy for the host. Furthermore, SCFA producers have also been reported to inhibit the growth of pathogens such as Salmonella spp. and C. perfringens according to the reduction of intestinal pH, excretion of mucin, and host antimicrobial peptides [43,45,46,47]. The beneficial effects reported on the presence of SCFA producers could have been responsible for the improvement of chicken growth performance in the ϕP groups, especially the 1ϕP group. However, the roles of phages and probiotic combinations in promoting SCFA producers were not clear.
Based on the microbial predicted metagenome study, genes related to nutrient digestion and absorption and energy production, such as carbohydrate metabolism (fructose and mannose metabolism; butanoate metabolism) and amino-acid metabolism (amino sugar and nucleotide sugar metabolism) were significantly upregulated in ϕP compared to non-ϕP groups. These findings are consistent with our earlier findings that SCFA producers significantly present in ϕP groups could be capable of hydrolysing carbohydrates such as non-starch polysaccharides (NSPs) (e.g., glucose, fructose, starch, and fructooligosaccharide) [48]. Another predicted function is the phosphotransferase system (PTS). The PTS has been demonstrated to facilitate the nutrient uptake of carbohydrate, glycerol, and phosphate in members of Firmicutes bacteria [42]. The higher microbial predicted function related to metabolism and nutrient absorption suggests that ϕP groups gut microbiota were modulated, which may have resulted in the improvement in chicken growth performance in the 1ϕP supplemented group, especially in the period of 1–21 days. However, these predicted microbial metagenome data need to be interpreted with caution as they can only be accurately assigned to the sequences present in the database, whereas there is no assignment available for novel bacteria [49]. In addition, the predicted genes are not necessarily expressed in the host. Therefore, a further validation step using targeted reverse transcriptase or shotgun metagenomics is required to study the RNA expression of target genes.
It is unclear exactly how phages and probiotics affected the production of these SCFAs in the gut microbiota, which may have also positively influenced growth performance. Further research is required to understand the mechanisms underlying the efficacy of phage and probiotic combinations in enhancing growth performance and gut microbiota diversity. It was proposed that the synergistic effects of the E. coli phage cocktail and probiotic combination may have supplied additional adhesion sites and nutrients, as well as lowered toxins that favour the colonisation of these SCFAs producers. Although the advent of 16S rRNA of HT-NGS provides an unprecedented depth of sequencing gut microbiota, it unable to differentiate between viable and nonviable microorganisms [50]. Knowing whether or not a microorganism is viable is important, particularly in research utilising phages. Future studies could focus on treating DNA samples with propidium monoazide (PMA), which is able to distinguish the viability of microorganisms [51].

5. Conclusions

This study was carried out to determine the effects of an E. coli phage cocktail, commercial probiotics, and their combination on the growth performance and modulation of gut microbiota in the ilea and caeca of 21 and 35 day old broiler chicken. Specifically, this study identified that supplementing a combination of 1 g/kg phage cocktail and probiotic (1ϕP) to broiler chickens significantly improved chicken growth performance and positively modulated gut microbiota. The 1ϕP group also had significantly better FCR (1–21 days) compared to the control than the probiotic (P) group. The OTUs related to SCFAs producers were dominantly observed in ϕP compared to the non-ϕP groups. They might be responsible for gut microbiota modulation that facilitates carbohydrate and amino-acid metabolism, as well as nutrient uptake, thereby providing energy for chicken growth. The predicted microbial metagenomes also showed that the genes related to carbohydrate and amino-acid metabolism and nutrient uptake were significantly present in ϕP compared to the non-ϕP groups. The results indicates that the 1ϕP supplement could be considered a potential alternative to AGPs for poultry.

Supplementary Materials

The following supporting information can be downloaded at: https://www.mdpi.com/article/10.3390/ani13081328/s1, Figure S1: Rarefaction curves of species (OTUs) versus sample size (number of sequences) plotted at 97% sequences identity; Figure S2: The spread of gut microbiota of different age (21 and 35 d) of chickens investigated based on Principal coordinate analysis (PCO) of Bray-Curtis similarity index; Figure S3: The spread of gut microbiota of different part of intestine (ilea and caeca) of chickens investigated based on Principal coordinate analysis (PCO) of Bray-Curtis similarity index; Figure S4: Structure of gut microbiota supplemented with different dietary treatments in ilea and caeca of 21 and 35 d chickens investigated based on Principal coordinate analysis(PCO) of Bray-Curtis similarity index; Figure S5: Structure of gut microbiota supplemented with different dietary treatments in ilea of 21 and 35 d chickens investigated based on Canonical analysis of principal coordinates (CAP) of Bray-Curtis similarity index; Table S1: Alpha diversity of measured number of observed OTUs, ACE, Shannon and Inverse Simpson from sequences that were normalised to 9998; Table S2: PERMANOVA marginal test on Bray-Curtis similarities (includes degrees of freedom (Df), sum of squares (SS), mean square (MS) and P value under Monte-Carlo correction (PMC)) for gut microbiota diversity; Table S3: Structure of gut microbiota supplemented with different dietary treatments in ilea of 21 and 35 d old chickens based on PERMANOVA (a) marginal and (b) pairwise test of Bray-Curtis similarities.

Author Contributions

Conceptualization, M.A.M.S. and C.C.S.; Methodology, M.A.M.S. and C.C.S.; Software, M.A.M.S. and C.W.C.; Validation, M.A.M.S., C.C.S. and C.W.C.; Formal analysis, M.A.M.S.; Investigation, M.A.M.S.; Resources, M.A.M.S., T.G.H. and G.H.M.; Data curation, M.A.M.S. and C.W.C.; Writing–original draft, M.A.M.S.; Writing–review & editing, M.A.M.S. and Y.W.H.; Visualization, M.A.M.S. and C.C.S.; Supervision, C.C.S., T.G.H. and Y.W.H.; Project administration, C.C.S., T.G.H., A.R.O. and Y.W.H.; Funding acquisition, C.C.S. and A.R.O. All authors have read and agreed to the published version of the manuscript.

Funding

This research was funded by Ministry of Higher Education Malaysia, grant number FRGS/1/2015/WAB01/UPM/02/10 and The APC was funded by Dana Penerbitan Jurnal (DPJ), Research Management Centre (RMC), Universiti Putra Malaysia.

Institutional Review Board Statement

The animal study protocol was approved by the Institutional Review Board (or Ethics Committee) of Institutional Animal Care and Use Committee (IACUC) Universiti Putra Malaysia (Ref: UPM/IACUC/AUP-R101/2015).

Informed Consent Statement

Not applicable.

Data Availability Statement

Not applicable.

Acknowledgments

I owe a great debt of gratitude to my late supervisor, Associate Sieo Chin Chin, who not only guided my research but also taught me valuable life lessons. I am also thankful to Ho Yin Wan and Norhani Abdullah provided invaluable guidance on manuscript preparation. I am also grateful to various individuals, including my fellow lab-mates, for their technical support.

Conflicts of Interest

The authors declare no conflict of interest. The funders had no role in the design of the study; in the collection, analyses, or interpretation of data; in the writing of the manuscript, or in the decision to publish the results.

References

  1. Leeson, S. Predictions for Commercial Poultry Nutrition. J. Appl. Poult. Res. 2008, 17, 315–322. [Google Scholar] [CrossRef]
  2. Dibner, J.J.; Richards, J.D. Antibiotic growth promoters in agriculture: History and mode of action. Poult. Sci. 2005, 84, 634–643. [Google Scholar] [CrossRef] [PubMed]
  3. Mehdi, Y.; Letourneau-Montminy, M.P.; Gaucher, M.L.; Chorfi, Y.; Suresh, G.; Rouissi, T.; Brar, S.K.; Cote, C.; Ramirez, A.A.; Godbout, S. Use of antibiotics in broiler production: Global impacts and alternatives. Anim. Nutr. 2018, 4, 170–178. [Google Scholar] [CrossRef] [PubMed]
  4. Dunshea, F.R.; D’Souza, D.N.; Jensen, B.B.; Engberg, R.M. Meat, Animal, Poultry and Fish Production and Management|Antibiotic Growth Promotants. In Encyclopedia of Meat Sciences; Academic Press: Oxford, UK, 2014; pp. 172–176. [Google Scholar]
  5. Nhung, N.T.; Chansiripornchai, N.; Carrique-Mas, J.J. Antimicrobial Resistance in Bacterial Poultry Pathogens: A Review. Front. Vet. Sci. 2017, 4, 126. [Google Scholar] [CrossRef] [PubMed] [Green Version]
  6. Flynn, D. South Korea Bans Antibiotics in Animal Feed. Seattle Food Safety News, 7 June 2011. Available online: https://www.foodsafetynews.com/2011/06/south-korea-bans-antibiotics-in-animal-feed/ (accessed on 2 April 2023).
  7. Maron, D.F.; Smith, T.J.; Nachman, K.E. Restrictions on antimicrobial use in food animal production: An international regulatory and economic survey. Glob. Health 2013, 9, 1–11. [Google Scholar] [CrossRef] [Green Version]
  8. McEwen, S.A.; Angulo, F.J.; Collignon, P.J.; Conly, J. Potential unintended consequences associated with restrictions on antimicrobial use in food-producing animals. In WHO Guidelines on Use of Medically Important Antimicrobials in Food-Producing Animals; World Health Organization: Geneva, Switzerland, 2017. [Google Scholar]
  9. M’Sadeq, S.A.; Wu, S.; Swick, R.A.; Choct, M. Towards the control of necrotic enteritis in broiler chickens with in-feed antibiotics phasing-out worldwide. Anim. Nutr. 2015, 1, 1–11. [Google Scholar] [CrossRef]
  10. Karavolias, J.; Salois, M.J.; Baker, K.T.; Watkins, K. Raised without antibiotics: Impact on animal welfare and implications for food policy. Transl. Anim. Sci. 2018, 2, 337–348. [Google Scholar] [CrossRef]
  11. Kim, K.H.; Ingale, S.L.; Kim, J.S.; Lee, S.H.; Lee, J.H.; Kwon, I.K.; Chae, B.J. Bacteriophage and probiotics both enhance the performance of growing pigs but bacteriophage are more effective. Anim. Feed Sci. Technol. 2014, 196, 88–95. [Google Scholar] [CrossRef]
  12. Zhao, P.Y.; Baek, H.Y.; Kim, I.H. Effects of bacteriophage supplementation on egg performance, egg quality, excreta microflora, and moisture content in laying hens. Asian-Aust. J. Anim. Sci. 2012, 25, 1015–1020. [Google Scholar] [CrossRef]
  13. Yan, L.; Hong, S.M.; Kim, I.H. Effect of bacteriophage supplementation on the growth performance, nutrient digestibility, blood characteristics, and fecal microbial shedding in growing pigs. Asian-Aust. J. Anim. Sci. 2012, 25, 1451–1456. [Google Scholar] [CrossRef]
  14. Wang, J.P.; Yan, L.; Lee, J.H.; Kim, I.H. Evaluation of bacteriophage supplementation on growth performance, blood characteristics, relative organ weight, breast muscle characteristics and excreta microbial shedding in broilers. Asian-Aust. J. Anim. Sci. 2013, 26, 573–578. [Google Scholar] [CrossRef] [Green Version]
  15. Kim, J.S.; Hosseindoust, A.; Lee, S.H.; Choi, Y.H.; Kim, M.J.; Lee, J.H.; Kwon, I.K.; Chae, B.J. Bacteriophage cocktail and multi-strain probiotics in the feed for weanling pigs: Effects on intestine morphology and targeted intestinal coliforms and Clostridium. Animal 2017, 11, 45–53. [Google Scholar] [CrossRef] [PubMed] [Green Version]
  16. Ngu, N.; Phuong, L.; Anh, L.; Loc, H.; Tam, N.; Huan, P.; Diep, T.; Kamei, K. The Efficiency of Bacteriophages Against Salmonella Typhimurium Infection in Native Noi Broilers. Braz. J. Poult. Sci. 2022, 24, 3. [Google Scholar] [CrossRef]
  17. Kabir, S. The role of probiotics in the poultry industry. Int. J. Mol. Sci. 2009, 10, 3531–3546. [Google Scholar] [CrossRef] [PubMed]
  18. De Vuyst, L.; Avonts, L.; Makras, L. Probiotics, prebiotics and gut health. In Woodhead Publishing Series in Food Science, Technology and Nutrition, Functional Foods, Ageing and Degenerative Disease; Woodhead Publishing: Cambridge, UK, 2004; pp. 416–482. [Google Scholar]
  19. Mountzouris, K.C.; Tsitrsikos, P.; Palamidi, I.; Arvaniti, A.; Mohnl, M.; Schatzmayr, G.; Fegeros, K. Effects of probiotic inclusion levels in broiler nutrition on growth performance, nutrient digestibility, plasma immunoglobulins, and cecal microflora composition. Poult. Sci. 2010, 89, 58–67. [Google Scholar] [CrossRef] [PubMed]
  20. Yu, Y.; Li, Q.; Zeng, X.; Xu, Y.; Jin, K.; Liu, J.; Cao, G. Effects of Probiotics on the Growth Performance, Antioxidant Functions, Immune Responses, and Caecal Microbiota of Broilers Challenged by Lipopolysaccharide. Front. Vet. Sci. 2022, 9, 846649. [Google Scholar] [CrossRef] [PubMed]
  21. Ye, Y.; Li, Z.; Wang, P.; Zhu, B.; Zhao, M.; Huang, D.; Ye, Y.; Ding, Z.; Li, L.; Wan, G.; et al. Effects of probiotic supplements on growth performance and intestinal microbiota of partridge shank broiler chicks. PeerJ 2021, 9, e12538. [Google Scholar] [CrossRef]
  22. Blajman, J.E.; Frizzo, L.S.; Zbrun, M.V.; Astesana, D.M.; Fusari, M.L.; Soto, L.P.; Rosmini, M.R.; Signorini, M.L. Probiotics and broiler growth performance: A meta-analysis of randomised controlled trials. Br. Poult. Sci. 2014, 55, 483–494. [Google Scholar] [CrossRef]
  23. Liu, D.; Van Belleghem, J.D.; de Vries, C.R.; Burgener, E.; Chen, Q.; Manasherob, R.; Aronson, J.R.; Amanatullah, D.F.; Tamma, P.D.; Suh, G.A. The safety and toxicity of phage therapy: A review of animal and clinical studies. Viruses 2021, 13, 1268. [Google Scholar] [CrossRef]
  24. Steele, A.; Stacey, H.J.; de Soir, S.; Jones, J.D. The Safety and Efficacy of Phage Therapy for Superficial Bacterial Infections: A Systematic Review. Antibiotics 2020, 9, 754. [Google Scholar] [CrossRef]
  25. Mohd Shaufi, M.A.; Sieo, C.C.; Chong, C.W.; Gan, H.M.; Ho, Y.W. Deciphering chicken gut microbial dynamics based on high-throughput 16S rRNA metagenomics analyses. Gut Pathog. 2015, 7, 4. [Google Scholar] [CrossRef] [Green Version]
  26. Shaufi, M.A.M.; Sieo, C.C.; Cheah, Y.-K.; Chong, C.W.; Omar, A.R.; Ho, Y.W.; Tan, G.H. Discrimination of Escherichia coli isolates recovered from mucosal contents of chicken intestines and different age by repetitive elements sequence-based PCR. J. Biochem. Microbiol. Biotechnol. 2017, 5, 7–12. [Google Scholar] [CrossRef]
  27. NRC. Nutrient Requirements of Poultry; The National Academies Press: Washington, DC, USA, 1994; p. 176. [Google Scholar]
  28. Naidoo, V.; McGaw, L.J.; Bisschop, S.P.; Duncan, N.; Eloff, J.N. The value of plant extracts with antioxidant activity in attenuating coccidiosis in broiler chickens. Vet. Parasitol. 2008, 153, 214–219. [Google Scholar] [CrossRef] [Green Version]
  29. Wang, Y.-B.; Xu, B.-H. Effect of different selenium source (sodium selenite and selenium yeast) on broiler chickens. Anim. Feed Sci. Technol. 2008, 144, 306–314. [Google Scholar] [CrossRef]
  30. Klindworth, A.; Pruesse, E.; Schweer, T.; Peplies, J.; Quast, C.; Horn, M.; Glockner, F.O. Evaluation of general 16S ribosomal RNA gene PCR primers for classical and next-generation sequencing-based diversity studies. Nucleic Acids Res. 2013, 41, e1. [Google Scholar] [CrossRef]
  31. Schloss, P.D.; Westcott, S.L.; Ryabin, T.; Hall, J.R.; Hartmann, M.; Hollister, E.B.; Lesniewski, R.A.; Oakley, B.B.; Parks, D.H.; Robinson, C.J.; et al. Introducing mothur: Open-source, platform-independent, community-supported software for describing and comparing microbial communities. Appl. Environ. Microbiol. 2009, 75, 7537–7541. [Google Scholar] [CrossRef] [PubMed] [Green Version]
  32. Paulson, J.N. metagenomeSeq: Statistical analysis for sparse high-throughput sequencing. Bioconductor Package 2014, 1, 191. [Google Scholar]
  33. Clarke, K.; Gorley, R. PRIMER-6. 6.1. 2007. Available online: https://www.bioconductor.org/packages/devel/bioc/vignettes/metagenomeSeq/inst/doc/metagenomeSeq.pdf (accessed on 13 March 2023).
  34. Langille, M.G.I.; Zaneveld, J.; Caporaso, J.G.; McDonald, D.; Knights, D.; Reyes, J.A.; Clemente, J.C.; Burkepile, D.E.; Vega Thurber, R.L.; Knight, R.; et al. Predictive functional profiling of microbial communities using 16S rRNA marker gene sequences. Nat. Biotechnol. 2013, 31, 814–821. [Google Scholar] [CrossRef] [PubMed]
  35. Parks, D.H.; Tyson, G.W.; Hugenholtz, P.; Beiko, R.G. STAMP: Statistical analysis of taxonomic and functional profiles. Bioinformatics 2014, 30, 3123–3124. [Google Scholar] [CrossRef] [Green Version]
  36. Duncan, D.B. Multiple range and multiple F tests. Biometrics 1955, 11, 1–42. [Google Scholar] [CrossRef]
  37. Upadhaya, S.D.; Ahn, J.M.; Cho, J.H.; Kim, J.Y.; Kang, D.K.; Kim, S.W.; Kim, H.B.; Kim, I.H. Bacteriophage cocktail supplementation improves growth performance, gut microbiome and production traits in broiler chickens. J. Anim. Sci. Biotechnol. 2021, 12, 49. [Google Scholar] [CrossRef]
  38. Lu, J.; Idris, U.; Harmon, B.; Hofacre, C.; Maurer, J.J.; Lee, M.D. Diversity and succession of the intestinal bacterial community of the maturing broiler chicken. Appl. Environ. Microbiol. 2003, 69, 6816–6824. [Google Scholar] [CrossRef] [PubMed] [Green Version]
  39. Torok, V.A.; Ophel-Keller, K.; Loo, M.; Hughes, R.J. Application of methods for identifying broiler chicken gut bacterial species linked with increased energy metabolism. Appl. Environ. Microbiol. 2008, 74, 783–791. [Google Scholar] [CrossRef] [PubMed] [Green Version]
  40. Gong, J.; Forster, R.J.; Yu, H.; Chambers, J.R.; Wheatcroft, R.; Sabour, P.M.; Chen, S. Molecular analysis of bacterial populations in the ileum of broiler chickens and comparison with bacteria in the cecum. FEMS Microbiol. Ecol. 2002, 41, 171–179. [Google Scholar] [CrossRef] [PubMed]
  41. Kaakoush, N.; Sodhi, N.; Chenu, J.; Cox, J.; Riordan, S.; Mitchell, H. The interplay between Campylobacter and Helicobacter species and other gastrointestinal microbiota of commercial broiler chickens. Gut Pathog. 2014, 6, 18. [Google Scholar] [CrossRef] [Green Version]
  42. Eeckhaut, V.; Van Immerseel, F.; Croubels, S.; De Baere, S.; Haesebrouck, F.; Ducatelle, R.; Louis, P.; Vandamme, P. Butyrate production in phylogenetically diverse Firmicutes isolated from the chicken caecum. Microb. Biotechnol. 2011, 4, 503–512. [Google Scholar] [CrossRef] [Green Version]
  43. Polansky, O.; Sekelova, Z.; Faldynova, M.; Sebkova, A.; Sisak, F.; Rychlik, I. Important Metabolic Pathways and Biological Processes Expressed by Chicken Cecal Microbiota. Appl. Environ. Microbiol. 2016, 82, 1569–1576. [Google Scholar] [CrossRef] [Green Version]
  44. Oakley, B.B.; Lillehoj, H.S.; Kogut, M.H.; Kim, W.K.; Maurer, J.J.; Pedroso, A.; Lee, M.D.; Collett, S.R.; Johnson, T.J.; Cox, N.A. The chicken gastrointestinal microbiome. FEMS Microbiol. Lett. 2014, 360, 100–112. [Google Scholar] [CrossRef]
  45. Scheppach, W.; Weiler, F. The butyrate story: Old wine in new bottles? Curr. Opin. Clin. Nutr. Metab. Care 2004, 7, 563–567. [Google Scholar] [CrossRef]
  46. Sergeant, M.J.; Constantinidou, C.; Cogan, T.A.; Bedford, M.R.; Penn, C.W.; Pallen, M.J. Extensive microbial and functional diversity within the chicken cecal microbiome. PLoS ONE 2014, 9, e91941. [Google Scholar] [CrossRef] [Green Version]
  47. Hu, Z.; Guo, Y. Effects of dietary sodium butyrate supplementation on the intestinal morphological structure, absorptive function and gut flora in chickens. Anim. Feed Sci. Technol. 2007, 132, 240–249. [Google Scholar] [CrossRef]
  48. Timbermont, L.; Lanckriet, A.; Dewulf, J.; Nollet, N.; Schwarzer, K.; Haesebrouck, F.; Ducatelle, R.; Van Immerseel, F. Control of Clostridium perfringens-induced necrotic enteritis in broilers by target-released butyric acid, fatty acids and essential oils. Avian Pathol. 2010, 39, 117–121. [Google Scholar] [CrossRef] [PubMed] [Green Version]
  49. Bjerrum, L.; Engberg, R.M.; Leser, T.D.; Jensen, B.B.; Finster, K.; Pedersen, K. Microbial community composition of the ileum and cecum of broiler chickens as revealed by molecular and culture-based techniques. Poult. Sci. 2006, 85, 1151–1164. [Google Scholar] [CrossRef]
  50. Waite, D.W.; Taylor, M.W. Characterizing the avian gut microbiota: Membership, driving influences, and potential function. Front. Microbiol. 2014, 5, 223. [Google Scholar] [CrossRef] [Green Version]
  51. Ercolini, D. High-throughput sequencing and metagenomics: Moving forward in the culture-independent analysis of food microbial ecology. Appl. Environ. Microbiol. 2013, 79, 3148–3155. [Google Scholar] [CrossRef] [PubMed] [Green Version]
Figure 1. Structure of gut microbiota supplemented with different dietary treatments in ilea of 35 day old chickens investigated using the canonical analysis of principal coordinates (CAP) of the Bray–Curtis similarity index. Treatments: C = control (basal diet); 1ϕ = BD + 1 g/kg phage cocktail; 2ϕ = BD + 2 g/kg phage cocktail; P = BD + 1 g/kg probiotic; 1ϕP =BD + 1 g/kg phage cocktail + 1 g/kg probiotic; 2ϕP = BD + 2 g/kg phage cocktail + 1 g/kg probiotic.
Animals 13 01328 g001
Figure 2. Principal component analysis (PCA) of predicted functional metagenomes based on ϕP versus non-ϕP groups. Phage cocktail and probiotic combination groups (ϕP): 1ϕP and 2ϕP; other groups (non-ϕP): C, 1ϕ, 2ϕ, and P.
Animals 13 01328 g002
Figure 3. Pairwise comparison of the functional metagenomes predicted from Storey’s FDR multiple test correction methods based on ϕP versus non-ϕP groups. Phage cocktail and probiotic combination groups (ϕP): 1ϕP and 2ϕP; other groups (non-ϕP): C, 1ϕ, 2ϕ, and P.
Animals 13 01328 g003
Table 1. Ingredient composition, calculated analysis and chemical analysis of basal diet’s starter phase (1 to 21 days).
Basal Diet (C)BD + 1 g/kg Phage Cocktail
(1ϕ)
BD + 2 g/kg Phage Cocktail
(2ϕ)
BD + 1 g/kg Probiotic
(P)
BD + 1 g/kg Phage Cocktail + 1 g/kg Probiotic
(1ϕP)
BD + 2 g/kg Phage Cocktail + 1 g/kg Probiotic
(2ϕP)
Ingredient (g/kg)
Corn538.60537.60536.60537.60536.60535.60
Soybean meal, 48% Cp361.90361.90361.90361.90361.90361.90
Fish meal30.0030.0030.0030.0030.0030.00
Palm oil37.4037.4037.4037.4037.4037.40
60% choline chloride2.502.502.502.502.502.50
Vitamin premix 0.300.300.300.300.300.30
Mineral premix 1.001.001.001.001.001.00
Salt (NaCl)2.002.002.002.002.002.00
DL-Methionine1.801.801.801.801.801.80
Limestone13.0013.0013.0013.0013.0013.00
Dicalcium phosphate11.5011.5011.5011.5011.5011.50
Phage cocktail0.001.002.000.001.002.00
Probiotic0.000.000.001.001.001.00
Total1000.001000.001000.001000.001000.001000.00
Calculated analysis
Metabolisable energy (MJ/kg)13.0613.0613.0613.0613.0613.06
Crude protein220.00220.00220.00220.00220.00220.00
Crude fat63.1063.1063.1063.1063.1063.10
Crude fibre38.0038.0038.0038.0038.0038.00
Digestible methionine + cysteine9.509.509.509.509.509.50
Digestible lysine13.7013.7013.7013.7013.7013.70
Calcium10.2010.2010.2010.2010.2010.20
Available phosphorus4.504.504.504.504.504.50
Chemical analysis
Crude protein217.70217.70217.70217.70217.70217.70
Crude fat54.8054.8054.8054.8054.8054.80
Crude fibre38.8038.8038.8039.0139.0239.02
Calcium6.506.556.616.666.716.77
Phosphorus5.165.165.165.165.165.16
Sodium6.706.716.726.706.716.72
Supplied per kilogram of diet: vitamin A, 50.00 mIU; vitamin B1, 10.00 g; vitamin B2, 30.00 g; vitamin B6, 20.00 g; vitamin B12, 0.100 g; vitamin D3, 10.00 mIU; vitamin E, 75.00 g; vitamin K3, 20.00 g; calcium D-pantothenate, 60.00 g; nicotinic acid, 200.00 g; folic acid, 5.00 g; biotin, 235.00 g; antioxidant, anti-cracking, and carrier. Supplied per kilogram of diet: Se, 0.200 g; Fe, 80.00 g; Mn, 100.00 g; Zn, 80.00 g; Cu, 15.00 g; KCl, 4.00 g; MgO, 0.60 g; NaCO3, 1.50 g; I, 1.00 g; Co, 0.25 g.
Table 2. Ingredient composition, calculated analysis, and chemical analysis of basal diet’s finisher phase (22 to 35 days).
Basal Diet (C)BD + 1 g/kg Phage Cocktail
(1ϕ)
BD + 2 g/kg Phage Cocktail
(2ϕ)
BD + 1 g/kg Probiotic
(P)
BD + 1 g/kg Phage Cocktail + 1 g/kg Probiotic
(1ϕP)
BD + 2 g/kg Phage Cocktail + 1 g/kg Probiotic
(2ϕP)
Ingredient (g/kg)
Corn602.70601.70600.70601.70600.70599.70
Soybean meal, 48% Cp318.60318.60318.60318.60318.60318.60
Fish meal30.0030.0030.0030.0030.0030.00
Palm Oil24.5024.5024.5024.5024.5024.50
60% choline chloride2.002.002.002.002.002.00
Vitamin premix 0.300.300.300.300.300.30
Mineral premix 1.001.001.001.001.001.00
Salt (NaCl)1.001.001.001.001.001.00
DL-Methionine0.400.400.400.400.400.40
Limestone13.0013.0013.0013.0013.0013.00
Dicalcium phosphate6.506.506.506.506.506.50
Phage cocktail0.001.002.000.001.002.00
Probiotic0.000.000.001.001.001.00
Total1000.001000.001000.001000.001000.001000.00
Calculated analysis
Metabolisable energy (MJ/kg)13.0613.0613.0613.0613.0613.06
Crude protein199.90199.90199.90199.90199.90199.90
Crude fat52.2052.2052.2052.2052.2052.20
Crude fibre36.5036.5036.5036.5036.5036.50
Digestible methionine + cysteine8.508.508.508.508.508.50
Digestible lysine12.0012.0012.0012.0012.0012.00
Calcium9.009.009.009.009.009.00
Available phosphorus3.503.503.503.503.503.50
Chemical analysis
Crude protein212.05212.50212.50212.50212.50212.50
Crude fat45.0045.0045.0045.0045.0045.00
Crude fibre40.5040.5040.5040.7140.7140.71
Calcium6.806.856.916.967.017.07
Phosphorus4.504.504.504.504.504.50
Sodium1.901.911.921.901.911.92
Supplied per kilogram of diet: vitamin A, 50.00 MIU; vitamin B1, 10.00 g; vitamin B2, 30.00 g; vitamin B6, 20.00 g; vitamin B12, 0.100 g; vitamin D3, 10.00 MIU; vitamin E, 75.00 g; vitamin K3, 20.00 g; calcium D-pantothenate, 60.00 g; nicotinic acid, 200.00 g; folic acid, 5.00 g; biotin, 235.00 g; antioxidant, anti-cracking, and carrier. Supplied per kilogram of diet: Se, 0.200 g; Fe, 80.00 g; Mn, 100.00 g; Zn, 80.00 g; Cu, 15.00 g; KCl, 4.00 g; MgO, 0.60 g; NaCO3, 1.50 g; I, 1.00 g; Co, 0.25 g.
Table 3. Effects of phage cocktail, probiotics, and their combination on growth performance of chickens.
Item Age (days)CP1ϕP2ϕP
BW (g)143.00 ± 1.1042.78 ± 1.0942.98 ± 0.7842.82 ± 0.9642.78 ± 1.0543.32 ± 0.38
21859.58 ± 14.20874.07 ± 8.85864.67 ± 11.05871.78 ± 6.09874.02 ± 12.31855.10 ± 13.74
351605.30 ± 39.45 a1734.17 ± 47.55 ab1741.27 ± 56.58 ab1690.43 ± 40.05 ab1785.75 ± 31.93 b1733.63 ± 56.00 ab
BWG (g/bird)1–21816.63 ± 13.97861.32 ± 9.47821.70 ± 11.09828.98 ± 6.04831.25 ± 11.91811.80 ± 12.95
22–35745.72 ± 40.37 a860.10 ± 50.69 ab876.60 ± 46.20 ab818.65 ± 41.87 ab911.73 ± 32.82 b878.53 ± 47.67 ab
1–351562.35 ± 40.42 a1691.42 ± 47.67 ab1698.30 ± 56.55 ab1647.63 ± 39.82 ab1742.98 ± 32.76 b1690.33 ± 55.75 ab
FI (g/bird)1–211169.88 ± 18.031153.10 ± 10.461111.35 ± 30.521104.87 ± 37.661160.58 ± 20.141131.58 ± 10.33
22–351748.38 ± 24.661761.45 ± 51.101650.32 ± 104.621653.68 ± 40.061740.27 ± 63.751760.85 ± 44.20
1–352918.27 ± 38.402914.55 ± 55.022922.88 ± 158.002758.53 ± 51.982900.85 ± 70.402892.42 ± 53.92
FCR (feed/gain)1–211.43 ± 0.17 c1.35 ± 0.17 a1.37 ± 0.15 ab1.40 ± 0.10 bc1.37 ± 0.11 ab1.34 ± 0.15 a
22–352.53 ± 0.12 b2.10 ± 0.08 a2.06 ± 0.06 a1.97 ± 0.06 a1.89 ± 0.04 a2.01 ± 0.07 a
1–351.87 ± 0.04 b1.68 ± 0.03 a1.65 ± 0.03 a1.61 ± 0.03 a1.60 ± 0.03 a1.61 ± 0.03 a
Mortality rate (%)1–212.082.082.08NILNIL2.08
22–352.08NIL2.08NIL2.08NIL
1–354.172.084.17NIL2.082.08
Each value is the mean ± SE of six replicate cages with eight chickens each. a,b,c Means within the same row with different superscript letters differ significantly (p < 0.05). C = control (basal diet); 1ϕ = BD + 1 g/kg phage cocktail; 2ϕ = BD + 2 g/kg phage cocktail; P = BD + 1 g/kg probiotic; 1ϕP = BD + 1 g/kg phage cocktail + 1 g/kg probiotic; 2ϕP = BD + 2 g/kg phage cocktail + 1 g/kg probiotic; BW = body weight; BWG = body weight gain.
Table 4. Structure of gut microbiota supplemented with different dietary treatments in the ilea of 35 day old chickens according to PERMANOVA (a) marginal and (b) pairwise test of Bray–Curtis similarities. The test includes the degrees of freedom (Df), sum of squares (SS), mean square (MS), and p-value under Monte Carlo correction (pMC).
a. Marginal Test
SourceDfSSMSPseudo-FpMC
Treatment528,9105782.14.01890.001
Residual2941,7231438.7
Total3470,634
b. Pairwise Test
Groups tUnique PermspMC
1ϕ, 1ϕP2.21794030.011
1ϕ, 2ϕ0.993464050.419
1ϕ, 2ϕP2.78194050.002
1ϕ, C0.975494080.437
1ϕ, P0.787834130.672
1ϕP, 2ϕ2.61164010.002
1ϕP,2ϕP1.1794180.234
1ϕP, C2.41024030.006
1ϕP, P2.21414100.005
2ϕ, 2ϕP3.26754010.002
2ϕ, C0.805254080.651
2ϕ, P0.987863970.393
2ϕP, C3.1673990.001
2ϕP, P2.72014000.002
C, P1.02093940.3850
Treatments: C = control (basal diet); 1ϕ = BD + 1 g/kg phage cocktail; 2ϕ = BD + 2 g/kg phage cocktail; P = BD + 1 g/kg probiotics; 1ϕP = BD + 1 g/kg phage cocktail + 1 g/kg probiotics; 2ϕP = BD + 2 g/kg phage cocktail + 1 g/kg probiotics.
Table 5. List of OTUs that were significantly higher in ϕP than in non-ϕP groups.
OTUsTaxonomyLogFCStandard Error (SE)p-ValuesAdjusted p-Values
Otu000006Bacteroides uniformis3.2384603560.5134862.85 ×10−101.64 ×10⁻⁸
Otu000001Bacteroides3.0824290460.5116171.69 ×10−96.49 ×10⁻⁸
Otu000585Odoribacter2.8846463751.0340840.0052780.02529
Otu000009Alistipes2.7649613940.4325561.64 ×10−101.64 ×10⁻⁸
Otu000139Alistipes finegoldii2.7239444940.6806636.28 ×10−50.000723
Otu000269Ruminococcaceae_unclassified2.7206983321.026790.0080560.034313
Otu000070Alistipes2.6471802770.5263434.92 ×10−71.41 ×10⁻⁵
Otu000624Ruminococcaceae UCG-0142.6184429671.0568710.0132290.04612
Otu000111Anaerotruncus2.5391488850.8623690.0032360.018607
Otu000014Ruminococcus2.4958973140.5250482.00 ×10−64.59 ×10⁻⁵
Otu000031Lachnospiraceae_unclassified2.4705023490.5587939.82 ×10−60.000188
Otu000117Ruminococcaceae UCG-0052.4456223070.8916230.006090.028015
Otu000048Bacillaceae_unclassified2.3087723760.8620550.0074010.032737
Otu000170Bacteroides2.2451707440.576699.89 ×10−50.001034
Otu000319Rhodospirillaceae2.1622998490.888050.0148970.047586
Otu000005Alistipes onderdonkii2.1211637410.5219934.83 ×10−50.000695
Otu000210Anaerotruncus2.0259466070.9455380.0321420.080355
Otu000015Clostridium X1Vb2.0198935560.6175250.0010720.007704
Otu000337Desulfovibrio2.0148675370.8417550.0166820.049954
Otu000675Anaerostipes2.0132759311.0874860.0641250.122906
Otu000032Clostridium X1Va1.9826757820.5361430.0002170.002082
Otu000643Vampirovibrio1.9679144191.0726080.066550.125463
Otu000353Alistipes putredinis1.8991736340.7700050.0136460.046157
Otu000204Ruminococcaceae UCG-0141.8591648480.7502370.0132080.04612
Otu000157Ruminococcaceae_unclassified1.8417919760.7069230.0091780.036394
Otu000866Clostridium1.8405665640.8850460.037560.086387
Otu000367Coprobacillus1.8221285331.0396820.0796740.143164
Otu000694Lachnospiraceae_unclassified1.8150098511.0763860.0917560.158407
Otu000066Bacteroides fragilis1.8030016470.5920860.0023250.014857
Otu000025Lachnospiraceae_unclassified1.7845994640.4097581.33 ×10−50.000218
Otu000426Ruminococcaceae UCG-0141.7821855230.7935330.0247110.063151
Otu000027Eisenbergiella1.7669531570.4950820.0003580.00317
Otu000067Butyricimonas1.7530872410.6114990.0041460.02165
Otu000075Lachnospiraceae_unclassified1.7473676940.6124530.004330.02165
Otu000247Bacteria_unclassified1.7415092740.7707420.0238510.062338
Otu000022Faecalibacterium prausnitzii1.7386998590.4332826.00 ×10−50.000723
Otu000104Lachnospiraceae_unclassified1.7150407830.4937860.0005140.004224
Otu002794Lachnospiraceae_unclassified1.7020471511.0802720.1151240.194695
Otu000095Oscillospira1.6867059070.7257970.0201290.055115
Otu000338Ruminococcaceae UCG-0141.6772892820.9691750.0835170.14776
Otu000186Anaerotruncus1.6683259580.6553730.0109090.041816
Otu000148Oscillospira1.6653932730.6992040.0172260.049954
Otu000947Clostridiales1.6591541891.3062820.2040370.312856
Otu000802Clostridium IV1.6549442420.8135060.0419180.090954
Otu000041Clostridium X1Va1.6447394290.5178480.0014930.010098
Otu000069Ruminococcus1.6016948810.5421430.0031330.018607
Otu000044Lachnospiraceae_unclassified1.5751774560.5513420.0042770.02165
Otu000573Ruminococcus1.5461996681.10550.161920.258623
Otu000057Ruminococcus1.5172277270.4580070.0009240.007085
Otu000007Phascolarctobacterium1.5057138450.6077810.0132340.04612
Note: LogFC is directly related to abundance in the ϕP group, where a higher number denotes a higher abundance. Phage cocktail and probiotic combination groups (ϕP): 1ϕP and 2ϕP; other groups (non-ϕP): C, 1ϕ, 2ϕ, and P.
Disclaimer/Publisher’s Note: The statements, opinions and data contained in all publications are solely those of the individual author(s) and contributor(s) and not of MDPI and/or the editor(s). MDPI and/or the editor(s) disclaim responsibility for any injury to people or property resulting from any ideas, methods, instructions or products referred to in the content.

