

Porcine Model of the Growing Spinal Cord—Changes in Diffusion Tensor Imaging Parameters

Abstract
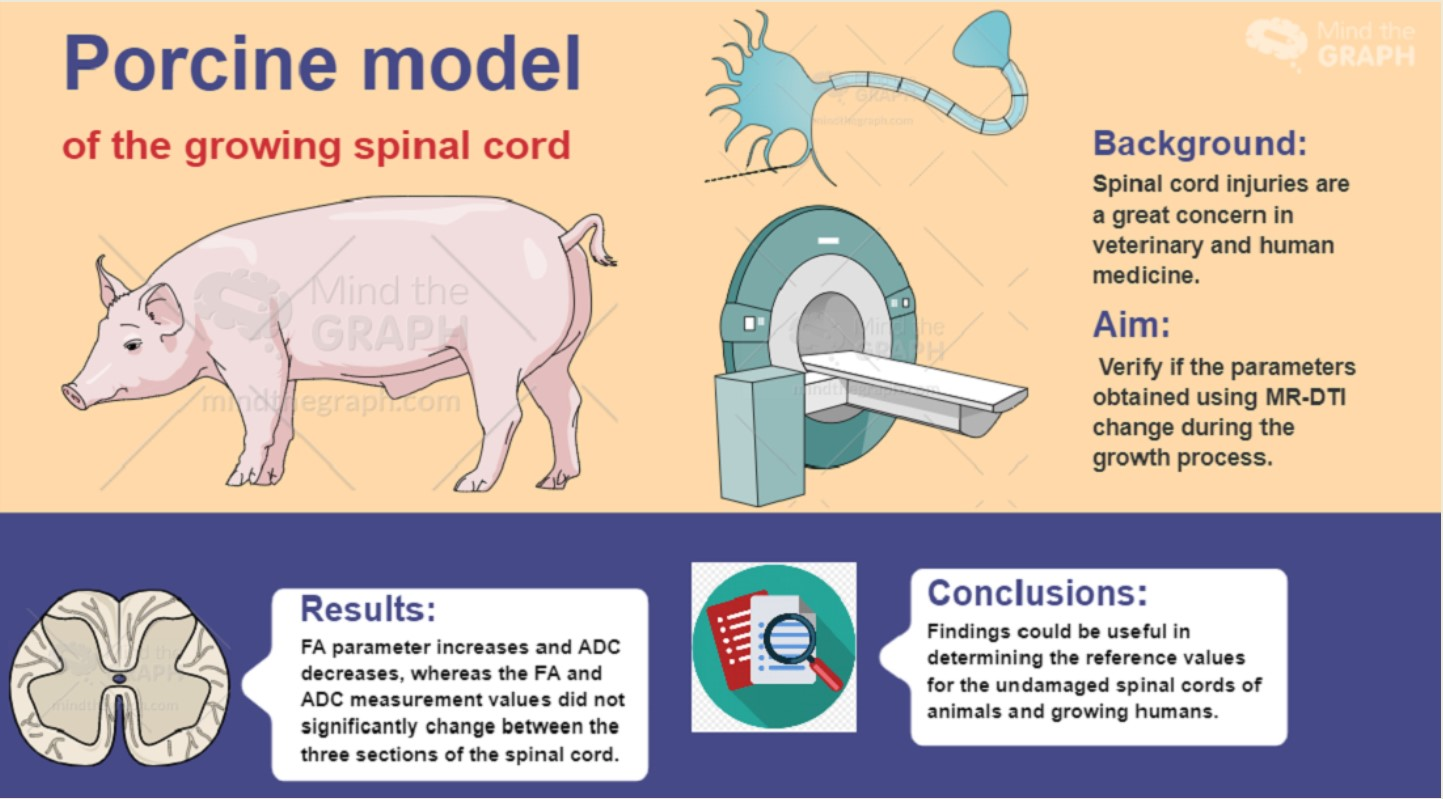
Simple Summary
Abstract

1. Introduction
2. Material and Methods
2.1. Animal Model
2.2. Anesthesia
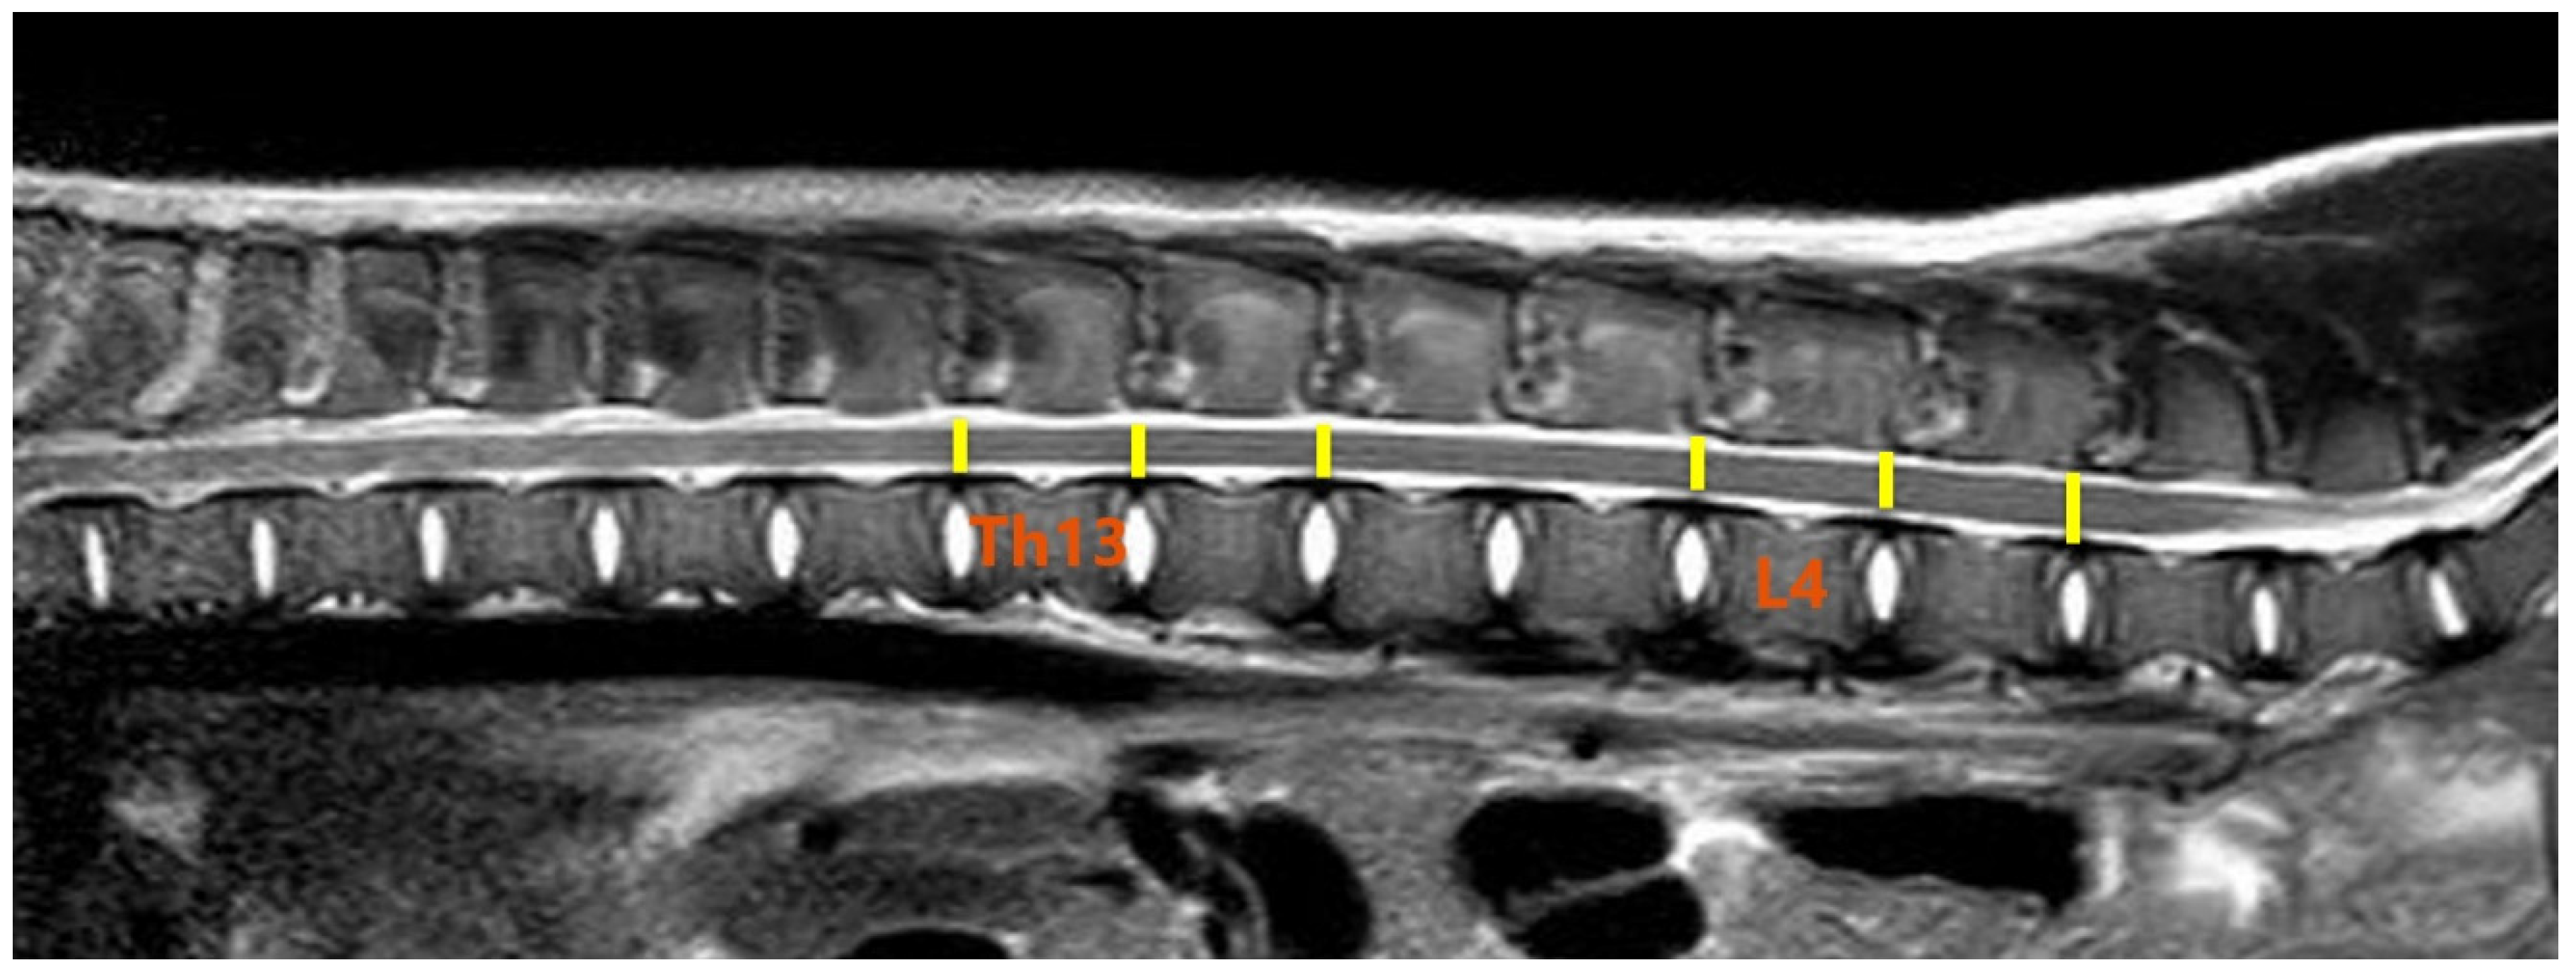
2.3. MR Imaging and DTI Protocol
2.4. Image and DTI Analysis
2.5. Statistical Analysis
3. Results
4. Discussion
5. Conclusions
Author Contributions
Funding
Institutional Review Board Statement
Informed Consent Statement
Data Availability Statement
Acknowledgments
Conflicts of Interest
References
- Shanmuganathan, K.; Zhuo, J.; Bodanapally, U.K.; Kuladeep, S.; Aarabi, B.; Adams, J.; Miller, C.; Gullapallie, R.P.; Menakar, J. Comparison of Acute Diffusion Tensor Imaging and Conventional Magnetic Resonance Parameters in Predicting Long-Term Outcome after Blunt Cervical Spinal Cord Injury. J. Neurotrauma 2020, 37, 458–465. [Google Scholar] [CrossRef]
- DeVivo, M.J.; Vogel, L.C. Epidemiology of spinal cord injury in children and adolescents. J. Spinal Cord Med. 2004, 27 (Suppl. S1), S4–S10. [Google Scholar] [CrossRef] [PubMed]
- Burns, A.S.; Marino, R.J.; Flanders, A.E.; Flett, H. Clinical diagnosis and prognosis following spinal cord injury. In Handbook of Clinical Neurology; Elsevier: Amsterdam, The Netherlands, 2012; Volume 109, pp. 47–62. [Google Scholar] [CrossRef]
- van Middendorp, J.J.; Goss, B.; Urquhart, S.; Atresh, S.; Williams, R.P.; Schuetz, M. Diagnosis and prognosis of traumatic spinal cord injury. Glob. Spine J. 2011, 1, 1–8. [Google Scholar] [CrossRef] [PubMed]
- Bahsoun, S.; Kuiper, J.H.; Hulme, C.H.; Twigg, A.; El Masri, W.; Glass, C.; Soni, B.; Kumar, N.; Chowdhury, J.R.; Osman, A.; et al. Evaluating patient perspectives on participating in scientific research and clinical trials for the treatment of spinal cord injury. Sci. Rep. 2021, 11, 4361. [Google Scholar] [CrossRef] [PubMed]
- Martín Noguerol, T.; Barousse, R.; Amrhein, T.J.; Royuela-Del-Val, J.; Montesinos, P.; Luna, A. Optimizing Diffusion-Tensor Imaging Acquisition for Spinal Cord Assessment: Physical Basis and Technical Adjustments. Radiographics 2020, 40, 403–427. [Google Scholar] [CrossRef]
- Rajasekaran, S.; Kanna, R.M.; Shetty, A.P. Diffusion tensor imaging of the spinal cord and its clinical applications. J. Bone Jt. Surg. 2012, 94, 1024–1031. [Google Scholar] [CrossRef]
- Vedantam, A.; Jirjis, M.B.; Schmit, B.D.; Wang, M.C.; Ulmer, J.L.; Kurpad, S.N. Diffusion tensor imaging of the spinal cord: Insights from animal and human studies. Neurosurgery 2014, 74, 1–8. [Google Scholar] [CrossRef]
- Fujiyoshi, K.; Konomi, T.; Yamada, M.; Hikishima, K.; Tsuji, O.; Komaki, Y.; Momoshima, S.; Toyama, Y.; Nakamura, M.; Okano, H. Diffusion tensor imaging and tractography of the spinal cord: From experimental studies to clinical application. Exp. Neurol. 2013, 242, 74–82. [Google Scholar] [CrossRef]
- Bosma, R.; Stroman, P.W. Diffusion tensor imaging in the human spinal cord: Development, limitations, and clinical applications. Crit. Rev. Biomed. Eng. 2012, 40, 1–20. [Google Scholar] [CrossRef]
- Rutman, A.M.; Peterson, D.J.; Cohen, W.A.; Mossa-Basha, M. Diffusion Tensor Imaging of the Spinal Cord: Clinical Value, Investigational Applications, and Technical Limitations. Curr. Probl. Diagn. Radiol. 2018, 47, 257–269. [Google Scholar] [CrossRef]
- Wu, T.L.; Byun, N.E.; Wang, F.; Mishra, A.; Janve, V.A.; Chen, L.M.; Gore, J.C. Longitudinal assessment of recovery after spinal cord injury with behavioral measures and diffusion, quantitative magnetization transfer and functional magnetic resonance imaging. NMR BioMed. 2020, 33, e4216. [Google Scholar] [CrossRef]
- Poplawski, M.M.; Alizadeh, M.; Oleson, C.V.; Fisher, J.; Marino, R.J.; Gorniak, R.J.; Leiby, B.E.; Flanders, A.E. Application of Diffusion Tensor Imaging in Forecasting Neurological Injury and Recovery after Human Cervical Spinal Cord Injury. J. Neurotrauma 2019, 36, 3051–3061. [Google Scholar] [CrossRef] [PubMed]
- Kaushal, M.; Shabani, S.; Budde, M.; Kurpad, S. Diffusion Tensor Imaging in Acute Spinal Cord Injury: A Review of Animal and Human Studies. J. Neurotrauma 2019, 36, 2279–2286. [Google Scholar] [CrossRef] [PubMed]
- Kelley, B.J.; Harel, N.Y.; Kim, C.Y.; Papademetris, X.; Coman, D.; Wang, X.; Hasan, O.; Kaufman, A.; Globinsky, R.; Staib, L.H.; et al. Diffusion tensor imaging as a predictor of locomotor function after experimental spinal cord injury and recovery. J. Neurotrauma 2014, 31, 1362–1373. [Google Scholar] [CrossRef] [PubMed]
- Zaninovich, O.A.; Avila, M.J.; Kay, M.; Becker, J.L.; Hurlbert, R.J.; Martirosyan, N.L. The role of diffusion tensor imaging in the diagnosis, prognosis, and assessment of recovery and treatment of spinal cord injury: A systematic review. Neurosurg. Focus 2019, 46, E7. [Google Scholar] [CrossRef]
- Mulcahey, M.J.; Samdani, A.; Gaughan, J.; Barakat, N.; Faro, S.; Betz, R.R.; Finsterbusch, J.; Mohamed, F.B. Diffusion tensor imaging in pediatric spinal cord injury: Preliminary examination of reliability and clinical correlation. Spine 2012, 37, E797–E803. [Google Scholar] [CrossRef]
- Mulcahey, M.J.; Samdani, A.F.; Gaughan, J.P.; Barakat, N.; Faro, S.; Shah, P.; Betz, R.R.; Mohamed, F.B. Diagnostic accuracy of diffusion tensor imaging for pediatric cervical spinal cord injury. Spinal Cord 2013, 51, 532–537. [Google Scholar] [CrossRef]
- Li, D.C.; Malcolm, J.G.; Rindler, R.S.; Baum, G.R.; Rao, A.; Khurpad, S.N.; Ahmad, F.U. The role of diffusion tensor imaging in spinal pathology: A review. Neurol. India 2017, 65, 982–992. [Google Scholar] [CrossRef] [PubMed]
- Li, X.H.; Wu, F.; Zhao, F.; Huang, S.L. Fractional anisotropy is a marker in early-stage spinal cord injury. Brain Res. 2017, 1672, 44–49. [Google Scholar] [CrossRef]
- Li, X.H.; Li, J.B.; He, X.J.; Wang, F.; Huang, S.L.; Bai, Z.L. Timing of diffusion tensor imaging in the acute spinal cord injury of rats. Sci. Rep. 2015, 5, 12639. [Google Scholar] [CrossRef]
- Zhao, C.; Rao, J.S.; Pei, X.J.; Lei, J.F.; Wang, Z.J.; Yang, Z.Y.; Li, X.G. Longitudinal study on diffusion tensor imaging and diffusion tensor tractography following spinal cord contusion injury in rats. Neuroradiology 2016, 58, 607–614. [Google Scholar] [CrossRef] [PubMed]
- Wang-Leandro, A.; Hobert, M.K.; Kramer, S.; Rohn, K.; Stein, V.M.; Tipold, A. The role of diffusion tensor imaging as an objective tool for the assessment of motor function recovery after paraplegia in a naturally-occurring large animal model of spinal cord injury. J. Transl. Med. 2018, 16, 258. [Google Scholar] [CrossRef]
- Yoon, H.; Park, N.W.; Ha, Y.M.; Kim, J.; Moon, W.J.; Eom, K. Diffusion tensor imaging of white and grey matter within the spinal cord of normal Beagle dogs: Sub-regional differences of the various diffusion parameters. Vet. J. 2016, 215, 110–117. [Google Scholar] [CrossRef]
- Hobert, M.K.; Stein, V.M.; Dziallas, P.; Ludwig, D.C.; Tipold, A. Evaluation of normal appearing spinal cord by diffusion tensor imaging, fiber tracking, fractional anisotropy, and apparent diffusion coefficient measurement in 13 dogs. Acta Vet. Scand. 2013, 55, 36. [Google Scholar] [CrossRef]
- Bassols, A.; Costa, C.; Eckersall, P.D.; Osada, J.; Sabrià, J.; Tibau, J. The pig as an animal model for human pathologies: A proteomics perspective. Proteom. Clin. Appl. 2014, 8, 715–731. [Google Scholar] [CrossRef] [PubMed]
- Wang, K.; Song, Q.; Zhang, F.; Chen, Z.; Hou, C.; Tang, Y.; Chen, S.; Hao, Q.; Shen, H. Age-related changes of the diffusion tensor imaging parameters of the normal cervical spinal cord. Eur. J. Radiol. 2014, 83, 2196–2202. [Google Scholar] [CrossRef]
- Wei, L.F.; Wang, S.S.; Wei, L.F.; Wang, S.S.; Zheng, Z.C.; Tian, J.; Xue, L. Analysis of the diffusion tensor imaging parameters of a normal cervical spinal cord in a healthy population. J. Spinal Cord Med. 2017, 40, 338–345. [Google Scholar] [CrossRef] [PubMed]
- Barakat, N.; Mohamed, F.B.; Hunter, L.N.; Shah, P.; Faro, S.H.; Samdani, A.F.; Finsterbusch, J.; Betz, R.; Gaughan, J.; Mulcahey, M.J. Diffusion tensor imaging of the normal pediatric spinal cord using an inner field of view echo-planar imaging sequence. Am. J. Neuroradiol. 2012, 33, 1127–1133. [Google Scholar] [CrossRef]
- Saksena, S.; Middleton, D.M.; Krisa, L.; Shah, P.; Faro, S.H.; Sinko, R.; Gaughan, J.; Finsterbusch, J.; Mulcahey, M.J.; Mohamed, F.B. Diffusion Tensor Imaging of the Normal Cervical and Thoracic Pediatric Spinal Cord. Am. J. Neuroradiol. 2016, 37, 2150–2157. [Google Scholar] [CrossRef]
- Chan, T.Y.; Li, X.; Mak, K.C.; Cheung, J.P.; Luk, K.D.; Hu, Y. Normal values of cervical spinal cord diffusion tensor in young and middle-aged healthy Chinese. Eur. Spine J. 2015, 24, 2991–2998. [Google Scholar] [CrossRef]
- Graham, M.L.; Prescott, M.J. The multifactorial role of the 3Rs in shifting the harm-benefit analysis in animal models of disease. Eur. J. Pharmacol. 2015, 759, 19–29. [Google Scholar] [CrossRef] [PubMed]
- Hubrecht, R.C.; Carter, E. The 3Rs and Humane Experimental Technique: Implementing Change. Animals 2019, 9, 754. [Google Scholar] [CrossRef]
- Singhi, S.; Tekes, A.; Thurnher, M.; Gilson, W.D.; Izbudak, I.; Thompson, C.B.; Huisman, T.A. Diffusion tensor imaging of the maturing paediatric cervical spinal cord: From the neonate to the young adult. J. Neuroradiol. 2012, 39, 142–148. [Google Scholar] [CrossRef]
- Toossi, A.; Bergin, B.; Marefatallah, M.; Parhizi, B.; Tyreman, N.; Everaert, D.G.; Rezaei, S.; Seres, P.; Gatenby, J.C.; Perlmutter, S.I.; et al. Comparative neuroanatomy of the lumbosacral spinal cord of the rat, cat, pig, monkey, and human. Sci. Rep. 2021, 11, 1955. [Google Scholar] [CrossRef]
- Faria, A.V.; Zhang, J.; Oishi, K.; Li, X.; Jiang, H.; Akhter, K.; Hermoye, L.; Lee, S.K.; Hoon, A.; Stashinko, E.; et al. Atlas-based analysis of neurodevelopment from infancy to adulthood using diffusion tensor imaging and applications for automated abnormality detection. NeuroImage 2010, 52, 415–428. [Google Scholar] [CrossRef] [PubMed]
- Giorgio, A.; Watkins, K.E.; Douaud, G.; James, A.C.; James, S.; De Stefano, N.; Matthews, P.M.; Smith, S.M.; Johansen-Berg, H. Changes in white matter microstructure during adolescence. NeuroImage 2008, 39, 52–61. [Google Scholar] [CrossRef]
- Reynolds, B.B.; By, S.; Weinberg, Q.R.; Witt, A.A.; Newton, A.T.; Feiler, H.R.; Ramkorun, B.; Clayton, D.B.; Couture, P.; Martus, J.E. Quantification of DTI in the Pediatric Spinal Cord: Application to Clinical Evaluation in a Healthy Patient Population. Am. J. Neuroradiol. 2019, 40, 1236–1241. [Google Scholar] [CrossRef] [PubMed]
- Alizadeh, M.; Fisher, J.; Saksena, S.; Sultan, Y.; Conklin, C.J.; Middleton, D.M.; Krisa, L.; Finsterbusch, J.; Flanders, A.E.; Faro, S.H.; et al. Age related diffusion and tractography changes in typically developing pediatric cervical and thoracic spinal cord. NeuroImage Clin. 2018, 18, 784–792. [Google Scholar] [CrossRef] [PubMed]
- Taso, M.; Girard, O.M.; Duhamel, G.; Le Troter, A.; Feiweier, T.; Guye, M.; Ranjeva, J.P.; Callot, V. Tract-specific and age-related variations of the spinal cord microstructure: A multi-parametric MRI study using diffusion tensor imaging (DTI) and inhomogeneous magnetization transfer (ihMT). NMR BioMed 2016, 29, 817–832. [Google Scholar] [CrossRef]
- Kuhn, F.P.; Feydy, A.; Launay, N.; Lefevre-Colau, M.M.; Poiraudeau, S.; Laporte, S.; Maier, M.A.; Lindberg, P. Kinetic DTI of the cervical spine: Diffusivity changes in healthy subjects. Neuroradiology 2016, 58, 929–935. [Google Scholar] [CrossRef]
- Mohamed, F.B.; Hunter, L.N.; Barakat, N.; Liu, C.S.; Sair, H.; Samdani, A.F.; Betz, R.R.; Faro, S.H.; Gaughan, J.; Mulcahey, M.J. Diffusion tensor imaging of the pediatric spinal cord at 1.5T: Preliminary results. Am. J. Neuroradiol. 2011, 32, 339–345. [Google Scholar] [CrossRef] [PubMed]
- Ellingson, B.M.; Ulmer, J.L.; Kurpad, S.N.; Schmit, B.D. Diffusion tensor MR imaging of the neurologically intact human spinal cord. Am. J. Neuroradiol. 2008, 29, 1279–1284. [Google Scholar] [CrossRef] [PubMed]
- Smith, S.A.; Jones, C.K.; Gifford, A.; Belegu, V.; Chodkowski, B.; Farrell, J.A.; Landman, B.A.; Reich, D.S.; Calabresi, P.A.; McDonald, J.W.; et al. Reproducibility of tract-specific magnetization transfer and diffusion tensor imaging in the cervical spinal cord at 3 tesla. NMR BioMed 2010, 23, 207–217. [Google Scholar] [CrossRef] [PubMed]
- Vedantam, A.; Jirjis, M.B.; Schmit, B.D.; Wang, M.C.; Ulmer, J.L.; Kurpad, S.N. Characterization and limitations of diffusion tensor imaging metrics in the cervical spinal cord in neurologically intact subjects. J. Magn. Reson. Imaging JMRI 2013, 38, 861–867. [Google Scholar] [CrossRef] [PubMed]
- Wheeler-Kingshott, C.A.; Hickman, S.J.; Parker, G.J.; Ciccarelli, O.; Symms, M.R.; Miller, D.H.; Barker, G.J. Investigating cervical spinal cord structure using axial diffusion tensor imaging. NeuroImage 2002, 16, 93–102. [Google Scholar] [CrossRef]
- Uda, T.; Takami, T.; Sakamoto, S.; Tsuyuguchi, N.; Yamagata, T.; Ohata, K. Normal variation of diffusion tensor parameters of the spinal cord in healthy subjects at 3.0-Tesla. J. Craniovertebral Junction Spine 2011, 2, 77–81. [Google Scholar] [CrossRef]
- Song, T.; Chen, W.J.; Yang, B.; Zhao, H.P.; Huang, J.W.; Cai, M.J.; Dong, T.F.; Li, T.S. Diffusion tensor imaging in the cervical spinal cord. Eur. Spine J. 2011, 20, 422–428. [Google Scholar] [CrossRef]
- Kulisiewicz, J.; Iniarski, R.; Koslacz, J.; Obidzinski, W. Selection intensity in some of Polish Large White pig breeding centres. Ann. Anim. Sci. 1992, 19, 23–34. [Google Scholar]
- Bollen, P.; Ritskes-Hoitinga, M. The welfare of pigs and minipigs. In The Welfare of Laboratory Animals. Animal Welfare; Kaliste, E., Ed.; Springer: Dordrecht, The Netherlands, 2007; Volume 2. [Google Scholar] [CrossRef]
- Murtaugh, M.P.; Monteiro-Riviere, N.A.; Panepinto, L. Swine Research Breeds, Methods, and Biomedical Models. In Advances in Swine in Biomedical Research; Tumbleson, M.E., Schook, L.B., Eds.; Springer: Boston, MA, USA, 1996. [Google Scholar] [CrossRef]
- Rubic-Schneider, T.; Christen, B.; Brees, D.; Kammüller, M. Minipigs in Translational Immunosafety Sciences: A Perspective. Toxicol. Pathol. 2016, 44, 315–324. [Google Scholar] [CrossRef]
- Gutierrez, K.; Dicks, N.; Glanzner, W.G.; Agellon, L.B.; Bordignon, V. Efficacy of the porcine species in biomedical research. Front. Genet. 2015, 6, 293. [Google Scholar] [CrossRef]
- Rossi, C.; Boss, A.; Lindig, T.M.; Martirosian, P.; Steidle, G.; Maetzler, W.; Claussen, C.D.; Klose, U.; Schick, F. Diffusion tensor imaging of the spinal cord at 1.5 and 3.0 Tesla. RoFo Fortschr. Geb. Rontgenstrahlen Nukl. 2007, 179, 219–224. [Google Scholar] [CrossRef] [PubMed]


| Porcine | Age (Months) | Weight (kg) | Cervical Segment | |||||
|---|---|---|---|---|---|---|---|---|
| ROI1 | ROI2 | ROI3 | ||||||
| FA C3/C4 | ADC C3/C4 | FA C4/C5 | ADC C4/C5 | FA C5/C6 | ADC C5/C6 | |||
| 1 | 2.5 | 24 | 0.611 | 0.546 | 0.605 | 0.433 | 0.528 | 0.638 |
| 2 | 2.5 | 24 | 0.564 | 0.527 | 0.568 | 0.567 | 0.566 | 0.487 |
| 3 | 2.5 | 25 | 0.564 | 0.527 | 0.568 | 0.567 | 0.566 | 0.487 |
| 4 | 2.5 | 25 | 0.611 | 0.546 | 0.605 | 0.433 | 0.528 | 0.638 |
| 5 | 3 | 28 | 0.534 | 0.403 | 0.608 | 0.405 | 0.599 | 0.331 |
| 6 | 3 | 30 | 0.591 | 0.361 | 0.681 | 0.151 | 0.653 | 0.389 |
| 7 | 3 | 30 | 0.53 | 0.586 | 0.668 | 0.272 | 0.525 | 0.544 |
| 8 | 3 | 30 | 0.793 | 0.153 | 0.638 | 0.312 | 0.674 | 0.261 |
| 9 | 4 | 40 | ||||||
| 10 | 4.5 | 48 | ||||||
| 11 | 5 | 50 | 0.658 | 0.239 | 0.646 | 0.258 | 0.693 | 0.192 |
| 12 | 6 | 60 | ||||||
| 13 | 6 | 60 | 0.623 | 0.375 | 0.563 | 0.428 | 0.565 | 0.545 |
| 14 | 6 | 60 | ||||||
| 15 | 6 | 60 | 0.671 | 0.221 | 0.662 | 0.279 | 0.668 | 0.316 |
| 16 | 6 | 60 | 0.76 | 0.189 | 0.74 | 0.227 | 0.764 | 0.232 |
| 17 | 6.5 | 65 | 0.668 | 0.244 | 0.701 | 0.198 | 0.744 | 0.153 |
| 18 | 6.5 | 65 | 0.77 | 0.137 | 0.648 | 0.179 | 0.656 | 0.134 |
| 19 | 11 | 120 | 0.712 | 0.238 | 0.712 | 0.206 | 0.72 | 0.23 |
| Porcine | Age (Months) | Weight (kg) | Thoracolumbar Segment | |||||
|---|---|---|---|---|---|---|---|---|
| ROI4 | ROI5 | ROI6 | ||||||
| FA Th12/Th13 | ADC Th12/Th13 | FA Th13/L1 | ADC Th13/L1 | FA L1/L2 | ADC L1/L2 | |||
| 1 | 2.5 | 24 | 0.606 | 0.502 | 0.581 | 0.526 | 0.645 | 0.417 |
| 2 | 2.5 | 24 | 0.66 | 0.41 | 0.634 | 0.44 | 0.546 | 0.645 |
| 3 | 2.5 | 25 | 0.66 | 0.41 | 0.634 | 0.44 | 0.546 | 0.645 |
| 4 | 2.5 | 25 | 0.606 | 0.502 | 0.581 | 0.526 | 0.645 | 0.417 |
| 5 | 3 | 28 | 0.566 | 0.342 | 0.597 | 0.374 | 0.597 | 0.393 |
| 6 | 3 | 30 | 0.565 | 0.485 | 0.621 | 0.446 | 0.561 | 0.468 |
| 7 | 3 | 30 | 0.718 | 0.238 | 0.603 | 0.382 | 0.468 | 0.643 |
| 8 | 3 | 30 | 0.594 | 0.471 | 0.619 | 0.354 | 0.632 | 0.519 |
| 9 | 4 | 40 | 0.592 | 0.478 | 0.624 | 0.344 | 0.548 | 0.618 |
| 10 | 4.5 | 48 | 0.706 | 0.239 | 0.626 | 0.41 | 0.615 | 0.46 |
| 11 | 5 | 50 | 0.553 | 0.463 | 0.59 | 0.395 | 0.622 | 0.403 |
| 12 | 6 | 60 | 0.736 | 0.175 | 0.743 | 0.175 | 0.659 | 0.273 |
| 13 | 6 | 60 | 0.629 | 0.248 | 0.592 | 0.41 | 0.642 | 0.307 |
| 14 | 6 | 60 | 0.623 | 0.33 | 0.647 | 0.272 | 0.607 | 0.293 |
| 15 | 6 | 60 | 0.653 | 0.246 | 0.681 | 0.231 | 0.576 | 0.463 |
| 16 | 6 | 60 | 0.67 | 0.184 | 0.578 | 0.451 | 0.538 | 0.362 |
| 17 | 6.5 | 65 | ||||||
| 18 | 6.5 | 65 | ||||||
| 19 | 11 | 120 | 0.685 | 0.153 | 0.714 | 0.19 | 0.716 | 0.204 |
| Porcine | Age (Months) | Weight (kg) | Lumbar Segment | |||||
|---|---|---|---|---|---|---|---|---|
| ROI7 | ROI8 | ROI9 | ||||||
| FA L3/L4 | ADC L3/L4 | FA L4/L5 | ADC L4/L5 | FA L5/L6 | ADC L5/L6 | |||
| 1 | 2.5 | 24 | 0.577 | 0.478 | 0.539 | 0.405 | 0.546 | 0.589 |
| 2 | 2.5 | 24 | 0.529 | 0.488 | 0.541 | 0.605 | 0.55 | 0.501 |
| 3 | 2.5 | 25 | 0.529 | 0.488 | 0.541 | 0.605 | 0.55 | 0.501 |
| 4 | 2.5 | 25 | 0.577 | 0.478 | 0.539 | 0.405 | 0.546 | 0.589 |
| 5 | 3 | 28 | ||||||
| 6 | 3 | 30 | 0.582 | 0.531 | 0.591 | 0.438 | 0.577 | 0.465 |
| 7 | 3 | 30 | 0.549 | 0.51 | 0.517 | 0.554 | 0.549 | 0.549 |
| 8 | 3 | 30 | 0.657 | 0.318 | 0.615 | 0.362 | 0.614 | 0.338 |
| 9 | 4 | 40 | 0.46 | 0.768 | 0.531 | 0.548 | 0.495 | 0.504 |
| 10 | 4.5 | 48 | 0.583 | 0.377 | 0.571 | 0.439 | 0.615 | 0.413 |
| 11 | 5 | 50 | 0.57 | 0.32 | 0.597 | 0.421 | 0.608 | 0.311 |
| 12 | 6 | 60 | 0.721 | 0.196 | 0.686 | 0.293 | 0.691 | 0.243 |
| 13 | 6 | 60 | 0.722 | 0.213 | 0.7 | 0.201 | 0.691 | 0.222 |
| 14 | 6 | 60 | 0.623 | 0.279 | 0.647 | 0.272 | 0.584 | 0.293 |
| 15 | 6 | 60 | 0.718 | 0.208 | 0.641 | 0.302 | 0.592 | 0.342 |
| 16 | 6 | 60 | 0.733 | 0.263 | 0.535 | 0.434 | 0.597 | 0.324 |
| 17 | 6.5 | 65 | ||||||
| 18 | 6.5 | 65 | 0.603 | 0.392 | 0.614 | 0.374 | 0.628 | 0.311 |
| 19 | 11 | 120 | 0.759 | 0.184 | 0.791 | 0.169 | 0.681 | 0.199 |
Disclaimer/Publisher’s Note: The statements, opinions and data contained in all publications are solely those of the individual author(s) and contributor(s) and not of MDPI and/or the editor(s). MDPI and/or the editor(s) disclaim responsibility for any injury to people or property resulting from any ideas, methods, instructions or products referred to in the content. |
© 2023 by the authors. Licensee MDPI, Basel, Switzerland. This article is an open access article distributed under the terms and conditions of the Creative Commons Attribution (CC BY) license (https://creativecommons.org/licenses/by/4.0/).
Share and Cite
Owsińska-Schmidt, K.B.; Drobot, P.; Zimny, A.; Wrzosek, M.A. Porcine Model of the Growing Spinal Cord—Changes in Diffusion Tensor Imaging Parameters. Animals 2023, 13, 565. https://doi.org/10.3390/ani13040565
Owsińska-Schmidt KB, Drobot P, Zimny A, Wrzosek MA. Porcine Model of the Growing Spinal Cord—Changes in Diffusion Tensor Imaging Parameters. Animals. 2023; 13(4):565. https://doi.org/10.3390/ani13040565
Chicago/Turabian StyleOwsińska-Schmidt, Karolina Barbara, Paulina Drobot, Anna Zimny, and Marcin Adam Wrzosek. 2023. "Porcine Model of the Growing Spinal Cord—Changes in Diffusion Tensor Imaging Parameters" Animals 13, no. 4: 565. https://doi.org/10.3390/ani13040565
APA StyleOwsińska-Schmidt, K. B., Drobot, P., Zimny, A., & Wrzosek, M. A. (2023). Porcine Model of the Growing Spinal Cord—Changes in Diffusion Tensor Imaging Parameters. Animals, 13(4), 565. https://doi.org/10.3390/ani13040565