An Image Detection Model for Aggressive Behavior of Group Sheep

 ,
,  ,
,  and
and
Abstract
:Simple Summary
Abstract
1. Introduction
- (1)
- We replaced the YOLOv5 backbone network with GhostNet to enhance network detection speed and reduce the size of the network model;
- (2)
- We propose PW-GhostConv and CS-GhostConv modules to improve the information exchange between feature maps and overcome the issue of information noncirculation after convolution of the GhostConv module.
- (3)
- We introduce inverted residual structure in GhostBottleneck to improve the ability of feature extraction;
- (4)
- We conducted a comparative analysis of the image detection model and video detection model to evaluate their respective advantages and disadvantages in detecting sheep aggression behavior.
2. Materials and Methods
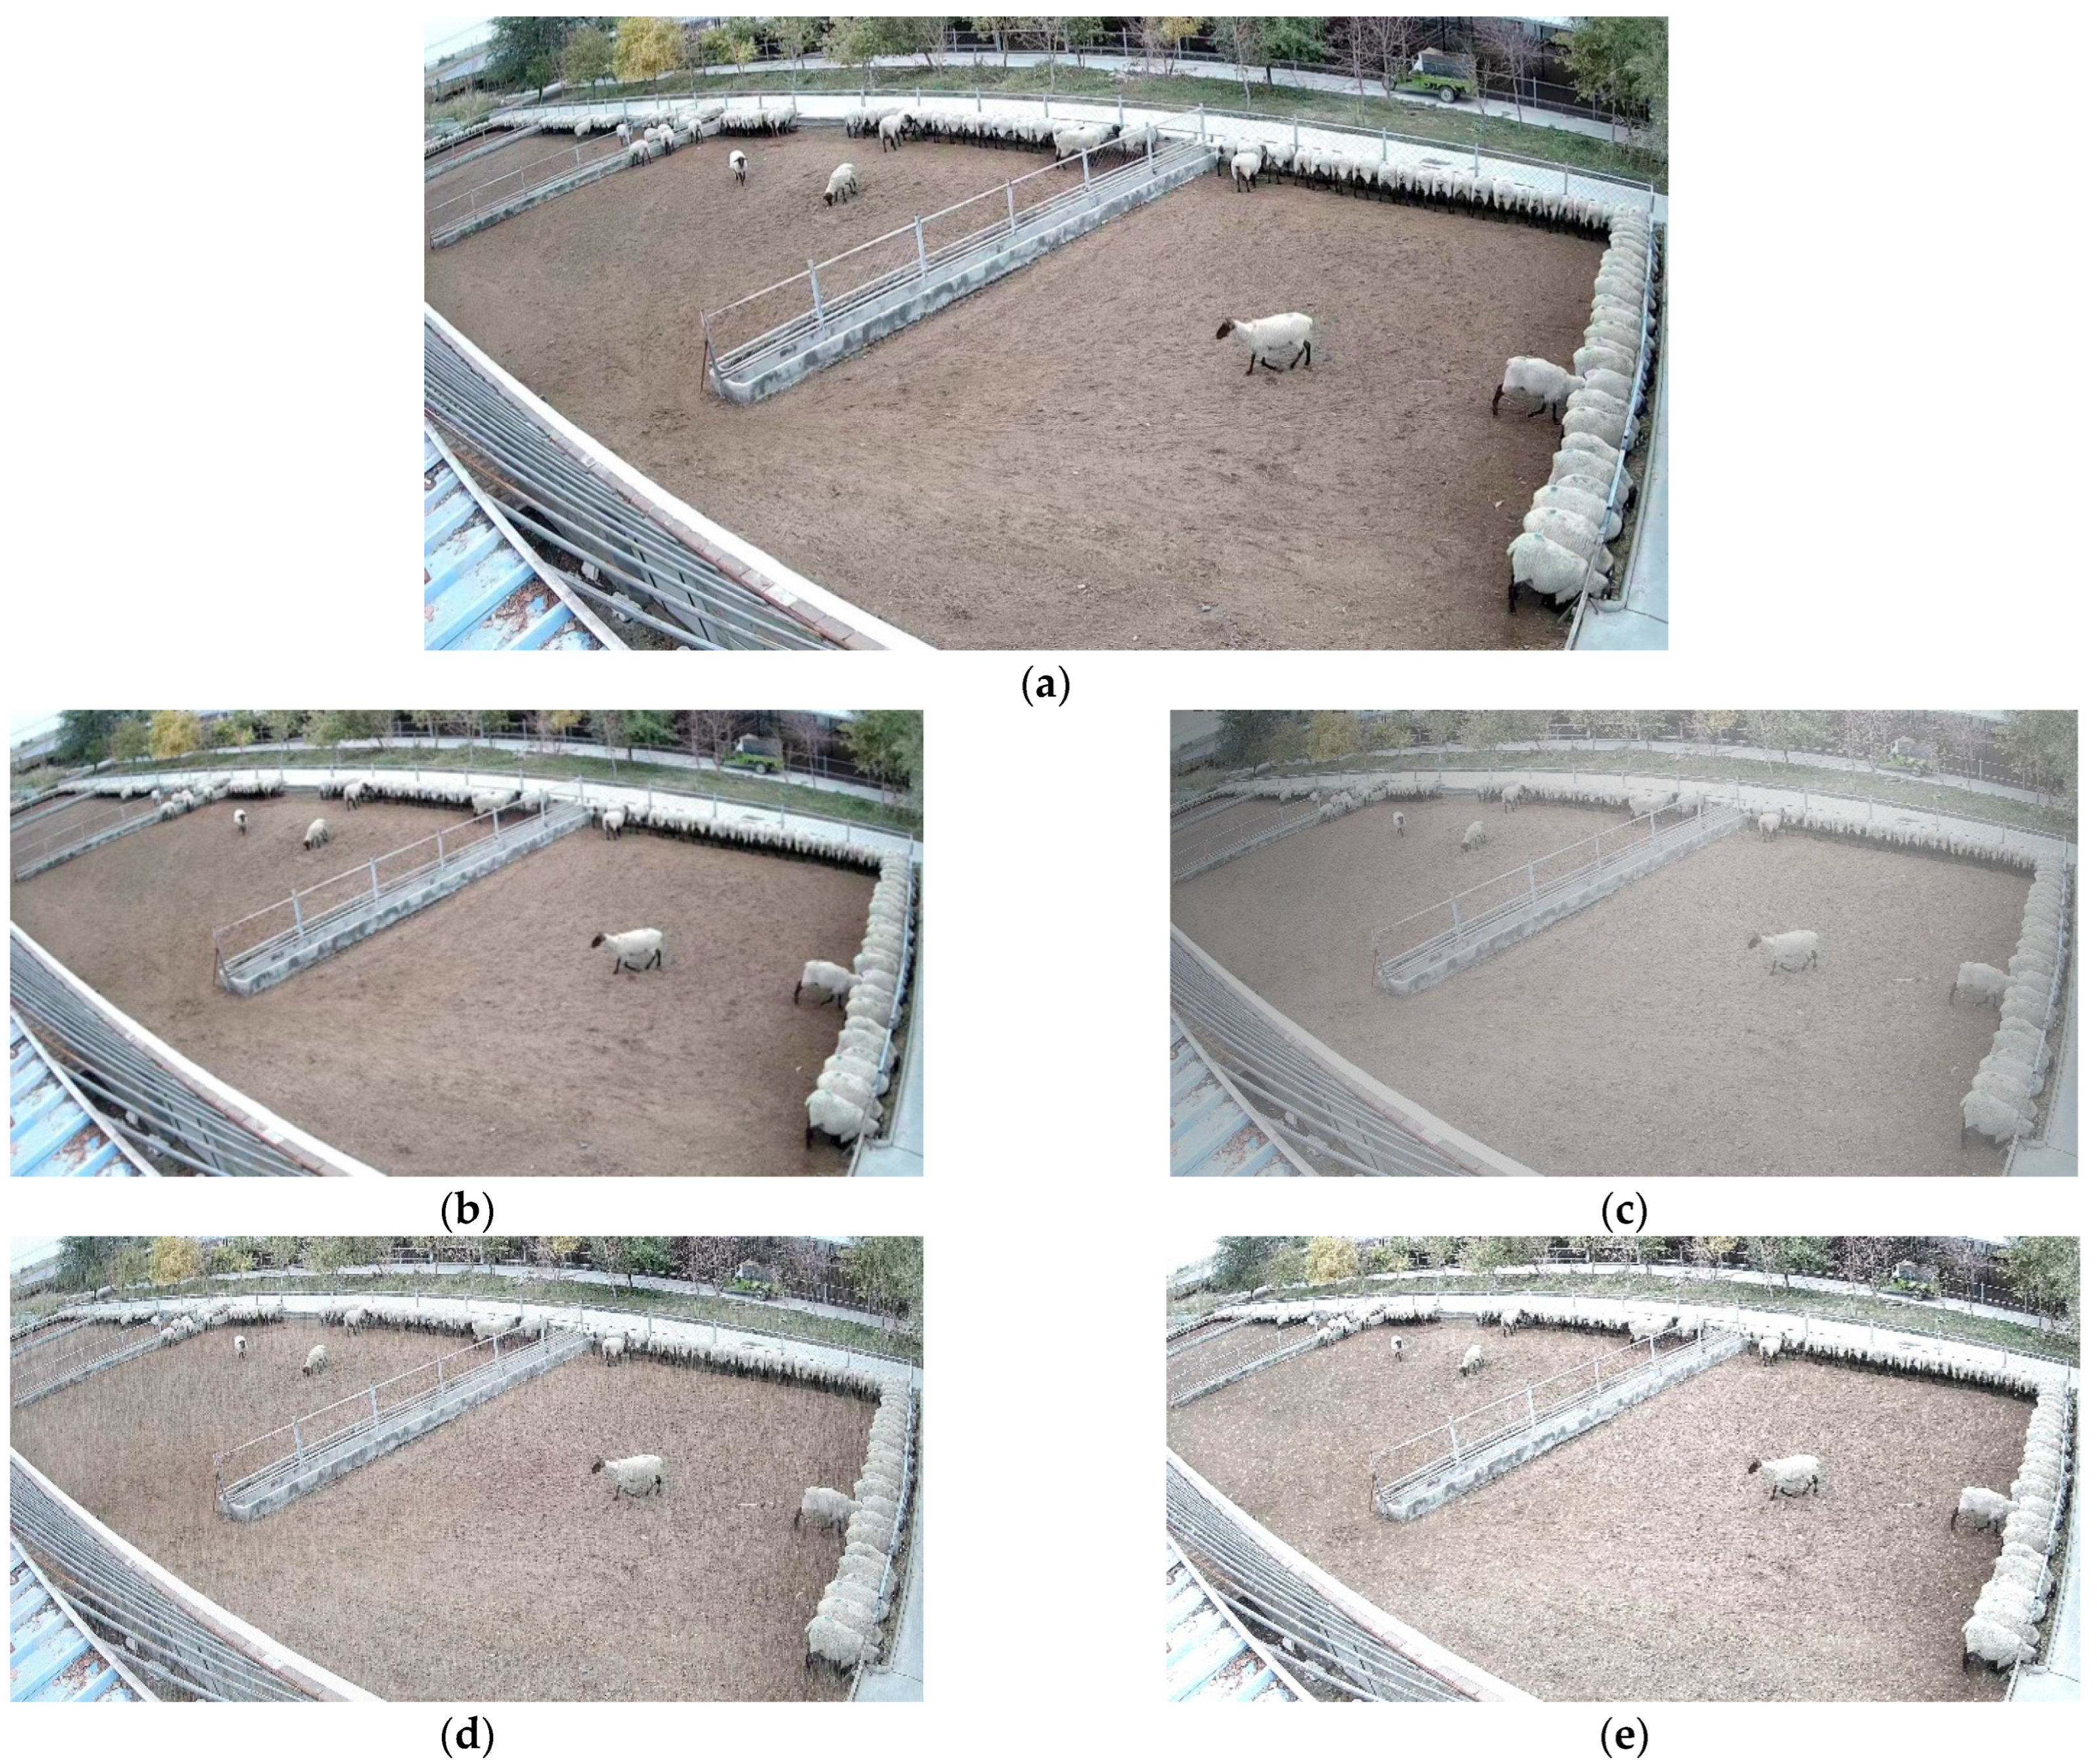
2.1. Dataset Collection
2.1.1. Image Detection Model Dataset
2.1.2. Video Detection Model Dataset
2.2. Data Set Processing
| Algorithm 1: Fogging algorithm | |
| Require: L: Brightness of the fog | |
| Require: : Fog concentration | |
| Require: : Image | |
| 1: h,w,c←img.shape | Image height, width, number of channels |
| 2: | The size of fog |
| 3: for to do | |
| 4: for to do | |
| 5: 0.04 | |
| 6: | |
| 7: | |
| 8: end for | |
| 9: return | |
2.3. Image Detection Model Construction
2.3.1. YOLOv5
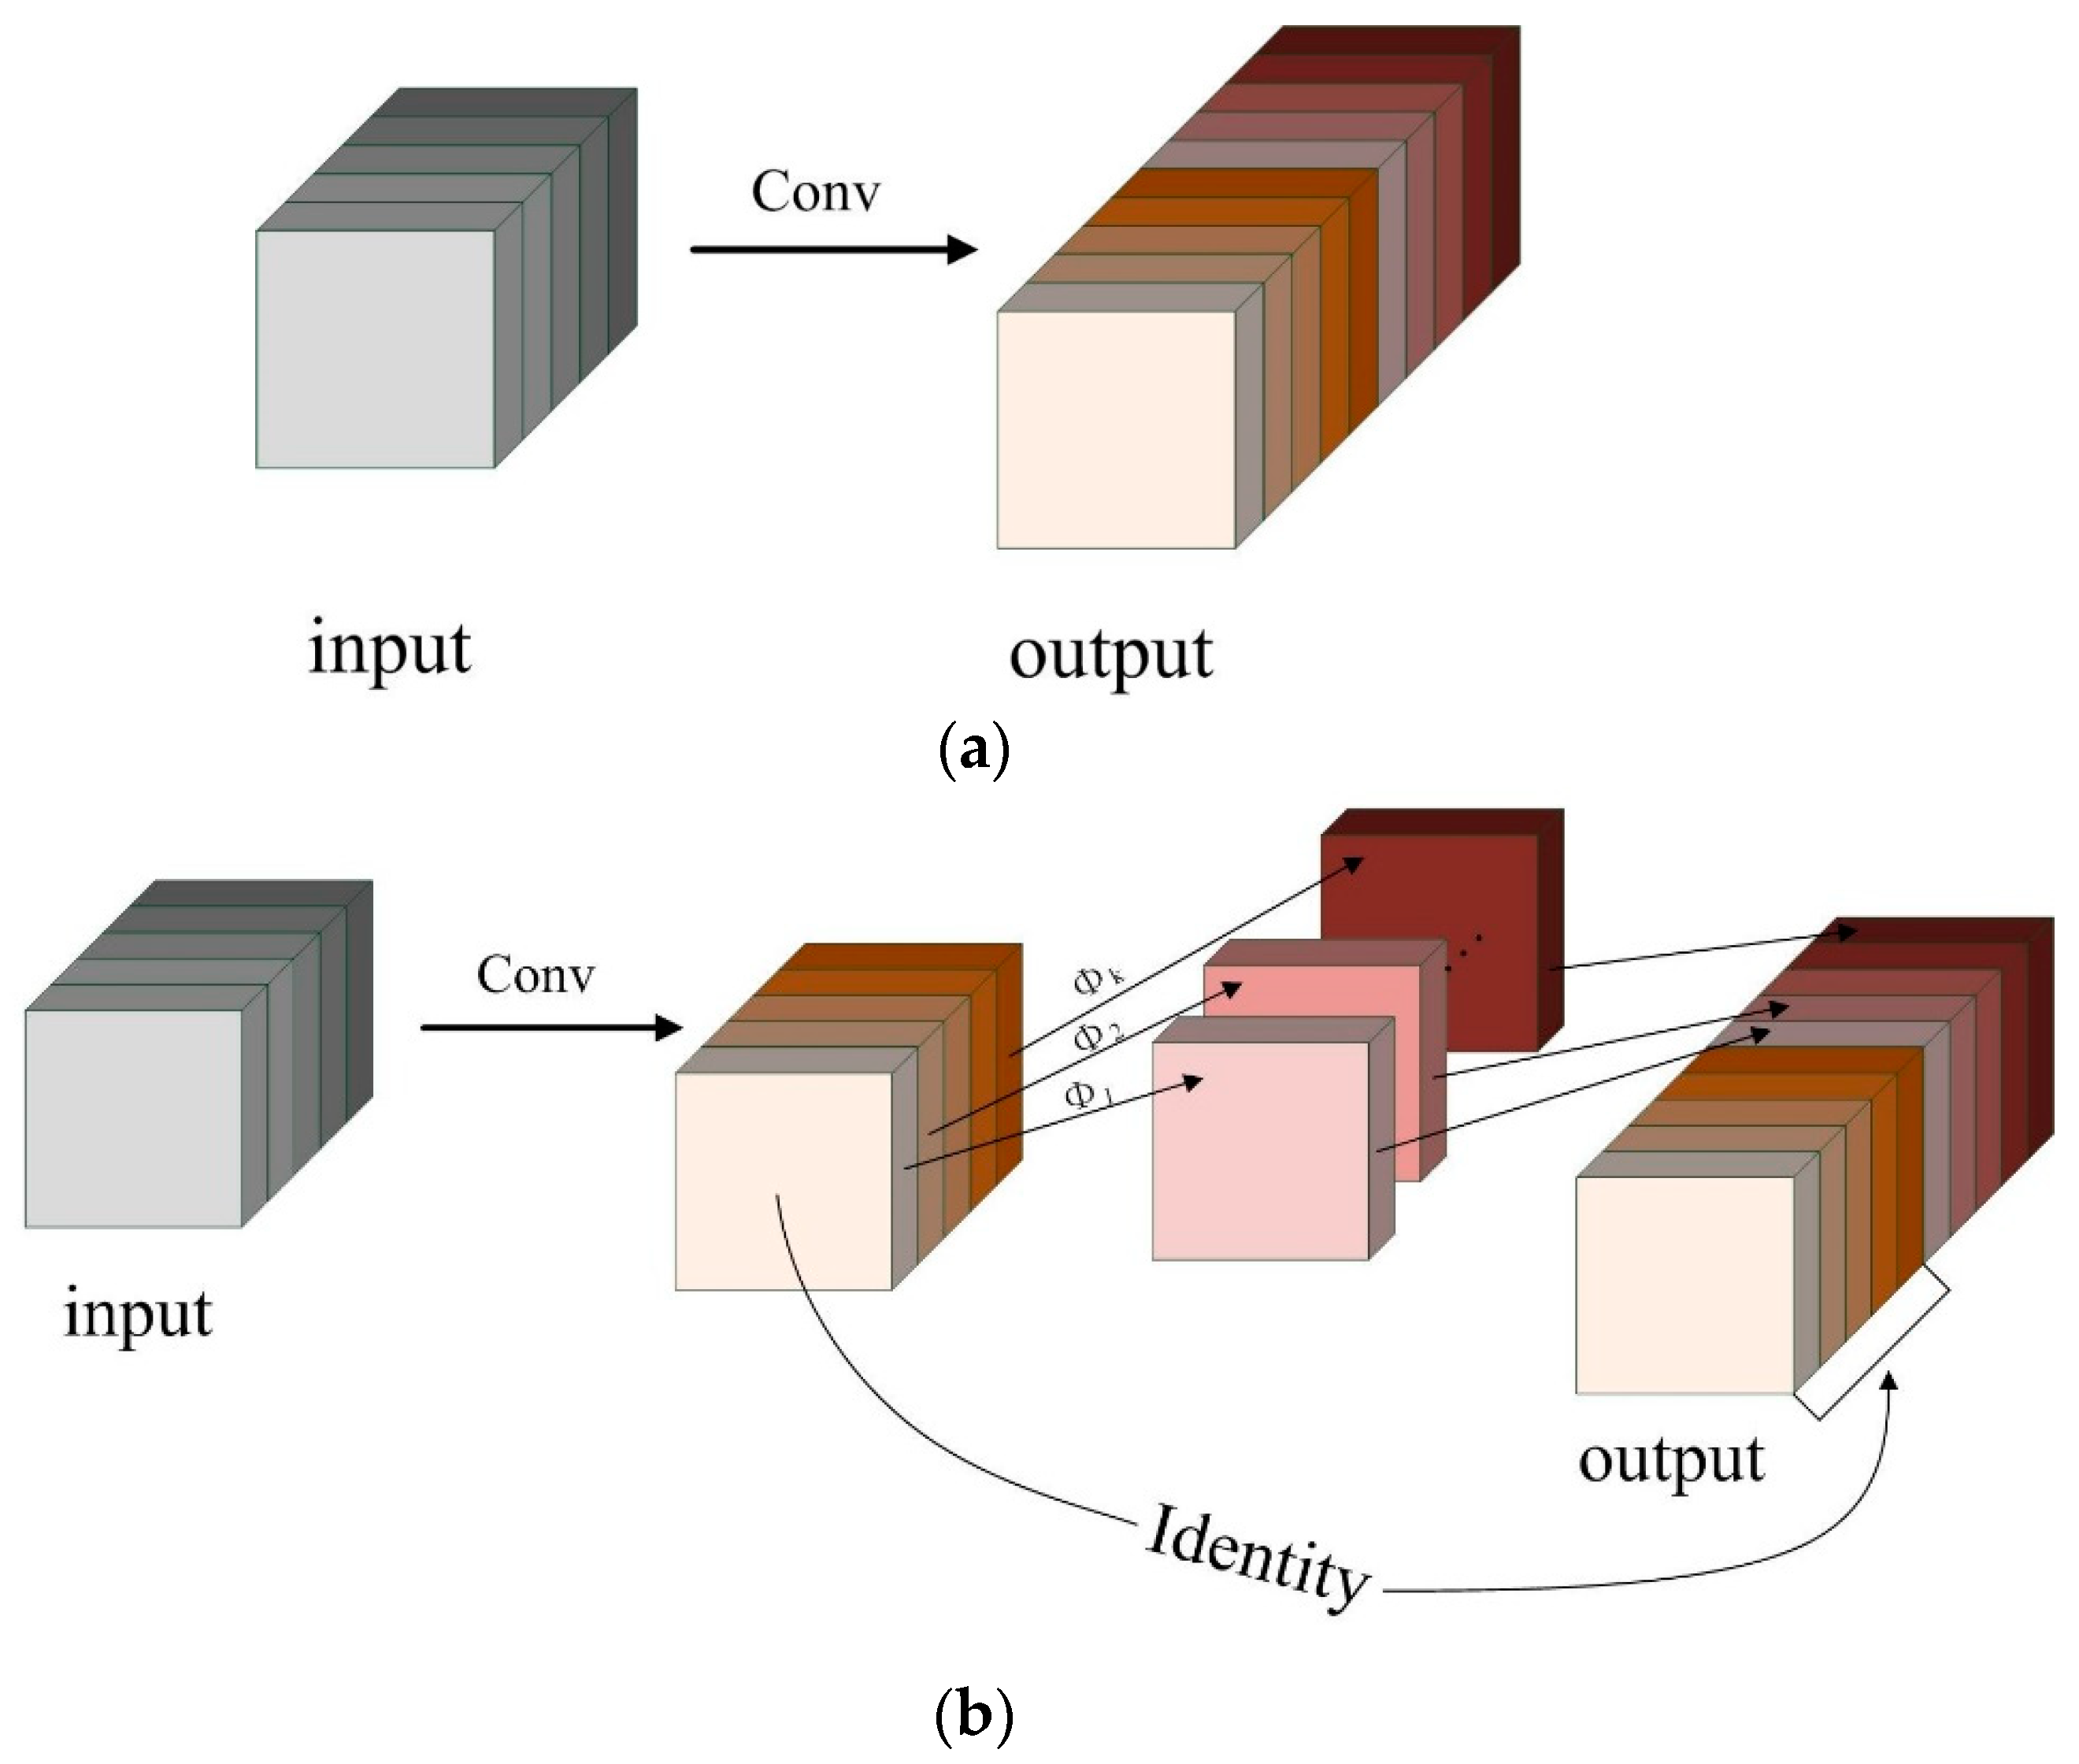
2.3.2. GhostNet
2.3.3. GhostNet Network Improvements
- (a)
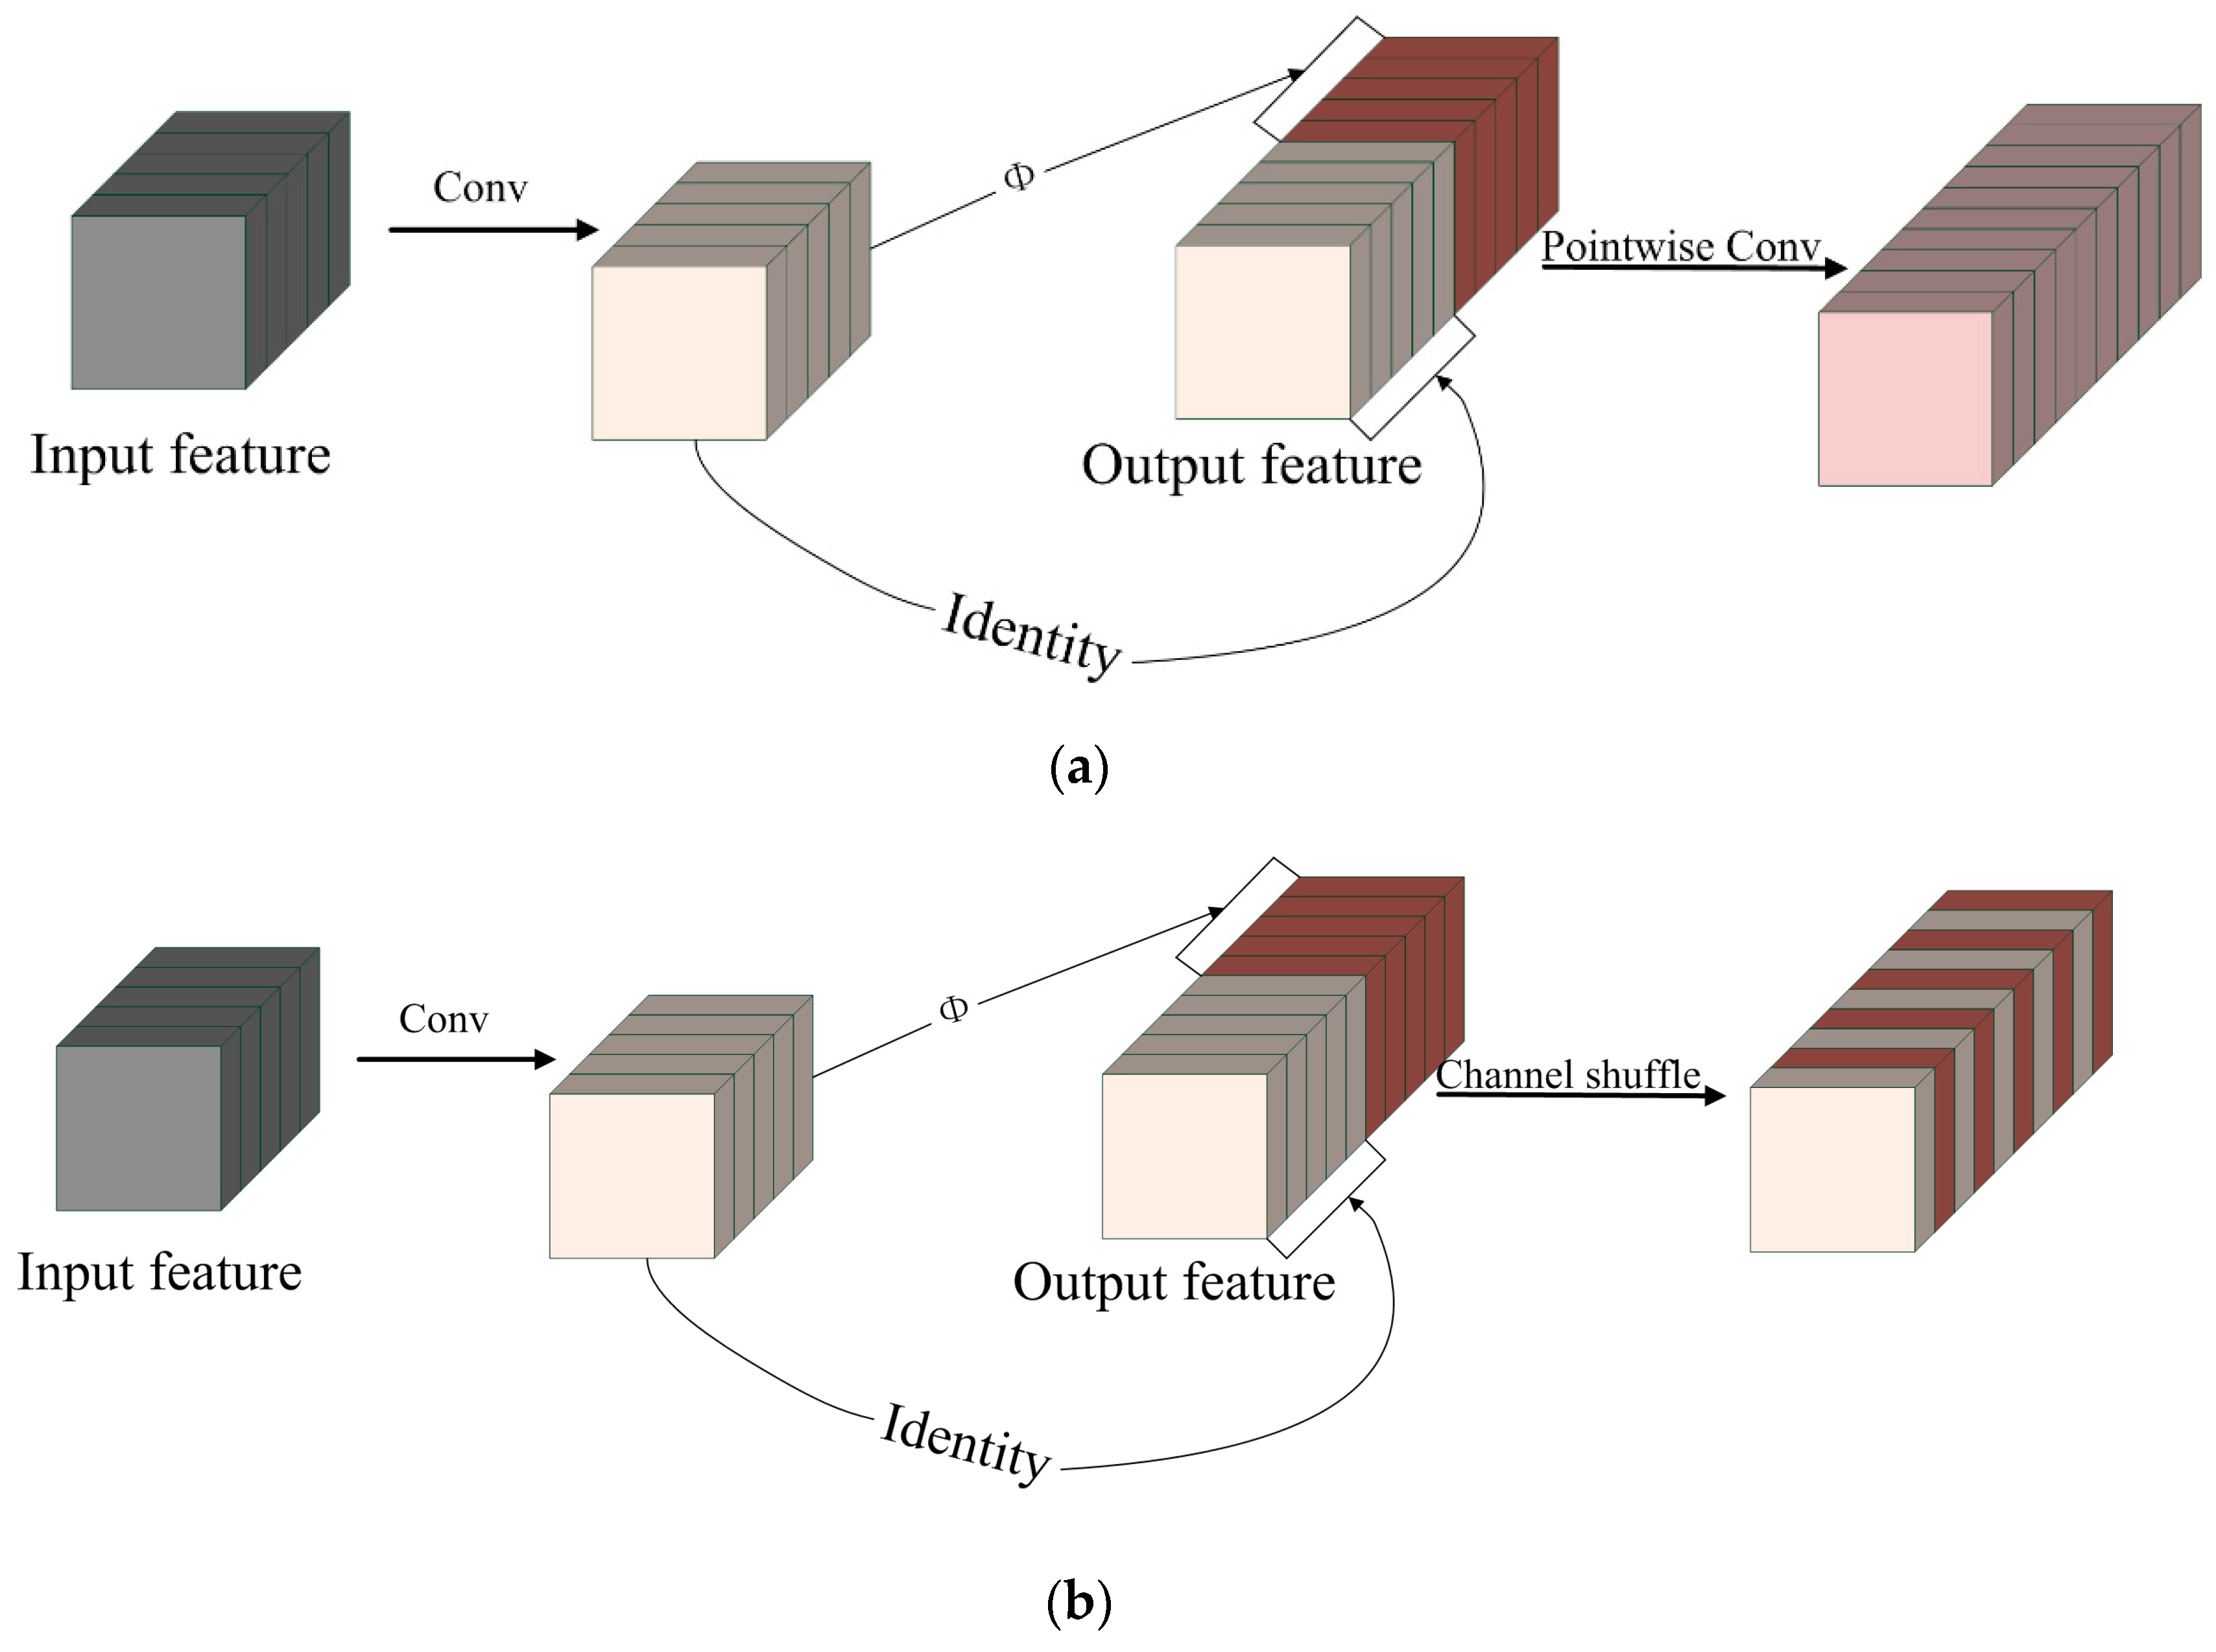
- PW-GhostConv and CS-GhostConv
- (b)
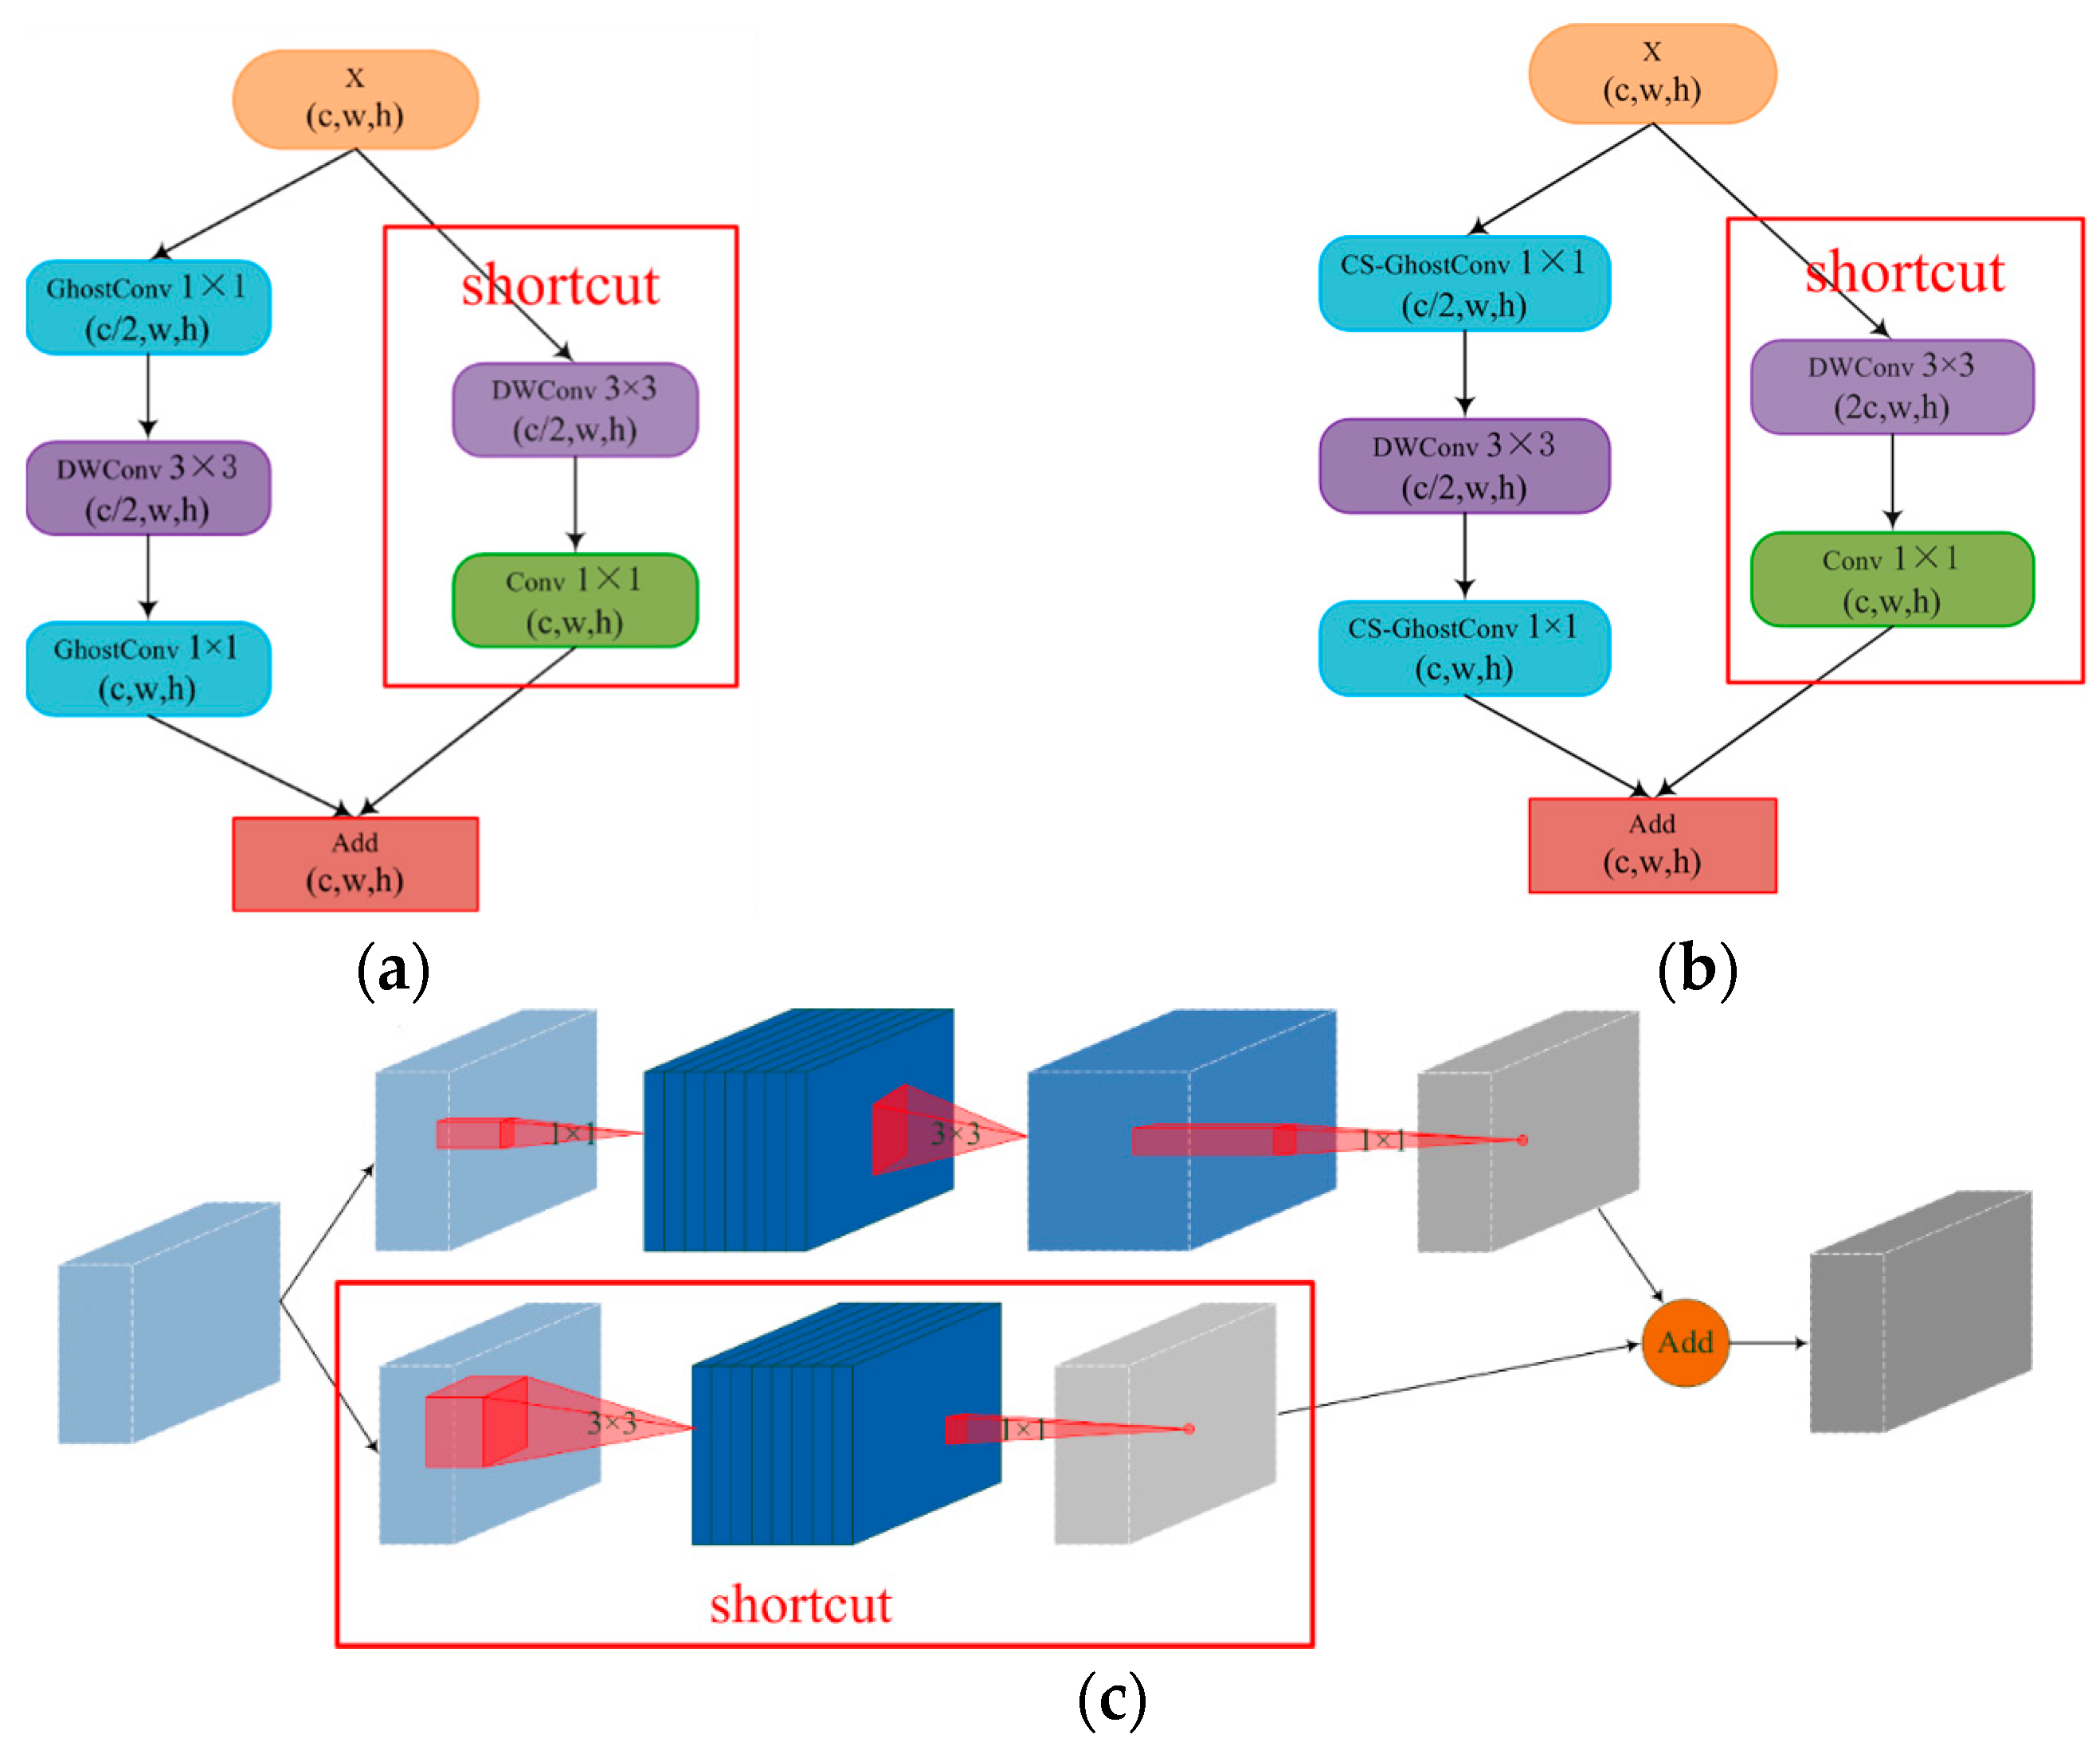
- Inverted-GhostBottleneck
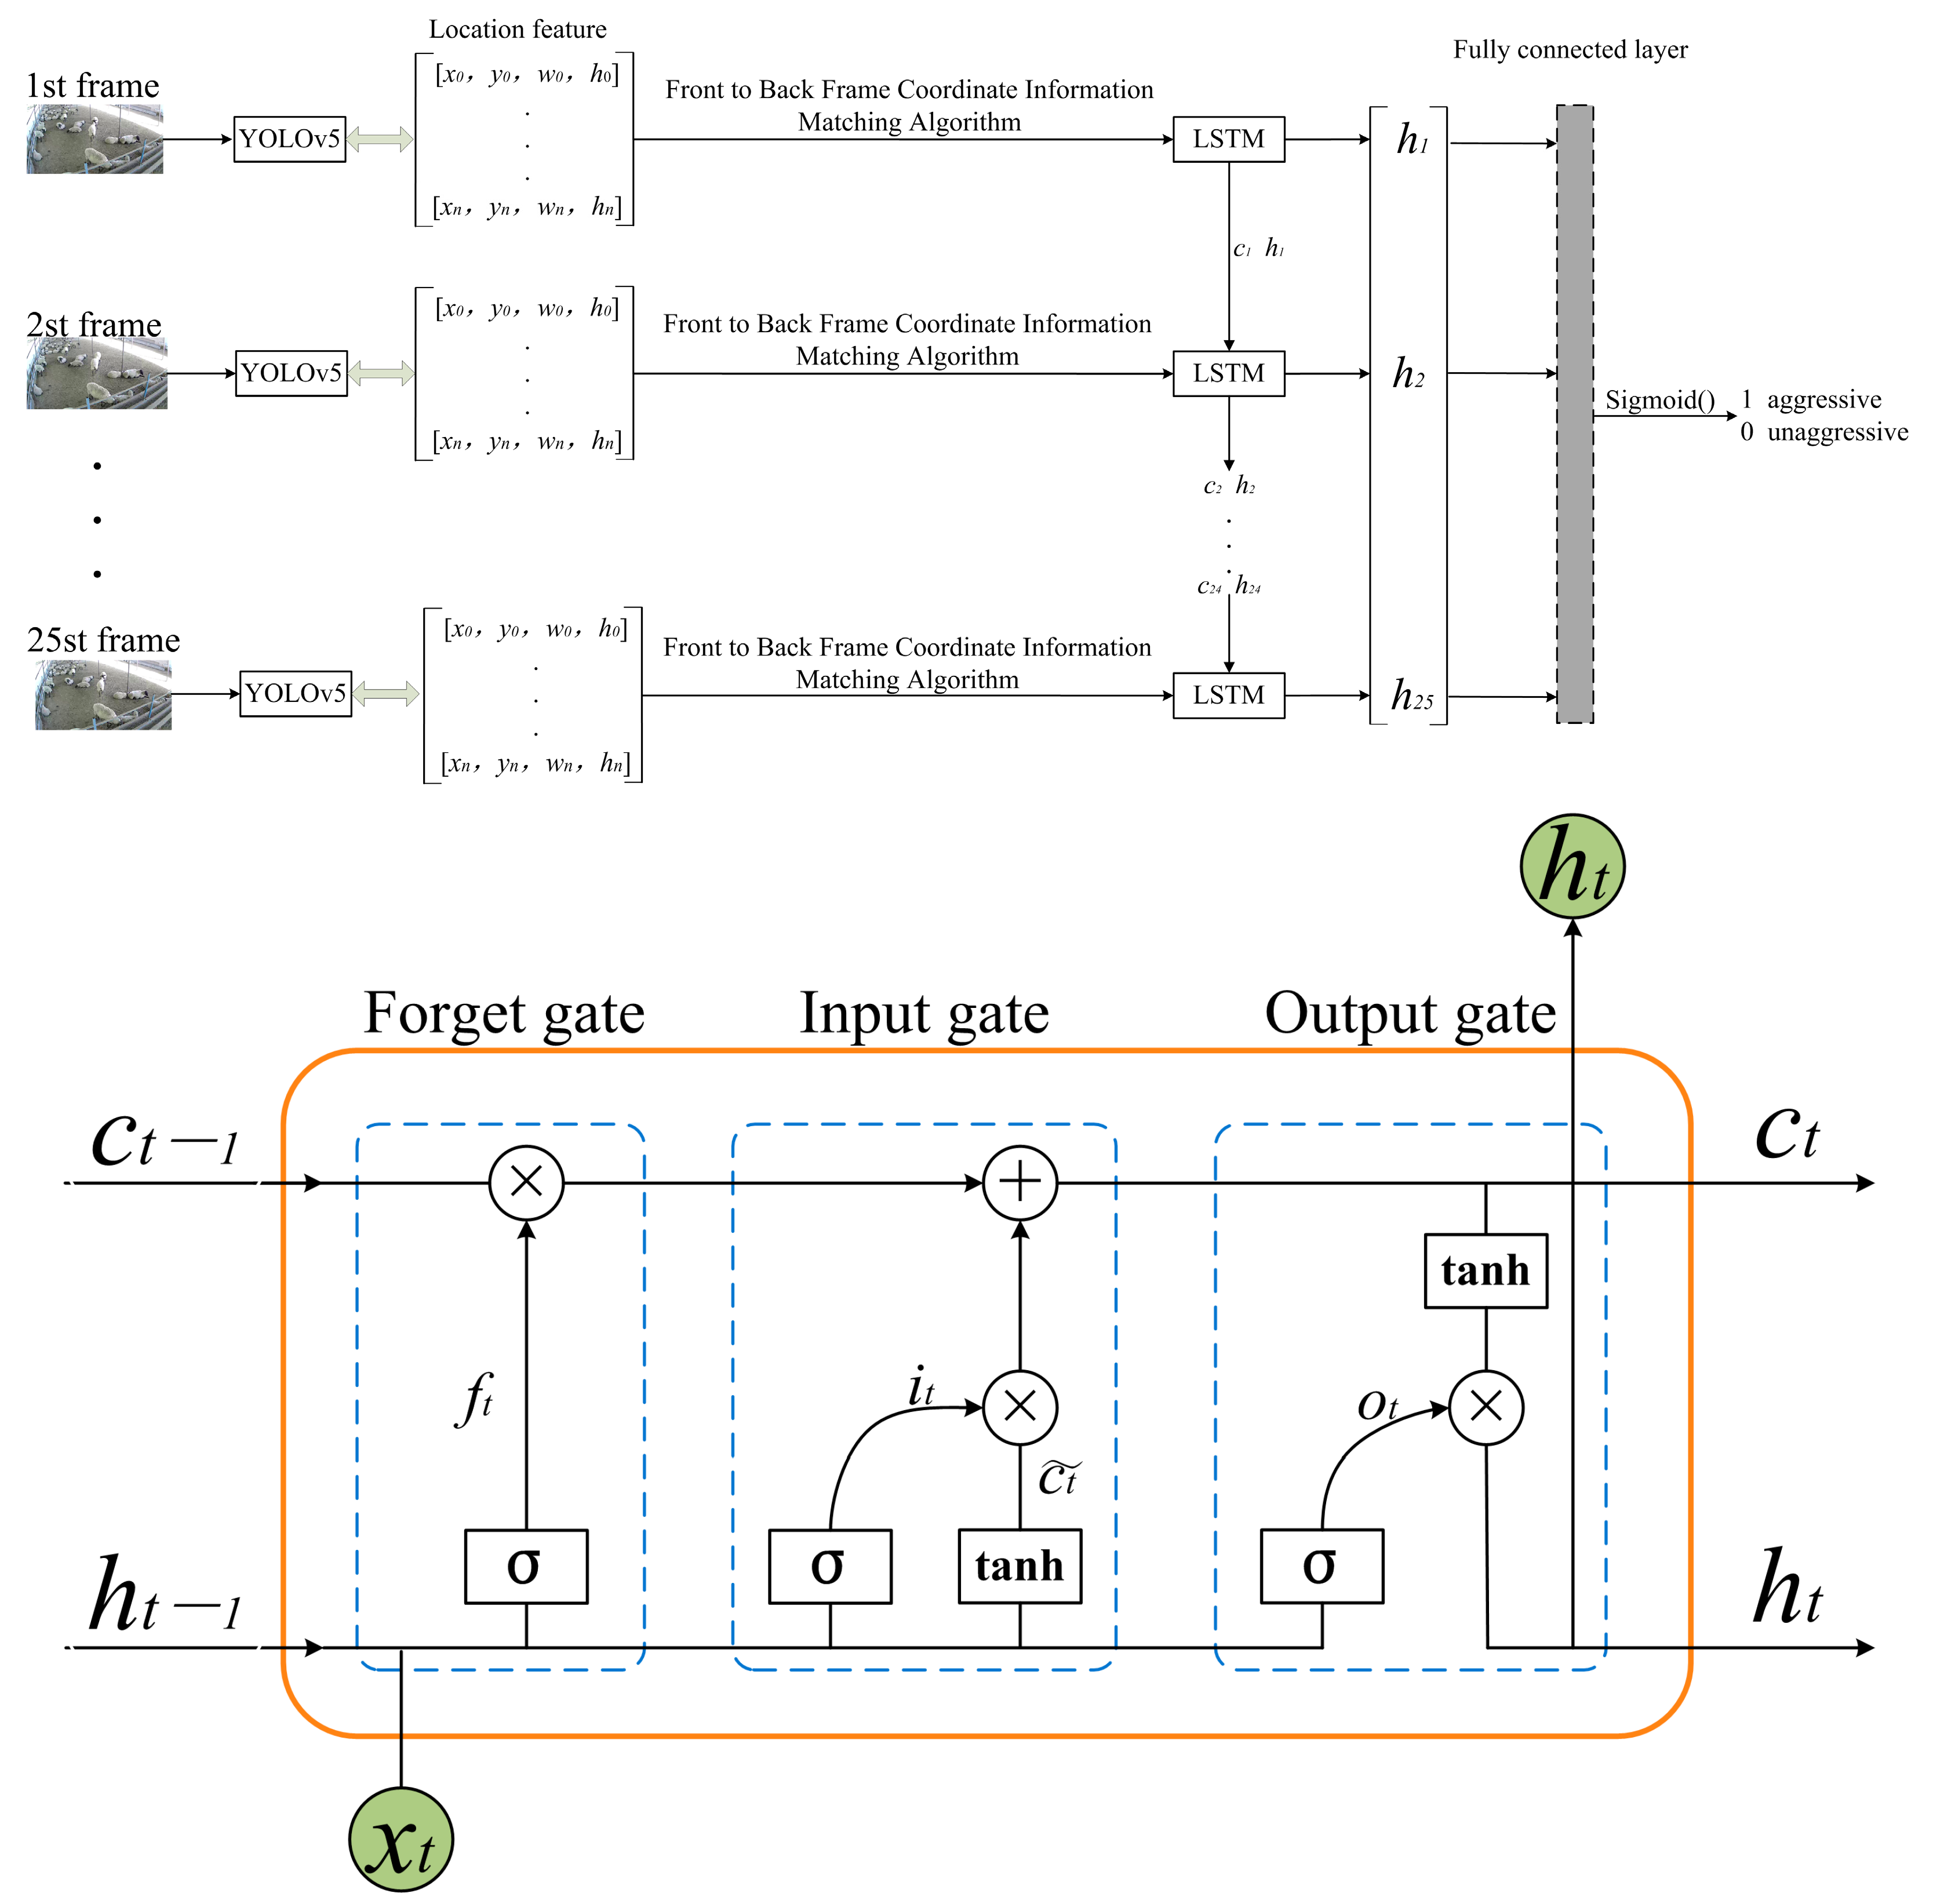
2.4. Construction of Video Detection Model
3. Results
3.1. Network Training and Evaluation Indexes
3.2. Evaluation Indexes Analysis
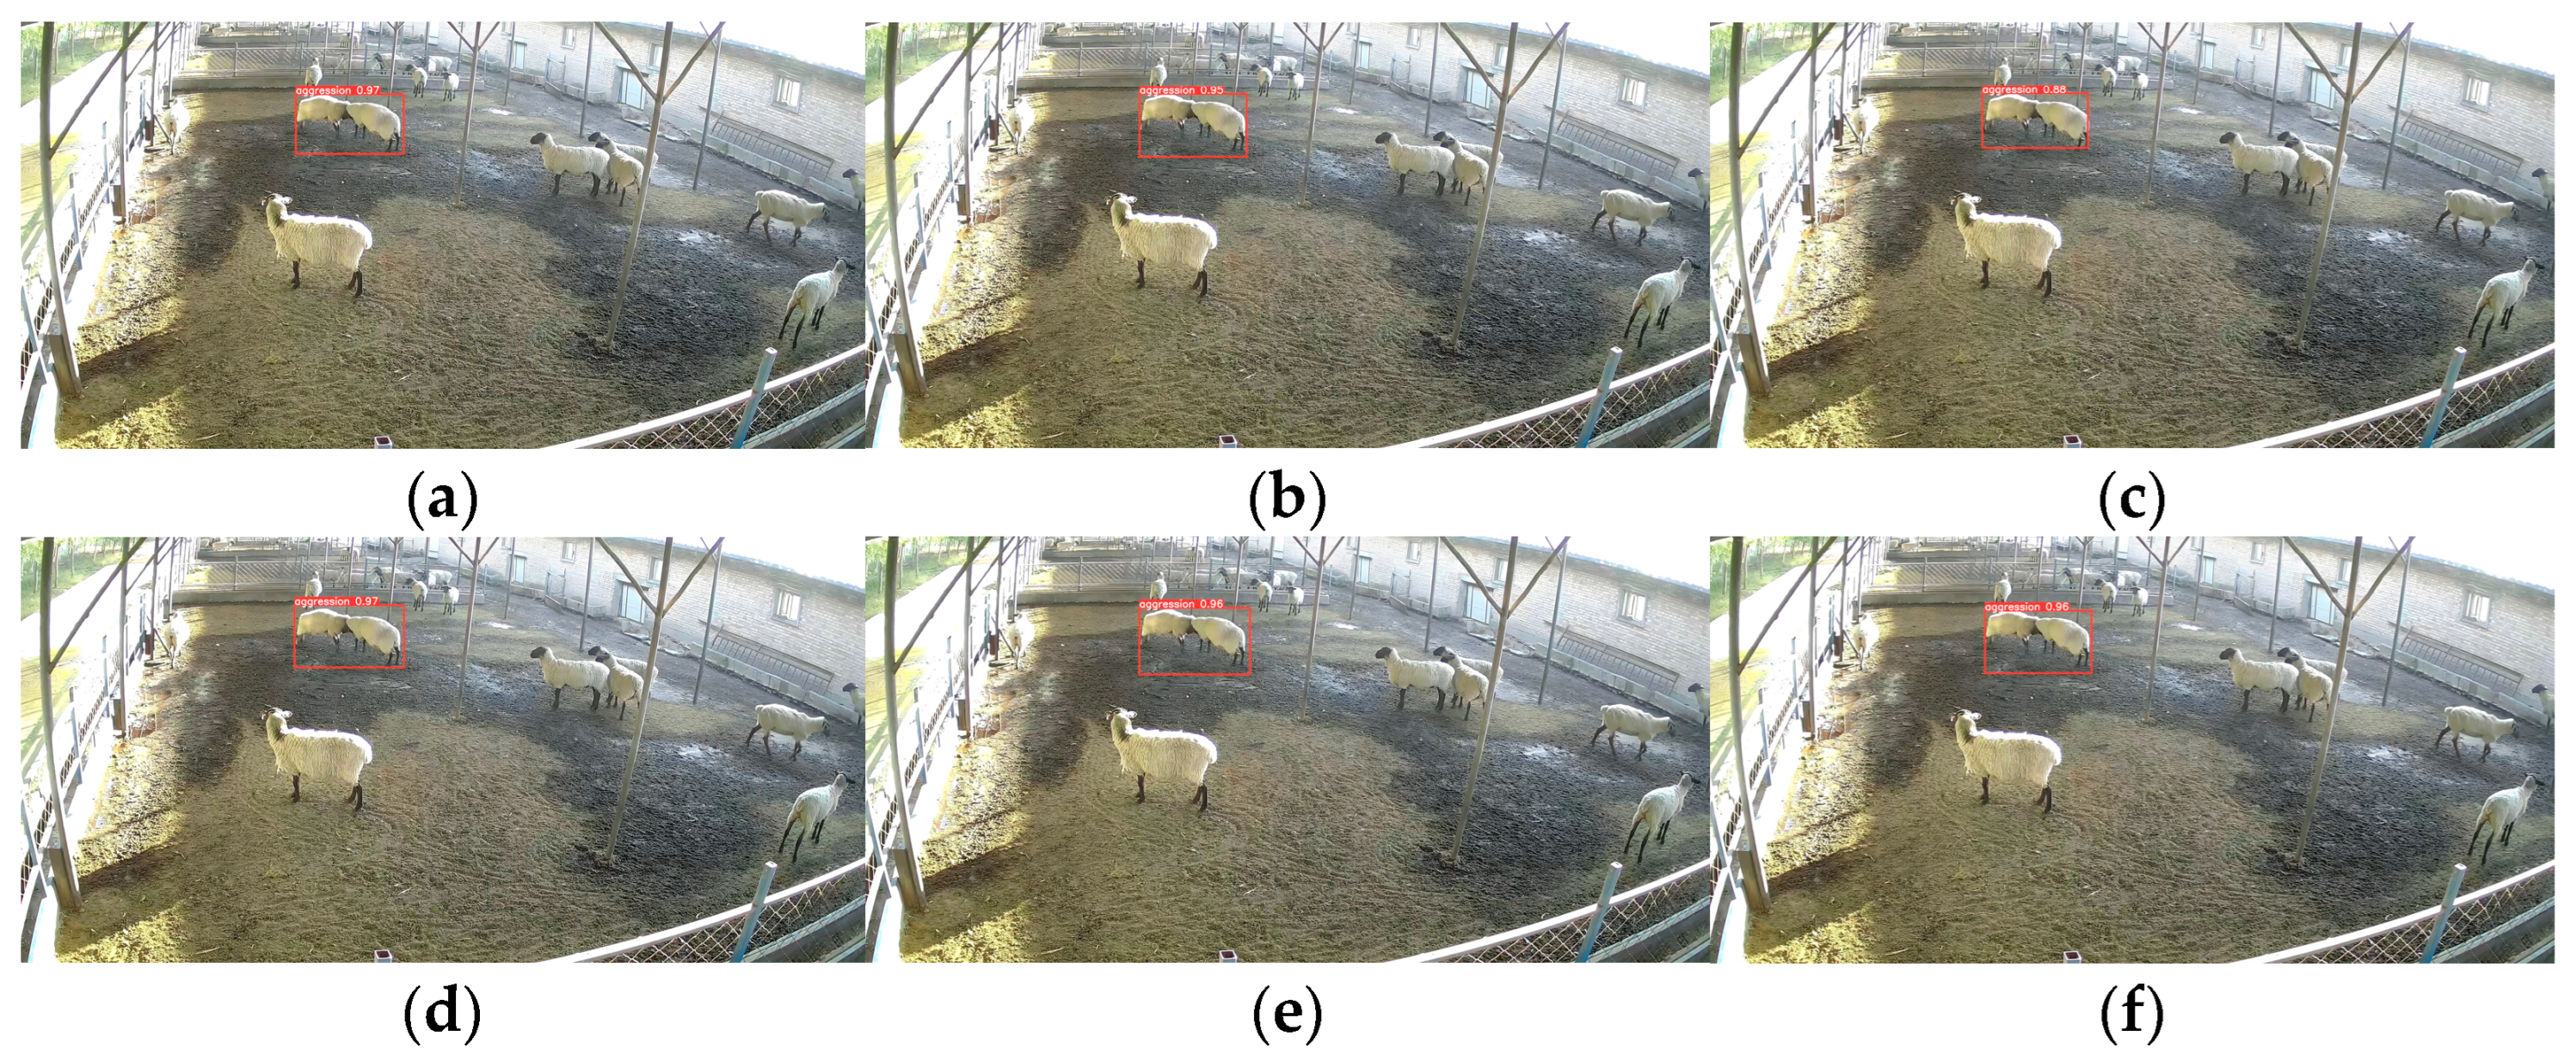
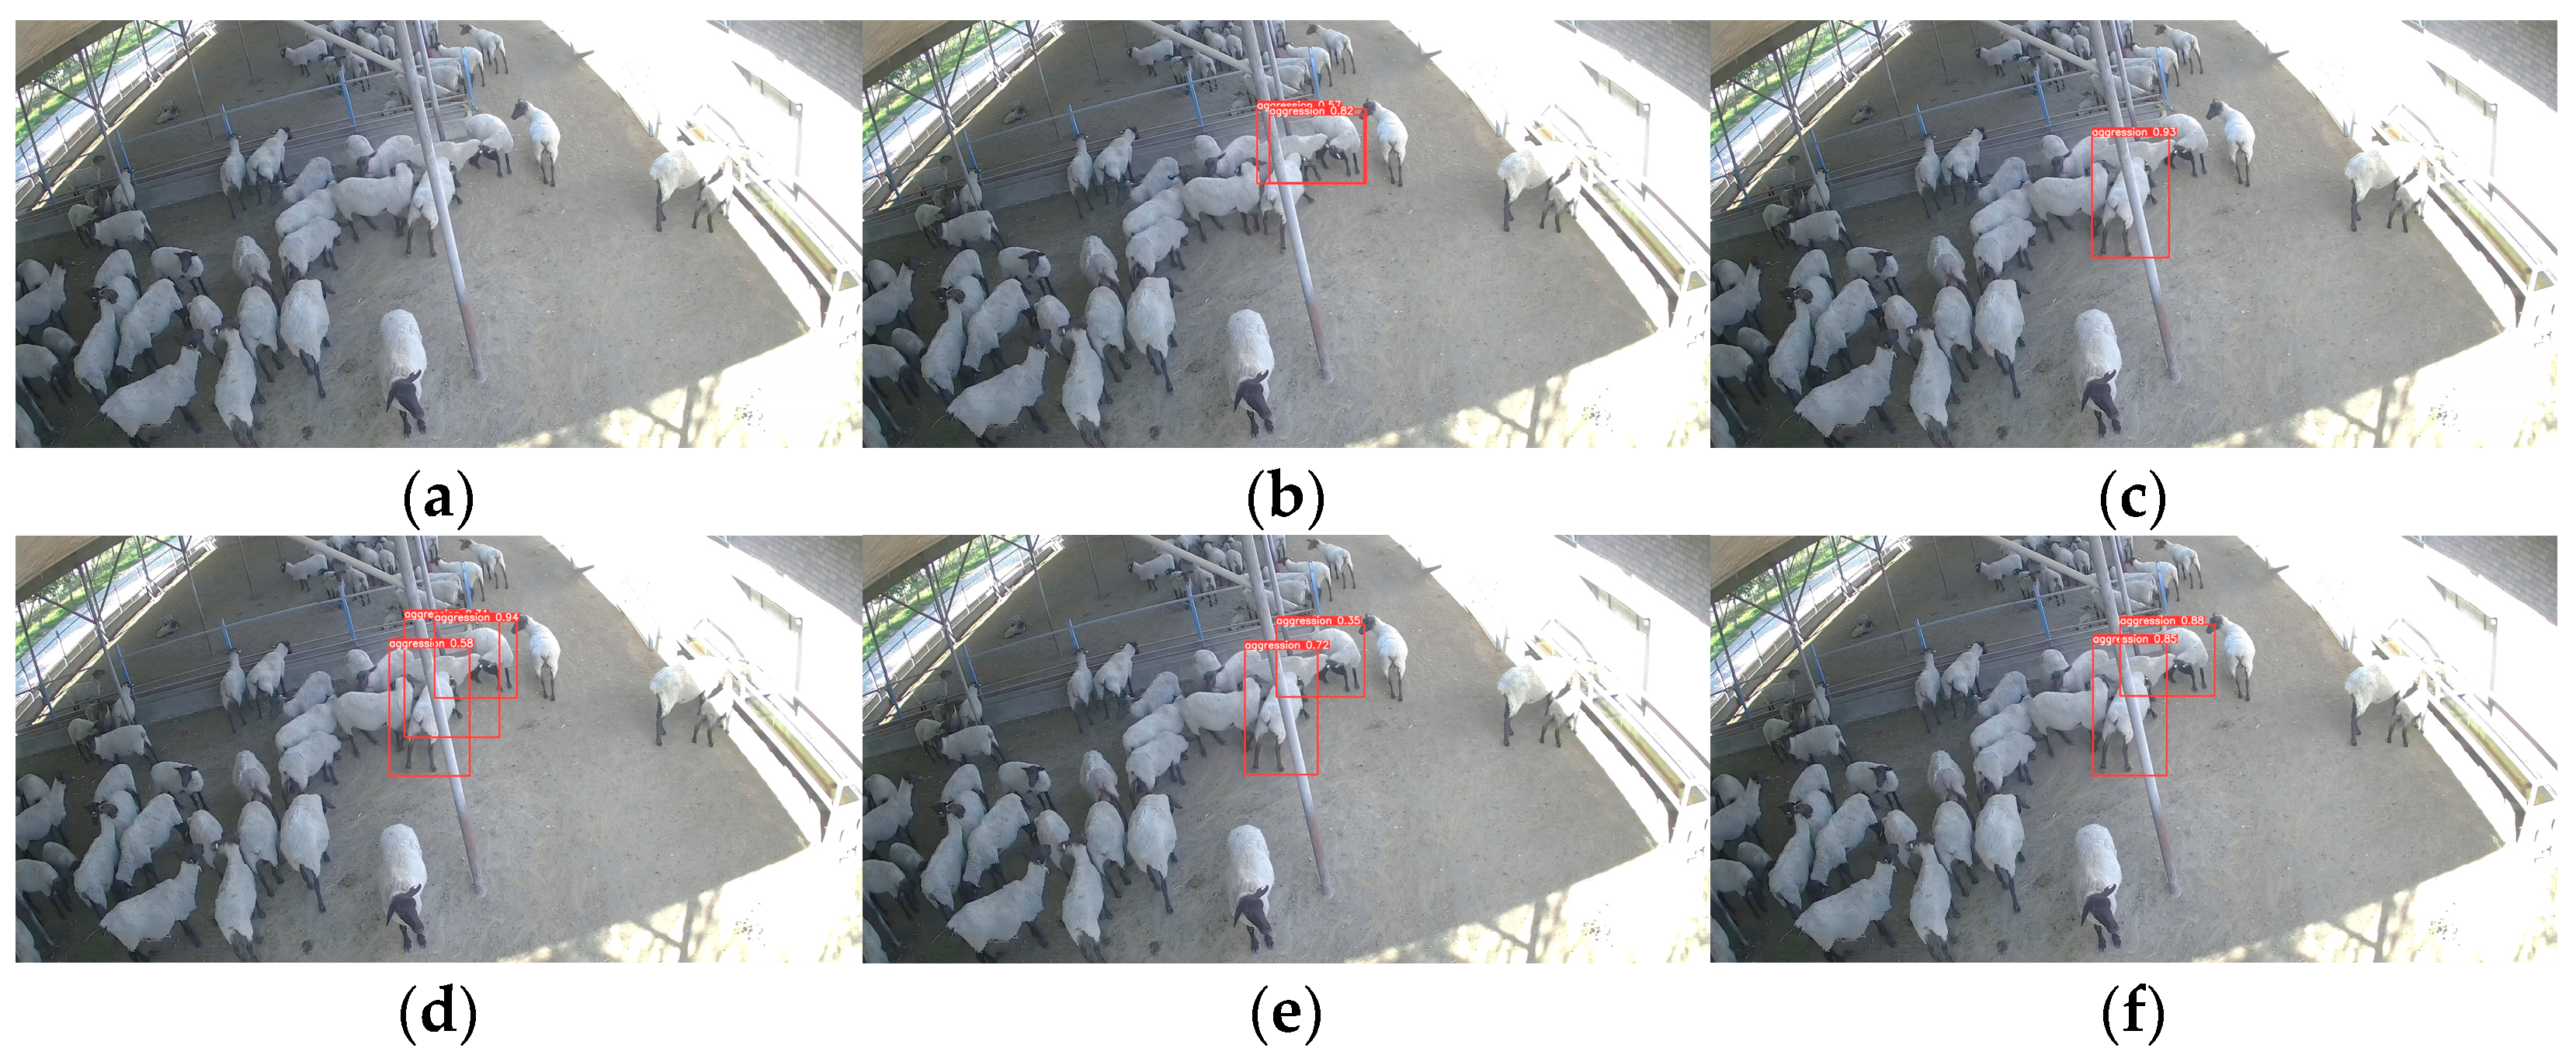
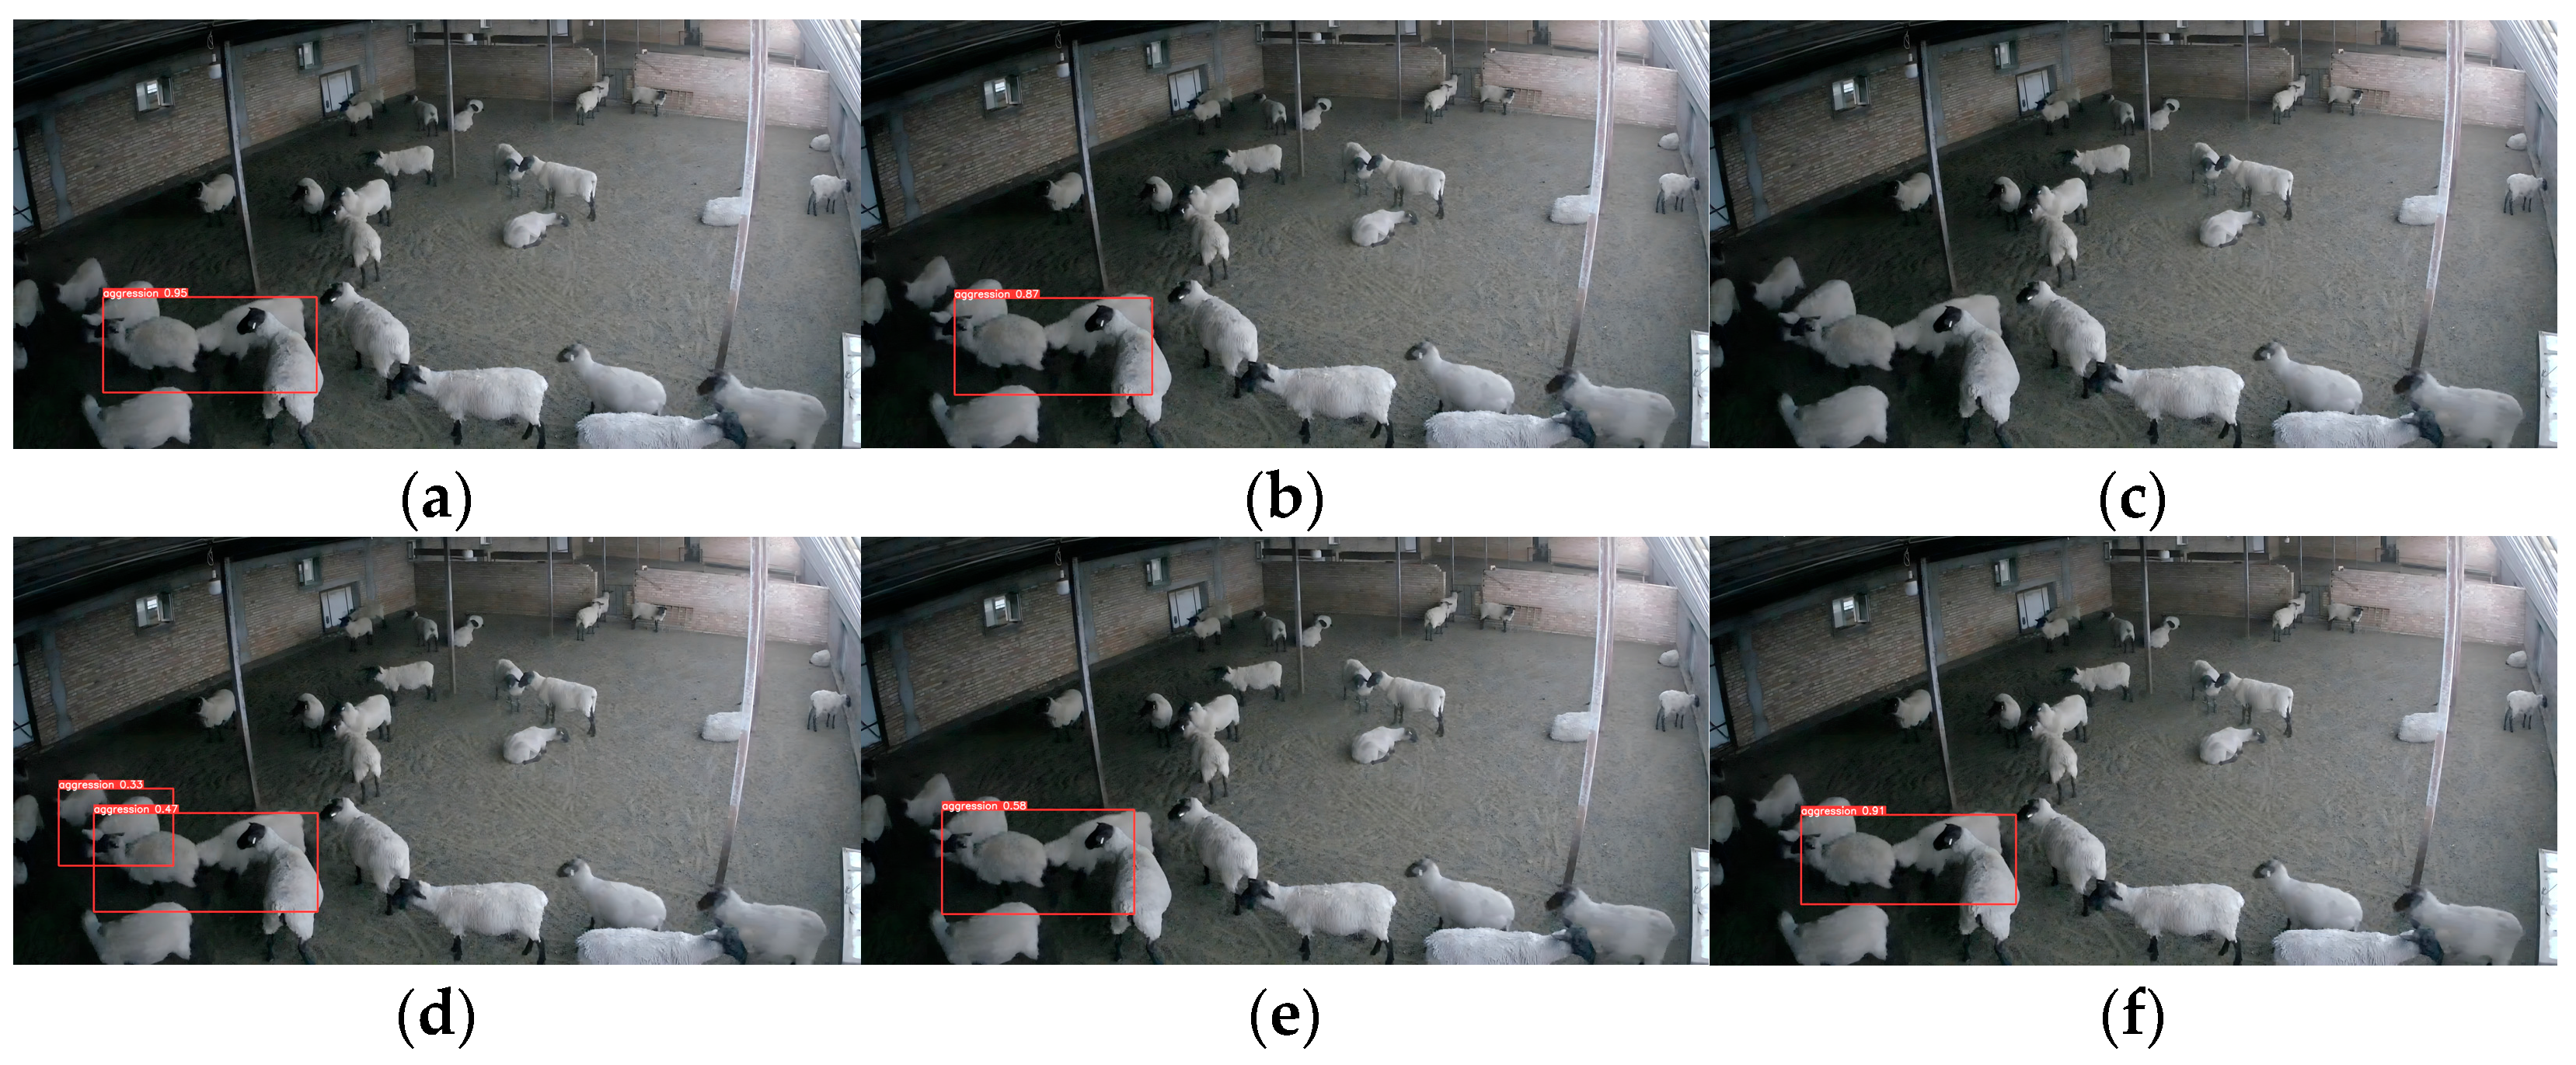
3.3. Experimental Results Analysis
4. Discussion
4.1. Model Comparison Analysis
4.1.1. Image Detection Model Comparison
4.1.2. Video Detection Model Comparison
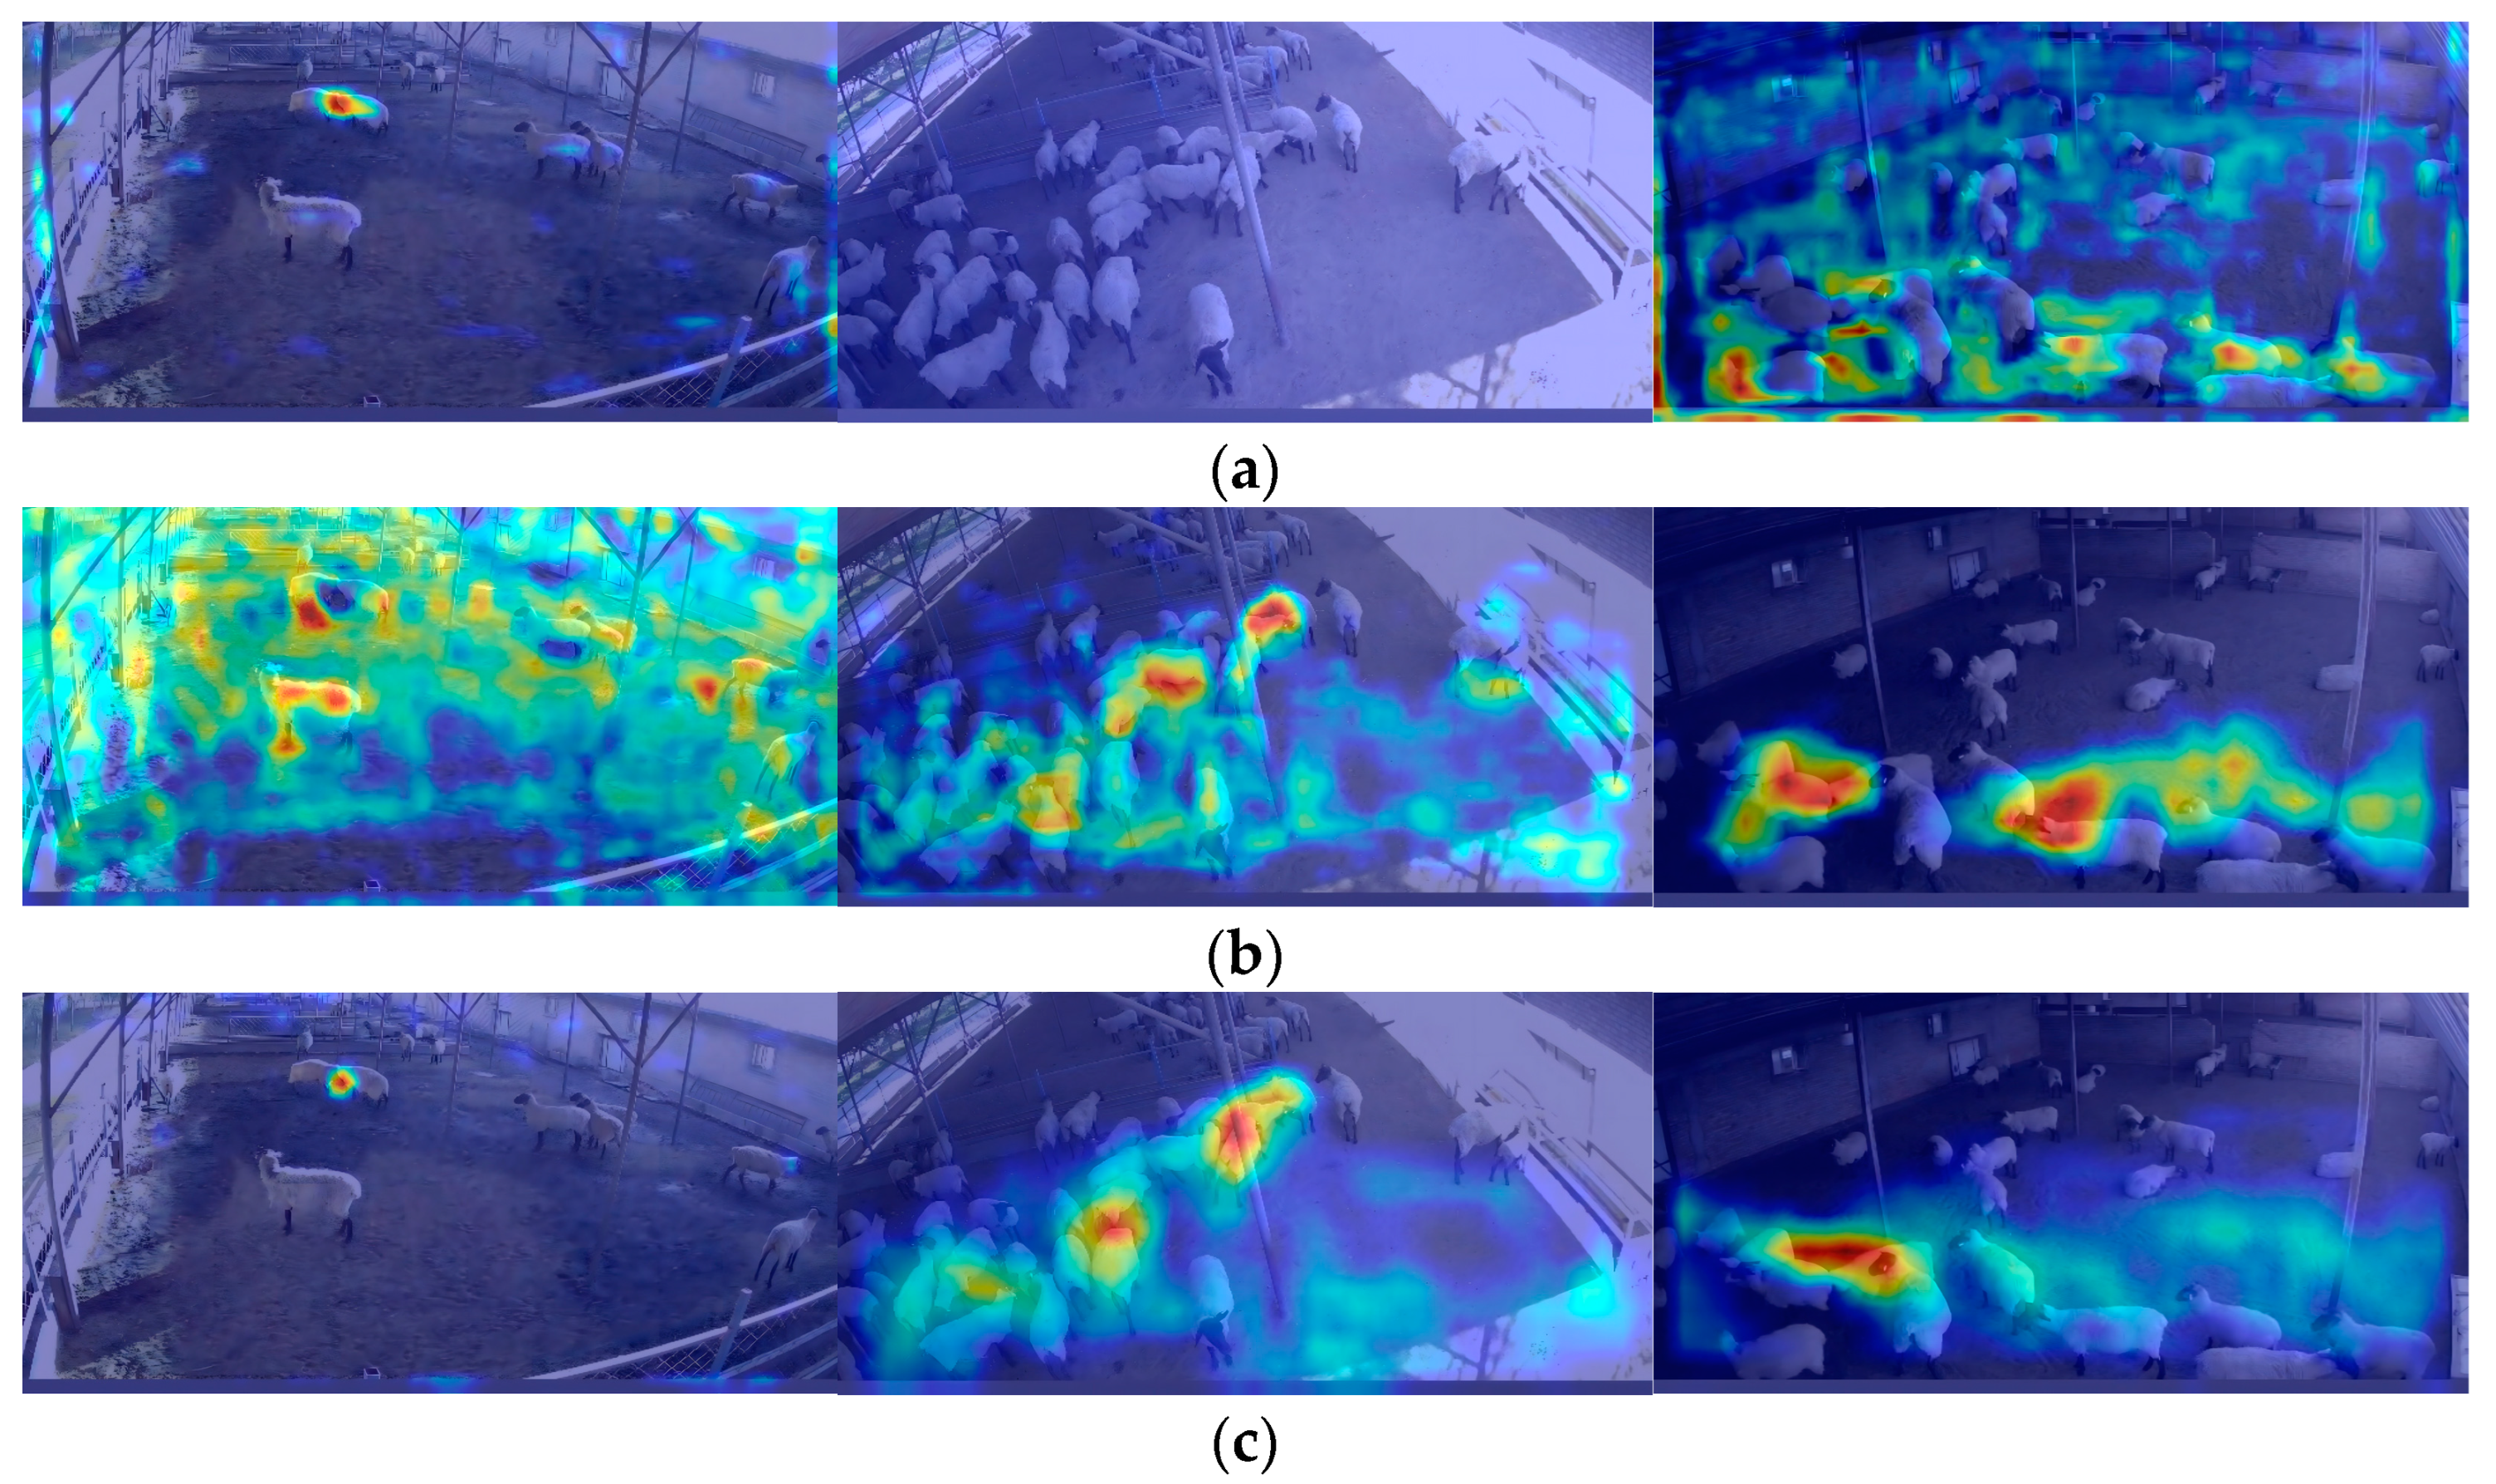
4.2. Network Visualization
5. Conclusions
Author Contributions
Funding
Institutional Review Board Statement
Informed Consent Statement
Data Availability Statement
Acknowledgments
Conflicts of Interest
References
- Jiang, M.; Rao, Y.; Zhang, J.; Shen, Y. Automatic behavior recognition of group-housed goats using deep learning. Comput. Electron. Agric. 2020, 177, 105706. [Google Scholar] [CrossRef]
- Liu, D.; Oczak, M.; Maschat, K.; Baumgartner, J.; Pletzer, B.; He, D.; Norton, T. A computer vision-based method for spatial-temporal action recognition of tail-biting behaviour in group-housed pigs. Biosyst. Eng. 2020, 195, 27–41. [Google Scholar] [CrossRef]
- Erhard, H.W.; Fàbrega, E.; Stanworth, G.; A Elston, D. Assessing dominance in sheep in a competitive situation: Level of motivation and test duration. Appl. Anim. Behav. Sci. 2004, 85, 277–292. [Google Scholar] [CrossRef]
- Nowak, R.; Porter, R.H.; Blache, D.; Dwyer, C.M. Behaviour and the welfare of the sheep. In The Welfare of Sheep; Dwyer, C.M., Ed.; Springer: Dordrecht, The Netherlands, 2008; pp. 81–134. [Google Scholar] [CrossRef]
- Vasseur, S.; Paull, D.R.; Atkinson, S.J.; Colditz, I.G.; Fisher, A.D. Effects of dietary fibre and feeding frequency on wool biting and aggressive behaviours in housed Merino sheep. Aust. J. Exp. Agric. 2006, 46, 777. [Google Scholar] [CrossRef]
- Yang, Q.; Xiao, D. A review of video-based pig behavior recognition. Appl. Anim. Behav. Sci. 2020, 233, 105146. [Google Scholar] [CrossRef]
- Porto, S.M.C.; Arcidiacono, C.; Anguzza, U.; Cascone, G. The automatic detection of dairy cow feeding and standing behaviours in free-stall barns by a computer vision-based system. Biosyst. Eng. 2015, 133, 46–55. [Google Scholar] [CrossRef]
- Chen, C.; Zhu, W.; Ma, C.; Guo, Y.; Huang, W.; Ruan, C. Image motion feature extraction for recognition of aggressive behaviors among group-housed pigs. Comput. Electron. Agric. 2017, 142, 380. [Google Scholar] [CrossRef]
- Chen, C.; Zhu, W.; Liu, D.; Steibel, J.; Siegford, J.; Wurtz, K.; Han, J.; Norton, T. Detection of aggressive behaviours in pigs using a RealSence depth sensor. Comput. Electron. Agric. 2019, 166, 105003. [Google Scholar] [CrossRef]
- Nie, J.; Wang, Y.; Li, Y.; Chao, X. Artificial intelligence and digital twins in sustainable agriculture and forestry: A survey. Turk. J. Agric. For. 2022, 46, 642–661. [Google Scholar] [CrossRef]
- Nie, J.; Wang, Y.; Li, Y.; Chao, X. Sustainable computing in smart agriculture: Survey and challenges. Turk. J. Agric. For. 2022, 46, 550–566. [Google Scholar] [CrossRef]
- Redmon, J.; Divvala, S.; Girshick, R.; Farhadi, A. You only look once: Unified, real-time object detection. In Proceedings of the 2016 IEEE Conference on Computer Vision and Pattern Recognition (CVPR), Las Vegas, NV, USA, 27–30 June 2016; pp. 779–788. Available online: http://ieeexplore.ieee.org/document/7780460/ (accessed on 30 June 2022).
- Redmon, J.; Farhadi, A. YOLOv3: An Incremental Improvement. arXiv 2018, arXiv:1804.02767. [Google Scholar]
- Redmon, J.; Farhadi, A. YOLO9000: Better, faster, stronger. In Proceedings of the 2017 IEEE Conference on Computer Vision and Pattern Recognition (CVPR), Honolulu, HI, USA, 21–26 July 2017; pp. 6517–6525. Available online: http://ieeexplore.ieee.org/document/8100173/ (accessed on 30 June 2022).
- Bochkovskiy, A.; Wang, C.; Liao, H. YOLOv4: Optimal Speed and Accuracy of Object Detection. arXiv 2020, arXiv:2004.10934. [Google Scholar]
- Li, C.; Li, L.; Jiang, H.; Weng, K.; Geng, Y.; Li, L.; Ke, Z.; Li, Q.; Cheng, M.; Nie, W.; et al. YOLOv6: A Single-Stage Object Detection Framework for Industrial Applications. arXiv 2022, arXiv:2209.02976. [Google Scholar]
- Wang, C.Y.; Bochkovskiy, A.; Liao, H.Y.M. YOLOv7: Trainable bag-of-freebies sets new state-of-the-art for real-time object detectors. arXiv 2022, arXiv:2207.02696. [Google Scholar]
- Liu, W.; Anguelov, D.; Erhan, D.; Szegedy, C.; Reed, S.; Fu, C.Y.; Berg, A.C. SSD: Single Shot MultiBox Detector. arXiv 2016, arXiv:1512.02325. [Google Scholar]
- Girshick, R. Fast R-CNN. arXiv 2015, arXiv:1504.08083. [Google Scholar]
- Zheng, C. Automatic recognition of lactating sow postures from depth images by deep learning detector. Comput. Electron. Agric. 2018, 147, 51–63. [Google Scholar] [CrossRef]
- Wang, J.; Wang, N.; Li, L.; Ren, Z. Real-time behavior detection and judgment of egg breeders based on YOLO v3. Neural Comput. Appl. 2020, 32, 5471–5481. [Google Scholar] [CrossRef]
- Joo, K.H.; Duan, S.; Weimer, S.L.; Teli, M.N. Birds’ Eye View: Measuring Behavior and Posture of Chickens as a Metric for Their Well-Being. arXiv 2022, arXiv:2205.00069. [Google Scholar]
- Thenmozhi, M.; Saravanan, M.; Kumar, K.P.M.; Suseela, S.; Deepan, S. Improving the prediction rate of unusual behaviors of animal in a poultry using deep learning technique. Soft Comput. 2020, 24, 14491–14502. [Google Scholar] [CrossRef]
- Chen, C.; Zhu, W.; Steibel, J.; Siegford, J.; Wurtz, K.; Han, J.; Norton, T. Recognition of aggressive episodes of pigs based on convolutional neural network and long short-term memory. Comput. Electron. Agric. 2020, 169, 105166. [Google Scholar] [CrossRef]
- Xu, Y.; Nie, J.; Cen, H.; Wen, B.; Liu, S.; Li, J.; Ge, J.; Yu, L.; Pu, Y.; Song, K.; et al. Spatio-Temporal-Based Identification of Aggressive Behavior in Group Sheep. Animals 2023, 13, 2636. [Google Scholar] [CrossRef] [PubMed]
- Tran, D.; Bourdev, L.; Fergus, R.; Torresani, L.; Paluri, M. Learning Spatiotemporal Features with 3D Convolutional Networks. arXiv 2015, arXiv:1412.0767. [Google Scholar]
- Yu, L.; Pu, Y.; Cen, H.; Li, J.; Liu, S.; Nie, J.; Ge, J.; Lv, L.; Li, Y.; Xu, Y.; et al. A Lightweight Neural Network-Based Method for Detecting Estrus Behavior in Ewes. Agriculture 2022, 12, 1207. [Google Scholar] [CrossRef]
- Zhao, S.; Zhang, S.; Lu, J.; Wang, H.; Feng, Y.; Shi, C.; Li, D.; Zhao, R. A lightweight dead fish detection method based on deformable convolution and YOLOV4. Comput. Electron. Agric. 2022, 198, 107098. [Google Scholar] [CrossRef]
- Han, K.; Wang, Y.; Tian, Q.; Guo, J.; Xu, C.; Xu, C. GhostNet: More Features from Cheap Operations. arXiv 2020, arXiv:1911.11907. [Google Scholar]
- Han, K.; Wang, Y.; Xu, C.; Guo, J.; Xu, C.; Wu, E.; Tian, Q. GhostNets on Heterogeneous Devices via Cheap Operations. Int. J. Comput. Vis. 2022, 130, 1050–1069. [Google Scholar] [CrossRef]
- Zhang, X.; Zhou, X.; Lin, M.; Sun, J. ShuffleNet: An Extremely Efficient Convolutional Neural Network for Mobile Devices. arXiv 2017, arXiv:1707.01083. [Google Scholar]
- Ma, N.; Zhang, X.; Zheng, H.T.; Sun, J. ShuffleNet V2: Practical Guidelines for Efficient CNN Architecture Design. arXiv 2018, arXiv:1807.11164. [Google Scholar]
- Howard, A.G.; Zhu, M.; Chen, B.; Kalenichenko, D.; Wang, W.; Weyand, T.; Andreetto, M.; Adam, H. MobileNets: Efficient Convolutional Neural Networks for Mobile Vision Applications. arXiv 2017, arXiv:1704.04861. [Google Scholar]
- Sandler, M.; Howard, A.; Zhu, M.; Zhmoginov, A.; Chen, L.C. MobileNetV2: Inverted Residuals and Linear Bottlenecks. arXiv 2019, arXiv:1801.04381. [Google Scholar]
- Howard, A.; Sandler, M.; Chu, G.; Chen, L.C.; Chen, B.; Tan, M.; Wang, W.; Zhu, Y.; Pang, R.; Vasudevanet, V.; et al. Searching for MobileNetV3. arXiv 2019, arXiv:1905.02244. [Google Scholar]


| Structure | Memory (G) | P (%) | R (%) | mAP (%) | GFLOPs |
|---|---|---|---|---|---|
| GhostConv + GhostBottleneck(GhostConv) | 0.805 | 95.4 | 85.1 | 93.7 | 8.2 |
| PW-GhostConv + GhostBottleneck(PW-GhostConv) | 1.07 | 95.1 | 88.1 | 94.6 | 10.0 |
| CS- GhostConv + GhostBottleneck(CS-GhostConv) | 0.837 | 95.2 | 86.5 | 94.1 | 8.2 |
| CS-GhostConv + GhostBottleneck(PW-GhostConv) | 0.969 | 95.0 | 86.9 | 94.3 | 9.0 |
| PW-GhostConv + GhostBottleneck(CS-GhostConv) | 0.952 | 95.1 | 88.0 | 94.4 | 9.3 |
| Configuration | Parameter |
|---|---|
| CPU | AMD Ryzen 7 5800H |
| GPU | NVIDIA GeForce RTX 3050 |
| Operating system | Windows 11 |
| Development environment | Pycharm 2021 |
| Model | Backbone | P (%) | R (%) | mAP (%) | Weight (MB) | FPS (f/s) |
|---|---|---|---|---|---|---|
| YOLOv5 | CSPDarkNet53 | 95.4 | 88.7 | 94.8 | 13.7 | 129.9 |
| SSD | Vgg16 | 96.0 | 86.8 | 94.5 | 92.6 | 53.2 |
| YOLOv5 | ShuffleNetv2 | 96.2 | 84.1 | 92.6 | 7.6 | 153.9 |
| YOLOv5 | MobileNetv3-Large | 97.0 | 85.1 | 94.3 | 8.8 | 90.9 |
| YOLOv5 | GhostNet | 95.4 | 85.1 | 93.7 | 7.4 | 161.3 |
| Ours | Improvement-GhostNet | 94.7 | 90.7 | 95.5 | 8.6 | 147.1 |
| Prediction | Positive | Negative | |
|---|---|---|---|
| Reference | |||
| Positive | 395 | 35 | |
| Negative | 28 | 427 | |
Disclaimer/Publisher’s Note: The statements, opinions and data contained in all publications are solely those of the individual author(s) and contributor(s) and not of MDPI and/or the editor(s). MDPI and/or the editor(s) disclaim responsibility for any injury to people or property resulting from any ideas, methods, instructions or products referred to in the content. |
© 2023 by the authors. Licensee MDPI, Basel, Switzerland. This article is an open access article distributed under the terms and conditions of the Creative Commons Attribution (CC BY) license (https://creativecommons.org/licenses/by/4.0/).
Share and Cite
Xu, Y.; Nie, J.; Cen, H.; Wen, B.; Liu, S.; Li, J.; Ge, J.; Yu, L.; Lv, L. An Image Detection Model for Aggressive Behavior of Group Sheep. Animals 2023, 13, 3688. https://doi.org/10.3390/ani13233688
Xu Y, Nie J, Cen H, Wen B, Liu S, Li J, Ge J, Yu L, Lv L. An Image Detection Model for Aggressive Behavior of Group Sheep. Animals. 2023; 13(23):3688. https://doi.org/10.3390/ani13233688
Chicago/Turabian StyleXu, Yalei, Jing Nie, Honglei Cen, Baoqin Wen, Shuangyin Liu, Jingbin Li, Jianbing Ge, Longhui Yu, and Linze Lv. 2023. "An Image Detection Model for Aggressive Behavior of Group Sheep" Animals 13, no. 23: 3688. https://doi.org/10.3390/ani13233688
APA StyleXu, Y., Nie, J., Cen, H., Wen, B., Liu, S., Li, J., Ge, J., Yu, L., & Lv, L. (2023). An Image Detection Model for Aggressive Behavior of Group Sheep. Animals, 13(23), 3688. https://doi.org/10.3390/ani13233688