Environmental DNA: The First Snapshot of the Vertebrate Biodiversity in Three Sicilian Lakes

 , , ,
, , ,  , , and
Abstract
:Simple Summary
Abstract
1. Introduction
2. Materials and Methods
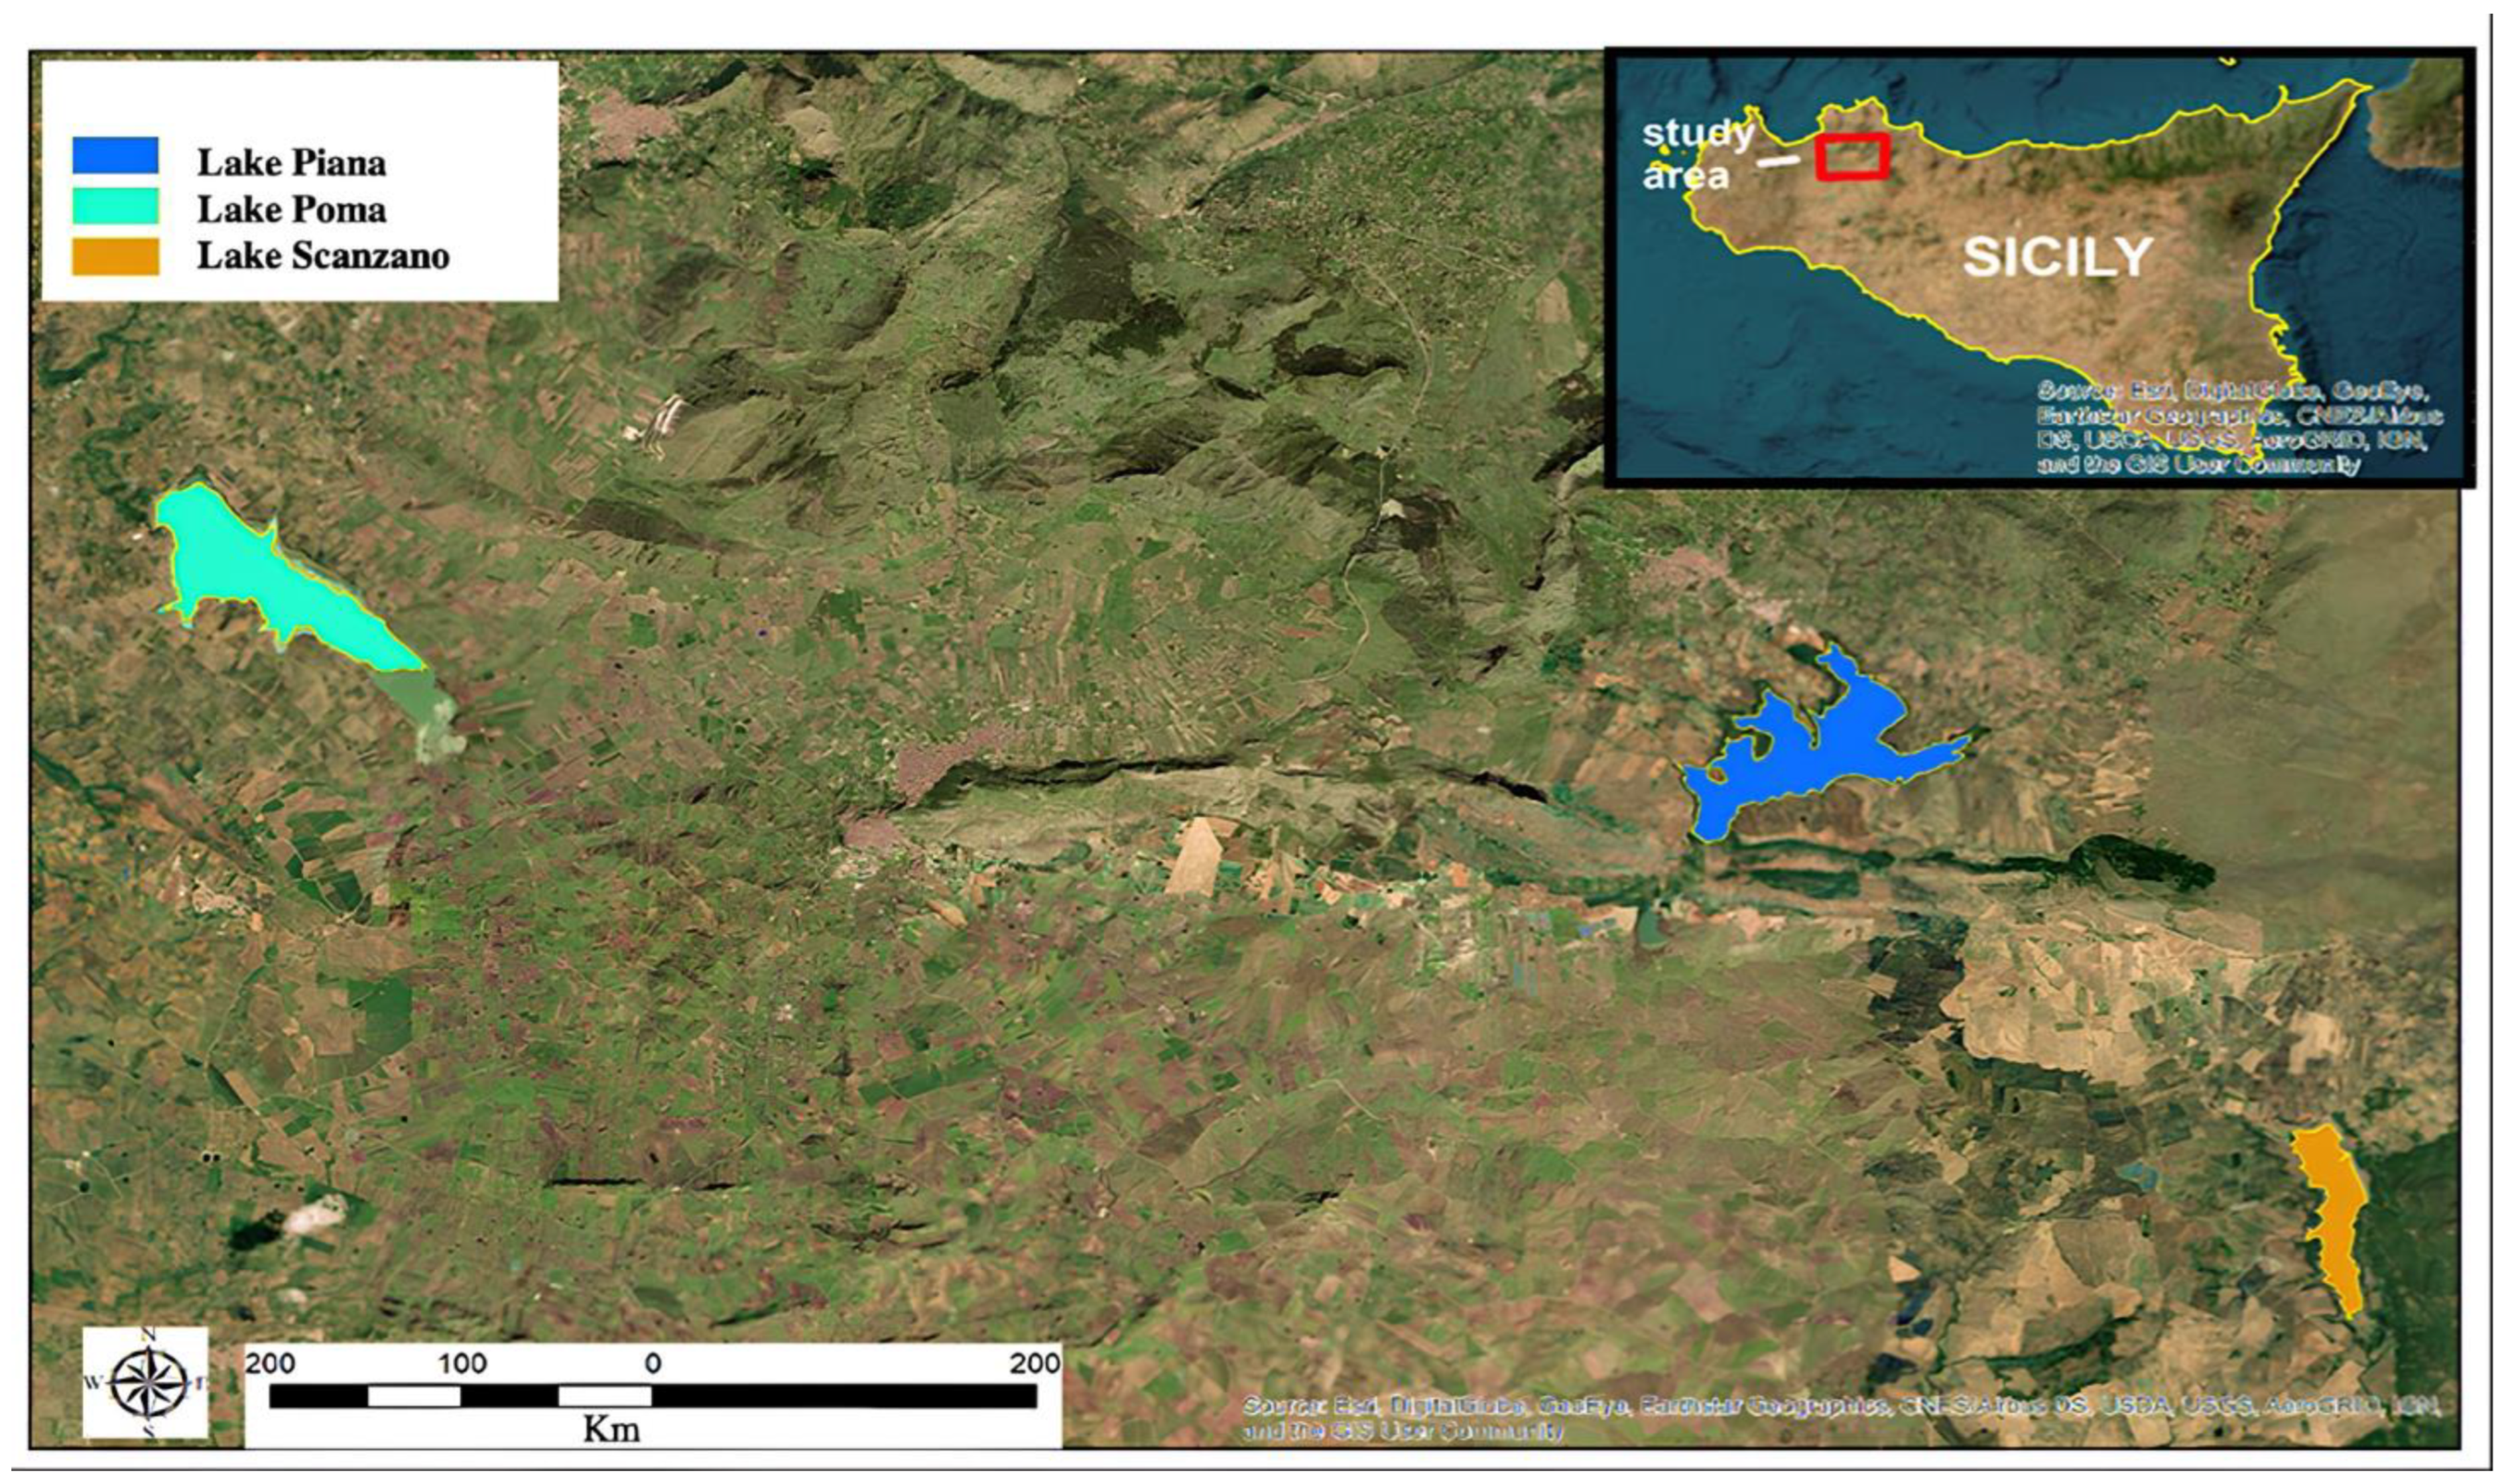
2.1. Study Area
Lakes Description
2.2. Water Sampling and eDNA Extraction
2.3. eDNA Library Preparation and Bioinformatics Analysis
2.4. Data Analysis
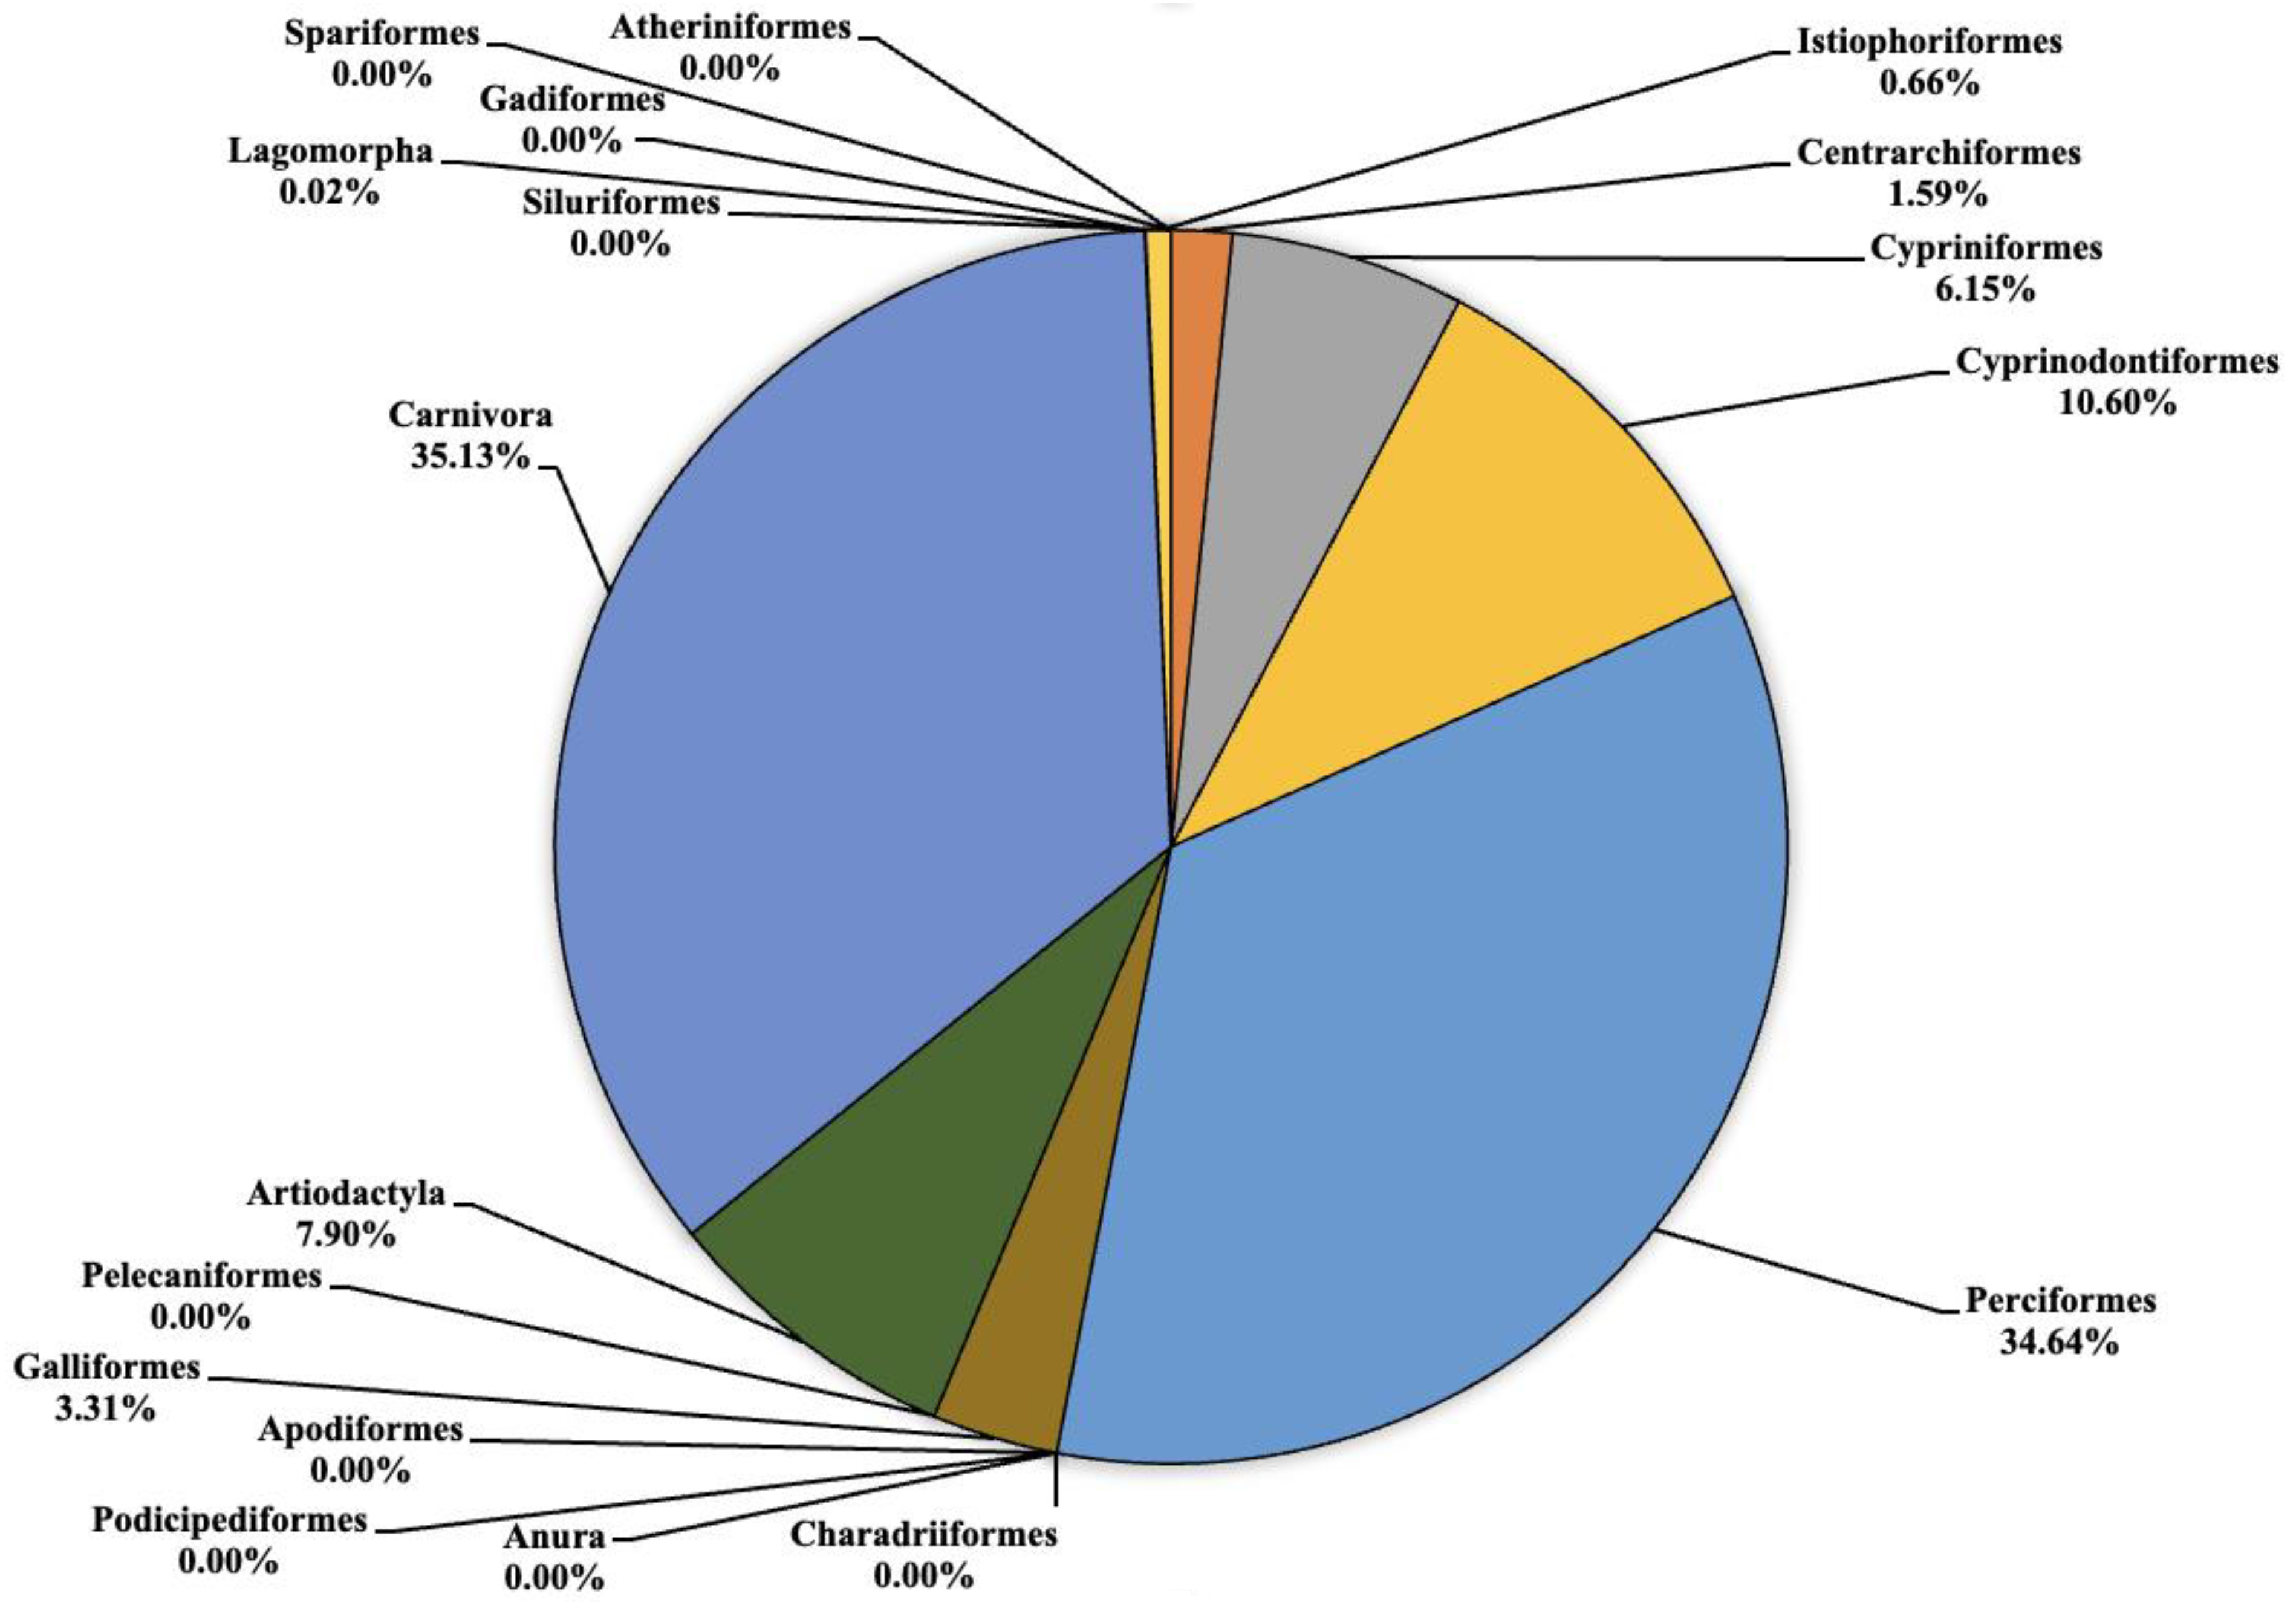
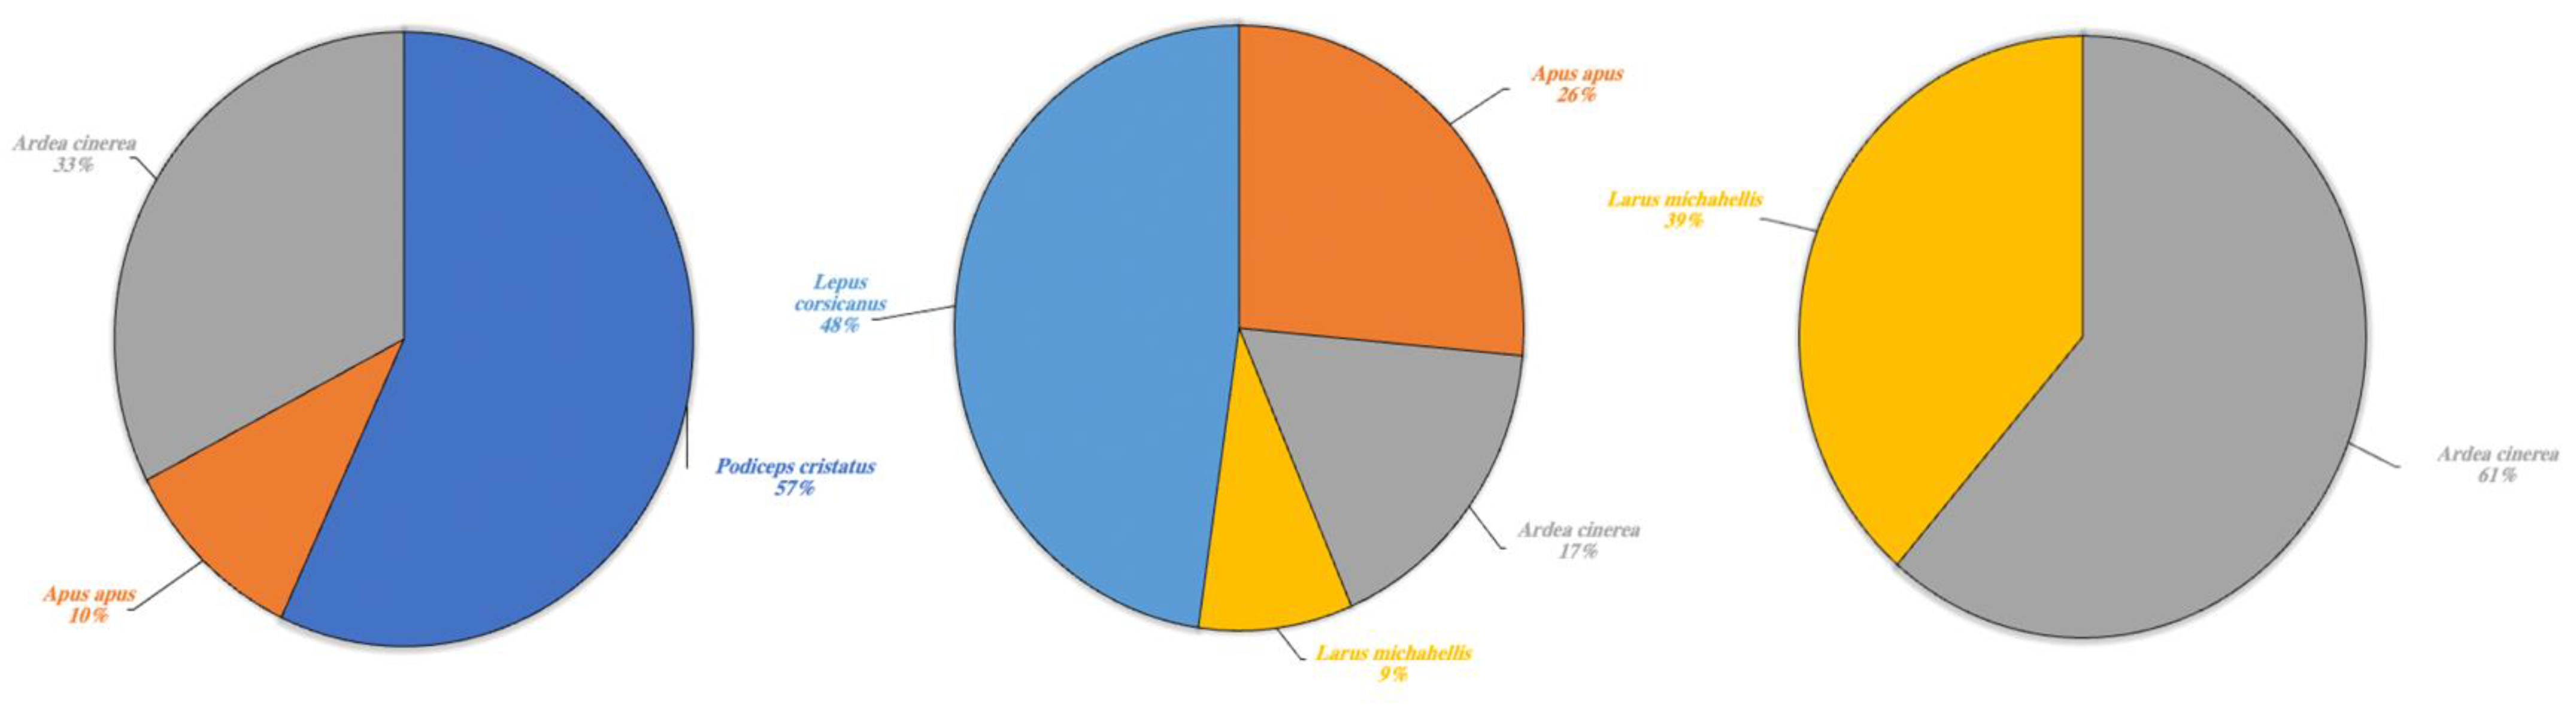
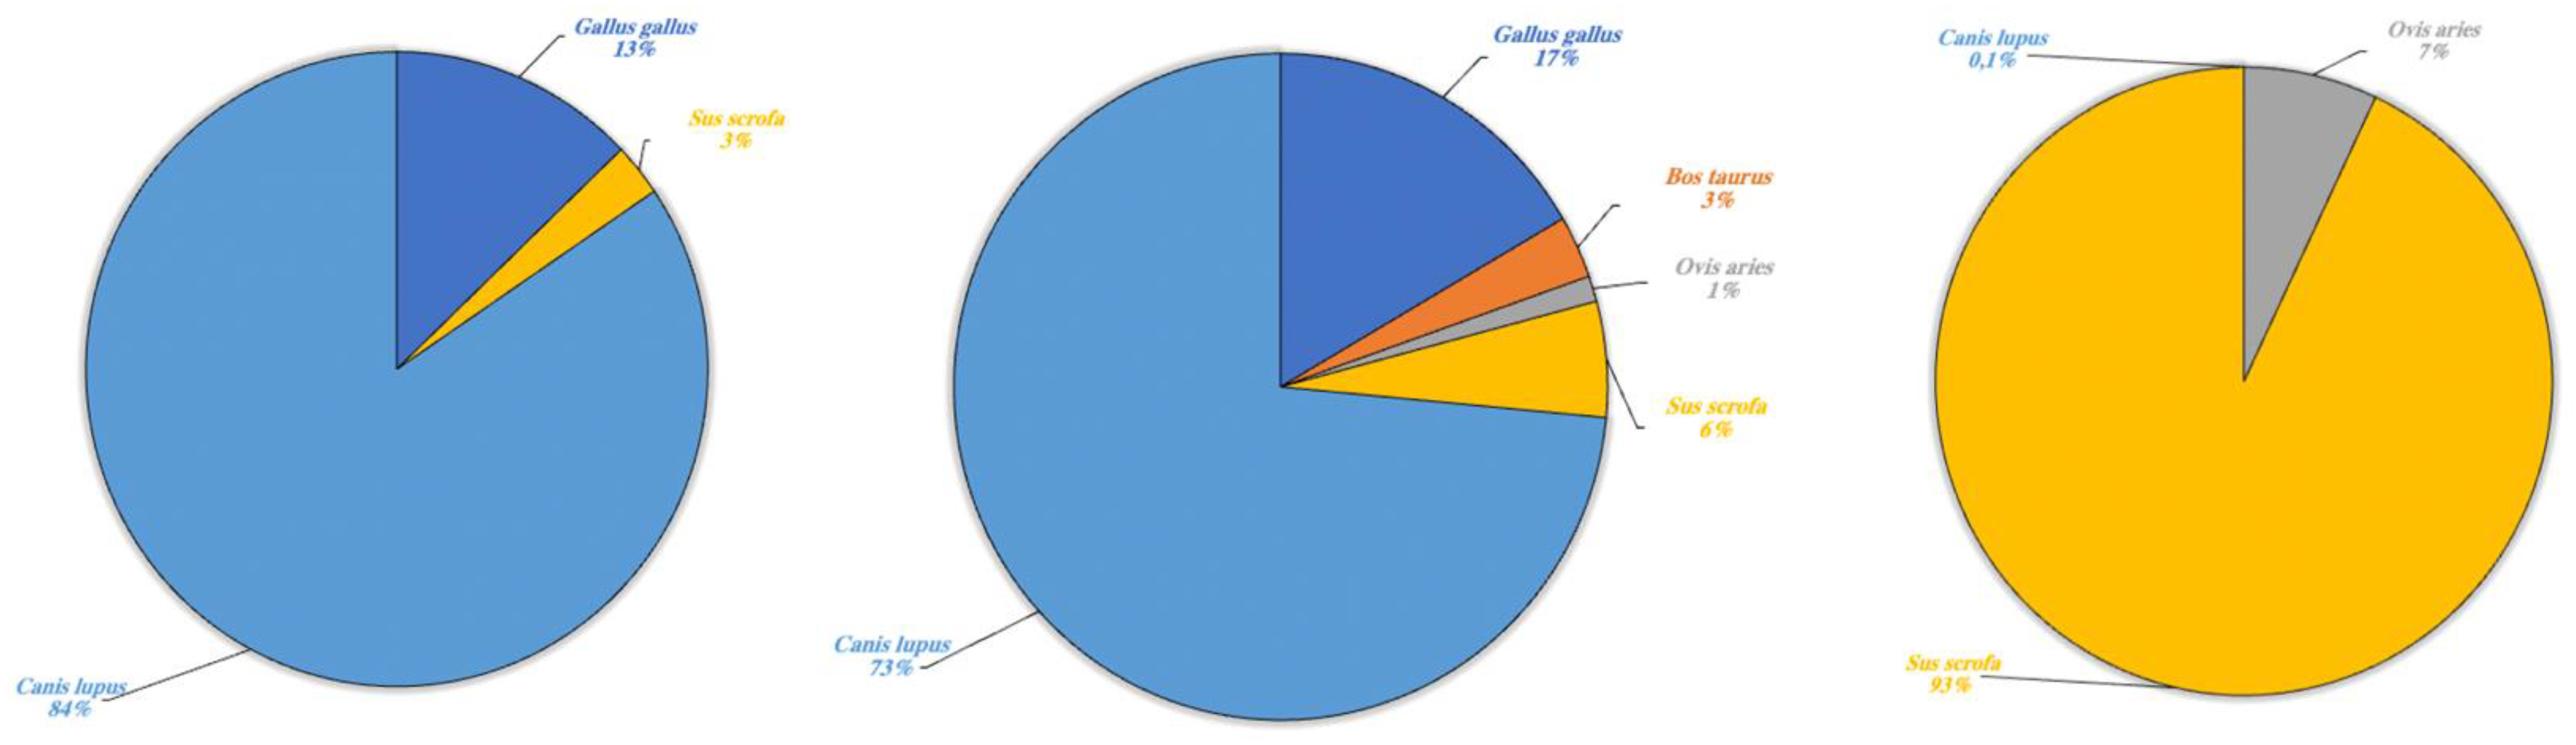
3. Results
4. Discussion
5. Conclusions
Author Contributions
Funding
Institutional Review Board Statement
Informed Consent Statement
Data Availability Statement
Acknowledgments
Conflicts of Interest
References
- Cardinale, B.J.; Duffy, J.E.; Gonzalez, A.; Hooper, D.U.; Perrings, C.; Venail, P.; Narwani, A.; Mace, G.M.; Tilman, D.; Wardle, D.A.; et al. Biodiversity loss and its impact on humanity. Nature 2012, 486, 59–67. [Google Scholar] [CrossRef]
- Little, C.J.; Altermatt, F. Landscape configuration alters spatial arrangement of terrestrial-aquatic subsidies in headwater streams. Landsc. Ecol. 2018, 33, 1519–1531. [Google Scholar] [CrossRef]
- Tonkin, J.D.; Altermatt, F.; Finn, D.S.; Heino, J.; Olden, J.D.; Pauls, S.U.; Lytle, D.A. The role of dispersal in river network metacommunities: Patterns, processes, and pathways. Freshw. Biol. 2018, 63, 141–163. [Google Scholar] [CrossRef]
- Shao, X.; Fang, Y.; Jawitz, J.W.; Yan, J.; Cui, B. River network connectivity and fish diversity. Sci. Total Environ. 2019, 689, 21–30. [Google Scholar] [CrossRef] [PubMed]
- Díaz, S.; Settele, J.; Brondízio, E.S.; Ngo, H.T.; Agard, J.; Arneth, A.; Balvanera, P.; Brauman, K.A.; Butchart, S.H.M.; Chan, K.M.A.; et al. Pervasive human-driven decline of life on Earth points to the need for transformative change. Science 2019, 366, eaax3100. [Google Scholar] [CrossRef] [PubMed]
- Tickner, D.; Opperman, J.J.; Abell, R.; Acreman, M.; Arthington, A.H.; Bunn, S.E.; Cooke, S.J.; Dalton, J.; Darwall, W.; Edwards, G.; et al. Bending the curve of global freshwater biodiversity loss: An emergency recovery plan. BioScience 2020, 70, 330–342. [Google Scholar] [CrossRef]
- Li, F.; Altermatt, F.; Yang, J.; An, S.; Li, A.; Zhang, X. Human activities’ fingerprint on multitrophic biodiversity and ecosystem functions across a major river catchment in China. Glob. Change Biol. 2020, 26, 6867–6879. [Google Scholar] [CrossRef]
- Best, J. Anthropogenic stresses on the world’s big rivers. Nat. Geosci. 2019, 12, 7–21. [Google Scholar] [CrossRef]
- Grill, G.; Lehner, B.; Thieme, M.; Geenen, B.; Tickner, D.; Antonelli, F.; Babu, S.; Borrelli, P.; Cheng, L.; Crochetiere, H.; et al. Mapping the world’s free-flowing rivers. Nature 2019, 569, 215–221. [Google Scholar] [CrossRef]
- Reid, A.J.; Carlson, A.K.; Creed, I.F.; Eliason, E.J.; Gell, P.A.; Johnson, P.T.J.; Kidd, K.A.; MacCormack, T.J.; Olden, J.D.; Ormerod, S.J.; et al. Emerging threats and persistent conservation challenges for freshwater biodiversity. Biol. Rev. 2019, 94, 849–873. [Google Scholar] [CrossRef]
- Belletti, B.; Garcia de Leaniz, C.; Jones, J.; Bizzi, S.; Börger, L.; Segura, G.; Castelletti, A.; van de Bund, W.; Aarestrup, K.; Barry, J.; et al. More than one million barriers fragment Europe’s rivers. Nature 2020, 588, 436–441. [Google Scholar] [CrossRef]
- Stets, E.G.; Sprague, L.A.; Oelsner, G.P.; Johnson, H.M.; Murphy, J.C.; Ryberg, K.; Vecchia, A.V.; Zuellig, R.E.; Falcone, J.A.; Riskin, M.L. Landscape drivers of dynamic change in water quality of US rivers. Environ. Sci. Technol. 2020, 54, 4336–4343. [Google Scholar] [CrossRef] [PubMed]
- McCann, K.S.; Cazelles, K.; MacDougall, A.S.; Fussmann, G.F.; Bieg, C.; Cristescu, M.; Fryxell, J.M.; Gellner, G.; Lapointe, B.; Gonzalez, A. Landscape modification and nutrient-driven instability at a distance. Ecol. Lett. 2021, 24, 398–414. [Google Scholar] [CrossRef] [PubMed]
- Aalipour, M.; Antczak, E.; Dostál, T.; Jabbarian Amiri, B. Influences of landscape configuration on river water quality. Forests 2022, 13, 222. [Google Scholar] [CrossRef]
- Chen, J.; McIlroy, S.E.; Archana, A.; Baker, D.M.; Panagiotou, G. A pollution gradient contributes to the taxonomic, functional, and resistome diversity of microbial communities in marine sediments. Microbiome 2019, 7, 104. [Google Scholar] [CrossRef] [PubMed]
- Finderup Nielsen, T.; Sand-Jensen, K.; Dornelas, M.; Bruun, H.H. More is less: Net gain in species richness, but biotic homogenization over 140 years. Ecol. Lett. 2019, 22, 1650–1657. [Google Scholar] [CrossRef]
- Wilkinson, C.L.; Yeo, D.C.; Tan, H.H.; Fikri, A.H.; Ewers, R.M. Land-use change is associated with a significant loss of freshwater fish species and functional richness in Sabah, Malaysia. Biol. Conserv. 2018, 222, 164–171. [Google Scholar] [CrossRef]
- Gounand, I.; Little, C.J.; Harvey, E.; Altermatt, F. Cross-ecosystem carbon flows connecting ecosystems worldwide. Nat. Commun. 2018, 9, 4825. [Google Scholar] [CrossRef]
- Marks, J.C. Revisiting the fates of dead leaves that fall into streams. Ann. Rev. Ecol. Evol. Syst. 2019, 50, 547–568. [Google Scholar] [CrossRef]
- Li, Y.; Geng, M.; Yu, J.; Du, Y.; Xu, M.; Zhang, W.; Wang, J.; Su, H.; Wang, R.; Chen, F. Eutrophication decrease compositional dissimilarity in freshwater plankton communities. Sci. Total Environ. 2022, 821, 153434. [Google Scholar] [CrossRef]
- Shu, W.; Wang, P.; Xu, Q.; Zeng, T.; Ding, M.; Nie, M.; Zhang, H.; Huang, G. Coupled effects of landscape structures and water chemistry on bacterioplankton communities at multi-spatial scales. Sci. Total Environ. 2022, 811, 151350. [Google Scholar] [CrossRef] [PubMed]
- Karr, J.R. Biological monitoring and environmental assessment: A conceptual framework. Environ. Manag. 1987, 11, 249–256. [Google Scholar] [CrossRef]
- Altermatt, F.; Little, C.J.; Maechler, E.; Wang, S.; Zhang, X.; Blackman, R.C. Uncovering the complete biodiversity structure in spatial networks: The example of riverine systems. Oikos 2020, 129, 607–618. [Google Scholar] [CrossRef]
- Deiner, K.; Fronhofer, E.A.; Mächler, E.; Walser, J.C.; Altermatt, F. Environmental DNA reveals that rivers are conveyer belts of biodiversity information. Nat. Commun. 2016, 7, 12544. [Google Scholar] [CrossRef] [PubMed]
- Taberlet, P.; Bonin, A.; Zinger, L.; Coissac, E. Environmental DNA: For Biodiversity Research and Monitoring; Oxford University Press: Oxford, UK, 2018. [Google Scholar]
- Li, X.; Liang, R.; Li, Y.; Zhang, Y.; Wang, Y.; Li, K. Microplastics in inland freshwater environments with different regional functions: A case study on the Chengdu Plain. Sci. Total Environ. 2021, 789, 147938. [Google Scholar] [CrossRef] [PubMed]
- Yang, J.; Zhang, X.; Xie, Y.; Song, C.; Zhang, Y.; Yu, H.; Burton, G.A. Zooplankton community profiling in a eutrophic freshwater ecosystem-lake tai basin by DNA metabarcoding. Sci. Rep. 2017, 7, 1773. [Google Scholar] [CrossRef] [PubMed]
- Xie, R.; Zhao, G.; Yang, J.; Wang, Z.; Xu, Y.; Zhang, X.; Wang, Z. eDNA metabarcoding revealed differential structures of aquatic communities in a dynamic freshwater ecosystem shaped by habitat heterogeneity. Environ. Res. 2021, 201, 111602. [Google Scholar] [CrossRef]
- Taberlet, P.; Coissac, E.; Hajibabaei, M.; Rieseberg, L.H. Environmental DNA. Mol. Ecol. 2012, 21, 1789–1793. [Google Scholar] [CrossRef]
- Hebert, P.D.N.; Gregory, T.R. The promise of DNA barcoding for taxonomy. Syst. Biol. 2005, 54, 852–859. [Google Scholar] [CrossRef]
- Hajibabaei, M.; Smith, M.A.; Janzen, D.H.; Rodriguez, J.J.; Whitfield, J.B.; Hebert, P.D. A minimalist barcode can identify a specimen whose DNA is degraded. Mol. Ecol. Notes 2006, 6, 959–964. [Google Scholar] [CrossRef]
- Haile, J.; Froese, D.G.; MacPhee, R.D.E.; Roberts, R.G.; Arnold, L.J.; Reyes, A.V.; Rasmussen, M.; Nielsen, R.; Brook, B.W.; Robinson, S.; et al. Ancient DNA reveals late survival of mammoth and horse in interior Alaska. Proc. Natl. Acad. Sci. USA 2009, 106, 22352–22357. [Google Scholar] [CrossRef] [PubMed]
- Anderson-Carpenter, L.L.; McLachlan, J.S.; Jackson, S.T.; Kuch, M.; Lumibao, C.Y.; Poinar, H.N. Ancient DNA from lake sediments: Bridging the gap between paleoecology and genetics. BMC Evol. Biol. 2011, 11, 30. [Google Scholar] [CrossRef] [PubMed]
- Jerde, C.L.; Mahon, A.R.; Chadderton, W.L.; Lodge, D.M. “Sight-unseen” detection of rare aquatic species using environmental DNA. Conserv. Lett. 2011, 4, 150–157. [Google Scholar] [CrossRef]
- Goldberg, C.S.; Pilliod, D.S.; Arkle, R.S.; Waits, L.P. Molecular detection of vertebrates in stream water: A demonstration using rocky mountain tailed frogs and IDAHO giant salamanders. PLoS ONE 2011, 6, e22746. [Google Scholar] [CrossRef] [PubMed]
- Hiiesalu, I.; Opik, M.; Metsis, M.; Lilje, L.; Davison, J.; Vasar, M.; Moora, M.; Zobel, M.; Wilson, S.D.; Partel, M. Plant species richness belowground: Higher richness and new patterns revealed by next-generation sequencing. Mol. Ecol. 2012, 21, 2004–2016. [Google Scholar] [CrossRef]
- Liu, T.; Zhang, A.N.; Wang, J.; Liu, S.; Jiang, X.; Dang, C.; Ma, T.; Liu, S.; Chen, Q.; Xie, S.; et al. Integrated biogeography of planktonic and sedimentary bacterial communities in the Yangtze River. Microbiome 2018, 6, 16. [Google Scholar] [CrossRef]
- Gweon, H.S.; Bowes, M.J.; Moorhouse, H.L.; Oliver, A.E.; Bailey, M.J.; Acreman, M.C.; Read, D.S. Contrasting community assembly processes structure lotic bacteria metacommunities along the river continuum. Environ. Microbiol. 2021, 23, 484–498. [Google Scholar] [CrossRef]
- Ji, F.; Han, D.; Yan, L.; Yan, S.; Zha, J.; Shen, J. Assessment of benthic invertebrate diversity and river ecological status along an urbanized gradient using environmental DNA metabarcoding and a traditional survey method. Sci. Total Environ. 2021, 806, 150587. [Google Scholar] [CrossRef]
- Wang, S.; Yan, Z.; Hänfling, B.; Zheng, X.; Wang, P.; Fan, J.; Li, J. Methodology of fish eDNA and its applications in ecology and environment. Sci. Total Environ. 2021, 755, 142622. [Google Scholar] [CrossRef]
- Zhang, S.; Zheng, Y.; Zhan, A.; Dong, C.; Zhao, J.; Yao, M. Environmental DNA captures native and non-native fish community variations across the lentic and lotic systems of a megacity. Sci. Adv. 2022, 8, eabk0097. [Google Scholar] [CrossRef]
- Thomsen, P.F.; Kielgast, J.; Iversen, L.L.; Møller, P.R.; Rasmussen, M.; Willerslev, E. Detection of a diverse marine fish fauna using environmental DNA from seawater samples. PLoS ONE 2012, 7, e41732. [Google Scholar] [CrossRef] [PubMed]
- Calvo, S.; Barone, R.; Naselli Flores, L.; Fradà Orestano, C.; Dongarrà, G.; Lugaro, A.; Genchi, G. Limnological studies on lake and reservoires of Sicily. Nat. Sicil. 1993, 17 (Suppl. S2), 3–292. [Google Scholar]
- Riaz, T.; Shehzad, W.; Viari, A.; Pompanon, F.; Taberlet, P.; Coissac, E. ecoPrimers: Inference of new DNA barcode markers from whole genome sequence analysis. Nucl. Acids Res. 2011, 39, e145. [Google Scholar] [CrossRef] [PubMed]
- Magoč, T.; Salzberg, S.L. FLASH: Fast length adjustment of short reads to improve genome assemblies. Bioinformatics 2011, 27, 2957–2963. [Google Scholar] [CrossRef]
- Martin, M. Cutadapt removes adapter sequences from high-throughput sequencing reads. EMBnet. J. 2011, 17, 10–12. [Google Scholar] [CrossRef]
- Del Fabbro, C.; Scalabrin, S.; Morgante, M.; Giorgi, F.M. An extensive evaluation of read trimming effects on Illumina NGS data analysis. PLoS ONE 2013, 8, e85024. [Google Scholar] [CrossRef]
- Caporaso, J.G.; Kuczynski, J.; Stombaugh, J.; Bittinger, K.; Bushman, F.D.; Costello, E.K.; Fierer, N.; Peña, A.G.; Goodrich, J.K.; Gordon, J.I.; et al. QIIME allows analysis of high-throughput community sequencing data. Nat. Methods 2010, 7, 335–336. [Google Scholar] [CrossRef]
- Rognes, T.; Flouri, T.; Nichols, B.; Quince, C.; Mahé, F. VSEARCH: A versatile open source tool for metagenomics. Peer J. 2016, 4, e2584. [Google Scholar] [CrossRef]
- Wang, Q.; Garrity, G.M.; Tiedje, J.M.; Cole, J.R. Naive Bayesian classifier for rapid assignment of rRNA sequences into the new bacterial taxonomy. Appl. Environ. Microbiol. 2007, 73, 5261–5267. [Google Scholar] [CrossRef]
- Sato, Y.; Miya, M.; Fukunaga, T.; Sado, T.; Iwasaki, W.; Kumar, S. MitoFish and MiFish Pipeline: A mitochondrial genome database of fish with an analysis pipeline for environmental DNA metabarcoding. Mol. Biol. Evol. 2018, 35, 1553. [Google Scholar] [CrossRef]
- Porter, T.M. terrimporter/12SvertebrateClassifier: 12S Vertebrate Classifier v2.0.0-ref (v2.0.0-ref) [Computer Software]. Zenodo. 2021. Available online: https://github.com/terrimporter/12SvertebrateClassifier (accessed on 20 November 2023).
- Golden, N.H.; Rattner, B.A. Ranking terrestrial vertebrate species for utility in biomonitoring and vulnerability to environmental contaminants. In Reviews of Environmental Contamination and Toxicology: Continuation of Residue Reviews; Springer: Berlin/Heidelberg, Germany, 2003; pp. 67–136. [Google Scholar]
- Vivien, R.; Wyler, S.; Lafont, M.; Pawlowski, J. Molecular barcoding of aquatic oligochaetes: Implications for biomonitoring. PLoS ONE 2015, 10, e0125485. [Google Scholar] [CrossRef] [PubMed]
- van Der Heyde, M.; Bunce, M.; Wardell-Johnson, G.; Fernandes, K.; White, N.E.; Nevill, P. Testing multiple substrates for terrestrial biodiversity monitoring using environmental DNA metabarcoding. Mol. Ecol. Resour. 2020, 20, 732–745. [Google Scholar] [CrossRef] [PubMed]
- Rodriguez-Ezpeleta, N.; Morissette, O.; Bean, C.W.; Manu, S.; Banerjee, P.; Lacoursière-Roussel, A.; Beng, K.C.; Alter, S.E.; Roger, F.; Holman, L.E.; et al. Trade-offs between reducing complex terminology and producing accurate interpretations from environmental DNA: Comment on “Environmental DNA: What’s behind the term?” by Pawlowski et al., (2020). Mol. Ecol. 2021, 30, 4601–4605. [Google Scholar] [CrossRef]
- Ogden, L.E. The emergence of eDNA: An interdisciplinary tool helps monitor biodiversity and health. BioScience 2022, 72, 5–12. [Google Scholar] [CrossRef] [PubMed]
- Vari, A. Atlante della Biodiversità della Sicilia: Vertebrati Terrestri; Arpa Sicilia: Palermo, Italy, 2008; Volume 6. [Google Scholar]
- Lo Valvo, M.; Massa, B.; Sarà, M. Uccelli e paesaggio in Sicilia alle soglie del terzo millennio. Nat. Sicil. 1993, 17, 1–376. [Google Scholar]
- Lo Valvo, M.; Faraone, F.P.; Giacalone, G.; Lillo, F. Fauna di Sicilia. Anfibi. In Monografie Naturalistiche; Edizioni Danaus: Palermo, Italy, 2017; Volume 5, 136p. [Google Scholar]
- Weigand, H.; Beermann, A.J.; Čiampor, F.; Costa, F.O.; Csabai, Z.; Duarte, S.; Geiger, M.F.; Grabowski, M.; Rimet, F.; Rulik, B.; et al. DNA barcode reference libraries for the monitoring of aquatic biota in Europe: Gap-analysis and recommendations for future work. Sci. Total Environ. 2019, 678, 499–524. [Google Scholar] [CrossRef]
- Specchia, V.; Francesco, Z.; Tzafesta, E.; Pinna, M. Gap Analysis for DNA Barcodes of Aquatic Macroinvertebrate Species in the Southeast of Italy. In ARPHA Conference Abstracts. 2021. Available online: https://iris.unisalento.it/handle/11587/450780 (accessed on 20 November 2023).
- Tzafesta, E.; Saccomanno, B.; Zangaro, F.; Vadrucci, M.R.; Specchia, V.; Pinna, M. DNA Barcode gap analysis for multiple marker genes for phytoplankton species biodiversity in mediterranean aquatic ecosystems. Biology 2022, 11, 1277. [Google Scholar] [CrossRef]
- Faraone, F.P.; Giacalone, G.; Lo Valvo, M. Dati preliminari sulla biometria, il cromatismo e la dieta di una popolazione di Natrix natrix della Sicilia occidentale. In Proceedings of the VIII Congresso Nazionale Societas Herpetologica Italica, Chieti, Italy, 22–26 September 2010; Di Tizio, L., Di Cerbo, A.R., Di Francesco, N., Cameli, A., Eds.; Ianieri Edizioni: Pescara, Italy, 2010; pp. 247–252. [Google Scholar]
- Lillo, F.; Marrone, F.; Sicilia, A.; Castelli, G.; Zava, B. An invasive population of Xenopus laevis (Daudin, 1802) in Italy. Herpetozoa 2005, 18, 63–64. [Google Scholar]
- Faraone, F.P.; Lillo, F.; Giacalone, G.; Lo Valvo, M. The large invasive population of Xenopus laevis in Sicily, Italy. Amphib. Reptial. 2008, 29, 405–412. [Google Scholar]
- Giacalone, G.; La Piana, F.; Lillo, F.; Lo Valvo, M. Analisi di contenuti stomacali di B. bufo: Considerazioni ecologiche e comportamentali. In Proceedings of the 6th Congresso Nazionale della Societas Herpetologica Italica, Roma, Italy, 27 September–1 October 2006; pp. 87–90. [Google Scholar]
- Siuda, W.; Chrost, R. Concentration and susceptibility of dissolved DNA for enzyme degradation in lake water-some methodological remarks. Aquat. Microb. Ecol. 2000, 21, 195–201. [Google Scholar] [CrossRef]
- Ficetola, G.F.; Miaud, C.; Pompanon, F.; Taberlet, P. Species detection using environmental DNA from water samples. Biol. Lett. 2008, 4, 423–425. [Google Scholar] [CrossRef] [PubMed]
- Foote, A.D.; Thomsen, P.F.; Sveegaard, S.; Wahlberg, M.; Kielgast, J.; Kyhn, L.A.; Salling, A.B.; Galatius, A.; Orlando, L.; Gilbert, M.T.P. Investigating the potential use of environmental DNA (eDNA) for genetic monitoring of marine mammals. PLoS ONE 2012, 7, e41781. [Google Scholar] [CrossRef]
- Thomsen, P.F.; Kielgast, J.; Iversen, L.L.; Wiuf, C.; Rasmussen, M.; Gilbert, M.T.P.; Orlando, L.; Willerslev, E. Monitoring endangered freshwater biodiversity using environmental DNA. Mol. Ecol. 2012, 21, 2565–2573. [Google Scholar] [CrossRef] [PubMed]
- Pilliod, D.S.; Goldberg, C.S.; Arkle, R.S.; Waits, L.P. Estimating occupancy and abundance of stream amphibians using environmental DNA from filtered water samples. Can. J. Fish. Aquat. Sci. 2013, 70, 1123–1130. [Google Scholar] [CrossRef]
- Pietramellara, G.; Ceccherini, M.T.; Ascher, J.; Nannipieri, P. Persistence of transgenic and not transgenic extracellular DNA in soil and bacterial transformation. Riv. Biol. Forum 2006, 99, 37–68. [Google Scholar]
- Singh, A.; Billingsley, K.; Ward, O. Composting: A potentially safe process for disposal of genetically modified organisms. Crit. Rev. Biotechnol. 2006, 26, 1–16. [Google Scholar] [CrossRef]
- Levy-Booth, D.J.; Campbell, R.G.; Gulden, R.H.; Hart, M.M.; Powell, J.R.; Klironomos, J.N.; Pauls, K.P.; Swanton, C.J.; Trevors, J.T.; Dunfield, K.E. Cycling of extracellular DNA in the soil environment. Soil Biol. Biochem. 2007, 39, 2977–2991. [Google Scholar] [CrossRef]
- Nielsen, K.M.; Johnsen, P.J.; Bensasson, D.; Daffonchio, D. Release and persistence of extracellular DNA in the environment. Environ. Biosaf. Res. 2007, 6, 37–53. [Google Scholar] [CrossRef]
- Pietramellara, G.; Ascher, J.; Borgogni, F.; Ceccherini, M.T.; Guerri, G.; Nannipieri, P. Extracellular DNA in soil and sediment: Fate and ecological relevance. Biol. Fertil. Soils 2009, 45, 219–235. [Google Scholar] [CrossRef]
- Barnes, M.A.; Turner, C.R.; Jerde, C.L.; Renshaw, M.A.; Chadderton, W.L.; Lodge, D.M. Environmental conditions influence eDNA persistence in aquatic systems. Environ. Sci. Technol. 2014, 48, 1819–1827. [Google Scholar] [CrossRef] [PubMed]
- Kreader, C.A. Persistence of PCR-detectable Bacteroides distasonis from human feces in river water. Appl. Environ. Microbiol. 1998, 64, 4103–4105. [Google Scholar] [CrossRef] [PubMed]
- Hofreiter, M.; Serre, D.; Poinar, H.N.; Kuch, M.; Pääbo, S. Ancient DNA. Nat. Rev. Genet. 2001, 2, 353–359. [Google Scholar] [CrossRef] [PubMed]
- Ravanat, J.; Douki, T.; Cadet, J. Direct and indirect effects of UV radiation on DNA and its components. J. Photochem. Photobiol. B 2001, 63, 88–102. [Google Scholar] [CrossRef] [PubMed]
- Rohland, N.; Hofreiter, M. Ancient DNA extraction from bones and teeth. Nat. Protoc. 2007, 2, 1756–1762. [Google Scholar] [CrossRef]
- Okabe, S.; Shimazu, Y. Persistence of host-specific Bacteroides prevotella 16S rRNA genetic markers in environmental waters: Effects of temperature and salinity. Appl. Microbiol. Biotechnol. 2007, 76, 935–944. [Google Scholar] [CrossRef]
- Borin, S.; Crotti, E.; Mapelli, F.; Tamagnini, I.; Corselli, C.; Daffonchio, D. DNA is preserved and maintains transforming potential after contact with brines of the deep anoxic hypersaline lakes of the Eastern Mediterranean Sea. Saline Syst. 2008, 4, 10. [Google Scholar] [CrossRef]
- Corinaldesi, C.; Beolchini, F.; Dell’Anno, A. Damage and degradation rates of extracellular DNA in marine sedime implications for the preservation of gene sequences. Mol. Ecol. 2008, 17, 3939–3951. [Google Scholar] [CrossRef]
- Potè, J.; Ackermann, R.; Wildi, W. Plant leaf mass loss and DNA release in freshwater sediments. Ecotoxicol. Environ. Saf. 2009, 72, 1378–1383. [Google Scholar] [CrossRef]
- Dick, L.K.; Stelzer, E.A.; Bertke, E.E.; Fong, D.L.; Stoeckel, D.M. Relative decay of Bacteroidales microbial source tracking markers and cultivated Escherichia coli in freshwater microcosms. Appl. Environ. Microbiol. 2010, 76, 3255–3262. [Google Scholar] [CrossRef]
- Green, H.C.; Shanks, O.C.; Sivaganesan, M.; Haugland, R.A.; Field, K.G. Differential decay of human faecal Bacteroides in marine and freshwater. Environ. Microbiol. 2011, 13, 3235–3249. [Google Scholar] [CrossRef]
- Fu, X.H.; Wang, L.; Le, Y.Q.; Hu, J.J. Persistence and renaturation efficiency of thermally treated waste recombinant DNA in defined aquatic microcosms. J. Environ. Sci. Health Part A Toxic 2012, 47, 1975–1983. [Google Scholar] [CrossRef] [PubMed]
- Dove, N.C.; Barnes, M.E.; Moreland, K.; Graham, R.C.; Berhe, A.A.; Hart, S.C. Depth dependence of climatic controls on soil microbial community activity and composition. ISME Commun. 2021, 1, 78. [Google Scholar] [CrossRef] [PubMed]
- So, K.Y.K.; Fong, J.J.; Lam, I.P.Y.; Dudgeon, D. Pitfalls during in silico prediction of primer specificity for eDNA surveillance. Ecosphere 2020, 11, e03193. [Google Scholar] [CrossRef]
- Zhang, S.; Zhao, J.; Yao, M. A comprehensive and comparative evaluation of primers for metabarcoding eDNA from fish. Methods Ecol. Evol. 2020, 11, 1609–1625. [Google Scholar] [CrossRef]
- Fouhy, F.; Clooney, A.G.; Stanton, C.; Claesson, M.J.; Cotter, P.D. 16S rRNA gene sequencing of mock microbial populations-impact of DNA extraction method, primer choice and sequencing platform. BMC Microbiol. 2016, 16, 123. [Google Scholar] [CrossRef]
- Bagley, M.; Pilgrim, E.; Knapp, M.; Yoder, C.; Santo Domingo, J.; Banerji, A. High-throughput environmental DNA analysis informs a biological assessment of an urban stream. Ecol. Indic. 2019, 104, 378–389. [Google Scholar] [CrossRef]
- Stat, M.; John, J.; Di Battista, J.D.; Newman, S.J.; Bunce, M.; Harvey, E.S. Combined use of eDNA metabarcoding and video surveillance for the assessment of fish biodiversity. Conserv. Biol. 2019, 33, 196–205. [Google Scholar] [CrossRef]
- Kress, W.J.; Garcia-Robledo, C.; Uriarte, M.; Erickson, D.L. DNA barcodes for ecology, evolution, and conservation. Trends Ecol. Evol. 2015, 30, 25–35. [Google Scholar] [CrossRef]
- Xia, Z.; Zhan, A.; Gao, Y.; Zhang, L.; Haffner, G.D.; MacIsaac, H.J. Early detection of a highly invasive bivalve based on environmental DNA (eDNA). Biol. Invasions 2018, 20, 437–447. [Google Scholar] [CrossRef]
- Bylemans, J.; Furlan, E.M.; Gleeson, D.M.; Hardy, C.M.; Duncan, R.P. Does size matter? An experimental evaluation of the relative abundance and decay rates of aquatic environmental DNA. Environ. Sci. Technol. 2018, 52, 6408–6416. [Google Scholar] [CrossRef]
- Polanco, F.A.; Richards, E.; Flück, B.; Valentini, A.; Altermatt, F.; Brosse, S.; Walser, J.C.; Eme, D.; Marques, V.; Manel, S.; et al. Comparing the performance of 12S mitochondrial primers for fish environmental DNA across ecosystems. Environ. DNA 2021, 3, 1113–1127. [Google Scholar] [CrossRef]
- Wen, Y.; Schoups, G.; Van De Giesen, N. Organic pollution of rivers: Combined threats of urbanization, livestock farming and global climate change. Sci. Rep. 2017, 7, 43289. [Google Scholar] [CrossRef] [PubMed]
- Tullo, E.; Finzi, A.; Guarino, M. Environmental impact of livestock farming and Precision Livestock Farming as a mitigation strategy. Sci. Total Environ. 2019, 650, 2751–2760. [Google Scholar] [CrossRef] [PubMed]
- Patarón, E.R.O.; Guambo, V.M.V.; Orozco, E.G.; Casco, E.R.G. Anthropic activities and risks of contamination due to the emission of liquid waste in agriculture. Ann. For. Res. 2023, 66, 2936–2945. [Google Scholar]
- Dodds, W.K.; Perkin, J.S.; Gerken, J.E. Human impact on freshwater ecosystem services: A global perspective. Environ. Sci. Technol. 2013, 47, 9061–9068. [Google Scholar] [CrossRef]
- Häder, D.P.; Banaszak, A.T.; Villafañe, V.E.; Narvarte, M.A.; González, R.A.; Helbling, E.W. Anthropogenic pollution of aquatic ecosystems: Emerging problems with global implications. Sci. Total Environ. 2020, 713, 136586. [Google Scholar] [CrossRef]
- Goldberg, C.S.; Turner, C.R.; Deiner, K.; Klymus, K.E.; Thomsen, P.F.; Murphy, M.A.; Spear, S.F.; McKee, A.; Oyler-McCance, S.J.; Cornman, R.S.; et al. Critical considerations for the application of environmental DNA methods to detect aquatic species. Methods Ecol. Evol. 2016, 7, 1299–1307. [Google Scholar] [CrossRef]


| Piana | Poma | Scanzano | |
|---|---|---|---|
| 22.1 Small artificial reservoirs without or poor in vegetation (Phragmitio-Magnocaricetea) | 0.5 | 3.1 | 2.1 |
| 31.81 Forest edge shrub communities (Rhamno-Prunetea, Prunetalia spinosae) | 15.6 | 0.0 | 1.0 |
| 31.8A Sub-Mediterranean thermophilic shrublands with Rubus ulmifolius | 0.0 | 0.9 | 0.0 |
| 32.211 Low maquis with Pistacia lentiscus and/or Olea europaea var. sylvestris | 0.0 | 1.7 | 0.0 |
| 32.215 Shrub communities with Calicotome villosa and/or C. infesta | 0.0 | 2.1 | 0.0 |
| 32.22 Euphorbia dendroides scrub (Oleo-Euphorbietum dendroidis s.l.) | 11.4 | 0.0 | 0.0 |
| 32.A Spartium junceum shrublands | 3.9 | 0.0 | 2.9 |
| 34.36 Mediterranean and sub-Mediterranean thermo-xerophilous pastures | 63.2 | 0.0 | 3.3 |
| 34.5 Annual Mediterranean dry meadows (Thero-Brachypodietea) | 0.0 | 157.3 | 0.0 |
| 34.6 Grasslands with perennial species (Lygeo-Stipetea) | 0.0 | 24.5 | 19.2 |
| 34.633 Ampelodesmos mauritanicus grasslands (Lygeo-Stipetea, Avenulo-Ampelodesmion mauritanici) | 91.7 | 13.1 | 29.4 |
| 34.74 Dry meadows of the central and southern Apennines | 14.3 | 0.0 | 0.0 |
| 34.81 Sub-nitrophilous dry meadows with post-cultured vegetation (Brometalia rubenti-tectori) | 62.2 | 50.3 | 29.6 |
| 38.11 Mesophilous grasslands with Cynosurus cristatus and Lolium perenne (Cirsetalia vallis- demonis) | 56.0 | 0.0 | 0.4 |
| 41.732 Deciduous oak forests of the Quercus pubescens cycle (Quercetalia ilicis) | 25.1 | 9.6 | 188.4 |
| 44.1273 Salix pedicellata woodlands (Populetalia albae) | 16.7 | 9.0 | 8.1 |
| 44.614 Populus alba woodland (Populetalia albae) | 1.5 | 0.4 | 5.9 |
| 45.215 Quercus suber woods (Erico-Quercion ilicis) | 0.0 | 0.0 | 11.3 |
| 45.31A Woods with Quercus ilex (Quercetalia ilicis) | 3.9 | 0.0 | 0.0 |
| 53.11 Phragmites australis hygro-hydrophilic communities (Phragmition) | 37.4 | 0.0 | 28.2 |
| 53.62 Arundo donax hygrophilous community (Arundini-Convolvuletum sepium) | 0.0 | 9.7 | 0.0 |
| 61.3B Glareicolous communities of thermophilic breccias (Euphorbion rigidae) | 6.6 | 0.0 | 0.0 |
| 62.14 Calcareous cliff vascular communities (Dianthion rupicolae, Polypodion serrati) | 8.1 | 0.0 | 0.5 |
| 82.12 Open field horticulture | 0.0 | 1.0 | 0.0 |
| 82.3 Arable land and extensive herbaceous crops | 597.0 | 400.7 | 339.2 |
| 82.3A Complex agricultural systems | 151.9 | 19.1 | 14.1 |
| 83.112 Intensive olive groves | 17.6 | 48.0 | 5.5 |
| 83.15 Orchards | 14.9 | 39.6 | 14.7 |
| 83.16 Citrus groves | 0.0 | 37.4 | 0.0 |
| 83.211 Associated vineyards (with olive groves, etc.) | 0.0 | 0.0 | 0.6 |
| 83.212 Intensive vineyards | 14.8 | 377.3 | 89.2 |
| 83.31 Reforestation mainly of conifers (genera Pinus, Cupressus, Cedrus, etc.) | 82.9 | 15.5 | 10.8 |
| 83,322 Reforestation with a prevalence of Eucalyptus sp. pl. | 35.8 | 29.1 | 72.4 |
| 83.325 Other reforestation or hardwood plantations | 0.0 | 0.0 | 29.7 |
| 85.5 Recreational and sports areas | 0.0 | 2.3 | 0.0 |
| 85.6 Cemeteries | 1.6 | 0.0 | 0.0 |
| 86.12 Sparse residential fabric | 2.3 | 0.0 | 1.2 |
| 86.22 Rural buildings | 5.7 | 1.0 | 2.5 |
| 86.31 Industrial and/or craft and/or commercial settlements and associated spaces | 17.9 | 2.6 | 9.1 |
| 86.32 Establishment of large service facilities | 2.3 | 4.8 | 5.2 |
| 86.41 Quarries | 5.5 | 4.9 | 0.0 |
| 86.42 Vegetation of ruderal areas and landfills | 0.0 | 4.9 | 0.0 |
| 86.43 Main road arteries | 2.4 | 0.0 | 8.6 |
| Poma | Piana | Scanzano | |
|---|---|---|---|
| Actinopteri; Atheriniformes | 261.5 | - | - |
| Actinopteri; Centrarchiformes | 716 | - | 128 |
| Actinopteri; Cypriniformes | - | 1653.3 | 495 |
| Actinopteri; Cyprinodontiformes | 0.5 | 225 | 853.5 |
| Actinopteri; Perciformes | 529.5 | 1642.3 | 2789 |
| Amphibia; Anura | - | 1.7 | - |
| Aves; Podicipediformes | 37.5 | - | - |
| Aves; Apodiformes | 10.5 | 42.3 | - |
| Aves; Charadriiformes | 2 | 14 | - |
| Aves; Galliformes | 540.5 | 1003 | 266.5 |
| Aves; Pelecaniformes | 65.5 | 54.7 | - |
| Mammalia; Artiodactyla | 153.5 | 473.3 | 636.5 |
| Mammalia; Carnivora | 4814 | 4572.7 | 2829 |
| Mammalia; Lagomorpha | - | 152.7 | 2 |
| Actinopteri; Gadiformes | - | 56.7 | - |
| Actinopteri; Istiophoriformes | - | 88.3 | 53 |
| Actinopteri; Siluriformes | 88 | - | - |
| Actinopteri; Spariformes | 28 | 30.7 | - |
| Total cleaned frequencies | 7247 | 10,010.7 | 8052.5 |
| Poma | Piana | Scanzano | |
|---|---|---|---|
| Wild aquatic species (sensu strictu) | |||
| Atherina boyeri | 261.5 | - | 9 |
| Micropterus salmoides | 716 | - | 295 |
| Carassius auratus | - | - | 942 |
| Cyprinus carpio | - | 1653.3 | 2 |
| Gambusia holbrooki | 1 | 225 | - |
| Perca fluvialis | 529.5 | 1642 | - |
| Ameirus melas | 176 | - | - |
| Discoglossus pictus | - | 5 | - |
| Total cleaned frequencies | 1684 | 3520.3 | 1248 |
| Other wild species | |||
| Podiceps cristatus | 114.5 | - | - |
| Apus apus | 21 | 127 | - |
| Ardea cinerea | 65.5 | 82 | 846 |
| Larus michahellis | - | 42 | 533 |
| Lepus corsicanus | - | 229 | - |
| Total cleaned frequencies | 201 | 480 | 1379 |
| Domestic terrestrial species | |||
| Gallus gallus | 731 | 1031 | - |
| Bos taurus | - | 189 | - |
| Ovis aries | - | 77.5 | 427 |
| Sus scrofa | 153.5 | 349 | 5658 |
| Canis lupus | 4814 | 4572.7 | 4 |
| Total cleaned frequencies | 5698.5 | 6219.2 | 6089 |
| Marine species | |||
| Diplodus puntazzo | 84 | - | - |
| Merluccius merluccius | - | 170 | 106 |
| Xiphias gladius | - | 132.5 | 5575 |
| Spicara maena | - | 92 | - |
| Total cleaned frequencies | 84 | 394.5 | 5681 |
| Sorensen | Poma | Piana | Scanzano |
|---|---|---|---|
| POMA | 1.00 | ||
| PIANA | 0.50 | 1.00 | |
| SCANZANO | 0.43 | 0.43 | 1.00 |
| Bray–Curtis | |||
| POMA | 1.00 | ||
| PIANA | 0.37 | 1.00 | |
| SCANZANO | 0.37 | 0.27 | 1.00 |
| Morisita | |||
| POMA | 1.00 | ||
| PIANA | 0.40 | 1.00 | |
| SCANZANO | 0.43 | 0.31 | 1.00 |
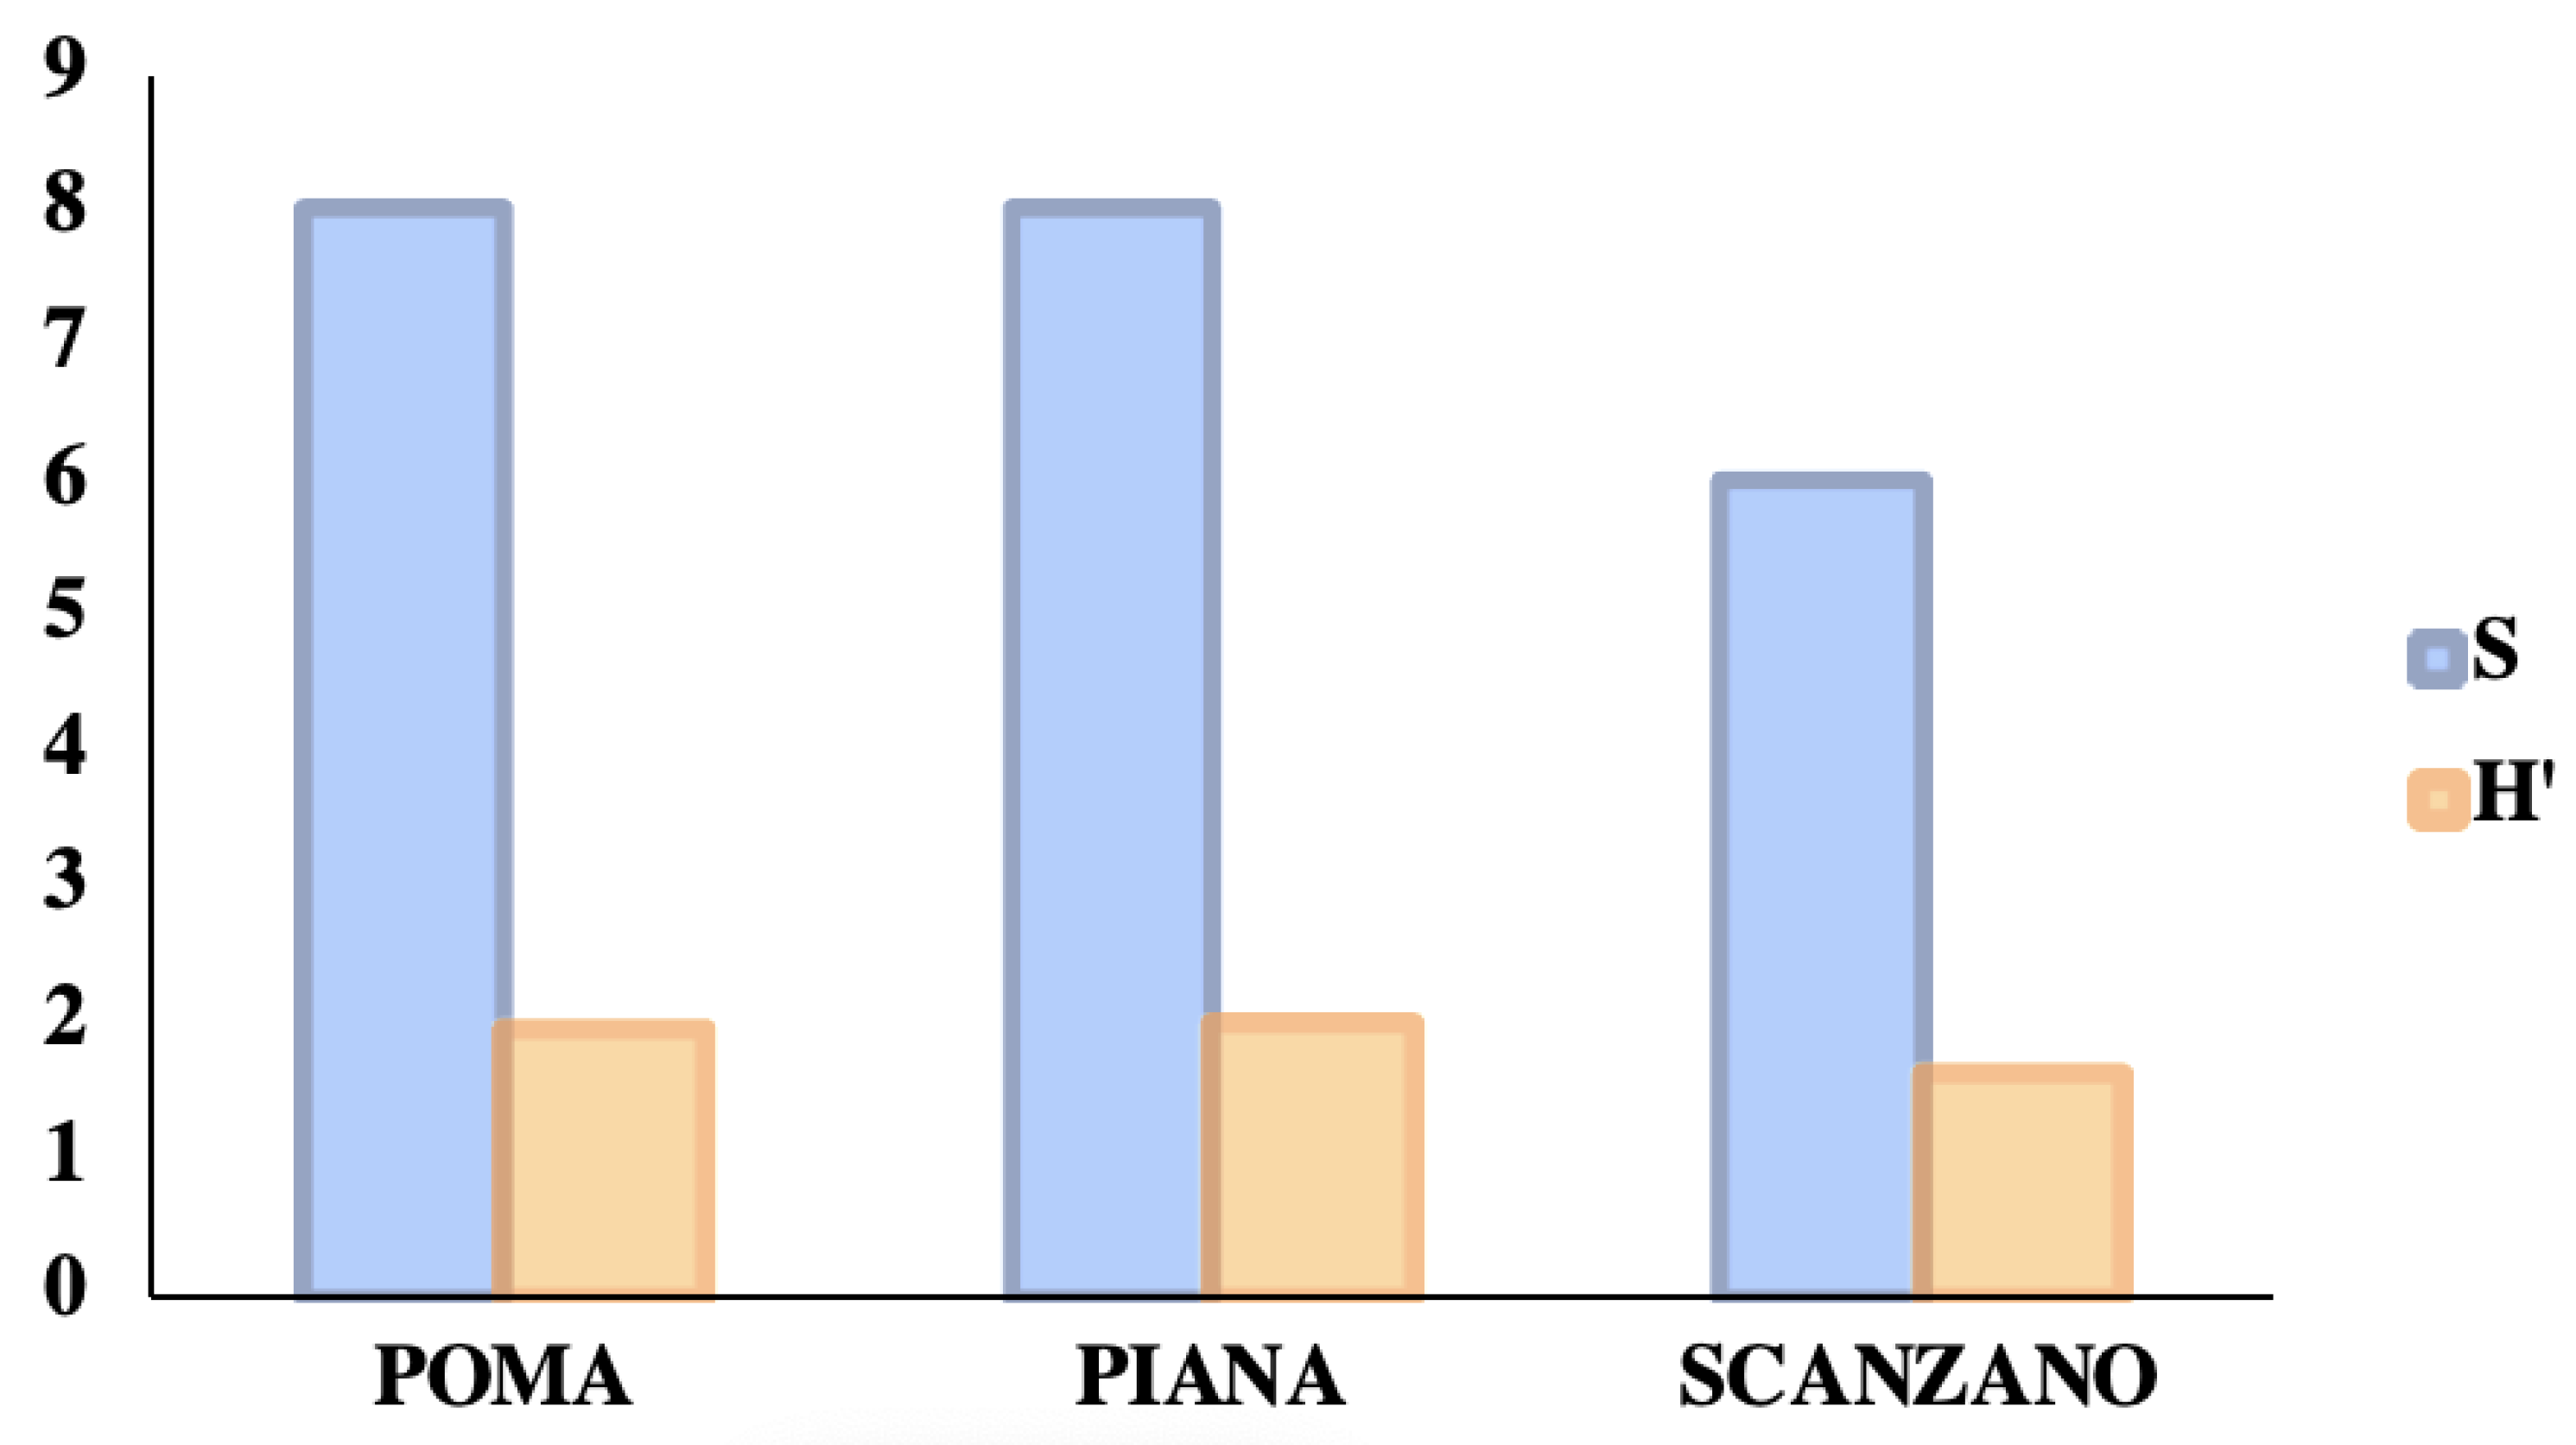
| Piana | Poma | Scanzano | |
|---|---|---|---|
| S | 30 | 27 | 28 |
| Shannon_H | 2.234 | 2.034 | 2.192 |
| Sorensen | Piana | Poma | Scanzano |
|---|---|---|---|
| PIANA | 1.00 | ||
| POMA | 0.60 | 1.00 | |
| SCANZANO | 0.83 | 0.62 | 1.00 |
| Bray–Curtis | |||
| PIANA | 1.00 | ||
| POMA | 0.46 | 1.00 | |
| SCANZANO | 0.51 | 0.54 | 1.00 |
| Morisita | |||
| PIANA | 1.00 | ||
| POMA | 0.69 | 1.00 | |
| SCANZANO | 0.84 | 0.74 | 1.00 |
Disclaimer/Publisher’s Note: The statements, opinions and data contained in all publications are solely those of the individual author(s) and contributor(s) and not of MDPI and/or the editor(s). MDPI and/or the editor(s) disclaim responsibility for any injury to people or property resulting from any ideas, methods, instructions or products referred to in the content. |
© 2023 by the authors. Licensee MDPI, Basel, Switzerland. This article is an open access article distributed under the terms and conditions of the Creative Commons Attribution (CC BY) license (https://creativecommons.org/licenses/by/4.0/).
Share and Cite
Mauro, M.; Lo Valvo, M.; Vazzana, M.; Radovic, S.; Vizzini, A.; Badalamenti, R.; Hornsby, L.B.; Arizza, V. Environmental DNA: The First Snapshot of the Vertebrate Biodiversity in Three Sicilian Lakes. Animals 2023, 13, 3687. https://doi.org/10.3390/ani13233687
Mauro M, Lo Valvo M, Vazzana M, Radovic S, Vizzini A, Badalamenti R, Hornsby LB, Arizza V. Environmental DNA: The First Snapshot of the Vertebrate Biodiversity in Three Sicilian Lakes. Animals. 2023; 13(23):3687. https://doi.org/10.3390/ani13233687
Chicago/Turabian StyleMauro, Manuela, Mario Lo Valvo, Mirella Vazzana, Slobodanka Radovic, Aiti Vizzini, Rosario Badalamenti, Lucie Branwen Hornsby, and Vincenzo Arizza. 2023. "Environmental DNA: The First Snapshot of the Vertebrate Biodiversity in Three Sicilian Lakes" Animals 13, no. 23: 3687. https://doi.org/10.3390/ani13233687
APA StyleMauro, M., Lo Valvo, M., Vazzana, M., Radovic, S., Vizzini, A., Badalamenti, R., Hornsby, L. B., & Arizza, V. (2023). Environmental DNA: The First Snapshot of the Vertebrate Biodiversity in Three Sicilian Lakes. Animals, 13(23), 3687. https://doi.org/10.3390/ani13233687