Article

Quantitative Associations between Season, Month, and Temperature-Humidity Index with Milk Yield, Composition, Somatic Cell Counts, and Microbial Load: A Comprehensive Study across Ten Dairy Farms over an Annual Cycle

by
Mostafa Bokharaeian
1,
Abdolhakim Toghdory
1,
Taghi Ghoorchi
1,
Jalil Ghassemi Nejad
2,* and
Iman Janghorban Esfahani
3,*
1
Department of Animal and Poultry Nutrition, Animal Science Faculty, Gorgan University of Agricultural Science and Natural Resources, Gorgan 49189-43464, Iran
2
Department of Animal Science and Technology, Sanghuh College of Life Sciences, Konkuk University, Seoul 05029, Republic of Korea
3
Glopex Co., Ltd., R&D Center, GeumGang Penterium IX Tower A2801, Dongtancheomdansaneop 1-ro 27, Hwaseong-si 18469, Gyeonggi-do, Republic of Korea
*
Authors to whom correspondence should be addressed.
Animals 2023, 13(20), 3205; https://doi.org/10.3390/ani13203205
Submission received: 18 September 2023 / Revised: 9 October 2023 / Accepted: 10 October 2023 / Published: 13 October 2023
(This article belongs to the Section Animal System and Management)

Abstract

:

Simple Summary

This comprehensive study focused on dairy farms in northeastern Iran to investigate how changing seasons, months, and temperature–humidity index (THI) affect milk production and quality. Data from ten randomly selected dairy herds were collected, including daily milk production records and milk samples for analysis. The study closely examined the influence of season, month, and THI on milk yield, quality, and cow health. Our findings revealed that winter had the highest milk yield, fat, protein, solids-not-fat (SNF), and pH levels, while somatic cell counts (SCC) and total bacterial counts (TBC) were the lowest during this season. The highest values for milk yield, fat, and pH occurred in January, and March showed the highest protein and SNF levels. December had the lowest SCC and TBC values. Our results emphasize the significant impact of THI on milk production and quality, providing valuable insights for effective dairy management, especially in the face of climate change challenges.

Abstract

This current study addresses the knowledge gap regarding the influence of seasons, months, and THI on milk yield, composition, somatic cell counts (SCC), and total bacterial counts (TBC) of dairy farms in northeastern regions of Iran. For this purpose, ten dairy herds were randomly chosen, and daily milk production records were obtained. Milk samples were systematically collected from individual herds upon delivery to the dairy processing facility for subsequent analysis, including fat, protein, solids-not-fat (SNF), pH, SCC, and TBC. The effects of seasons, months, and THI on milk yield, composition, SCC, and TBC were assessed using an analysis of variance. To account for these effects, a mixed-effects model was utilized with a restricted maximum likelihood approach, treating month and THI as fixed factors. Our investigation revealed noteworthy correlations between key milk parameters and seasonal, monthly, and THI variations. Winter showed the highest milk yield, fat, protein, SNF, and pH (p < 0.01), whereas both SCC and TBC reached their lowest values in winter (p < 0.01). The highest values for milk yield, fat, and pH were recorded in January (p < 0.01), while the highest protein and SNF levels were observed in March (p < 0.01). December marked the lowest SCC and TBC values (p < 0.01). Across the THI spectrum, spanning from −3.6 to 37.7, distinct trends were evident. Quadratic regression models accounted for 34.59%, 21.33%, 4.78%, 20.22%, 1.34%, 15.42%, and 13.16% of the variance in milk yield, fat, protein, SNF, pH, SCC, and TBC, respectively. In conclusion, our findings underscore the significant impact of THI on milk production, composition, SCC, and TBC, offering valuable insights for dairy management strategies. In the face of persistent challenges posed by climate change, these results provide crucial guidance for enhancing production efficiency and upholding milk quality standards.

1. Introduction

The dairy industry plays a pivotal role in global agriculture, serving as a primary source of essential nutrition and contributing significantly to economies worldwide [1]. The efficiency and sustainability of dairy production are, however, challenged by a wide range of factors, including climatic changes, which have gained increasing attention due to their profound effects on livestock health and productivity [2]. Among these climatic factors, temperature and humidity levels are key determinants of environmental stressors faced by dairy cattle [3]. As the world experiences shifts in climate patterns and more frequent extreme weather events, understanding the implications of these changes on dairy cattle is of paramount importance.
The temperature–humidity index (THI), a composite measure that takes into account both temperature and humidity, has long been acknowledged as a crucial indicator of thermal stress in livestock. It is derived from air temperature and relative humidity and serves as a comprehensive measure, reflecting the cumulative impact of external factors on the animal’s performance [4,5,6,7,8]. With rising global temperatures and increasing instances of heatwaves, the prevalence of heat stress in dairy cattle is on the rise, necessitating a thorough investigation into its multifaceted impacts on milk quality and udder health.
Changes in milk production and quality, alongside somatic cell counts (SCC) and total bacterial count (TBC), stemming from unfavorable environmental conditions such as heat stress, can yield significant economic consequences for both dairy farmers and processors [9,10,11,12]. Understanding the dynamics of these changes and their underlying mechanisms is essential for developing strategies to maintain milk quality and enhance the overall sustainability of dairy production. Milk quality principally concerns levels of milk fat, protein, and solids-not-fat (SNF). Any undesirable changes in these components result in reduced milk quality [13,14]. Unfavorable environmental conditions are documented to have adverse effects on the body’s metabolism, resulting in reductions in both milk production and quality in lactating animals [15,16,17,18]. These conditions, such as high temperatures, can particularly impact levels of milk fat and protein, making them susceptible to significant fluctuations during seasonal transitions [14,19]. Peana et al. [20] in their previous research have also indicated that elevated temperatures induce variations in milk composition in dairy cows. Somatic cells, as part of the animal’s immune system, play a vital role in safeguarding the mammary glands from infection, making the SCC a key factor in udder health [13,14]. Various factors, including management practices, animal health, milk production levels, stage of lactation, and a range of individual and environmental factors, can influence the milk SCC [21]. In particular, high milk-producing cows, due to the stress of milk production, may experience reduced immunity, resulting in elevated SCC levels in their milk [22]. In a study by M’Hamdi et al. [23], it was observed that the SCC exhibited an increase at high THI levels while decreasing at low THI levels. Additionally, according to Godden et al. [24], elevated heat and humidity levels were found to escalate the pathogen load in the environment, leading to a higher incidence of mastitis and an increased microbial load.
Climate change is suggested to influence milk microbial counts through both direct and indirect mechanisms. Directly, factors such as the THI, which is regarded as the most accurate representation, play an essential role in shifting the milk microbial load [25,26,27]. Moreover, the indirect impact of climate change on milk microbial counts arises from the induction of heat stress in dairy cattle, heightening their vulnerability to pathogenic microbes [28,29].
The current study aims to address the shortage of knowledge concerning the impact of seasons, months, and the THI on milk yield, composition, SCC, and TBC in Iranian dairy farms, mainly in the northeastern regions. Recognizing the significant challenges faced by dairy farmers in maintaining both milk quantity and quality, this research seeks to investigate the effects of environmental factors such as temperature and humidity, encapsulated by THI. Spanning a full annual cycle across ten diverse dairy farms, the hypothesis of the current study was to investigate whether there are intricate relationships between THI and critical parameters such as milk yield, milk fat content, milk protein levels, SNF, SCC, and TBC. This holistic approach promises to provide valuable insights into the complex interactions between environmental conditions, animal health, and milk quality, offering a foundation for more informed and efficient dairy farm management practices.

2. Materials and Methods

2.1. Experimental Farm Conditions

This study was carried out on ten distinct dairy herds in the northeastern region of Iran (Gonbad-e-Qabus, Golestan, Iran) from January 2021 to January 2022. This region of the country is known for having a Mediterranean climate with hot and humid summers. All the farms included in the study were located within a 50-km radius of Gonbad-e-Qabus (37.25° N, 55.16° E), and as such, their collective data were treated as a single entity. The study encompassed a total of 1566 milking animals, predominantly of the Holstein-Friesian breed, with an average parity of approximately 3. The average number of days in milk (DIM) was 211 days, and the stage of lactation was predominantly in the mid-lactation phase. All the cows were raised under identical management and environmental conditions, residing in an open, spacious barn with a unique design. This barn featured an overshot roof, equipped with a ridge exhaust to facilitate air circulation, as well as fans to promote air exchange during the summer. In the winter months, winch curtains were employed to shield the cows from the chilling effects of the cold wind. Throughout the study, a Total Mixed Ration (TMR) was provided twice daily, at 08:00 a.m. and 04:00 p.m. Efforts were made to maintain the composition of the TMR consistently, but minor adjustments were made based on the farm’s specific needs. The TMR consisted of alfalfa hay, corn silage, wheat straw, a concentrated mixture, barley grain, corn grain, and soybean meal. Additionally, a mineral and vitamin premix were included. Cows had ad libitum access to both feed and water, available 24 h a day. On average, the TMR had a composition of 48.6% dry matter (DM), 17.3% crude protein (CP), 4.88% ether extract (EE), 39.2% neutral detergent fiber (NDF), and 19.1% acid detergent fiber (ADF) when measured on a dry matter basis. Additionally, the energy content in the diet for all cows was 1.72 Mcal net energy for lactation per kilogram of DM. Monthly samples of TMR were collected and stored at −20 °C until being analyzed for DM, CP, and EE following the procedures outlined in the AOAC guidelines [30]. Additionally, the NDF and ADF contents were determined using the amylase-treated NDF (aNDF) method as developed by Mertens [31].

2.2. Data Collection

A total of ten dairy herds were randomly selected for inclusion in this study. Each herd provided records of their average daily milk production. Additionally, daily milk samples were systematically obtained from the bulk storage tanks of individual herds, precisely upon delivery to the dairy processing facility (Sabah Dairy, Gonbad-e-Qabus, Iran). These collected samples served as the basis for subsequent analytical procedures, including fat content, protein content, SNF, pH, SCC, and TBC. The year was categorized into distinct seasons: spring (from 21 March to 20 June), summer (from 21 June to 20 September), autumn (from 21 September to 20 December), and winter (from 21 December to 20 March) [17]. Records of average daily temperature and relative humidity were obtained from the local weather station in Gonbad-e-Qabus, Iran, located at 37.26° N, 55.20° E. The THI was subsequently calculated using the equation proposed by Marai et al. [32]:
T H I = T ° C 0.31 0.31 R H T ° C 14.4
where T°C represents the ambient temperature in degrees Celsius, and RH is relative humidity in percent. As already indicated by Marai et al. [32], the calculated THI values were classified as follows: THI values below 22.2 were considered to indicate the absence of heat stress (AHS), while values ranging from 22.2 to less than 23.3 indicated moderate heat stress (MHS). Furthermore, the THI values between 23.3 and less than 25.6 were demonstrating severe heat stress (SHS), and finally, the THI values equal to or exceeding 25.6 were classified as extreme severe heat stress (ESHS).

2.3. Laboratory Analysis

Somatic cell counts were determined using NucleoCounter® SCC-100™ (Allerod, Denmark) and then transformed into the logarithmic [log2(SCC × 10−5) + 3] somatic cell score (SCS) [33]. The milk samples were promptly tested for TBC. For each sample, eight consecutive dilutions were prepared. The plated surface of each dilution was placed on two plates containing a standard plate count (SPC) medium, which was then cultured for a specific duration. The samples were housed in a controlled greenhouse environment for 72 h at a temperature of 32 °C. Subsequently, the colonies were tallied, and the bacterial count per milliliter of the samples was ascertained [34]. The Milkoscan 134 model (Foss-Electric A/C, Hillerod, Denmark) was employed to assess the milk samples for protein, fat, and SNF in accordance with the IDF (inverse document frequency) Standard 141B:1996. The pH of the milk was measured using the HI981034 Milk pH Tester (HANNA Instruments, Carrollton, TX, USA).

2.4. Statistical Analysis

The statistical analysis was performed using the SAS version 9.4 statistical package (SAS Institute Inc., Cary, NC, USA). The effects of seasons, months, and THI on milk yield, composition, SCC, and TBC were assessed using an analysis of variance. Tukey’s test was employed for post-hoc mean separation when statistical significance was detected. To account for these effects, a mixed-effects model was utilized with a restricted maximum likelihood approach, treating month and THI as fixed factors. Pearson correlations were computed between milk yield, various measured milk composition parameters, and environmental factors. The results are reported as least-squares means along with standard deviations, unless explicitly stated otherwise. Statistical significance was determined at a probability level (p) of < 0.05, and trends are discussed for variables with p ≤ 0.10.

3. Results

The summarized statistics for meteorological and production data, including the number, mean, minimum, and maximum of various variables measured during the study, are presented in Table 1.
As presented in Table 2, our investigation revealed noteworthy correlations between key milk parameters and variations in seasons, months, and THI. Positively significant correlations (p < 0.01) were observed between milk yield, fat, protein, SNF, and pH with the seasons of the year. In contrast, the correlations between milk SCC and TBC with seasons displayed significant negativity (p < 0.01). Aside from SCC (p > 0.05), months of the year exhibited significant negative correlations (p < 0.01) with milk yield, fat, protein, SNF, pH, and TBC. Significant negative correlations were also observed between THI and milk yield, fat, protein, SNF, and pH, while the correlations between THI with SCC and TBC were significantly positive (p < 0.01).

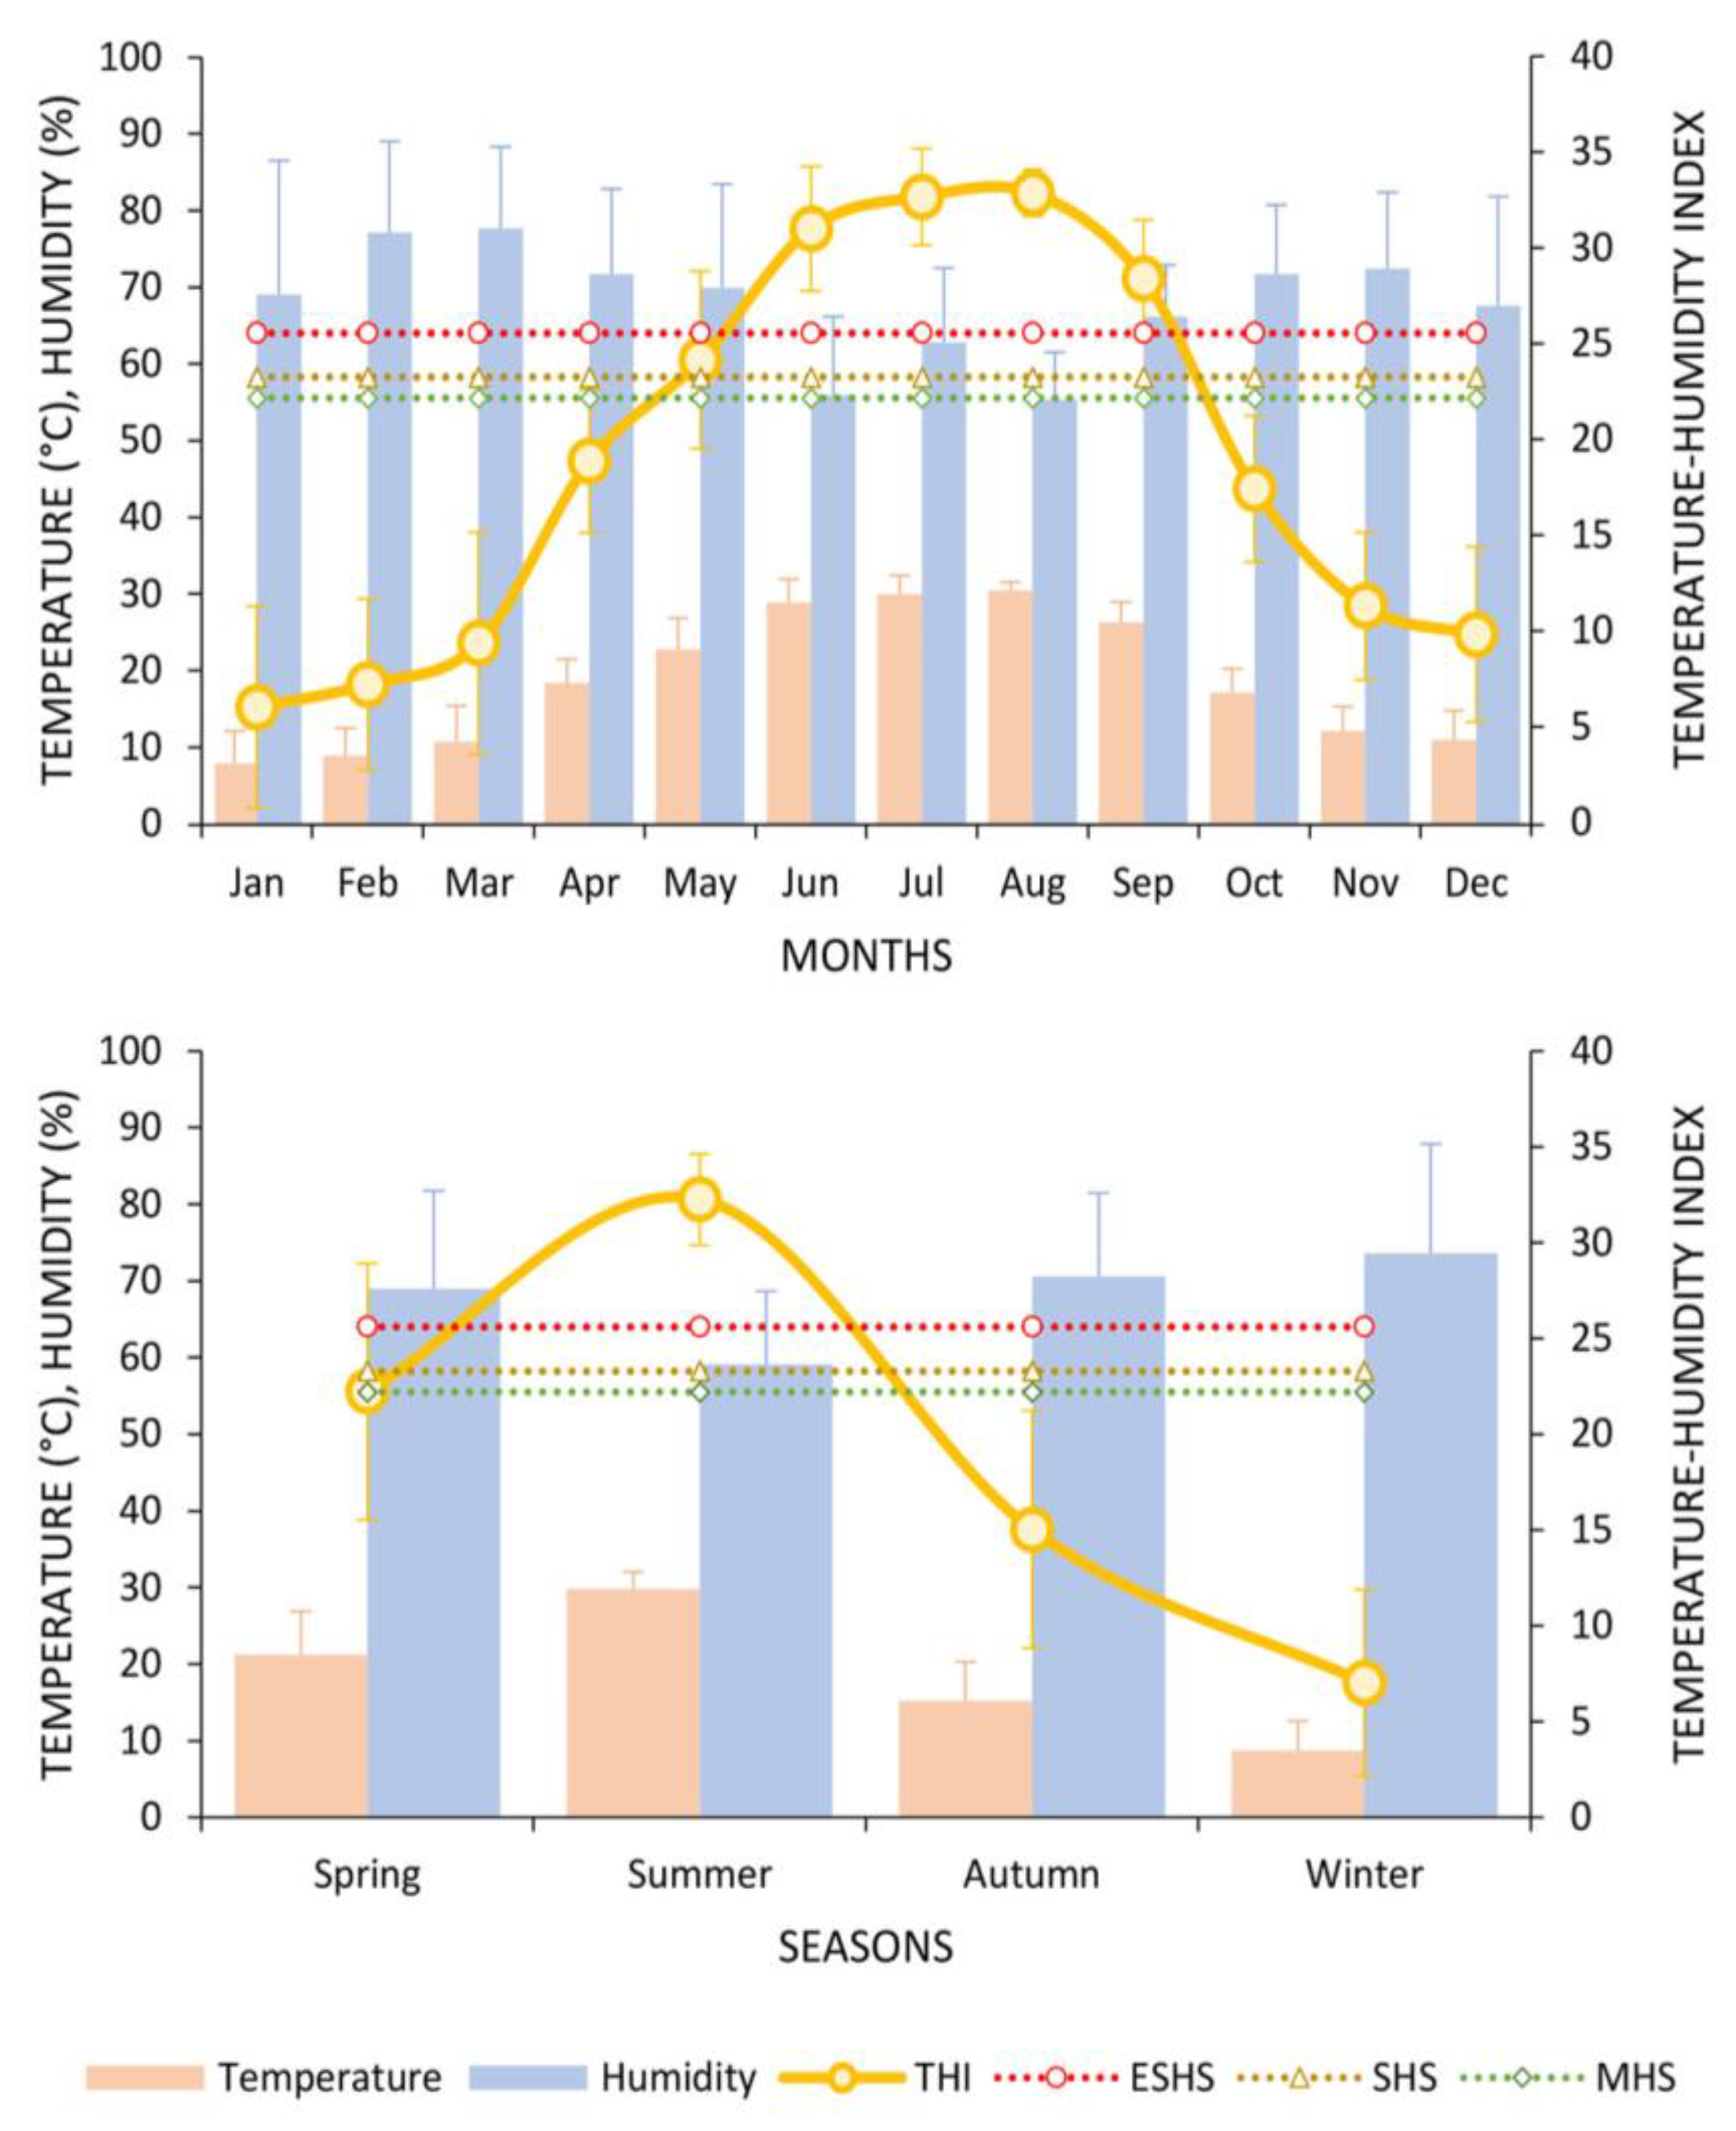
3.1. Climatic Conditions

Figure 1 illustrates the mean values of monthly and seasonal temperature, relative humidity, and the THI recorded throughout the year 2021. During the study period, the mean values for ambient temperature, relative humidity, and THI were recorded as 18.8 °C, 68.0%, and 19.2 units, respectively (Figure 1). The range of monthly THI values was documented, with the minimum and maximum recorded as −3.6 and 37.7 units, respectively (Figure 1). The mean THI reached its minimum value in January (6.1 units) and peaked in August (32.9 units). The average THI exhibited a progression towards severe heat stress in May (spring season), escalating to the category of extremely severe heat stress (ESHS) during the months of June, July, August, and September (summer season).

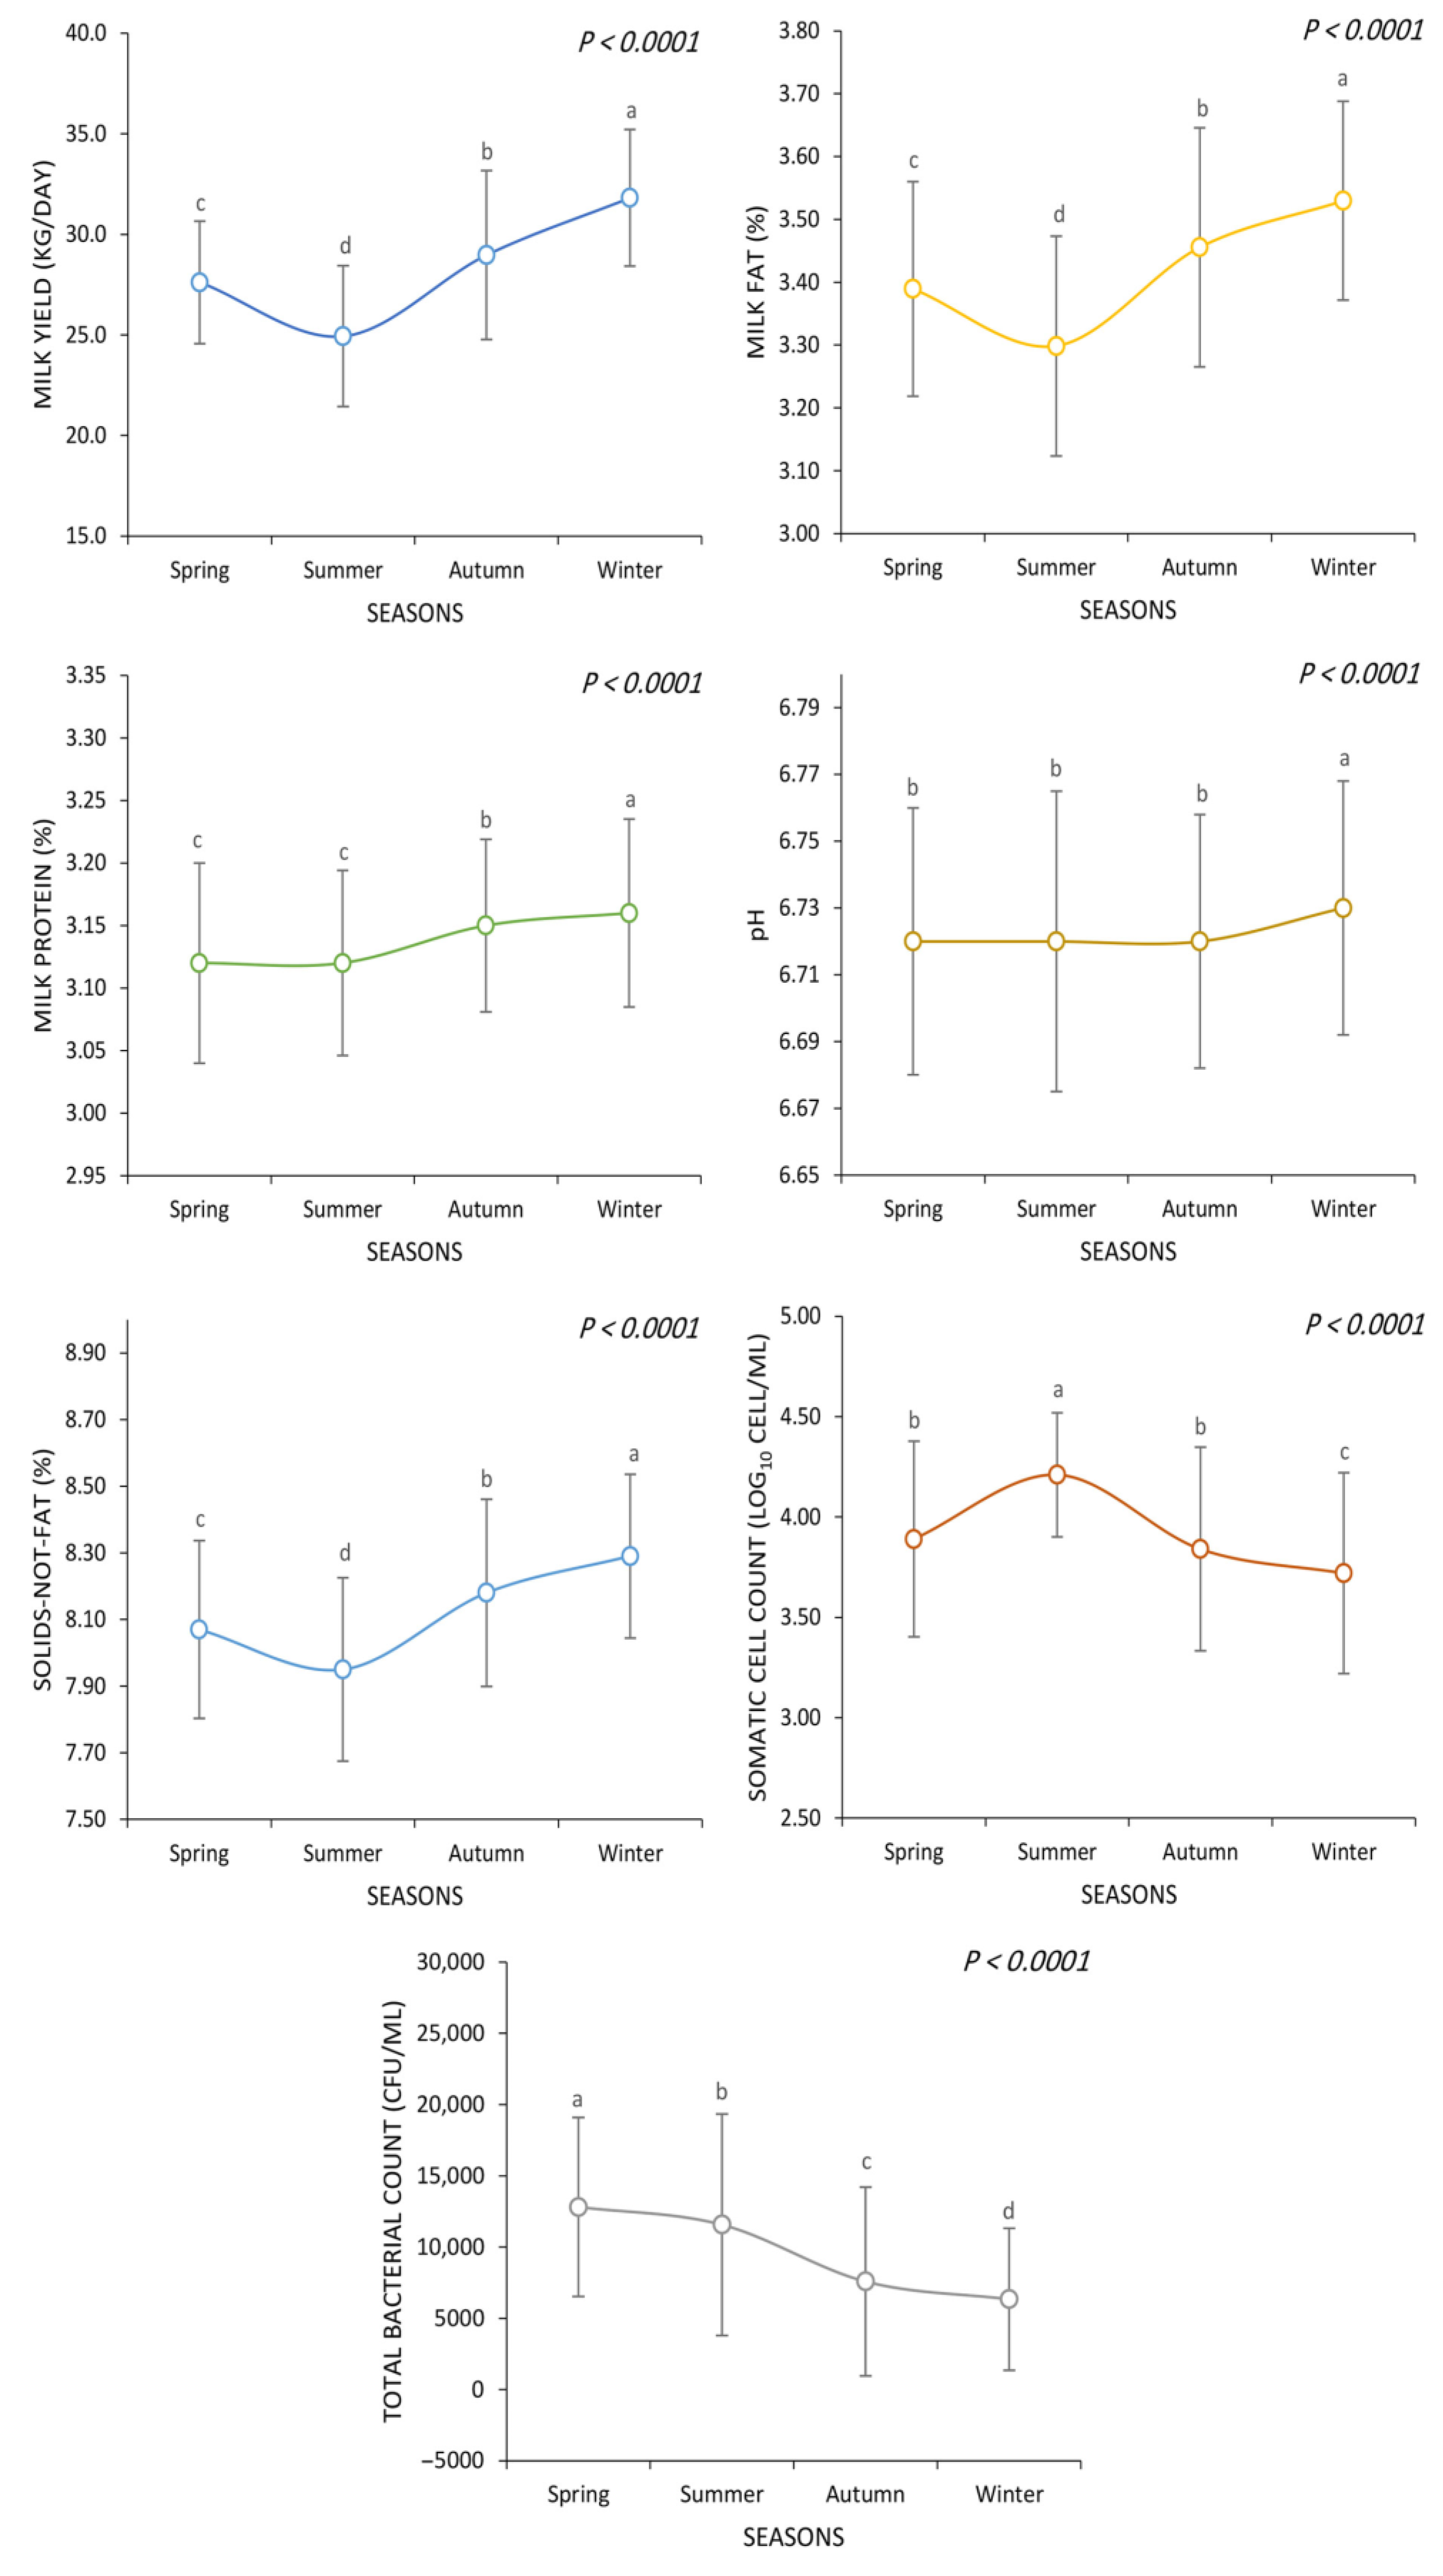
3.2. Effect of Seasons

Figure 2 demonstrates the influence of different seasons on the various experimental parameters, including milk yield, milk composition (fat, protein, SNF), SCC, and TBC. The effect of seasons on various parameters analyzed in the study was statistically significant (p < 0.01).
The highest milk yield was observed in winter (31.8 kg/day), followed by autumn (29.0 kg/day), spring (27.6 kg/day), and summer (24.9 kg/day) (p < 0.01). In a similar manner, the highest milk fat content was observed in winter (3.53%), followed by autumn (3.46%), spring (3.39%), and summer (3.30%) (p < 0.01). In terms of milk protein, the highest value was observed in winter (3.16%), while both spring (3.12%) and summer (3.12%) exhibited the lowest value (p < 0.01). Autumn showed an intermediate value (3.15%) for milk protein among the seasons (p < 0.01). Milk SNF showed a similar trend as milk yield and milk fat content, with winter demonstrating the highest value (8.29%), followed by autumn (8.18%), spring (8.07%), and summer (7.95%) (p < 0.01). There was no significant difference between spring (6.72), summer (6.72), and autumn (6.72) regarding milk pH (p > 0.05). However, winter milk had a significantly higher pH value (6.73) (p < 0.01). The SCC was the highest in the summer (44.21 log10 cell/mL), whereas it was the lowest in the winter (3.72 log10 cell/mL) (p < 0.01). Both spring (3.89 log10 cell/mL) and autumn (3.84 log10 cell/mL) showed intermediate values of SCC while they were not significantly different (p > 0.05). The highest value of TBC was observed in spring (12,812 CFU/mL), followed by summer (11,574 CFU/mL), autumn (7584 CFU/mL), and winter (6341 CFU/mL) (p < 0.01).

3.3. Effect of Months
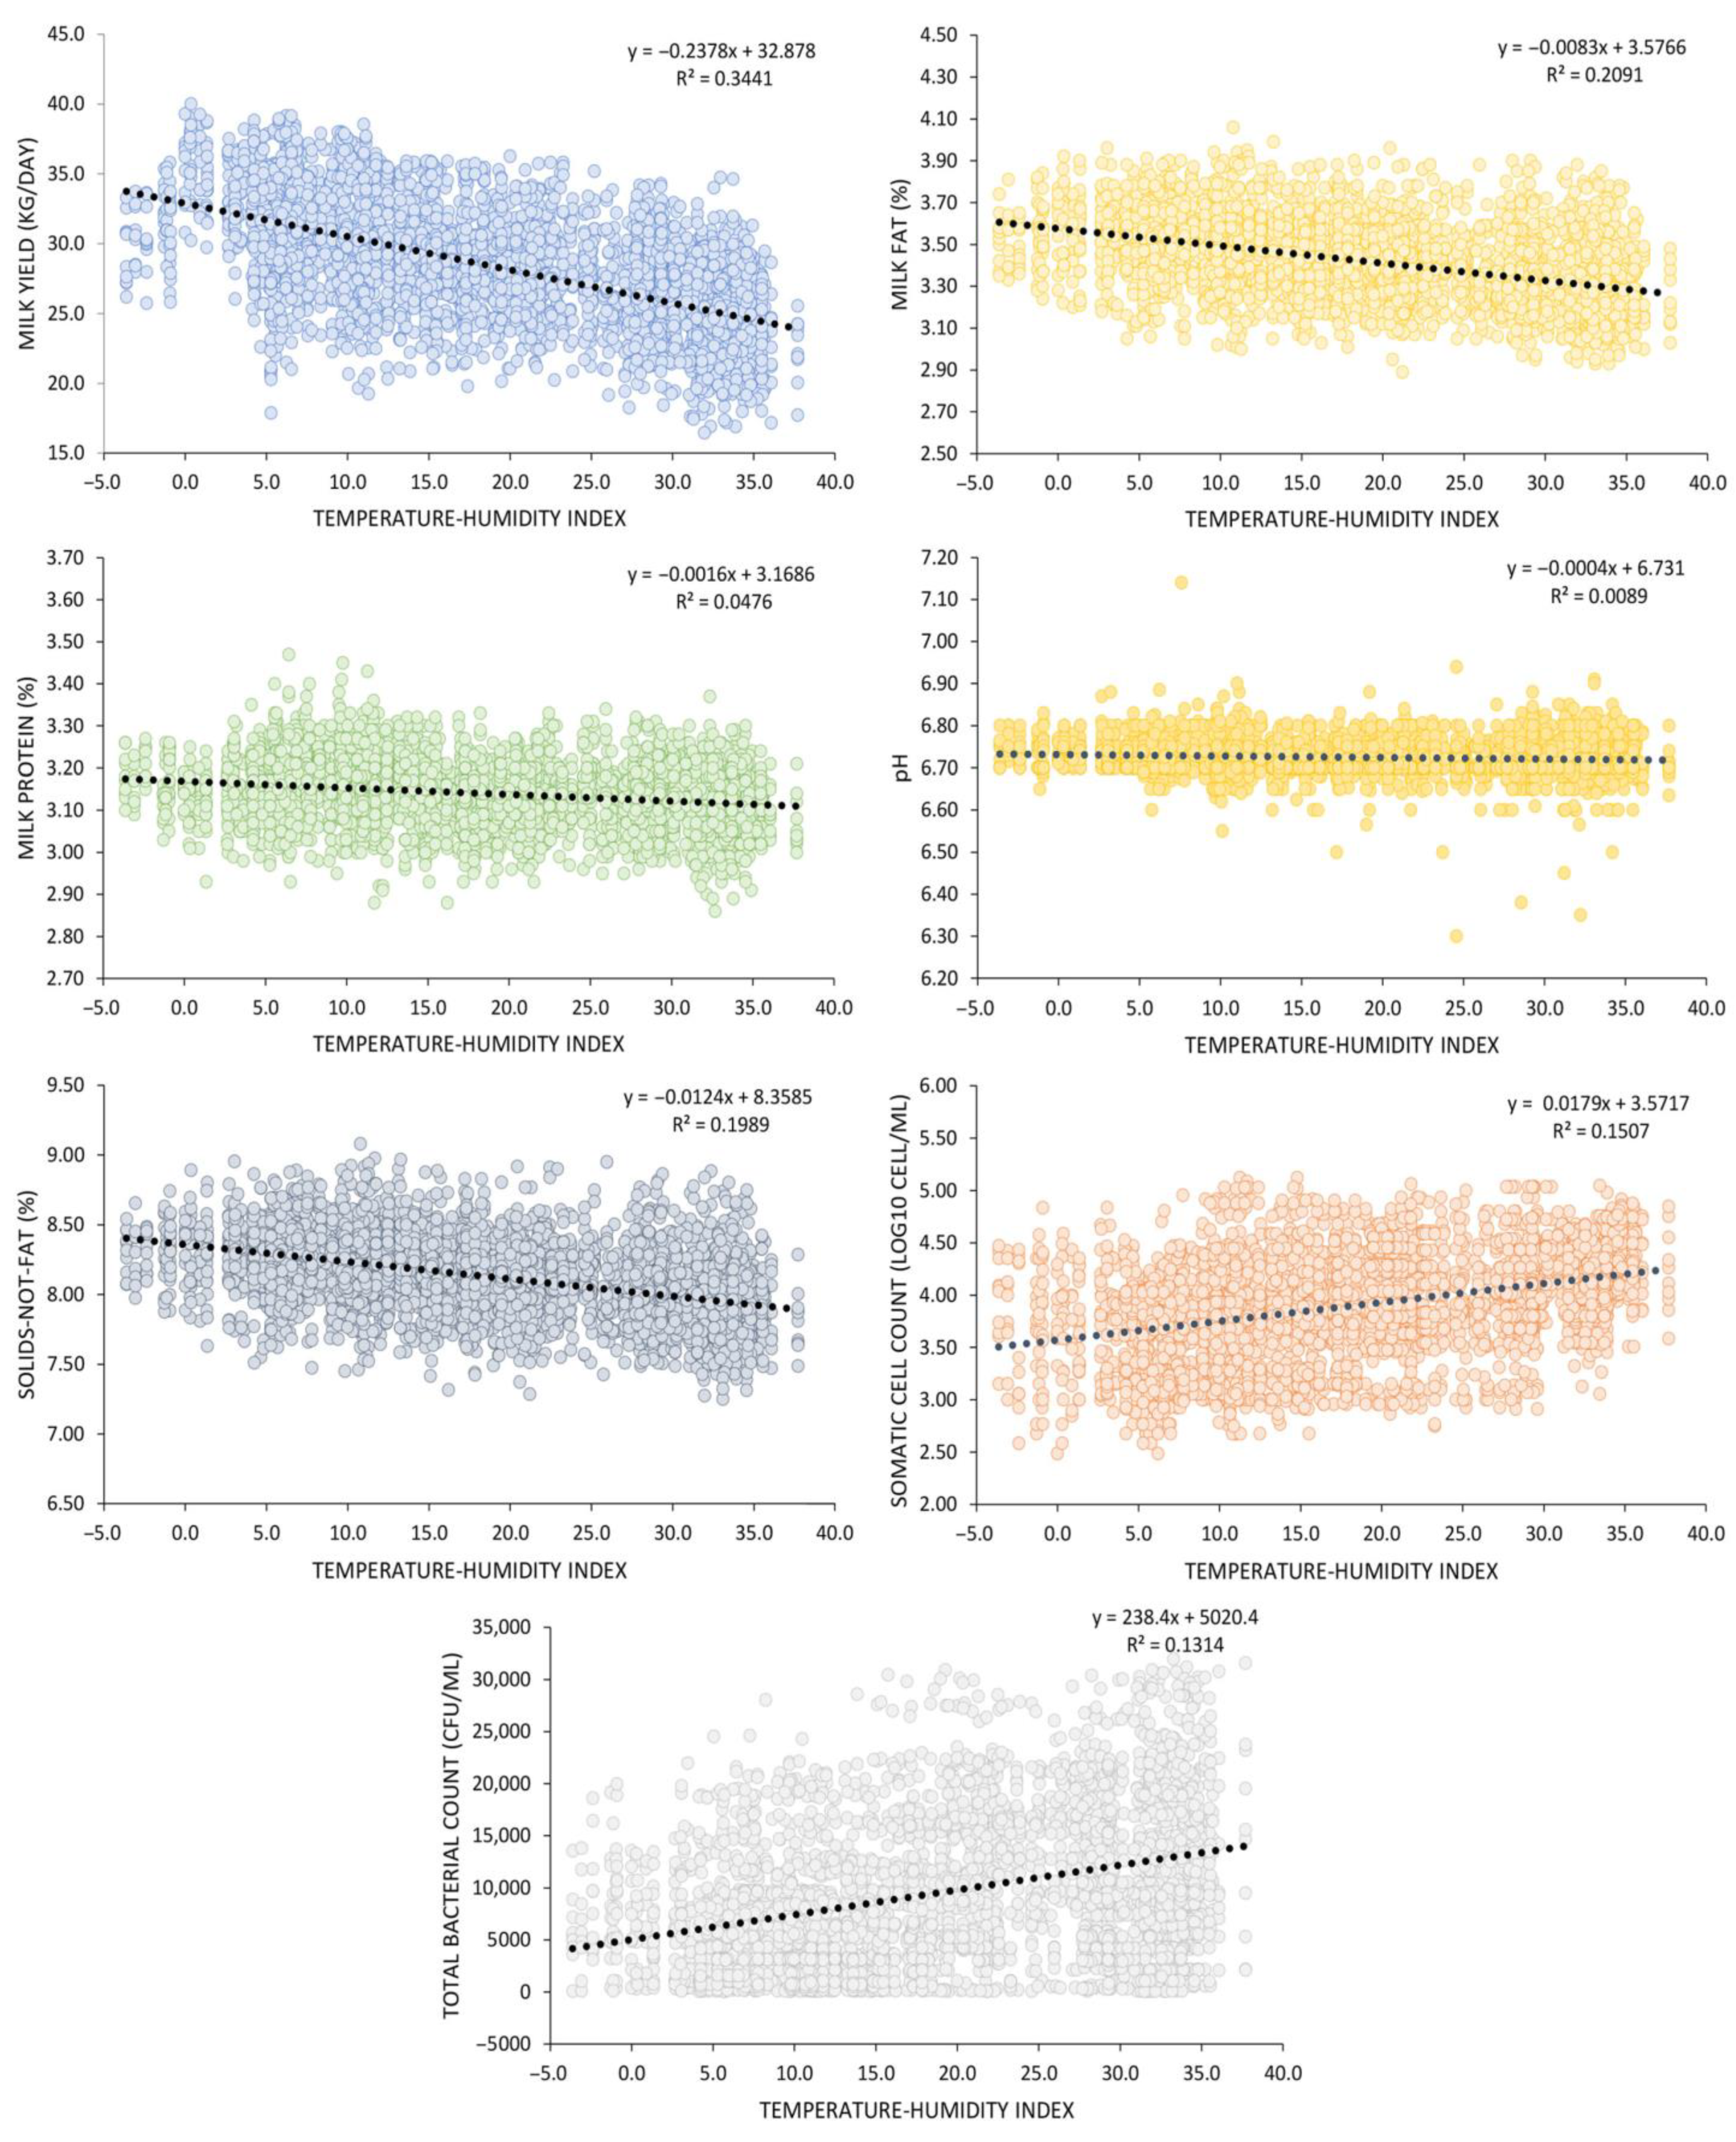
Figure 3 illustrates the pronounced impact of varying months on multiple aspects of the investigation, encompassing milk yield, composition (fat, protein, solids-not-fat), milk SSC, and TBC. Every parameter analyzed in the study exhibited statistically significant differences across the various months of the year (p < 0.01). Remarkably, the highest milk yield was recorded during January (33.4 kg/day), followed closely by February (31.5 kg/day), whereas the lowest milk yield was concurrently recorded in both July (24.3 kg/day) and August (23.8 kg/day) (p < 0.01). There was also a notable trend in milk fat content across the months studied. The highest fat content was observed in January (3.55%), closely followed by February (3.54%) and March (3.51%). In contrast, the lowest fat content was recorded in July (3.26%) (p < 0.01). The protein content exhibited significant temporal variation, with the highest value observed in March (3.23%), and the lowest values occurring in April (3.09%), June (3.10%), and July (3.09%) (p < 0.01). In terms of SNF content, the highest value was observed in March (8.35%), closely followed by February (8.31%) and January (8.27%). In contrast, the lowest SNF content was recorded in July (7.85%), with a significant difference (p < 0.01). The results reveal a distinct trend in milk pH levels across the months. Notably, the highest milk pH value was observed in January (6.74), whereas the lowest levels were consistently recorded in June, July, October, and November, each registering a pH of 6.72 (p < 0.01). The SCC exhibited significant temporal variability, with the highest count observed in August (4.23 log10 cells/mL), contrasting sharply with the lowest count registered in December (3.48 log10 cells/mL) (p < 0.01). The TBC exhibited a clear seasonal pattern, with the highest levels recorded in May (17,161 CFU/mL), followed by June (13,248 CFU/mL) and July (13,922 CFU/mL). Notably, the lowest TBC was observed in December (2912 CFU/mL) (p < 0.01), revealing a significant fluctuation in microbial abundance throughout the year.

3.4. Effect of THI

Figure 4 illustrates the relationship between THI and various milk parameters, including milk yield, milk fat, milk protein, SNF, SCC, and TBC, while Table 2 complements this by reporting the corresponding correlation coefficients. Across the THI spectrum, spanning from −3.6 to 37.7, distinct trends were evident. A linear regression model, y = −0.2378x + 32.878, explained 34.41% of the variance in milk yield due to THI, revealing a strong inverse correlation (r = −0.59, p < 0.01). Similarly, a linear model captured the variation in milk fat content, with y = −0.0083x + 3.5766, and an R2 of 0.2091. Notably, a significant negative correlation was observed between THI and milk fat (r = −0.46, p < 0.01). For milk protein, a linear regression model, y = −0.0016x + 3.1686, yielded an R2 of 0.0476 and a weak negative correlation (r = −0.22, p < 0.01). Analogously, a linear model, y = −0.0124x + 8.3585, with an R2 of 0.1989, described the relationship between THI and SNF, which displayed a significant negative correlation (r = −0.45, p < 0.01). Moreover, the interaction between THI and pH was examined through a linear regression, y = −0.0004x + 6.7310, with an R2 of 0.0089, revealing a significant negative correlation (r = −0.10, p < 0.01). Notably, SCC exhibited an upward trend with increasing THI, as evidenced by the linear regression y = 0.0179x + 3.5717, demonstrating an R2 of 0.1507 and a significant positive correlation (r = 0.39, p < 0.01). Concerning TBC, a linear model, y = 238.4x + 5020.4, fits the data moderately (R2 = 0.1314), suggesting a linear relationship with THI. Furthermore, the correlation coefficient between THI and TBC was 0.36 (p < 0.01), denoting a moderately positive association.

4. Discussion

The comprehensive investigation of milk yield and composition in association with seasons, months, and THI offers valuable insights into the dynamic correlation between environmental factors and dairy outcomes. Our findings, which revealed significant correlations among these variables, shed light on the multifaceted nature of dairy farming in tropical regions. The seasonal variations observed in milk yield and composition underscore the influence of changing climatic conditions on dairy herd performance. Lactating animals are considered highly susceptible to elevated temperatures and humidity levels. The production of milk in these animals and their milk yield are closely associated with shifts in climate patterns, marked by prolonged exposure to substantial heat and humidity spanning approximately 6 months each year [35]. The THI serves as a comprehensive indicator for evaluating the degree of heat and cold stress in dairy cows, representing the combined influence of temperature and relative humidity.

4.1. Seasonal Trends in Milk Yield and Quality

Our study reveals distinct seasonal patterns in milk production. Notably, the highest milk yield was observed during the winter, while the lowest occurred in the summer. These findings are consistent with previous research. Yoon et al. [36] reported a 0.93 kg/day higher milk yield during the winter compared to the summer. Similarly, Bernabucci et al. [37] reported a 0.50 kg/day higher milk yield during the winter as opposed to the summer. The strong positive correlation of 0.43 between season and milk yield signifies a moderate linear relationship, implying that milk yield tends to rise with changing seasons. However, the moderate correlation strength implies the involvement of additional influencing factors. Consistent with our findings, Bernabucci et al. [37] and Bertocchi et al. [38] observed elevated levels of fat, protein, and SNF in milk during the winter, contrasting with decreased concentrations during the summer. As proposed by Bertocchi et al. [38], a potential explanation for the decrease in fat and protein content during the warmer seasons (spring and summer) is the elevated occurrence of calving and, consequently, a greater population of recently calved cows in comparison to other seasons. Lim et al. [39] similarly documented a progressive rise in milk protein levels among Holstein cows from spring to winter. In their investigation, Lim et al. [39] demonstrated a 6.2% reduction in average milk yield among Holstein cows as the average THI values transitioned from spring to autumn, potentially due to heightened energy expenditure. The intensified heat production might contribute to the accelerating decline in milk yield. Furthermore, the extent of the permanent decrease in ongoing lactation is directly linked to the duration of heat stress. Furthermore, variations in milk production across seasons arise from cyclic environmental changes throughout the year. Bohmanova et al. [4] describe these variations as arising from both direct impacts on milk production, characterized by reduced dry matter intake, and indirect effects stemming from fluctuations in feed availability and quality.
Our observations indicate elevated SCC during the summer, aligning with the findings of Lim et al. [39], who found a significant increase in SCC during the summer in Holstein cows. Negative correlations between seasons and SCC, as well as TBC, underscore the potential challenges associated with specific climatic conditions, which could impact both udder health and milk quality. Alhussien and Dang [21] similarly noted a mild seasonal effect on milk SCC, with higher values observed in the summer compared to the winter and spring seasons.

4.2. Monthly Trends in Milk Yield and Quality

Months played an essential role in shaping the trends we observed in milk production and its composition, notably fat, SNF, and, to some extent, protein levels. Our findings revealed that these key indicators reached their highest values during the colder months of the year. These results were further supported by significant negative correlations linking milk yield and its constituents with temperature, as well as significant negative correlations with the month. This was in line with the findings of Zhu et al. [35], who reported an increase in daily milk production in January, February, and March, contrasting with the lowest daily yields in July and August. These results underscore the significance of temperature in influencing the daily milk yield of ruminants. In the study conducted by Md. Akkas et al. [40], a notable trend emerged wherein milk yield exhibited an increasing pattern during the months coinciding with decreasing THI values. This was confirmed by the significant negative correlation we observed between the month and milk yield. Yang et al. [41] documented a remarkably similar monthly pattern in milk fat, protein, and milk solids, mirroring the observations from our current investigation. Nonetheless, minor disparities could potentially be attributed to variations in environmental and geographical conditions across the two experiments. Consistency in these findings was further supported by the work of Barash et al. [42], where cows demonstrated their highest daily milk yield in February and the lowest in September. The most substantial reduction in milk yield was observed between June and September (summer), while a rebound was evident from October to November (autumn), indicative of a recovery phase. Our previous study also highlighted elevated milk fat content during January, February, and March [43], in line with Kljajevic et al. [44], underscoring the profound influence of environmental temperature on milk composition. Our results corroborate this observation, as we identified stronger correlation coefficients between milk fat and both month and temperature compared to other constituents.

4.3. Effect of Temperature-Humidity Index

Temperature–humidity index profoundly influences milk production and various aspects of milk composition and SCC, as evidenced by several studies. Md. Akkas et al. [40] revealed a noteworthy trend where increased THI levels were associated with a statistically significant decrease in milk production, milk fat, and milk SNF. Notably, they identified an inverse relationship between milk fat and SNF levels with respect to THI levels. Lower THI values consistently correlated with higher milk fat and SNF, in contrast to instances of higher THI. These observations corroborated our own research outcomes, further substantiated by a notable and statistically significant negative correlation established between THI and both milk fat and SNF levels. Lee et al. [45] observed a reduction in each milk component when the THI surpassed the specific threshold. Furthermore, the literature suggests that milk fat tends to decrease in response to heat stress (HS) conditions [46,47,48]. Bouraoui et al. [49] proposed that this decrease might be linked to reduced forage consumption in the diet. They argued that TMR could mitigate heat stress-induced milk fat depression by maintaining the balance between forage and concentrate intake and ensuring sufficient fiber for proper rumen function. Moallem et al. [50] pointed out that the primary adverse effect of elevated THI levels is the reduction in rumination time, subsequently leading to decreased dry matter intake and, consequently, reduced milk yield. The release of somatic cells in milk is influenced by various factors, including milk productivity, animal health, management practices, and environmental conditions, as elaborated upon in the following discussion [21]. High-milk-producing cows experience increased stress due to production demands, compromising their immunity and resulting in elevated SCC in their milk [22]. This effect is especially pronounced in high-producing cows during hot and humid seasons compared to their mid- and low-producing counterparts, indicating increased udder stress during this period [51]. Lee et al. [45] reported a significant increase in SCC in cows when the THI exceeded the breakpoint, a finding mirrored by Hagiya et al. [52], who observed a marked increase in SCC beyond the THI threshold. These investigations are consistent with the results of our own study. Micronutrient deficiencies arising from poor-quality fodder can contribute to the heightened growth of infectious bacteria, coupled with diminished immunity and elevated SCC [21].

5. Conclusions

In conclusion, our findings highlight the paramount influence of the THI on milk production, constituents, SCC, and TBC. We observed a significant negative correlation between THI and milk constituents (fat, protein, and SNF levels), providing practical insights for dairy management practices. The implications extend to udder health, as high-producing cows, especially during hot and humid seasons, exhibit heightened stress, compromising immunity and resulting in elevated SCC. This relationship between THI and SCC reinforces the importance of proactive herd management to mitigate SCC risks during environmental stress periods. As the dairy industry confronts ongoing challenges linked to climate change, these findings offer essential guidance for optimizing production efficiency and maintaining milk quality standards. Further research in this field promises to refine our knowledge, enhancing the sustainability of dairy operations in a dynamically changing environment.

Author Contributions

Conceptualization, M.B. and A.T.; data curation, M.B.; formal analysis, M.B.; funding acquisition, M.B., J.G.N. and I.J.E.; investigation, M.B., J.G.N. and I.J.E.; methodology, M.B.; project administration, M.B.; resources, M.B., J.G.N. and I.J.E.; software, M.B.; supervision, A.T. and T.G.; validation, M.B., A.T. and T.G.; visualization, M.B.; writing—original draft, M.B.; writing—review and editing, A.T., T.G. and J.G.N. All authors will be informed about each step of manuscript processing, including submission, revision, revision reminder, etc., via email from our system or their assigned assistant editor. All authors have read and agreed to the published version of the manuscript.

Funding

The funding for this work was provided by Glopex through the research grant for innovation (project no. GP-BioMed2023). The authors would like to convey their sincere appreciation to Glopex (https://glopex.kr/) accessed on 8 October 2023, whose kind financial assistance made this study feasible. We would also like to thank our coworkers and collaborators for their suggestions and criticism throughout the course of this project. We also thank the editorial staff and reviewers for their insightful criticism and recommendations, which considerably raised the caliber of this work. We warmly thank Glopex for their dedication to science and their conviction that this research is crucial.

Institutional Review Board Statement

All experimental procedures involving animals were conducted in compliance with the International Guidelines for research involving animals (Directive 2010/63/EU) and were approved by the Animal Welfare and Ethics Committee of Gorgan University of Agricultural Sciences and Natural Resources, Gorgan, Iran (approval number: N.T. 20/1115). This study was conducted in March 2022.

Informed Consent Statement

Not applicable.

Data Availability Statement

Data are available upon a reasonable request.

Acknowledgments

The authors wish to thank Gorgan University of Agricultural Sciences and Natural Resources Research Council and the academic members of the Animal Science Department. Special appreciation is extended to Sabah Dairy Industries, Golestan, Gonbad-e-Qabus, Iran, and particularly Eng. Hasan Hosseini for their generous collaboration and provision of essential data and facilities.

Conflicts of Interest

The authors declare no conflict of interest.

References

  1. Muehlhoff, E.; Bennett, A. Milk and Dairy Products in Human Nutrition; FAO: Rome, Italy, 2013. [Google Scholar]
  2. Guzmán-Luna, P.; Mauricio-Iglesias, M.; Flysjö, A.; Hospido, A. Analysing the interaction between the dairy sector and climate change from a life cycle perspective: A review. Trends Food Sci. Technol. 2022, 126, 168–179. [Google Scholar] [CrossRef]
  3. Herbut, P.; Angrecka, S.; Walczak, J. Environmental parameters to assessing of heat stress in dairy cattle-a review. Int. J. Biometeorol. 2018, 62, 2089–2097. [Google Scholar] [CrossRef] [PubMed]
  4. Bohmanova, J.; Misztal, I.; Cole, J.B. Temperature-Humidity Indices as Indicators of Milk Production Losses due to Heat Stress. J. Dairy Sci. 2007, 90, 1947–1956. [Google Scholar] [CrossRef] [PubMed]
  5. Shi, R.; Brito, L.F.; Liu, A.; Luo, H.; Chen, Z.; Liu, L.; Guo, G.; Mulder, H.; Ducro, B.; van der Linden, A.; et al. Genotype-by-environment interaction in Holstein heifer fertility traits using single-step genomic reaction norm models. BMC Genom. 2021, 22, 193. [Google Scholar] [CrossRef]
  6. Dikmen, S.; Hansen, P.J. Is the temperature-humidity index the best indicator of heat stress in lactating dairy cows in a subtropical environment? J. Dairy Sci. 2009, 92, 109–116. [Google Scholar] [CrossRef]
  7. Ataallahi, M.; Cheon, S.N.; Park, G.-W.; Nugrahaeningtyas, E.; Jeon, J.H.; Park, K.-H. Assessment of Stress Levels in Lactating Cattle: Analyzing Cortisol Residues in Commercial Milk Products in Relation to the Temperature-Humidity Index. Animals 2023, 13, 2407. [Google Scholar] [CrossRef]
  8. Bokharaeian, M.; Toghdory, A.; Ghoorchi, T. Effects of dietary curcumin nano-micelles on growth performance, blood metabolites, antioxidant status, immune and physiological responses of fattening lambs under heat-stress conditions. J. Therm. Biol. 2023, 114, 103585. [Google Scholar] [CrossRef]
  9. Cartwright, S.L.; Schmied, J.; Karrow, N.; Mallard, B.A. Impact of heat stress on dairy cattle and selection strategies for thermotolerance: A review. Front. Vet. Sci. 2023, 10, 1198697. [Google Scholar] [CrossRef]
  10. Geary, U.; Lopez-Villalobos, N.; O’Brien, B.; Garrick, D.J.; Shalloo, L. Meta-analysis to investigate relationships between somatic cell count and raw milk composition, Cheddar cheese processing characteristics and cheese composition. Ir. J. Agric. Food Res. 2013, 52, 119–133. [Google Scholar]
  11. Berhe, G.; Wasihun, A.G.; Kassaye, E.; Gebreselasie, K. Milk-borne bacterial health hazards in milk produced for commercial purpose in Tigray, northern Ethiopia. BMC Public Health 2020, 20, 894. [Google Scholar] [CrossRef]
  12. Soleimani-Rahimabad, F.; Sadeghi-Sefidmazgi, A.; Pakdel, A.; Rahbar, R.; Bewley, J. Farm Management and Economic Factors Associated with Bulk Tank Total Bacterial Count in Holstein Dairy Herds in Iran. J. Dairy Res. 2022, 2022, 1–7. [Google Scholar] [CrossRef] [PubMed]
  13. Khastayeva, A.Z.; Zhamurova, V.S.; Mamayeva, L.A.; Kozhabergenov, A.T.; Karimov, N.Z.; Muratbekova, K.M. Qualitative indicators of milk of Simmental and Holstein cows in different seasons of lactation. Vet. World 2021, 14, 956–963. [Google Scholar] [CrossRef] [PubMed]
  14. Zhao, X.-J.; Li, Z.-P.; Wang, J.-H.; Xing, X.-M.; Wang, Z.-Y.; Wang, L.; Wang, Z.-H. Effects of chelated Zn/Cu/Mn on redox status, immune responses and hoof health in lactating Holstein cows. J. Vet. Sci. 2015, 16, 439–446. [Google Scholar] [CrossRef]
  15. Carabaño, M.J.; Ramón, M.; Díaz, C.; Molina, A.; Pérez-Guzmán, M.D.; Serradilla, J.M. Breeding and genetics symposium: Breeding for resilience to heat stress effects in dairy ruminants. A comprehensive review. J. Anim. Sci. 2017, 95, 1813–1826. [Google Scholar] [CrossRef] [PubMed]
  16. Herbut, P.; Angrecka, S. Forming of temperature-humidity index (THI) and milk production of cows in the free-stall barn during the period of summer heat. Anim. Sci. Pap. Rep. 2012, 30, 363–372. [Google Scholar]
  17. Rodriguez-Venegas, R.; Meza-Herrera, C.A.; Robles-Trillo, P.A.; Angel-Garcia, O.; Legarreta-Gonzalez, M.A.; Sánchez-Vocanegra, H.F.; Rodriguez-Martinez, R. Effect of THI on Milk Production, Percentage of Milking Cows, and Time Lying in Holstein Cows in Northern-Arid Mexico. Animals 2023, 13, 1715. [Google Scholar] [CrossRef]
  18. Finocchiaro, R.; van Kaam, J.B.; Portolano, B.; Misztal, I. Effect of heat stress on production of Mediterranean dairy sheep. J. Dairy Sci. 2005, 88, 1855–1864. [Google Scholar] [CrossRef]
  19. Ramón, M.; Díaz, C.; Pérez-Guzman, M.D.; Carabaño, M.J. Effect of exposure to adverse climatic conditions on production in Manchega dairy sheep. J. Dairy Sci. 2016, 99, 5764–5779. [Google Scholar] [CrossRef]
  20. Peana, I.; Fois, G.; Cannas, A. Effects of heat stress and diet on milk production and feed and energy intake of Sarda ewes. Ital. J. Anim. Sci. 2007, 6, 577–579. [Google Scholar] [CrossRef]
  21. Alhussien, M.N.; Dang, A.K. Milk somatic cells, factors influencing their release, future prospects, and practical utility in dairy animals: An overview. Vet. World 2018, 11, 562–577. [Google Scholar] [CrossRef]
  22. Mukherjee, J.; Dang, A. Immune activity of milk leukocytes during early lactation in high and low yielding crossbred cows. Milchwissenschaft 2011, 66, 384–388. [Google Scholar]
  23. M’Hamdi, N.; Darej, C.; Attia, K.; El Akram Znaidi, I.; Khattab, R.; Djelailia, H.; Bouraoui, R.; Taboubi, R.; Marzouki, L.; Ayadi, M. Modelling THI effects on milk production and lactation curve parameters of Holstein dairy cows. J. Therm. Biol. 2021, 99, 102917. [Google Scholar] [CrossRef] [PubMed]
  24. Godden, S.; Rapnicki, P.; Stewart, S.; Fetrow, J.; Johnson, A.; Bey, R.; Farnsworth, R. Effectiveness of an internal teat seal in the prevention of new intramammary infections during the dry and early-lactation periods in dairy cows when used with a dry cow intramammary antibiotic. J. Dairy Sci. 2003, 86, 3899–3911. [Google Scholar] [CrossRef]
  25. Miraglia, M.; Marvin, H.J.P.; Kleter, G.A.; Battilani, P.; Brera, C.; Coni, E.; Cubadda, F.; Croci, L.; De Santis, B.; Dekkers, S.; et al. Climate change and food safety: An emerging issue with special focus on Europe. Food Chem. Toxicol. 2009, 47, 1009–1021. [Google Scholar] [CrossRef] [PubMed]
  26. Metzger, S.A.; Hernandez, L.L.; Skarlupka, J.H.; Walker, T.M.; Suen, G.; Ruegg, P.L. A Cohort Study of the Milk Microbiota of Healthy and Inflamed Bovine Mammary Glands From Dryoff Through 150 Days in Milk. Front. Vet. Sci. 2018, 5, 247. [Google Scholar] [CrossRef] [PubMed]
  27. Vithanage, N.R.; Dissanayake, M.; Bolge, G.; Palombo, E.A.; Yeager, T.R.; Datta, N. Biodiversity of culturable psychrotrophic microbiota in raw milk attributable to refrigeration conditions, seasonality and their spoilage potential. Int. Dairy J. 2016, 57, 80–90. [Google Scholar] [CrossRef]
  28. Woolpert, M.; Dann, H.; Cotanch, K.; Melilli, C.; Chase, L.; Grant, R.; Barbano, D. Management, nutrition, and lactation performance are related to bulk tank milk de novo fatty acid concentration on northeastern US dairy farms. J. Dairy Sci. 2016, 99, 8486–8497. [Google Scholar] [CrossRef]
  29. Feliciano, R.J.; Boué, G.; Membré, J.-M. Overview of the potential impacts of climate change on the microbial safety of the dairy industry. Foods 2020, 9, 1794. [Google Scholar] [CrossRef]
  30. AOAC. Official Methods of Analysis of the Association of Official Analytical Chemists, 21st ed.; AOAC International: Washington, DC, USA, 2019. [Google Scholar]
  31. Mertens, D.R. Gravimetric determination of amylase-treated neutral detergent fiber in feeds with refluxing in beakers or crucibles: Collaborative study. J. AOAC Int. 2002, 85, 1217–1240. [Google Scholar]
  32. Marai, I.F.M.; El-Darawany, A.A.; Fadiel, A.; Abdel-Hafez, M.A.M. Physiological traits as affected by heat stress in sheep-A review. Small Rumin. Res. 2007, 71, 1–12. [Google Scholar] [CrossRef]
  33. Ali, A.K.A.; Shook, G.E. An Optimum Transformation for Somatic Cell Concentration in Milk1. J. Dairy Sci. 1980, 63, 487–490. [Google Scholar] [CrossRef]
  34. Splittstoesser, D.F.; Vanderzant, C. Compendium of Methods for the Microbiological Examination of Foods, 3rd ed.; American Public Health Association: Washington, DC, USA, 1992. [Google Scholar]
  35. Zhu, X.; Wen, J.; Wang, J. Effect of environmental temperature and humidity on milk production and milk composition of Guanzhong dairy goats. Vet. Anim. Sci. 2020, 9, 100121. [Google Scholar] [CrossRef] [PubMed]
  36. Yoon, J.T.; Lee, J.H.; Kim, C.K.; Chung, Y.C.; Kim, C.H. Effects of Milk Production, Season, Parity and Lactation Period on Variations of Milk Urea Nitrogen Concentration and Milk Components of Holstein Dairy Cows. Asian-Australas. J. Anim. Sci. 2004, 17, 479–484. [Google Scholar] [CrossRef]
  37. Bernabucci, U.; Basirico, L.; Morera, P.; Dipasquale, D.; Vitali, A.; Piccioli Cappelli, F.; Calamari, L. Effect of summer season on milk protein fractions in Holstein cows. J. Dairy Sci. 2015, 98, 1815–1827. [Google Scholar] [CrossRef] [PubMed]
  38. Bertocchi, L.; Vitali, A.; Lacetera, N.; Nardone, A.; Varisco, G.; Bernabucci, U. Seasonal variations in the composition of Holstein cow’s milk and temperature-humidity index relationship. Animal 2014, 8, 667–674. [Google Scholar] [CrossRef]
  39. Lim, D.H.; Mayakrishnan, V.; Ki, K.S.; Kim, Y.; Kim, T.I. The effect of seasonal thermal stress on milk production and milk compositions of Korean Holstein and Jersey cows. Anim. Biosci. 2021, 34, 567–574. [Google Scholar] [CrossRef]
  40. Ali, M.A.; Sarker, M.A.H.; Hossain, M.N.; Rahman, A.; Islam, M.N.; Sumaiya, A.; Hasan Mohammad, M.; Debnath, G.K.D.; Chanda, T. Potential Impact of Temperature and Humidity on Milk Yield of Holstein Friesian Crossbred Dairy Cows. Eur. J. Agric. Food Sci. 2023, 5, 126–130. [Google Scholar] [CrossRef]
  41. Yang, L.; Yang, Q.; Yi, M.; Pang, Z.H.; Xiong, B.H. Effects of seasonal change and parity on raw milk composition and related indices in Chinese Holstein cows in northern China. J. Dairy Sci. 2013, 96, 6863–6869. [Google Scholar] [CrossRef]
  42. Barash, H.; Silanikove, N.; Shamay, A.; Ezra, E. Interrelationships Among Ambient Temperature, Day Length, and Milk Yield in Dairy Cows Under a Mediterranean Climate. J. Dairy Sci. 2001, 84, 2314–2320. [Google Scholar] [CrossRef]
  43. Toghdory, A.; Ghoorchi, T.; Asadi, M.; Bokharaeian, M.; Najafi, M.; Ghassemi Nejad, J. Effects of Environmental Temperature and Humidity on Milk Composition, Microbial Load, and Somatic Cells in Milk of Holstein Dairy Cows in the Northeast Regions of Iran. Animals 2022, 12, 2484. [Google Scholar] [CrossRef]
  44. Kljajevic, N.V.; Tomasevic, I.B.; Miloradovic, Z.N.; Nedeljkovic, A.; Miocinovic, J.B.; Jovanovic, S.T. Seasonal variations of Saanen goat milk composition and the impact of climatic conditions. J. Food Sci. Technol. 2018, 55, 299–303. [Google Scholar] [CrossRef] [PubMed]
  45. Lee, D.; Yoo, D.; Kim, H.; Seo, J. Negative association between high temperature-humidity index and milk performance and quality in Korean dairy system: Big data analysis. J. Anim. Sci. Technol. 2023, 65, 588–595. [Google Scholar] [CrossRef] [PubMed]
  46. Gálik, R.; Lüttmerding, G.; Boďo, Š.; Knížková, I.; Kunc, P. Impact of Heat Stress on Selected Parameters of Robotic Milking. Animals 2021, 11, 3114. [Google Scholar] [CrossRef] [PubMed]
  47. Hammami, H.; Vandenplas, J.; Vanrobays, M.L.; Rekik, B.; Bastin, C.; Gengler, N. Genetic analysis of heat stress effects on yield traits, udder health, and fatty acids of Walloon Holstein cows. J. Dairy Sci. 2015, 98, 4956–4968. [Google Scholar] [CrossRef]
  48. Rong, Y.; Zeng, M.; Guan, X.; Qu, K.; Liu, J.; Zhang, J.; Chen, H.; Huang, B.; Lei, C. Association of HSF1 Genetic Variation with Heat Tolerance in Chinese Cattle. Animals 2019, 9, 1027. [Google Scholar] [CrossRef]
  49. Bouraoui, R.; Lahmar, M.; Majdoub, A.; Djemali, M.N.; Belyea, R. The relationship of temperature-humidity index with milk production of dairy cows in a Mediterranean climate. Anim. Res. 2002, 51, 479–491. [Google Scholar] [CrossRef]
  50. Moallem, U.; Altmark, G.; Lehrer, H.; Arieli, A. Performance of high-yielding dairy cows supplemented with fat or concentrate under hot and humid climates. J. Dairy Sci. 2010, 93, 3192–3202. [Google Scholar] [CrossRef]
  51. Mukherjee, J.; De, K.; Chaudhury, M.; Dang, A.K. Seasonal variation in in vitro immune activity of milk leukocytes in elite and non-elite crossbred cows of Indian sub-tropical semi-arid climate. Biol. Rhythm. Res. 2015, 46, 425–433. [Google Scholar] [CrossRef]
  52. Hagiya, K.; Bamba, I.; Osawa, T.; Atagi, Y.; Takusari, N.; Itoh, F.; Yamazaki, T. Length of lags in responses of milk yield and somatic cell score on test day to heat stress in Holsteins. Anim. Sci. J. 2019, 90, 613–618. [Google Scholar] [CrossRef]
Figure 1. Average values for monthly and seasonal temperature, relative humidity, and THI recorded during 2021.
Animals 13 03205 g001
Figure 2. Seasonal variations in milk yield, composition (fat, protein, solids-not-fat), somatic cell count, and total bacterial count. a, b, c, d Mean values without a common superscript are significantly different (p < 0.05).
Animals 13 03205 g002
Figure 3. The effect of months on the average milk yield, composition (fat, protein, solids-not-fat), somatic cell count, and total bacterial count. a, b, c, d, e, f, g, h, i Mean values without a common superscript are significantly different (p < 0.05).
Animals 13 03205 g003
Figure 4. The effect of THI on the average milk yield, composition (fat, protein, solids-not-fat), somatic cell count, and total bacterial count.
Animals 13 03205 g004
Table 1. Descriptive statistics of milk composition, microbial load, and somatic cell count in bulk milk tanks of 10 herds in 2021.
VariableLabelNMeanStd DevMinimumMaximum
Temperature, °CT°C365018.88.940.535.1
Relative Humidity, %RH365068.013.1931.097.4
Temperature-Humidity IndexTHI365019.210.69−3.637.7
Milk Yield, kg/dayMY365028.34.3316.540.0
Milk Fat, %MF36503.420.1942.894.06
Milk Protein, %MP36503.140.0772.863.47
Solids-Not-Fat, %SNF36508.120.2977.259.08
pHpH36506.720.0416.307.14
Somatic Cell Count, log10 cells/mLSCC36503.920.4932.495.12
Total Bacterial Count, CFU/mLTBC365096017031.810031,970
Table 2. Analysis of correlation coefficients between measured parameters of milk yield, milk composition and environmental factors.
Items12345678910111213
1Herd1.00
2Seasons0.00 1.00
3Months0.00 −0.05 **1.00
4AT0.00 −0.65 **0.23 **1.00
5RH0.00 0.21 **−0.15 **−0.59 **1.00
6THI0.00 −0.65 **0.23 **1.00 **−0.58 **1.00
7MY−0.60 **0.43 **−0.24 **−0.59 **0.28 **−0.59 **1.00
8Fat0.09 **0.33 **−0.13 **−0.46 **0.22 **−0.46 **0.25 **1.00
9Protein−0.17 **0.21 **−0.05 **−0.22 **0.15 **−0.22 **0.23 **0.43 **1.00
10SNF0.02 ns0.34 **−0.12 **−0.44 **0.23 **−0.45 **0.28 **0.96 **0.66 **1.00
11pH−0.11 **0.10 **−0.10 **−0.09 **0.05 **−0.10 **0.13 **0.03 ns0.02 ns0.03 *1.00
12SCC−0.27 **−0.20 **0.03 ns0.39 **−0.19 **0.39 **−0.08 **−0.17 **0.01 ns−0.13 **0.01 ns1.00
13TBC0.17 **−0.37 **−0.07 **0.36 **−0.11 **0.36 **−0.32 **−0.23 **−0.11 **−0.22 **−0.04 *0.13 **1.00
AT, ambient temperature; RH, relative humidity; THI, temperature-humidity index; MY, milk yield; SNF, solids-not-fat; SCC, somatic cell count; TBC, total bacterial count. *, **, and ns indicate p < 0.05, p < 0.01, and non-significant (p > 0.05), respectively.
Disclaimer/Publisher’s Note: The statements, opinions and data contained in all publications are solely those of the individual author(s) and contributor(s) and not of MDPI and/or the editor(s). MDPI and/or the editor(s) disclaim responsibility for any injury to people or property resulting from any ideas, methods, instructions or products referred to in the content.

