Simple Summary
ACADL long-chain acyl-CoA dehydrogenase, not only a key enzyme in the initiation step of fatty acid oxidation, but also plays an important role in adipocyte differentiation. In our study, we found that ACADL promotes intramuscular adipocyte differentiation in goats via the TNF signaling pathway. This study provides a theoretical basis for the study of adipocytes differentiation in goat intramuscular adipocytes.
Abstract
Intramuscular fat (IMF) deposits help improve meat quality such as marbling, juicy, flavor and tenderness. Long-chain acyl-CoA dehydrogenase (ACADL) is a key enzyme for catalyzing fatty acid oxidation, and studies have shown ACADL is involved in the deposition and differentiation of intramuscular adipocytes. However, the effect of ACADL on intramuscular adipocytes differentiation in goats needs further study. In this study, to explore the mechanism of ACADL on the development of goat intramuscular adipocytes, we constructed an over-expression plasmids and a SI-RNA of ACADL to explore the function of ACADL on the development of goat IMF. It was found that overexpression of ACADL promoted the differentiation of goat intramuscular adipocytes, and promoted the expression of fat cell differentiation marker genes lipoprotein lipase (LPL), peroxisome proliferator activated receptor gamma (PPARγ), APETALA-2-like transcription factor gene (AP2), CCAT enhancer binding protein (CEBPα), preadipocyte Factor 1 (Pref-1) and CCAT enhancer binding protein (CEBPβ), and the opposite trend occurred after interference. In addition, we screened of this related tumor necrosis factor (TNF) signaling pathway by RNA-Seq. So, we validate the signaling pathway with inhibitor of TNF signaling pathway. In summary, these results indicate that ACADL promotes intramuscular adipocytes differentiation through activation TNF signaling pathway. This study provides an important basis for the mechanism of IMF development.
1. Introduction
Lamb has low cholesterol and excellent tenderness, so people pay great attention to the traits of mutton, including meat’s color, marbling, tenderness, and flavor. Adipose tissue plays an important role in maintaining energy homeostasis, supporting vital activity of the body [1]. Among the four important fat deposits (visceral, subcutaneous, intermuscular, and intramuscular fat (IMF)), IMF is considered one of the most important factors affecting meat quality, and its deposition helps to improve the quality of meat, such as marbling, juiciness, flavor, and tenderness [2,3]. Therefore, methods to improve of IMF deposition are important for the improvement of meat quality and studying the mechanism of adipogenesis [4]. Studies has shown that the adipogenesis process was associated with transcriptional factors, such as CCAT enhancer binding protein (CEBP): CEBPβ; CEBPα; PPARγ, and SREBP-1 [5,6,7].
ACADL is the key enzyme in catalyzing fatty acid oxidation [8], which belongs to a family of four closely related, chain length-specific acyl-CoA dehydrogenases: very long chain (ACADCL), long chain (ACADL), middle chain (ACADM), and short chain acyl-CoA dehydrogenases (ACADS) [9]. Stylissatin A (SA) and its derivatives might suppress the β-oxidation of fatty acids by ACADL, and the accumulation of fatty acids on macrophages would inhibit the nuclear factor-kappa B (NF-κB) signaling pathway [10]. Furthermore, ACADL has been shown to be associated with the deposition and differentiation of yak IMF (Wang et al., 2020), and ACADL deficiency can lead to severe hepatic and cardiac lipidosis, hypoglycemia and hepatic insulin resistance [11,12]. However, the effect of ACADL on intramuscular adipocytes differentiation in goats needs further study.
In this study, the regulatory effect of ACADL on intramuscular adipocyte differentiation in goats was studied by overexpression and interference. It was found that overexpression of ACADL promoted the differentiation of goat intramuscular adipocytes, and promoted the expression adipocytes differentiation marker genes LPL, PPARγ, AP2, CEBPα, Pref-1, and CEBPβ, and the opposite trend occurred after interference. To further explore the mechanism, RNA-seq techniques were performed to compare the differences between overexpression ACADL and control groups. We selected the TNF-signaling pathway from RNA-Seq results based on KEGG enrichment analysis and ACADL association pathway research reports. We investigated whether ACADL promotes intramuscular fat cell differentiation through the TNF-signaling pathway. Our experiments provide sufficient evidence that overexpression of ACADL promotes intramuscular preadipocytes differentiation in goats by activating the TNF-signaling pathway, and that the promoted trend is restored after the action of TNF-signaling pathway inhibitors (S1029). The above results show that the specific mechanism of ACADL to promote intramuscular adipocyte differentiation is elaborated.
2. Materials and Methods
2.1. Cell Culture
Our experiments meet the requirements of ethical treatment of Experimental Animals of China, and meet the requirements of the “List of Ethical Treatment of Laboratory Animals in China”. We purchased 1-year old Jian Zhou Da-er goat from Dageda animal husbandry (Sichuan, China). Isolation of intramuscular pre-adipocytes and culture of goat pre-adipocytes were both reported previously [13,14]. Briefly, the intramuscular adipocytes were isolation by using Type I collagenase. The longissimus dorsi were excised from 7-day-old goats and minced. Collagenase Type Ⅱ (37 °C, 1.5 h) (Sigma, Shanghai, China) and collagenase Type Ⅰ (37 °C, 1 h) (Sigma) are used to digest the pellets of longissimus dorsi. Enzymatic digestion was terminated by the same volume of DMEM/F12 (Hyclone, Logan, UT, USA) supplemented with 10% FBS (Gemin, Beijing, China). The suspension was filtered through a 75 µm nylon cell strainer, and then centrifuged at 750 rpm/min for 5 min. After disposing of the red blood cell lysed solution, the suspension was centrifuged at 750 rpm/min for 5 min again. The preadipocytes are resuspended in DMEM/F12 supplemented with 10% FBS, and diluted to a final concentration of 106 cells/ml. The cells were cultured at 37 °C under a humidified atmosphere containing 5% CO2.
2.2. Construction of Overexpression Vectors and siRNA of ACADL
In the early stage, we successfully cloned the goat ACADL gene using the liver tissue of goats as a template (stored by key laboratory of Qinghai-Tibetan Plateau Animal Genetic Resource Reservation and Utilization, Ministry of Education, Southwest Minzu University). In this study, we successfully built the ACADL overexpression vector (OE: PCDNA3.1-ACADL) with the control group PCDNA3.1. The goat ACADL interference sequence (n = 3) and negative control (NC) sequence were synthesized by Shanghai Gene pharma Bio Company. The information of ACADL shown in Table 1.

Table 1.
Information of sequences and primers.
2.3. Oil Red O and Bodipy Staining
The staining method was performed by Xiong et al. [15,16]. Briefly, fix cells with 4% formaldehyde for 30 min (500 μL per well) and washed three times with PBS (800 μL per well, reaction for 5 min). Cells were then stained for 20 min using oil red O solution (Solaibo, Beijing, China) and Bodipy solution. After staining, the cells were imaged using a microscope (Olympus TH4, Tokyo, Japan) to obtain a magnified view. Finally, the oil red dye was extracted with 100% isopropanol and the extent of differentiation was determined by measuring the absorbance at 490 nm.
2.4. Cell Transfection
When goat intramuscular preadipocytes growth was confluent to 80%, we transfected ACADL overexpression and siRNA into cells according to the tubrofect transfection reagent (Thermo scientific, Waltham, MA, USA) instructions. We aspirated the medium 4 h before transfection, re-added 2 mL of fetal bovine serum medium (Hyclone, Logan, UT, USA), incubated for four hours, and transfected 4 μL of transfection reagent (Thermo, Waltham, MA, USA), 400 μL of OPTI-MEM (Gibco, Shanghai, China), and 1000 ng of no-load PCDNA3.1 or ACADL overexpression plasmid (and corresponding plasmid). Adipocytes were collected 48 h after induction of differentiation.
2.5. qRT-PCR
Total RNA was extracted by Trizol reagent and reversely transcribed into cDNA. The effect of overexpression ACADL and silencing ACADL, and other marker genes (SREBP-1, LPL, PPARγ, AP2, CEBPα, PREF-1, and CEBPβ) for differentiation through qPCR protocol. Ubiquitously expressed transcript gene (UXT) was used as internal housekeeping gene to normalize the mRNA levels. The PCR reaction procedure, including pre-degeneration (95 °C, 3 min), degeneration (95 °C, 10 s), annealing (60 °C, 10 s), and extension (72 °C, 15 s), 38 cycles for degeneration, annealing, and extension. The data were analyzed by the 2−ΔΔCt method [17]. The information of marker genes primers, as shown in Table 1.
2.6. Library Preparation for Transcriptome Sequencing
Total RNA was used as input material for the RNA sample preparations. Briefly, mRNA was purified from total RNA using poly-T oligo-attached magnetic beads. Fragmentation was carried out using divalent cations under elevated temperature in First Strand Synthesis Reaction Buffer (5X). First strand cDNA was synthesized using a random hexamer primer and M-MuLV Reverse Transcriptase (RNase H). Second strand cDNA synthesis was subsequently performed using DNA Polymerase I and RNase H. Remaining overhangs were converted into blunt ends via exonuclease/polymerase activities. After adenylation of 3′ ends of DNA fragments, adaptor with hairpin loop structure were ligated to prepare for hybridization. In order to select cDNA fragments of preferentially 370~420 bp in length, the library fragments were purified with AMPure XP system (Beckman Coulter, Beverly, MA, USA). Then, PCR was performed with Phusion High-Fidelity DNA polymerase, Universal PCR primers and Index (X) Primer. At last, PCR products were purified (AMPure XP system) and library quality was assessed on the Agilent Bioanalyzer 2100 system [18].
2.7. Quality Control, GO and KEGG Enrichment Analysis of Differentially Expressed Genes
Raw data of fast format were firstly processed through in-house per scripts. In this step, clean data were obtained by removing reads containing adapter, reads 1 containing ploy-N and low-quality reads from raw data. At the same time, Q20, Q30, and GC content clean data were calculated. All the downstream analyses were based on the clean data with high quality.
Gene Ontology (GO) enrichment analysis of differentially expressed genes was implemented by the cluster Profiler R package, in which gene length bias was corrected. GO terms with corrected p-value less than 0.05 were considered significantly enriched by differential expressed genes. KEGG is a database resource for understanding high-level functions and utilities of the biological system, such as the cell, the organism, and the ecosystem, from molecular-level information, especially large-scale molecular datasets generated by genome sequencing and other high-through put experimental technologies http://www.genome.jp/kegg/ (accessed on 8 August 2021). We used cluster Profiler R package to test the statistical enrichment of differential expression genes in KEGG pathways.
2.8. Statistical Analysis
Take advantage graph-pad 5.0 to prepare graph. Variation was considered statistically significant at “*” p < 0.05, “**” p < 0.01. In this study, all experiments were repeated three times.
2.9. MTT Assay
MTT assays were used to detect the effects of TNF pathway inhibitors on cell viability. Goat intramuscular adipocytes were seeded in 96-well plates at a density of 2 × 10³ cells per well. After 0 and 12 h of cell treatment, we added 10 μL MTT reagent (Slarbio, Beijing, China) to each well, away from light, and then incubated the cells with 5% CO2 for 4 h at 37 °C. Finally, absorbance was measured at a wavelength of 490 nm.
3. Results
3.1. The effect of ACADL on the Intramuscular Preadipocytes Differentiation
As shown in Figure S1, the mRNA expression level of the ACADL gene was accompanied by a trend of increasing and then decreasing along with the differentiation of intramuscular adipocytes. Suggests that ACADL may be involved in the process of intramuscular fat fraction. To explore the effect of ACADL in regulating the differentiation of goat intramuscular adipocytes, we transfected ACADL over-expression vector (OE) and ACADL-interference (SI) and their corresponding to control vector and negative control (NC) groups into intramuscular adipocytes. The expression level of ACADL was largely upregulated compared to the vector (Figure 1A). For morphology, there were more lipid droplets stained by Bodipy dye and Oil red in the OE group than vector group (Figure 1B). Consistently, OD values at 490 nm in OE group was significantly higher than vector group (Figure 1C). Adipocytes differentiation was regulated by many adipogenesis transcription factors [19]. So, we detected the mRNA levels of these genes. The results showed that the overexpression of ACADL significantly upregulated the mRNA levels of LPL (p < 0.01), PPARγ (p < 0.01), CEBPα (p < 0.05), and PREF-1(p < 0.05). However, the mRNA levels of AP2 (p < 0.05), and CEBPβ (p < 0.05) were downregulated (Figure 1D).

Figure 1.
Over-expression of goat ACADL promotes intramuscular adipocytes differentiation. (A) mRNA expression of ACADL was detected by qPCR after over-expressing ACADL for 48 h intramuscular adipocyte differentiation. (B) Photos of Bodipy staining and Oil red staining of the cells in the tests group (OE) and negative control group (NC) during intramuscular adipocyte differentiation. (C) The OD value of Oil red O staining at 492 nm during intramuscular adipocytes differentiation. (D) Effect of goat ACADL overexpression on the expression of adipocytes related genes. “*” significant difference and “**” very significant difference.
To further explore the effect of ACADL on intramuscular adipocytes, q-PCR was used to detect the expression of ACADL after ACADL interference. As shown in Figure 2A, the expression of ACADL decreased about 80% to that of NC group. Bodipy staining showed that the number of adipocytes decreased significantly after silencing ACADL (Figure 2B). Oil red O staining showed that the silence of ACADL inhibited lipid droplet accumulation. Consistently, OD value at 490 nm exhibited a decrease signal (Figure 2C). Conversely, the results showed silence of ACADL downregulated the expression levels of LPL (p < 0.05), PPARγ (p < 0.05), CEBPα (p < 0.05), and PREF-1 (p < 0.05), while upregulated the expression of SREBP-1 (p < 0.01) and CEBPβ (p < 0.01, Figure 2D). These data indicate that ACADL promotes the differentiation of goat intramuscular adipocytes.
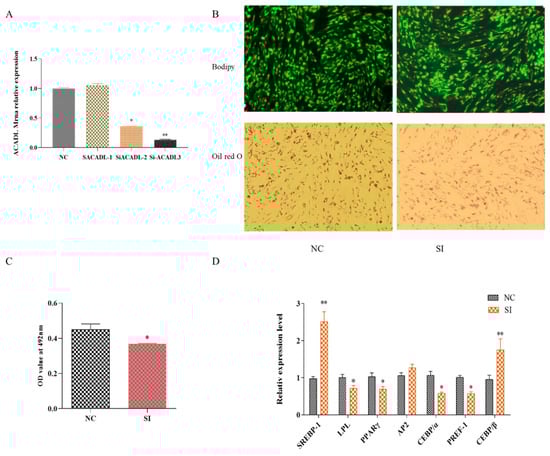
Figure 2.
The effect of ACADL interference on goat adipocyte differentiation. (A) Expression efficiency detection after ACADL interference. (B) Morphology observation of Oil red O staining. (C) Oil red O staining showed the OD value at 492 nm during the differentiation of intramuscular adipocytes. (D) Effect of goat ACADL overexpression on adipocytes related gene’s expression. “*” significant difference and “**” very significant difference.
3.2. RNA-Seq of ACADL Overexpression
After adipocytes differentiation for 48 h a significant increase in the degree of aggregation of lipid droplets (Figure 3A,B) and upregulation of the relative expression levels of CEBPα, PPARγ, and LPL marker genes can be observed (Figure 3C), which indicated that the differential fat cell model was successfully constructed.

Figure 3.
Adipocytes differentiated for 2 days. (A) Oil red staining, pre-differentiation (PD), after differentiation (AD). (B) OD value of preadipocytes and adipocytes, relative expression of ACADL. (C,D) Expression level of marker genes. “*” significant difference and “**” very significant difference.
3.3. Sequencing Data Quality Assessment
To illustrate the differentiation mechanism of ACADL on regulating goat differentiation intramuscular adipocytes differentiation more clearly, we performed RNA-Sequencing of ACADL overexpression (Figure S2A). After quality filtration, 6 samples were used in this study regulatory effect of ACADL on differentiation of goat intramuscular adipocytes. The total RNA, RIN values, A260 nm/A230 nm, A260 nm/280 nm, and 28 s/18 s of 6 samples used in this study (control group NC, CS NC1 to 3, experimental group OE-ACADL, CS S1 to 3) met the criteria required for transcriptome sequencing (Figure S1B, Table 2). In addition, in order to ensure the quality and reliability of data analysis, the original data need to be filtered (Figure S2C). The results showed 14.26 G raw data and the effective data volume of each sample was distributed 6.35 G–6.61 G, average GC content was about 50.755 (Figure S2D, Table 2), and the Q30 base distribution was 90.88–92.32, indicating that base reading of the sequencing data was obtained with high accuracy. The total mapping is above 94%, and the unique mapped reads were between 88.09% and 88.21%. In addition, transcripts were compared to genomic justice chains and antisense chains in similar proportions (Figure S2E). The above indicates that the sequencing data are good and the data utilization rate is high, which provides a reliable basis for further analysis.
Table 2.
Raw data and quality control data of each sample group.
3.4. Analysis of Gene Expression
Quantitative analysis of the gene expression level was performed separately on each sequenced sample, and the amount of gene expression after overexpression was higher than that of the control group (Figure 4A). Correlation analysis of RNA-Seq samples showed that the samples were divided into two groups, and the relative relationship between the samples was 0.969 (Figure 4B). The co-expression Venn plot shows the number of genes co-expressed in the two groups/samples (Figure 4C), indicating that the expression patterns between samples in the group had a high degree of similarity. To identify differentially expressed genes (DEGs) between differential expressed mRNAs in intramuscular adipocytes after expression of ACADL were analyzed by DEG-Seq software ((p < 0.05), log2FC > 1), a total of 246 genes, of which 136 genes were upregulated and 110 genes were downregulated (Figure 4D). Then, clustering of differentially expressed mRNAs was performed, and intramuscular adipocytes sample before and after overexpression were clustered together (Figure 4E). It was worth noting that, from the statistical analysis of single nucleotide polymorphism (SNP), after overexpression of ACADL, the missense mutation in the mutation function of SNP (Figure S3A), the INTRON in the mutant region (Figure S3B), and the MODIFIER in the mutation effect were significantly better than in the control group (Figure S3C). Together, ACADL overexpression causes more gene expression and leads to functional changes.
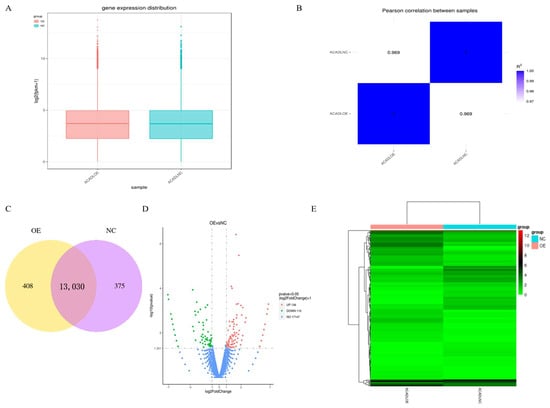
Figure 4.
Gene expression analysis. (A) Distribution of gene expression. (B) Heat map of sample-to-sample correlation. The horizontal ordinate coordinates in the plot are the squares of the correlation coefficients for each sample. (C) Co-expression of Venn diagram. The number of genes uniquely expressed in each group, overlapping regions showing the number of genes co-expressed in two groups. (D) Differential gene volcano. The abscissa is the log2FoldChange value, the ordinate is log10padjust or -log10p-value, and the blue dotted line indicates the threshold line of the differential gene-screening criteria. (E) Heat map of differentially expressed gene clusters. Abscissa is the sample name, and the ordinate coordinate was the value of the FFPKM normalization of the differential gene, the redder the color, the higher the expression, the greener, and the lower the expression.
In the GO database, genes were divided into three catalogs: molecular function (MF), cellular component (CC) and biological process (BP), the number of gene-rich entries was metal-ion homeostasis (CC, 10), signaling receptor binding (MF,10), molecular function regulatory (MF, 10), receptor ligand activity (MF,6) and ion channel activity (MF,6) (Figure 5A). So, molecular function contains the most genes. To further confirm the potential function of DEGs in intramuscular adipocytes differentiation effect by ACADL. KEGG enrichment analysis showed that differentially expressed genes were significantly enriched in the top 20 signaling pathways (Figure 5B). Genes are significantly enriched in TNF, cytokine–cytokine receptor interactions, necrotizing apoptosis, tyrosine metabolism, and other signaling pathways (p < 0.05, Figure 5B). TNF pathway was the most likely and has rarely been studied in studies related to adipocytes differentiation. We used q-PCR analysis to confirm the accuracy of sequencing data, the same trend between the RNA-Seq and q-PCR was observed (Figure 5C–F).

Figure 5.
Enrichment analysis. (A) GO enrichment analysis histogram. The abscissa was GO term, the ordinate was the significance level of GO term enrichment, represented by −log10 (p-value, and different colors indicate different functional classifications. (B) KEGG enrichment scatter plot. The abscissa coordinate is the ratio of the number of differential genes to the total number of differential genes annotated to the KEGG pathway, and the ordinate is the KEGG pathway, red circles indicate the selected pathway (C–F) Validation of representative by q-PCR (n = 5) Log2p-value. TNFAIP3: tumor necrosis factor induced protein 3, CCL5: chemokine ligand 5, CCL20: chemokine ligand 20, SELE: selectin endothelial an adhesion molecule.
3.5. TNF Pathway Rescues the Effect of ACADL Overexpression in Goat Intramuscular Adipocytes Differentiation
The RNA-Seq data showed that DEGs were enriched in the TNF pathway, and TNFAIP3 is one of main component to this pathway [20]. Reported research shows that lenalidomide S1093 (CC-5013) was a specific inhibitor in TNF signaling pathway [21], it was used to determine whether the inhibition TNF pathway rescues the effect of ACADL overexpression in goat intramuscular adipocytes differentiation. Since the concentration of the inhibitor has an effect on cell activity, as well as adsorption capacity [22]. To ensure the accuracy of the experiment and to reduce other interfering factors through the possible reduction in the experiment, we set the effect of different concentrations (0.1 μM, 0.3 μM, 0.5 μM, 1.5 μM, and 3.5 μM) on the ACADL expression for the detection of inhibitor efficiency, and the results showed that inhibitor efficiency was optimal at 2.5 μM (Figure 6A). MTT results showed that there was no difference of OD values in each group when compared to the blank control group at the same time point (Figure 6B), which indicates that cell viability is not affected. TNF inhibitor treat had fewer number of adipocytes lipid droplets (Figure 6C). In accordance with the above results, the inhibitors rescue the expression level of ACADL after overexpression (Figure 6C). OD value results trend was consistent with Figure 6C (Figure 6D). The OD value of the inhibitor treatment group was significantly lower than that of the control group, and had an attenuating effect on the ACADL overexpression treatment group.
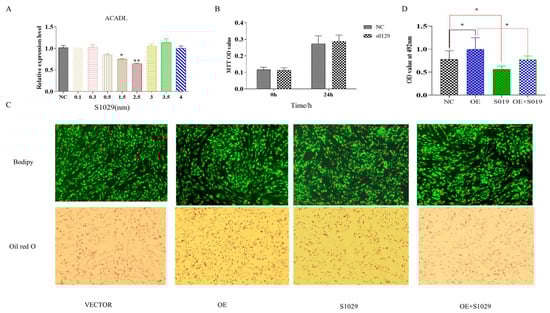
Figure 6.
Overexpression of ACADL promotes intramuscular adipocytes differentiation through TNF-signaling pathway. (A) The mRNA level of ACADL in inhibitors of different concentrations. (B) MTT for the detection of cell activity over different time period. Screening of inhibitors for optimal concentrations (Unit nm). (C) The image of Bodipy and Oil red O staining of intramuscular adipocytes in VECTOR, OE, inhibitor, and OE combined with inhibitor. (D) OD value of VECTOR, OE, inhibitor, and OE combined with inhibitor. “*” significant difference and “**” very significant difference.
Moreover, under the action of inhibitors, the TNF-signaling pathway gene appears to have an upregulated trend (Figure 7a), ACADL and adipocytes-related genes expression appears to be reversed or weakened in response to the overexpression in ACADL (Figure 7b–j).
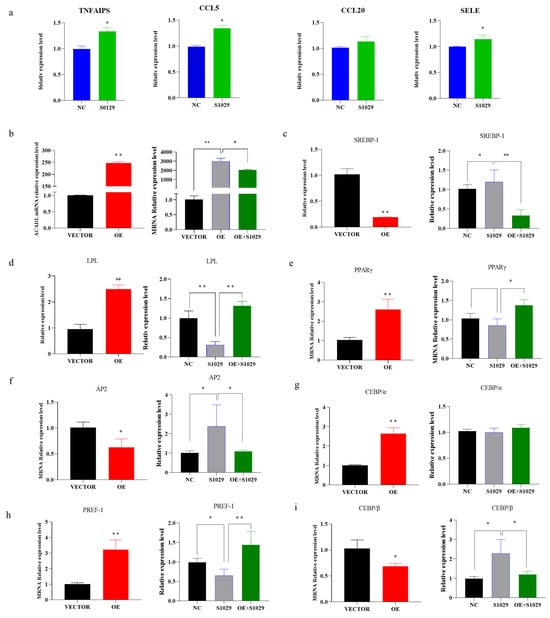
Figure 7.
The recovery of gene expression is under the action of inhibitors. (a) Expression of TNF signaling pathway genes after the action of the inhibitor. (b) The expression of ACADL in different treatment control groups (OE, s1029, OE + S1029). (c–i) The expression level of differentiation marker genes in different treatment control groups. The mRNA level of ACADL (c), SREBP-1 (d), LPL (e), PPARγ (f), AP2 (g), CEBPα (h), PREF-1 (i), and CEBPβ in VECTOR, OE, and OE combined with inhibitors. n = 6, “*” p < 0.05, “**” p < 0.01.
4. Discussion
ACADL has an important role in intramuscular adipocytes differentiation. Research shows that ACADL deficiency causes cardiac lipids and hypoglycemia [12]. Long-chain acyl-CoA dehydrogenase deficiency causes mitochondrial dysfunction and leads to hepatic steatories and hepatic insulin resistance [23]. Research on the effects of ACADL on fat has mainly focused on livestock, such as yaks and pigs, however, research on goats needs to go further. In this study, we investigated the role of ACADL regulating on the goat intramuscular adipocytes by overexpression ACADL and silencing ACADL. Increased aggregation of lipid droplets in intramuscular adipocytes after overexpression of ACADL was observed by Oil red and Bodipy (fluorescent) staining, but decreased the degree of aggregation of lipid droplets in IMF adipocytes after interference. As is known to all, adipocytes differentiation determined by hyperplasia and hypertrophy of intramuscular adipocytes [24]. Intramuscular adipocytes differentiation is a complex event involving many biological processes and transcription factors that are responsible for inducing mature adipocyte formation [25]. PPARγ, CEBPβ, and CEBPα are considered as the important regulators of adipocytes [26]. AP2, SREBP-1, and LPL have been considered positive regulator for adipocyte differentiation, while PREF-1 have been identified as factors negatively regulators for this [27]. In this study, after the overexpression of ACADL, the expression of LPL, PPARγ, CEBPα, and PREF-1 were enhanced. In general agreement with the expected results, the expression levels of SREBP-1, AP2, and CEBPβ were downregulated after ACADL silencing. These results suggest that ACADL may promote intramuscular adipocyte differentiation through upregulation of LPL, PPARγ, and CEBPα. In IMF adipocytes, whether ACADL directly or indirectly modulates the level of the adipogenesis transcription gene mRNA directly or through molecules requires further exploration.
To reveal the potential specific molecular mechanism, RNA-sequencing was performed. Quantitative analysis showed that the number of overexpressed genes was higher than that of the control group (VECTOR). There are 246 differential expression genes (DEGs) intramuscular adipocytes after ADADL overexpression treatment, and the upper 136 genes are more than 110 down-regulated genes. ACADL overexpression causes more gene expression and leads to functional changes. We select the TNF-signaling pathway from KEGG enrichment analysis. Interestingly, studies have shown that TNF promotes the differentiation of intramuscular adipocytes by activating the downstream pathways by secreting the TNFα factor [28]. Similarly, TNF mediates activation of the transcription factor NFκB, which, in turn, regulates the differentiation and maturation of adipocytes [29,30]. So, we thought the TNF-signaling pathway is the best choice among the 20 pathways for KEGG analysis of DEGs. Sequencing yielded four differentially expressed genes: Tumor necrosis factorα inducer protein 3 (TNFAIP3), E-selectin (SELE), CC-chemokine 5 (CCL5), and CC-chemokine 20 (CCL20) enriched in this pathway. TNFAIP3 is the main component of the TNF-signaling pathway, TNFAIP3 is the key factor for mediating the secretion of TNFa [31]. TNFAIP3 inhibits the secretion of TNFa in the TNF-signaling pathway, which, in turn, affects the downstream pathway of the TNF signaling pathway to regulate adipocyte differentiation [32,33]. E-selectin is a key adhesion molecule, and research has reported that elevated soluble E-selectin levels have been identified in hypertension and diabetes [34]. In addition, E-selectin expression is stimulated by exposure to tumor necrosis factor-alpha [35]. CCL5 and CCL20 all belong to the chemokines, and play roles in various pathologic conditions [36]. TNFα directly affects a number of chemokines, including CCL20 [37], and CCL5 selectively activates the downstream JNK pathway of the TNF pathway [38,39,40]. We verified their expression levels through qPCR analysis. Consistently, overexpression of ACADL downregulated expression of TNFAIP3, SELE, CCL5, and CCL20.
To determine the role of ACADL in promoting adipocytes differentiation in goats through the TNF-signaling pathway, we added TNF-pathway inhibitors (S1029) to intramuscular adipocytes for further validation. In intramuscular adipocytes, ACADL overexpression activates TNF pathway, which subsequently lead to increased differentiation of intramuscular adipocytes. Interestingly, the TNF inhibitor treatment OE group rescued the phenotype caused by ACADL expression in a specificity dose manner. Preadipocytes are characterized by the number of cells and enlargement. The TNF-signaling pathway plays an important role in both [41]. In the inhibitor treatment group, the expression of TNPAIP3, SELE, CCL5, and CCL20 was upregulated, which was contrary to the sequencing data and ACADL overexpression treatment group, and demonstrated that the inhibitor is a potent inhibitor of the TNF pathway. The apparent phenomena showed that the inhibitor treatment group significantly reduced the degree of cell differentiation and lipid droplet aggregation, which had a weakening effect on the ACADL overexpression group. Expression of TNFAIP3, SELE, CCL5, and CCL20 in the inhibitor-treated group showed an upward trend, the fat adipocyte differentiation-related genes also showed a reverse trend, and the expression level of S019 in the OE treatment group showed a weakening trend. Therefore, we speculate that ACADL regulates the TNF-signaling pathway and subsequently affects pre-adipocyte differentiation by altering cellular lipid droplet aggregation
5. Conclusions
The overexpression of ACADL promotes adipocytes differentiation and silencing ACADL decreased adipocytes differentiation. Further study showed that TNF-signaling pathway is involved in the regulation of ACADL on the differentiation of adipocytes. In summary, ACADL promotes goat adipocytes differentiation by activating the TNF-signaling pathway.
Supplementary Materials
The following supporting information can be downloaded at: https://www.mdpi.com/2076-2615/13/2/281/s1, Figure S1: ACADL’s expression level during intramuscular adipocyte differentiation, Figure S2: The quality control of RNA-sequencing A- Hands-on sequencing steps, Figure S3: Single nucleotide polymorphism (SNP) Mutation site statistics.
Author Contributions
Conceptualization, A.L.; methodology, Y.W. (Youli Wang); software, Y.W. (Yong Wang); validation, X.L.; formal analysis, W.Q.; investigation, Y.X.; resources, J.Z.; data curation, W.L.; writing—original draft preparation, Y.L. (Yaqiu Lin); writing—review and editing, Y.L. (Yanyan Li); visualization, A.L.; supervision, Y.W. (Youli Wang); project administration, Y.W. (Yong Wang); funding acquisition, Y.L. (Yaqiu Lin). All authors have read and agreed to the published version of the manuscript.
Funding
This study was supported by grants from the National Natural Science Foundation of China (32072723 and 31902154), Sichuan Science and Technology Program (2022JDTD0030) and the Fundamental Research Funds for the Central Universities, Southwest Minzu University (2021057).
Institutional Review Board Statement
The experimental protocols were approved by the Institutional Animal Care and Use Committee of Southwest Minzu University. The experimental animal certification number was 2020086, 2020.
Data Availability Statement
The data used to support of this study are available from the corresponding author on reasonable request.
Conflicts of Interest
The authors declare, there are no competing interests.
Correction Statement
This article has been republished with a minor correction of the information included in the Institutional Review Board Statement. This change does not affect the scientific content of the article.
Abbreviation
| Abbreviation | Content |
| IMF | Intramuscular fat |
| ACADL | Long-chain acyl-CoA dehydrogenase |
| TNF | Tumor necrosis factor |
| PREF-1 | Preadipocyte Factor 1 |
| CEBPβ | CCAT enhancer binding protein |
| CEBPα | CCAT enhancer binding protein |
| PPARγ | Peroxisome proliferator activated receptor gamma |
| SREBP-1 | Sterol regulating element binding protein isoform 1 |
| AP2 | APETALA-2-Like transcription factor gene |
| LPL | Lipoprotein lipase |
| ACADCL | Very long chain acyl-CoA dehydrogenase |
| ACADM | Middle chain acyl-CoA dehydrogenase |
| ACADS | Short chain acyl-CoA dehydrogenases |
| OE ACADL | Over-expression ACADL vector |
| PCDNA3.1 | The control group of oe |
| SI ACADL | Interference of ACADL |
| NC | The negative control group of SI |
| GO | Gene Ontology |
| UXT | Ubiquitously expressed transcript |
| DEGs | Differentially expressed genes |
| SNP | Single nucleotide polymorphism |
| MF | Molecular function |
| CC | Cellular component |
| BP | Biological process |
| CC-5013 | Lenalidomide S1093 was a specific inhibitor in TNF-signaling pathway |
| MTT assay | The method used in this experiment to detect cell viability |
| CCL5 | CC-chemokine 5, a member of the chemokine family |
| CCL20 | CC-chemokine 20, a member of the chemokine family |
| SELE | E-selectin |
| TNFAIP3 | Tumor necrosis factorα inducer protein 3 |
References
- Sethi, J.K.; Vidal-Puig, A.J. Thematic review series: Adipocyte biology. Adipose 14 tissue function and plasticity orchestrate nutritional adaptation. J. Lipid Res. 2007, 48, 1253–1262. [Google Scholar] [CrossRef]
- Miller, R. Drivers of Consumer Liking for Beef, Pork, and Lamb: A Review. Foods 2020, 9, 428. [Google Scholar] [CrossRef]
- Nguyen, D.V.; Nguyen, O.C.; Malau-Aduli, A.E.O. Main regulatory factors of marbling level in beef cattle. Vet. Anim. Sci. 2022, 14, 100219. [Google Scholar] [CrossRef] [PubMed]
- Yao, D.; Su, R.; Zhang, Y.; Wang, B.; Hou, Y.; Luo, Y.; Sun, L.; Guo, Y.; Jin, Y. Impact of dietary Lactobacillus supplementation on intramuscular fat deposition and meat quality of Sunit sheep. J. Food Biochem. 2022, 46, e14207. [Google Scholar] [CrossRef] [PubMed]
- Guo, L.; Li, X.; Tang, Q.Q. Transcriptional regulation of adipocyte differentiation: A central role for CCAAT/enhancer-binding protein (C/EBP) β. J. Biol. Chem. 2015, 290, 755–761. [Google Scholar] [CrossRef] [PubMed]
- Hishida, T.; Nishizuka, M.; Osada, S.; Imagawa, M. The role of C/EBPdelta in the early stages of adipogenesis. Biochimie 2009, 91, 654–657. [Google Scholar] [CrossRef]
- Faghfouri, A.H.; Khajebishak, Y.; Payahoo, L.; Faghfuri, E.; Alivand, M. PPAR-gamma agonists: Potential modulators of autophagy in obesity. Eur. J. Pharmacol. 2021, 912, 174562. [Google Scholar] [CrossRef]
- Zhang, Y.; Bharathi, S.S.; Beck, M.E.; Goetzman, E.S. The fatty acid oxidation enzyme long-chain acyl-CoA dehydrogenase can be a source of mitochondrial hydrogen peroxide. Redox Biol. 2019, 26, 101253. [Google Scholar] [CrossRef]
- Kurtz, D.M.; Tolwani, R.J.; Wood, P.A. Structural characterization of the mouse long chain acyl-CoA dehydrogenase gene and 5′ regulatory region. Mamm. Genome 1998, 9, 361–365. [Google Scholar] [CrossRef]
- Zhang, M.; Sunaba, T.; Sun, Y.; Shibata, T.; Sasaki, K.; Isoda, H.; Kigoshi, H.; Kita, M. Acyl-CoA dehydrogenase long chain (ACADL) is a target protein of stylissatin A, an anti-inflammatory cyclic heptapeptide. J. Antibiot. 2020, 73, 589–592. [Google Scholar] [CrossRef]
- Wang, H.; Zhong, J.; Zhang, C. The whole-transcriptome landscape of muscle and adipose tissues reveals the ceRNA regulation network related to intramuscular fat deposition in yak. BMC Genom. 2020, 21, 347. [Google Scholar] [CrossRef] [PubMed]
- Kurtz, D.M.; Rinaldo, P.; Rhead, W.J. Targeted disruption of mouse long-chain acyl-CoA dehydrogenase gene reveals crucial roles for fatty acid oxidation. Proc. Natl. Acad. Sci. USA 1998, 95, 15592–15597. [Google Scholar] [CrossRef] [PubMed]
- Zhang, D.; Liu, Z.X.; Choi, C.S. Mitochondrial dysfunction due to long-chain Acyl-CoA dehydrogenase deficiency causes hepatic steatosis and hepatic insulin resistance. Proc. Natl. Acad. Sci. USA 2007, 104, 17075–17080. [Google Scholar] [CrossRef] [PubMed]
- Xu, Q.; Lin, S.; Wang, Y.; Zhu, J.; Lin, Y. Fibroblast growth factor 10 (FGF10) promotes the adipogenesis of intramuscular preadipocytes in goat. Mol. Biol. Rep. 2018, 45, 1881–1888. [Google Scholar] [CrossRef] [PubMed]
- Xiong, Y.; Xu, Q.; Lin, S.; Wang, Y.; Lin, Y.; Zhu, J. Knockdown of LXRα inhibits goat intramuscular preadipocyte differentiation. Int. J. Mol. Sci. 2018, 19, 3037. [Google Scholar] [CrossRef]
- Cai, R.; Sun, Y.; Qimuge, N. Adiponectin as lncRNA inhibits adipogenesis by transferring from nucleus to cytoplasm and attenuating adiponectin mRNA 16 translation. Biochim. Biophys. Acta Mol. Cell Biol. Lipids 2018, 1863, 420–432. [Google Scholar] [CrossRef]
- Livak, K.J.; Schmittgen, T.D. Analysis of relative gene expression data using real time quantitative PCR and the 2(-Delta Delta C(T)) Method. Methods 2001, 25, 402–408. [Google Scholar] [CrossRef]
- Parkhomchuk, D.; Borodina, T.; Amstislavskiy, V. Transcriptome analysis by strand-specific sequencing of complementary DNA. Nucleic Acids Res. 2009, 37, e123. [Google Scholar] [CrossRef]
- Gulyaeva, O.; Dempersmier, J.; Sul, H.S. Genetic and epigenetic control of adipose development. Biochim. Biophys. Acta Mol. Cell Biol. Lipids. 2018, 1864, 3–12. [Google Scholar] [CrossRef]
- Voelkl, J.; Tuffaha, R.; Luong, T.T.D. Zinc inhibits phosphate-induced vascular calcification through TNFAIP3-Mediated suppression of NF-κB. J. Am. Soc. Nephrol. 2018, 29, 1636–1648. [Google Scholar] [CrossRef]
- Alaterre, E.; Ovejero, S.; Herviou, L. Comprehensive characterization of the epigenetic landscape in multiple myeloma. Theranostics 2022, 12, 1715–1729. [Google Scholar] [CrossRef] [PubMed]
- Lam, A.; Cao, X.; Eisenthal, R.; Hubble, J. Effect of contact time and inhibitor concentration on the affinity mediated adsorption of cells to surfaces. Enzyme Microb. Technol. 2001, 29, 28–33. [Google Scholar] [CrossRef] [PubMed]
- Chen, X.; Luo, Y.; Huang, Z.; Jia, G.; Liu, G.; Zhao, H. Role of Phosphotyrosine interaction domain containing 1 in porcine intramuscular preadipocyte proliferation and differentiation. Anim. Biotechnol. 2016, 27, 287–294. [Google Scholar] [CrossRef] [PubMed]
- Haczeyni, F.; Bell-Anderson, K.S.; Farrell, G.C. Causes and mechanisms of adipocyte enlargement and adipose expansion. Obes. Rev. 2018, 19, 406–420. [Google Scholar] [CrossRef]
- Farmer, S.R. Transcriptional control of adipocyte formation. Cell Metab. 2006, 4, 263–273. [Google Scholar] [CrossRef]
- Siersbæk, R.; Nielsen, R.; Mandrup, S. Transcriptional networks and chromatin remodeling controlling adipogenesis. Trends Endocrinol. Metab. 2012, 23, 56–64. [Google Scholar] [CrossRef] [PubMed]
- Wang, Y.; Kim, K.A.; Kim, J.H.; Sul, H.S. Pref-1, a preadipocyte secreted factor that inhibits adipogenesis. J. Nutr. 2006, 136, 2953–2956. [Google Scholar] [CrossRef]
- Tada, A.; Islam, M.A.; Kober, A.H. Transcriptome modifications in the porcine intramuscular adipocytes during differentiation and exogenous stimulation with TNF-α and serotonin. Int. J. Mol. Sci. 2020, 21, 638. [Google Scholar] [CrossRef]
- Pham, T.X.; Lee, J.Y. Anti-Inflammatory effect of spirulina platensis in 6 macrophages is beneficial for adipocyte differentiation and maturation by inhibiting nuclear factor-κB pathway in 3T3-L1 adipocytes. J. Med. Food 2016, 19, 535–542. [Google Scholar] [CrossRef] [PubMed]
- Hohmann, H.P.; Brockhaus, M.; Baeuerle, P.A.; Remy, R.; Kolbeck, R.; van Loon, A.P. Expression of the types A and B tumor necrosis factor (TNF) receptors is independently regulated, and both receptors mediate activation of the transcription factor NF-kappa B. TNFalpha is not needed for induction of a biological effect via TNF receptors. J. Biol. Chem. 1990, 265, 22409–22417. [Google Scholar] [CrossRef]
- Urbano, P.C.M.; Aguirre-Gamboa, R.; Ashikov, A. TNF-α-induced protein 3 (TNFAIP3)/A20 acts as a master switch in TNF-α blockade-driven IL-17A expression. J. Allergy Clin. Immunol. 2018, 142, 517–529. [Google Scholar] [CrossRef]
- Hong, J.; Yan, J.; Chen, J. Identification of key potential targets for TNF-α/TNFR1- related intervertebral disc degeneration by bioinformatics analysis. Connect Tissue Res. 2021, 62, 531–541. [Google Scholar] [CrossRef]
- Tan, X.; Cao, Z.; Li, M.; Xu, E.; Wang, J.; Xiao, Y. TNF-α downregulates CIDEC via MEK/ERK pathway in human adipocytes. Obesity 2016, 24, 1070–1080. [Google Scholar] [CrossRef]
- Roldán, V.; Marín, F.; Lip, G.Y.; Blann, A.D. Soluble E-selectin in cardiovascular disease and its risk factors. A review of the literature. Thromb. Haemost. 2003, 90, 1007–1020. [Google Scholar] [CrossRef] [PubMed]
- Ley, K. The role of selectins in inflammation and disease. Trends Mol. Med. 2003, 9, 263–268. [Google Scholar] [CrossRef]
- Kao, C.Y.; Huang, F.; Chen, Y. Up-regulation of CC chemokine ligand 20 expression in human airway epithelium by IL-17 through a JAK-independent but MEK/NF- kappaB-dependent signaling pathway. J. Immunol. 2005, 175, 6676–6685. [Google Scholar] [CrossRef]
- Lee, J.S.; Lee, J.Y.; Son, J.W. Expression and regulation of the CC-chemokine ligand 20 during human tuberculosis. Scand J. Immunol. 2008, 67, 77–85. [Google Scholar] [CrossRef] [PubMed]
- Jamali, Z.; Nazari, M.; Khoramdelazad, H. Expression of CC chemokines CCL2, CCL5, and CCL11 is associated with duration of disease and complications in type-1 diabetes: A study on Iranian diabetic patients. Clin. Lab. 2013, 59, 993–1001. [Google Scholar] [CrossRef] [PubMed]
- Herder, C.; Illig, T.; Baumert, J. RANTES/CCL5 gene polymorphisms, serum concentrations, and incident type 2 diabetes: Results from the MONICA/KORA Augsburg case cohort study, 1984–2002. Eur. J. Endocrinol. 2008, 158, R1–R5. [Google Scholar] [CrossRef]
- Bernfield, M.; Götte, M.; Park, P.W. Functions of cell surface heparan sulfate proteoglycans. Annu. Rev. Biochem. 1999, 68, 729–777. [Google Scholar] [CrossRef]
- Grivennikov, S.I.; Karin, M. Inflammatory cytokines in cancer: Tumour necrosis factor and interleukin 6 take the stage. Ann. Rheum. Dis. 2011, 70 (Suppl. 1), i104–i108. [Google Scholar] [CrossRef] [PubMed]


Disclaimer/Publisher’s Note: The statements, opinions and data contained in all publications are solely those of the individual author(s) and contributor(s) and not of MDPI and/or the editor(s). MDPI and/or the editor(s) disclaim responsibility for any injury to people or property resulting from any ideas, methods, instructions or products referred to in the content. |
© 2023 by the authors. Licensee MDPI, Basel, Switzerland. This article is an open access article distributed under the terms and conditions of the Creative Commons Attribution (CC BY) license (https://creativecommons.org/licenses/by/4.0/).