


Towards Early Poultry Health Prediction through Non-Invasive and Computer Vision-Based Dropping Classification


 ,
,
Abstract
:Simple Summary
Abstract
1. Introduction
2. Related Works
3. Materials and Methods
3.1. Image Segmentation
3.2. Image Classification
3.3. Proposed Model
3.4. Accuracy Evaluation Metrics
4. Data
5. Experimental Results
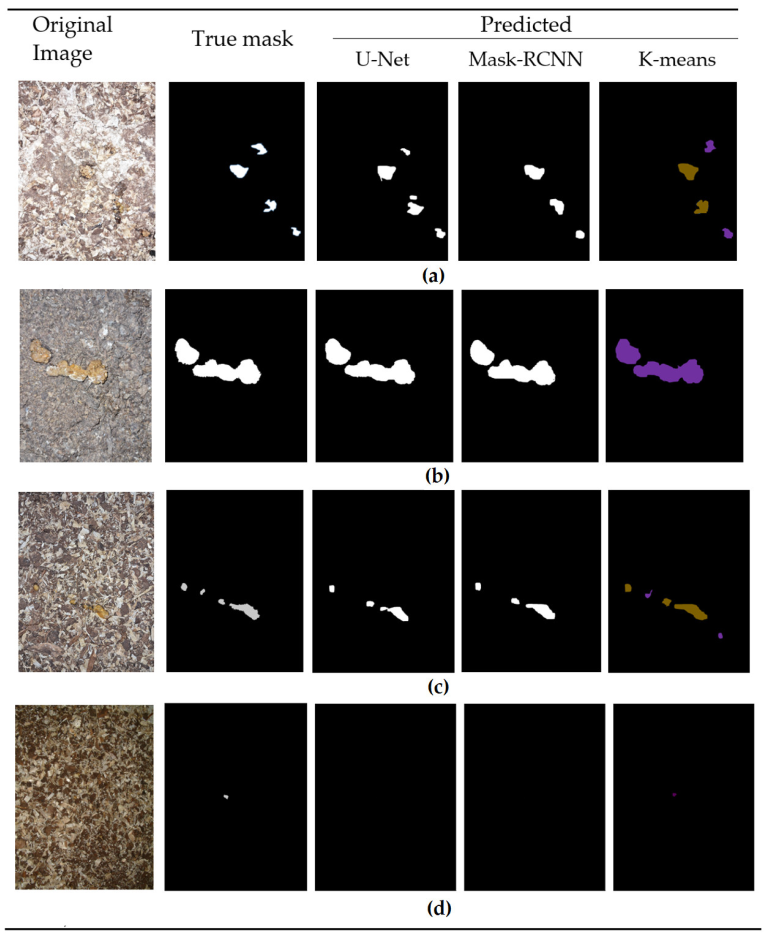
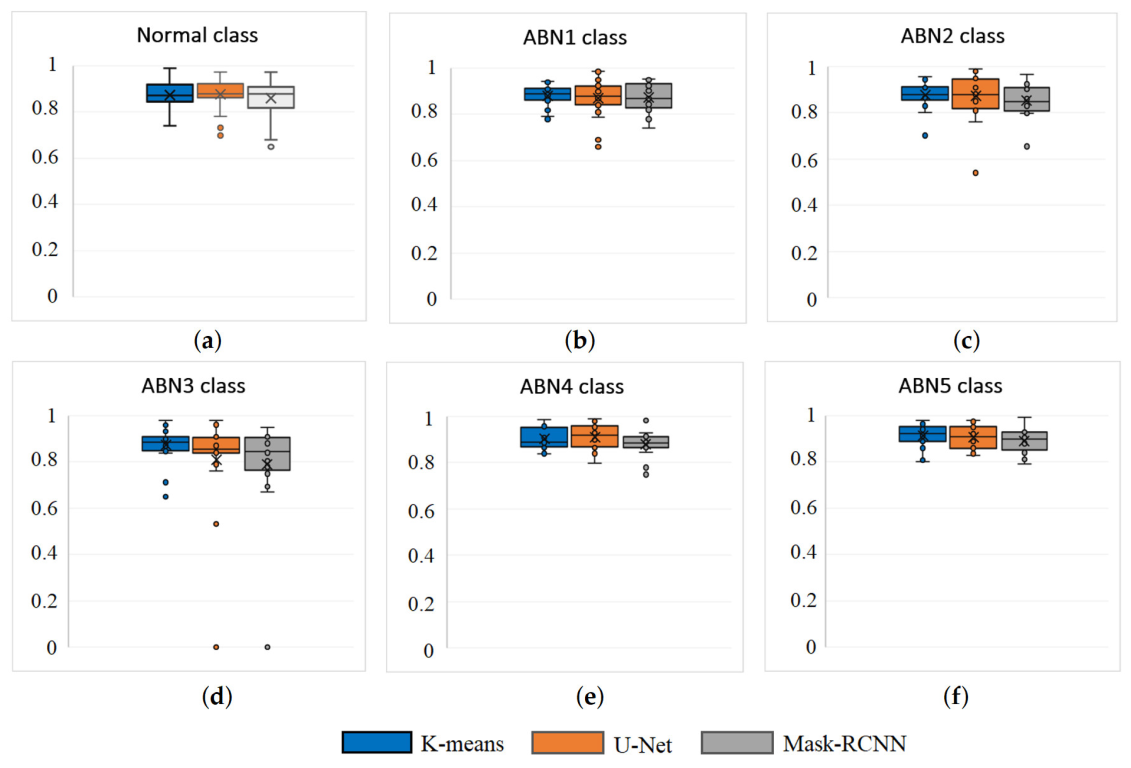
5.1. Segmentation Results
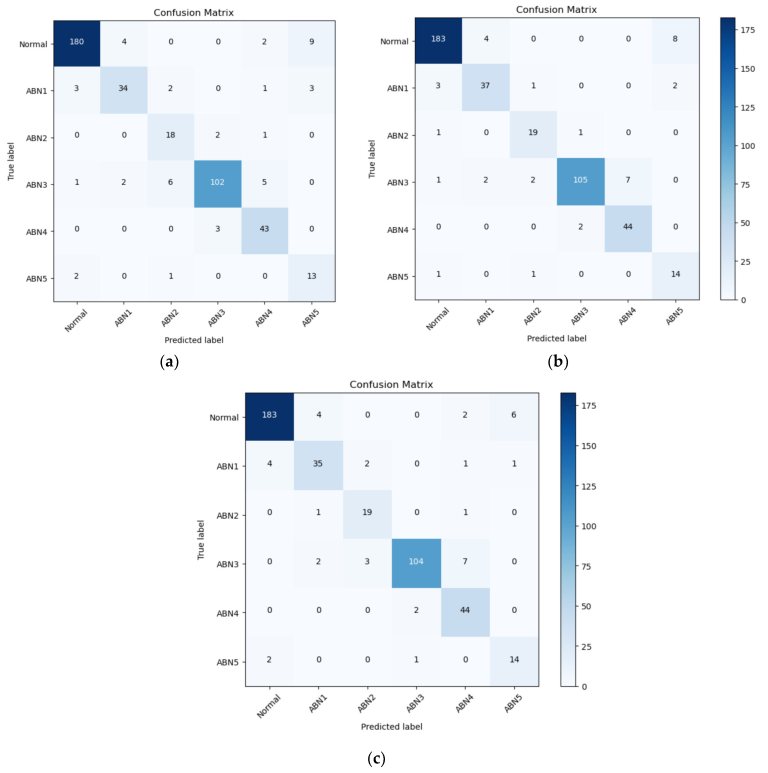
5.2. Classification Results
6. Discussion
7. Conclusions
Author Contributions
Funding
Institutional Review Board Statement
Informed Consent Statement
Data Availability Statement
Conflicts of Interest
References
- Bist, R.B.; Subedi, S.; Chai, L.; Yang, X. Ammonia emissions, impacts, and mitigation strategies for poultry production: A critical review. J. Environ. Manag. 2023, 328, 116919. [Google Scholar] [CrossRef] [PubMed]
- Taneja, A.; Nair, G.; Joshi, M.; Sharma, S.; Sharma, S.; Jambrak, A.R.; Roselló-Soto, E.; Barba, F.J.; Castagnini, J.M.; Leksawasdi, N.; et al. Artificial Intelligence: Implications for the Agri-Food Sector. Agronomy 2023, 13, 1397. [Google Scholar] [CrossRef]
- Baerdemaeker, J. Artificial Intelligence in the Agri-Food Sector: Applications, Risks and Impacts. In The study, Panel for the Future of Science and Technology; EPRS|European Parliamentary Research Service, Scientific Foresight Unit (STOA): Strasbourg, France, 2023; p. 91. ISBN 978-92-848-0190-9. [Google Scholar] [CrossRef]
- Addanki, A.; Patra, P.; Kandra, P. Recent advances and applications of artificial intelligence and related technologies in the food industry. Appl. Food Res. 2022, 2, 100126. [Google Scholar] [CrossRef]
- Nidhi, M.; Jarinah, M.A.; Suhaili, O.; Mariya, H.; Haslaniza, H.; Norliza, A.R. Application of Artificial Intelligence in Food Industry—A Guideline. Food Eng. Rev. 2022, 14, 134–175. [Google Scholar]
- Hrishitva, P.; Adil, A. Role of Computer Science (Artificial Intelligence) In Poultry Management. Devot. J. Community Serv. 2022, 3, 2068–2088. [Google Scholar] [CrossRef]
- Cakic, S.; Popovic, T.; Krco, S.; Nedic, D.; Babic, D.; Jovovic, I. Developing Edge AI Computer Vision for Smart Poultry Farms Using Deep Learning and HPC. Sensors 2023, 23, 3002. [Google Scholar] [CrossRef] [PubMed]
- Okinda, C.; Nyalala, I.; Korohou, T.; Okinda, C.; Wang, J.; Achieng, T.; Wamalwa, P.; Mang, T.; Shen, M. A review on computer vision systems in monitoring of poultry: A welfare perspective. Artif. Intell. Agric. 2020, 4, 184–208. [Google Scholar] [CrossRef]
- Shahbazi, M.; Mohammadi, K.; Derakhshani, S.M.; Groot Koerkamp, P.W.G. Deep Learning for Laying Hen Activity Recognition Using Wearable Sensors. Agriculture 2023, 13, 738. [Google Scholar] [CrossRef]
- Yang, X.; Chai, L.; Bist, R.B.; Subedi, S.; Wu, Z. A Deep Learning Model for Detecting Cage-Free Hens on the Litter Floor. Animals 2022, 12, 1983. [Google Scholar] [CrossRef]
- Ojo, R.O.; Ajayi, A.O.; Owolabi, H.A.; Oyedele, L.O.; Akanbi, L. A Internet of Things and Machine Learning techniques in poultry health and welfare management: A systematic literature review. Comput. Electron. Agric. 2022, 200, 107266. [Google Scholar] [CrossRef]
- Mohanty, R.; Pani, S.K. Chapter 14–Livestock Health Monitoring using a Smart IoT-Enabled Neural Network Recognition System. In Cognitive Data Science in Sustainable Computing, Cognitive Big Data Intelligence with a Metaheuristic Approach; Academic Press: New York, NY, USA, 2022; pp. 305–321. [Google Scholar] [CrossRef]
- Neethirajan, S. ChickTrack–A quantitative tracking tool for measuring chicken activity. Measurement 2022, 191, 110819. [Google Scholar] [CrossRef]
- Kucuktopcu, E.; Cemek, B. Modelling Indoor Environmental Conditions in a Commercial Broiler House. Tarım Bilim. Derg. J. Agric. Sci. 2019, 25, 440–448. [Google Scholar] [CrossRef]
- Fang, C.; Zhang, T.; Zheng, H.; Huang, J.; Cuan, K. Pose estimation and behavior classification of broiler chickens based on deep neural networks. Comput. Electron. Agric. 2021, 180, 105863. [Google Scholar] [CrossRef]
- Mbelwa, H.; Mbelwa, J.; Machuve, D. Deep Convolutional Neural Network for Chicken Diseases Detection. Int. J. Adv. Comput. Sci. Appl. (IJACSA) 2021, 12, 759–765. [Google Scholar] [CrossRef]
- Ahmed, G.; Malick, R.A.S.; Akhunzada, A.; Zahid, S.; Sagri, M.R.; Gani, A. An Approach towards IoT-Based Predictive Service for Early Detection of Diseases in Poultry Chickens. Sustainability 2021, 13, 13396. [Google Scholar] [CrossRef]
- Park, M.; Britton, D.; Daley, W.; McMurray, G.; Navaei, M.; Samoylov, A.; Usher, C.; Xu, J. Artificial intelligence, sensors, robots, and transportation systems drive an innovative future for poultry broiler and breeder management. Anim. Front. 2022, 12, 40–48. [Google Scholar] [CrossRef] [PubMed]
- Moussa, Z.; Darwish, D.B.; Alrdahe, S.S.; Saber, W.I.A. Innovative Artificial-Intelligence- Based Approach for the Biodegradation of Feather Keratin by Bacillus paramycoides, and Cytotoxicity of the Resulting Amino Acids. Front. Microbiol. 2021, 21, 731262. [Google Scholar] [CrossRef] [PubMed]
- Li, X.; Li, Z.; Shen, Q.; Pan, Y.; Dong, X.; Xu, Z.; Duan, S.; Li, Y.; Du, Y.; Chen, S.; et al. HGFDB: A collective database of helmeted guinea fowl genomics. Database 2021, 2021, baaa116. [Google Scholar] [CrossRef] [PubMed]
- Saxena, V.K.; Kolluri, G. Selection methods in poultry breeding: From genetics to genomics. In Application of Genetics and Genomics in Poultry Science; IntechOpen: London, UK, 2018; Volume 19. [Google Scholar] [CrossRef]
- Shi, Y.; Wang, X.; Borhan, M.S.; Young, J.; Newman, D.; Berg, E.; Sun, X. A review on meat quality evaluation methods based on non-destructive computer vision and artificial intelligence technologies. Food Sci. Anim. Resour. 2021, 41, 563. [Google Scholar] [CrossRef] [PubMed]
- Machuve, D.; Nwankwo, E.; Mduma, N.; Mbelwa, J. Poultry diseases diagnostics models using deep learning. Front. Artif. Intell. 2022, 5, 733345. [Google Scholar] [CrossRef]
- Global Poultry Lab Service Fees. Available online: https://www.gapoultrylab.org/services-fees/fees/ (accessed on 23 January 2023).
- Cooperative Extension Veterinary Diagnostic Laboratory: Diagnostic Services & Fees. Available online: https://extension.umaine.edu/veterinarylab/tests-pricing/ (accessed on 23 January 2023).
- Zhu, J.; Zhou, M. Online Detection of Abnormal Chicken Manure based on Machine Vision. In 2021 ASABE Annual International Virtual Meeting; American Society of Agricultural and Biological Engineers: Saint Joseph, MI, USA, 2021. [Google Scholar] [CrossRef]
- Aziz, N.A.; Othman, M.F. Binary classification using SVM for sick and healthy chicken based on chicken’s excrement image. Pertanika J. Sci. Technol. 2017, 25, 315–324. [Google Scholar]
- He, P.; Chen, Z.; Yu, H.; Hayat, K.; He, Y.; Pan, J.; Lin, H. Research Progress in the Early Warning of Chicken Diseases by Monitoring Clinical Symptoms. Appl. Sci. 2022, 12, 5601. [Google Scholar] [CrossRef]
- Wang, J.; Shen, M.; Liu, L.; Xu, Y.; Okinda, C. Recognition and Classification of Broiler Droppings Based on Deep Convolutional Neural Network. J. Sens. 2019, 2019, 3823515. [Google Scholar] [CrossRef]
- Degu, M.Z.; Simegn, G.L. Smartphone based detection and classification of poultry diseases from chicken fecal images using deep learning techniques. Smart Agric. Technol. 2023, 4, 100221. [Google Scholar] [CrossRef]
- Ronneberger, O.; Fischer, P.; Brox, T. U-Net: Convolutional Networks for Biomedical Image Segmentation. In Proceedings of the Medical Image Computing and Computer-Assisted Intervention—MICCAI 2015: 18th International Conference, Munich, Germany, 5–9 October 2015. [Google Scholar] [CrossRef]
- Alahmadi, M.D. Boundary Aware U-Net for Medical Image Segmentation. Arab. J. Sci. Eng. 2022, 48, 9929–9940. [Google Scholar] [CrossRef]
- He, K.; Gkioxari, G.; Dollar, P.; Girshick, R. Mask R-CNN. arXiv 2018, arXiv:1703.06870. [Google Scholar] [CrossRef]
- Ren, S.; He, K.; Girshick, R.; Sun, J. Faster R-CNN: Towards Real-Time Object Detection with Region Proposal Networks. arXiv 2016, arXiv:1506.01497. [Google Scholar] [CrossRef]
- Yao, Y.; Chen, Y.; Gou, S.; Chen, S.; Zhang, X.; Tong, N. Auto-segmentation of pancreatic tumor in multi-modal image using transferred DSMask R-CNN network. Biomed. Signal Process. Control. 2023, 83, 104583. [Google Scholar] [CrossRef]
- Patel, S. K-Means Clustering Algorithm: Implementation and Critical Analysis; Scholars’ Press: Chico, CA, USA, 2019; p. 68. [Google Scholar]
- Tian, K.; Li, J.; Zeng, J.; Evans, A.; Zhang, L. Segmentation of tomato leaf images based on adaptive clustering number of K-means algorithm. Comput. Electron. Agric. 2019, 165, 104962. [Google Scholar] [CrossRef]
- Saifullah, S.; Drezewski, R.; Khaliduzzaman, A.; Tolentino, L.K.; Ilyos, R. K-means segmentation based-on lab color space for embryo detection in incubated egg. J. Ilm. Tek. Elektro Komput. Dan Inform. (JITEKI) 2022, 8, 175–185. [Google Scholar] [CrossRef]
- He, K.; Zhang, X.; Ren, S.; Sun, J. Deep Residual Learning for Image Recognition. arXiv 2015, arXiv:1512.03385. [Google Scholar]
- Zhang, Q. A novel ResNet101 model based on dense dilated convolution for image classification. SN Appl. Sci. 2022, 4, 1–13. [Google Scholar] [CrossRef]
- Roy, C.K.; Manna, S.; Song, T.; Bruzzone, L. Attention-Based Adaptive Spectral–Spatial Kernel ResNet for Hyperspectral Image Classification. IEEE Trans. Geosci. Remote Sens. 2021, 59, 7831–7843. [Google Scholar] [CrossRef]
- Showkat, S.; Qureshi, S. Efficacy of Transfer Learning-based ResNet models in Chest X-ray image classification for detecting COVID-19 Pneumonia. Chemom. Intell. Lab. Syst. 2022, 224, 104534. [Google Scholar] [CrossRef]
- Liu, W.; Chen, W.; Wang, C.; Mao, Q.; Dai, X. Capsule Embedded ResNet for Image Classification. In Proceedings of the 5th International Conference on Computer Science and Artificial Intelligence (CSAI ‘21), Beijing China, 4–6 December 2021; Association for Computing Machinery: New York, NY, USA, 2021; pp. 143–149. [Google Scholar] [CrossRef]
- Kumar, V.; Arora, H.; Sisodia, J. ResNet-based approach for Detection and Classification of Plant Leaf Diseases. In Proceedings of the International Conference on Electronics and Sustainable Communication Systems (ICESC), Coimbatore, India, 2–4 July 2020; pp. 495–502. [Google Scholar] [CrossRef]
- Simonyan, K.; Zisserman, A. Very Deep Convolutional Networks for Large-Scale Image Recognition. arXiv 2015, arXiv:1409.1556. [Google Scholar]
- Zhu, Y.C.; Jin, P.F.; Bao, J.; Jiang, Q.; Wang, X. Thyroid ultrasound image classification using a convolutional neural network. Ann. Transl. Med. 2021, 9, 1526. [Google Scholar] [CrossRef] [PubMed]
- Sriram, G.; Babu, T.; Praveena, R.; Anand, J.V. Classification of Leukemia and Leukemoid Using VGG-16 Convolutional Neural Network Architecture. Mol. Cell. Biomech. 2022, 19, 29–40. [Google Scholar] [CrossRef]
- Kaur, T.; Gandhi, T.K. Automated Brain Image Classification Based on VGG-16 and Transfer Learning. In Proceedings of the 2019 International Conference on Information Technology (ICIT), Bhubaneswar, India, 19–21 December 2019; pp. 94–98. [Google Scholar] [CrossRef]
- Redmon, J.; Divvala, S.; Girshick, R.; Farhadi, A. You Only Look Once: Unified, Real-Time Object Detection. arXiv 2016, arXiv:1506.02640. [Google Scholar]
- YoloV5 Model Implementation. Available online: https://github.com/ultralytics/yolov5 (accessed on 8 May 2023).
- Karthi, M.; Muthulakshmi, V.; Priscilla, R.; Praveen, P.; Vanisri, K. Evolution of YOLO-V5 Algorithm for Object Detection: Automated Detection of Library Books and Performace validation of Dataset. In Proceedings of the 2021 International Conference on Innovative Computing, Intelligent Communication and Smart Electrical Systems (ICSES), Chennai, India, 24–25 September 2021. [Google Scholar] [CrossRef]
- Junhwa, K.; Kim, N.; Park, Y.; Won, C. Object Detection and Classification Based on YOLO-V5 with Improved Maritime Dataset. J. Mar. Sci. Eng. 2022, 10, 377. [Google Scholar] [CrossRef]
- Mathew, M.P.; Mahesh, T.Y. Leaf-based disease detection in bell pepper plant using YOLO v5. SIViP 2022, 16, 841–847. [Google Scholar] [CrossRef]
- Liu, X.; Zhou, Y.; Liu, Y. Poultry Disease Identification Based on Light Weight Deep Neural Networks. In Proceedings of the 2023 IEEE 3rd International Conference on Computer Communication and Artificial Intelligence (CCAI), Taiyuan, China, 26–28 May 2023; pp. 92–96. [Google Scholar] [CrossRef]
- Chen, X.; Yang, X. Chicken Manure Disease Recognition Model Based on Improved ResNeXt50. J. Phys. Conf. Ser. 2023, 2562, 012009. [Google Scholar] [CrossRef]


| No. | Steps: |
|---|---|
| 1. | Transform the image: Convert an RGB image into the HSI and the Lab color space; |
| 2. | Apply OTSU thresholding: Use the OTSU algorithm to create a binary image, differentiating the objects from the background. |
| 3. | Perform thresholded image corrections: apply erosion and dilation operations. |
| 4. | Invert the threshold: consider the black part as the background of the image. |
| 5. | Extract edges/contours: utilize Suzuki’s algorithm to extract the edges or contours from the image. |
| 6. | Filter out smaller contours: remove smaller contours from the extracted edges. |
| 7. | Features extraction: |
| 7.1 | Compute the convex hull and calculate the perimeter and area of the hull. |
| 7.2 | Obtain morphological information: length, width, perimeter, area and bounding points. |
| 7.3 | Generate distance maps. |
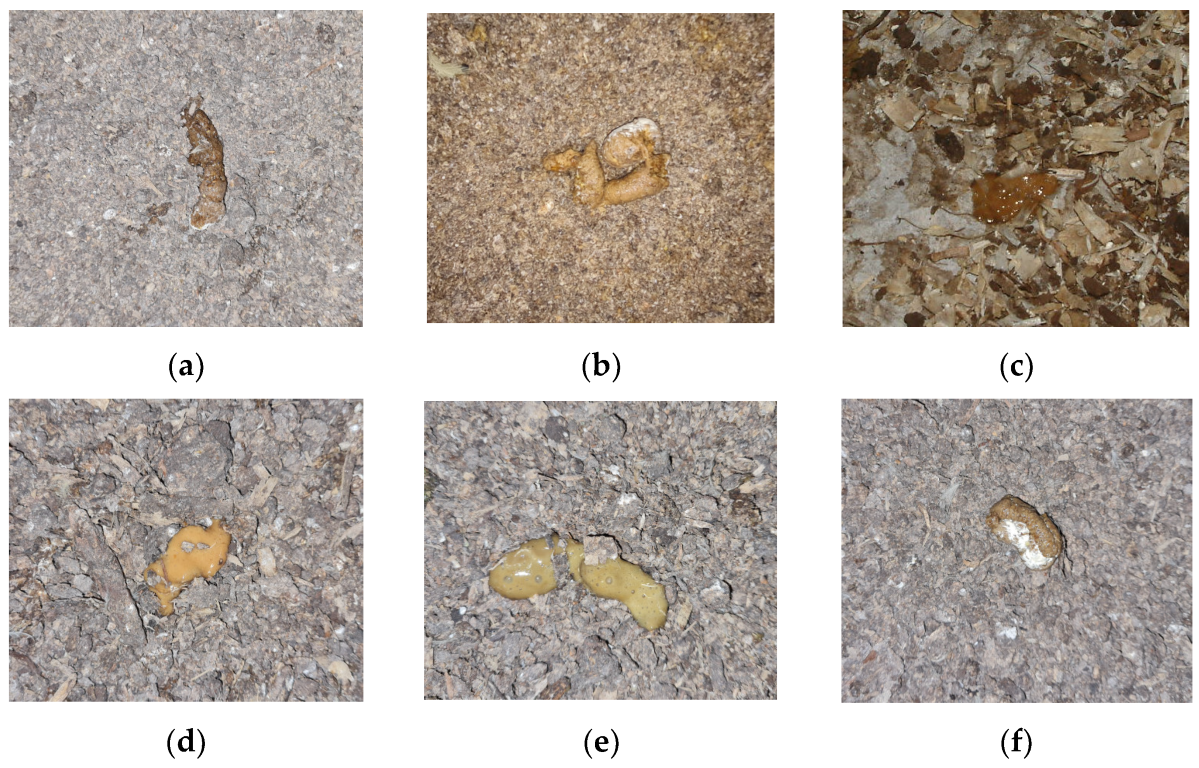
| Classes | Description | Initial Amount of Images | Amount of Images after Augmentation |
|---|---|---|---|
| Normal | Normal droppings, good form and structure, low moisture amount | 216 | 648 |
| ABN1 | Abnormalities: marginal change of droppings form and structure | 47 | 141 |
| ABN2 | Abnormalities: gas frothiness | 23 | 69 |
| ABN3 | Abnormalities: high moisture amount | 130 | 390 |
| ABN4 | Abnormalities: high moisture amount and gas frothiness | 53 | 159 |
| ABN5 | Abnormalities: undigested feed particle | 18 | 54 |
| Total | 487 | 1461 |
| Algorithm | Class | Average | |||||
|---|---|---|---|---|---|---|---|
| Normal | ABN1 | ABN2 | ABN3 | ABN4 | ABN5 | ||
| Mask_RCNN | 0.85993 | 0.87388 | 0.85232 | 0.79055 | 0.87945 | 0.89119 | 0.8579 |
| U-Net | 0.87674 | 0.87404 | 0.87260 | 0.81130 | 0.91259 | 0.90896 | 0.8760 |
| K-means | 0.87518 | 0.87947 | 0.87820 | 0.87408 | 0.90414 | 0.91393 | 0.8875 |
| Model | Precision | Recall | Accuracy | Macro-F1 | Weighted Average F1 |
|---|---|---|---|---|---|
| VGG-16 | 79.74% | 86.62% | 89.24% | 82.34% | 89.67% |
| ResNet-101 | 83.486 | 88.89% | 91.10% | 86.03% | 91.28% |
| Yolov5 | 84.55% | 90.54% | 91.78% | 86.96% | 92.03% |
| Classes | References | Dataset Size | Algorithm/Model | Classification Results (Metric) |
|---|---|---|---|---|
| (1) Health (2) Coccidiosis (3) Salmonella | Degu, M.Z. et al. [28] | 10,500 | ResNet50 | 98.70% (ACC) |
| Mbelwa, H. et al. [16] | 1590 | XceptionNet | 94.00% (ACC) | |
| CNN | 93.67% (ACC) | |||
| VGG 16 | 89.33% (ACC) | |||
| (1) Newcastle (2) Salmonella (3) Coccidiosis (4) Healthy | Liu, X. et al. [54] | 8067 | PoultryNet | 97.77% (ACC) |
| Chen, X. et al. [55] | 8067 | ResNeXt50-3A | 97.40% (ACC) | |
| Machuve, D. et al. [23] | 1255 | InceptionV3 | 95.45% (ACC) | |
| MobileNetV2 | 98.02% (ACC) | |||
| Xception | 98.24% (ACC) | |||
| (1) Normal (2) Abnormal shape (3) Abnormal color (4) Abnormal water content (5) Abnormal shape and water | Jintao Wang [27] | 7637 | Yolo V3 | 88.70% (Recall) |
| Faster R-CNN | 99.10% (Recall) | |||
| (1) Normal (2) Abnormal | Our proposed model | 1461 | K-means + YOLO V5 | 94.52% (ACC) |
| (1) Normal (2) Abnormal with minor changes (3) Abnormal with gas foaming (4) Abnormal with moisture content (5) Abnormal with undigested feed | K-means + YOLO V5 | 91.78% (ACC) |
Disclaimer/Publisher’s Note: The statements, opinions and data contained in all publications are solely those of the individual author(s) and contributor(s) and not of MDPI and/or the editor(s). MDPI and/or the editor(s) disclaim responsibility for any injury to people or property resulting from any ideas, methods, instructions or products referred to in the content. |
© 2023 by the authors. Licensee MDPI, Basel, Switzerland. This article is an open access article distributed under the terms and conditions of the Creative Commons Attribution (CC BY) license (https://creativecommons.org/licenses/by/4.0/).
Share and Cite
Nakrosis, A.; Paulauskaite-Taraseviciene, A.; Raudonis, V.; Narusis, I.; Gruzauskas, V.; Gruzauskas, R.; Lagzdinyte-Budnike, I. Towards Early Poultry Health Prediction through Non-Invasive and Computer Vision-Based Dropping Classification. Animals 2023, 13, 3041. https://doi.org/10.3390/ani13193041
Nakrosis A, Paulauskaite-Taraseviciene A, Raudonis V, Narusis I, Gruzauskas V, Gruzauskas R, Lagzdinyte-Budnike I. Towards Early Poultry Health Prediction through Non-Invasive and Computer Vision-Based Dropping Classification. Animals. 2023; 13(19):3041. https://doi.org/10.3390/ani13193041
Chicago/Turabian StyleNakrosis, Arnas, Agne Paulauskaite-Taraseviciene, Vidas Raudonis, Ignas Narusis, Valentas Gruzauskas, Romas Gruzauskas, and Ingrida Lagzdinyte-Budnike. 2023. "Towards Early Poultry Health Prediction through Non-Invasive and Computer Vision-Based Dropping Classification" Animals 13, no. 19: 3041. https://doi.org/10.3390/ani13193041
APA StyleNakrosis, A., Paulauskaite-Taraseviciene, A., Raudonis, V., Narusis, I., Gruzauskas, V., Gruzauskas, R., & Lagzdinyte-Budnike, I. (2023). Towards Early Poultry Health Prediction through Non-Invasive and Computer Vision-Based Dropping Classification. Animals, 13(19), 3041. https://doi.org/10.3390/ani13193041