
Lockdown’s Silver Lining? Different Levels of Roadkill during the COVID-19 Times in Lithuania


Abstract
:Simple Summary
Abstract
1. Introduction
2. Materials and Methods
2.1. Lockdown Periods in Lithuania
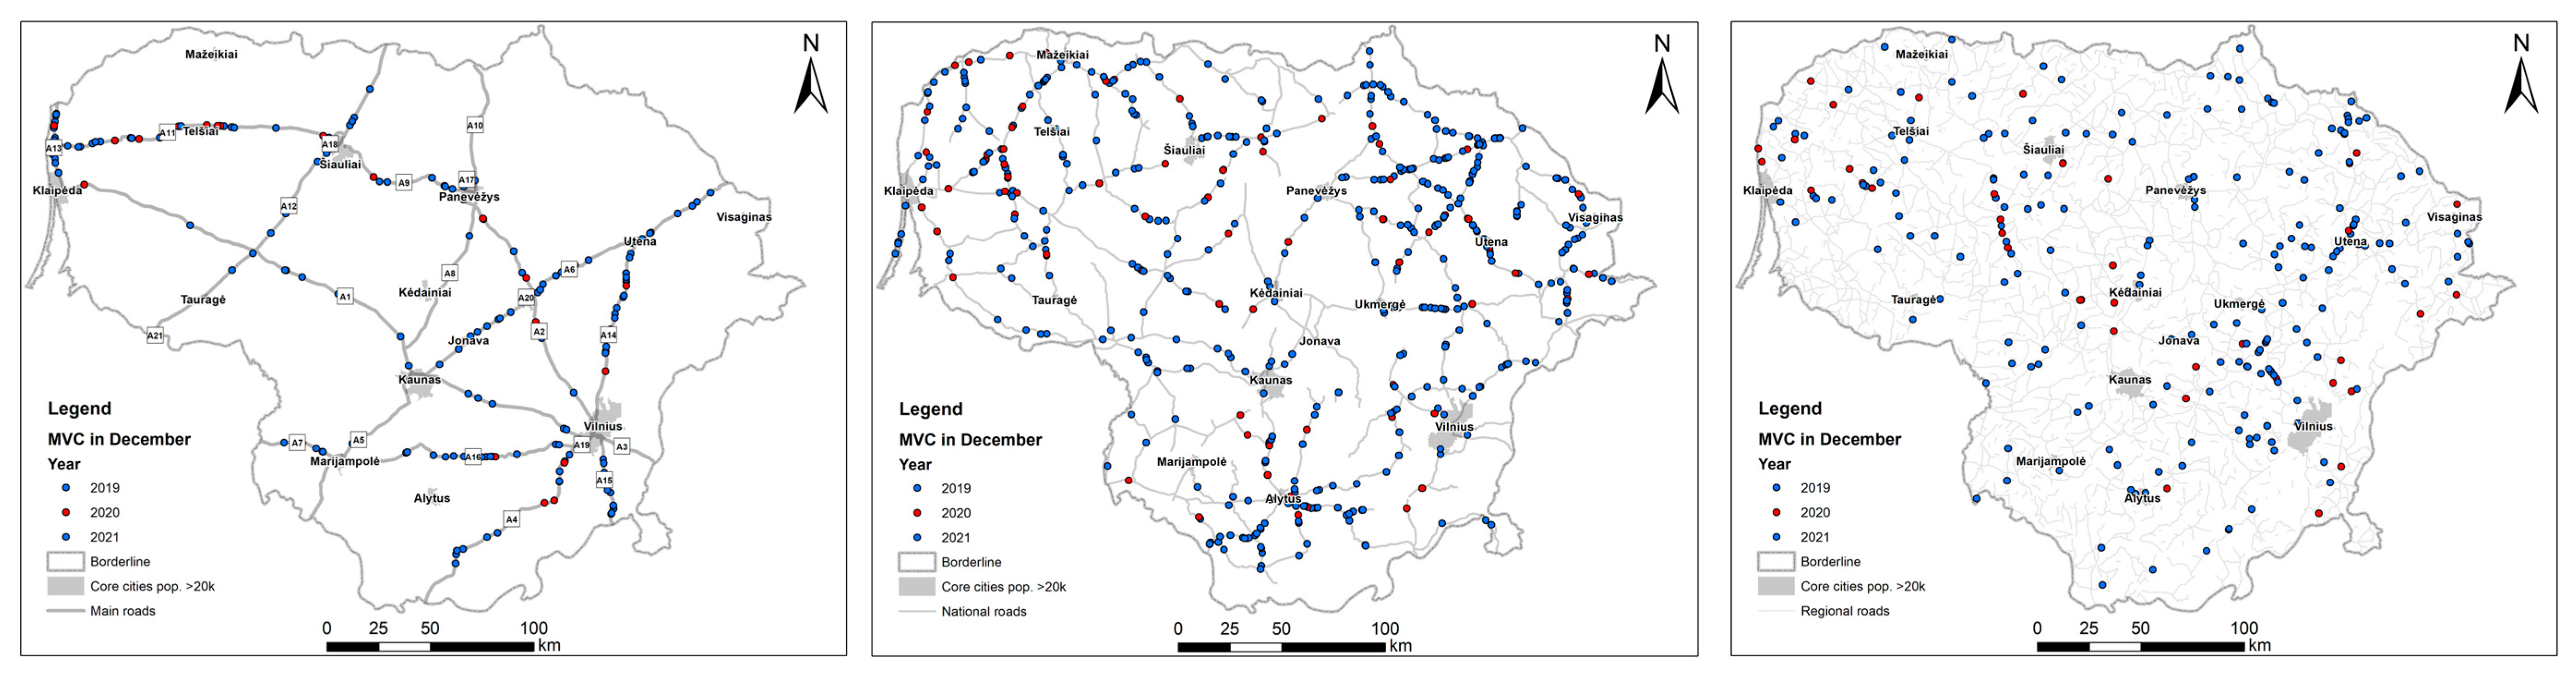
2.2. Roadkill Data
2.3. Data Treatment
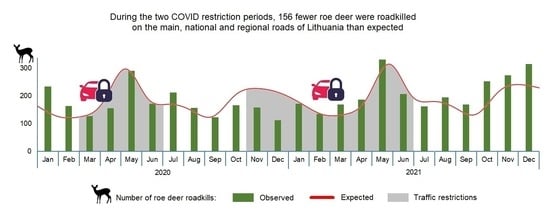
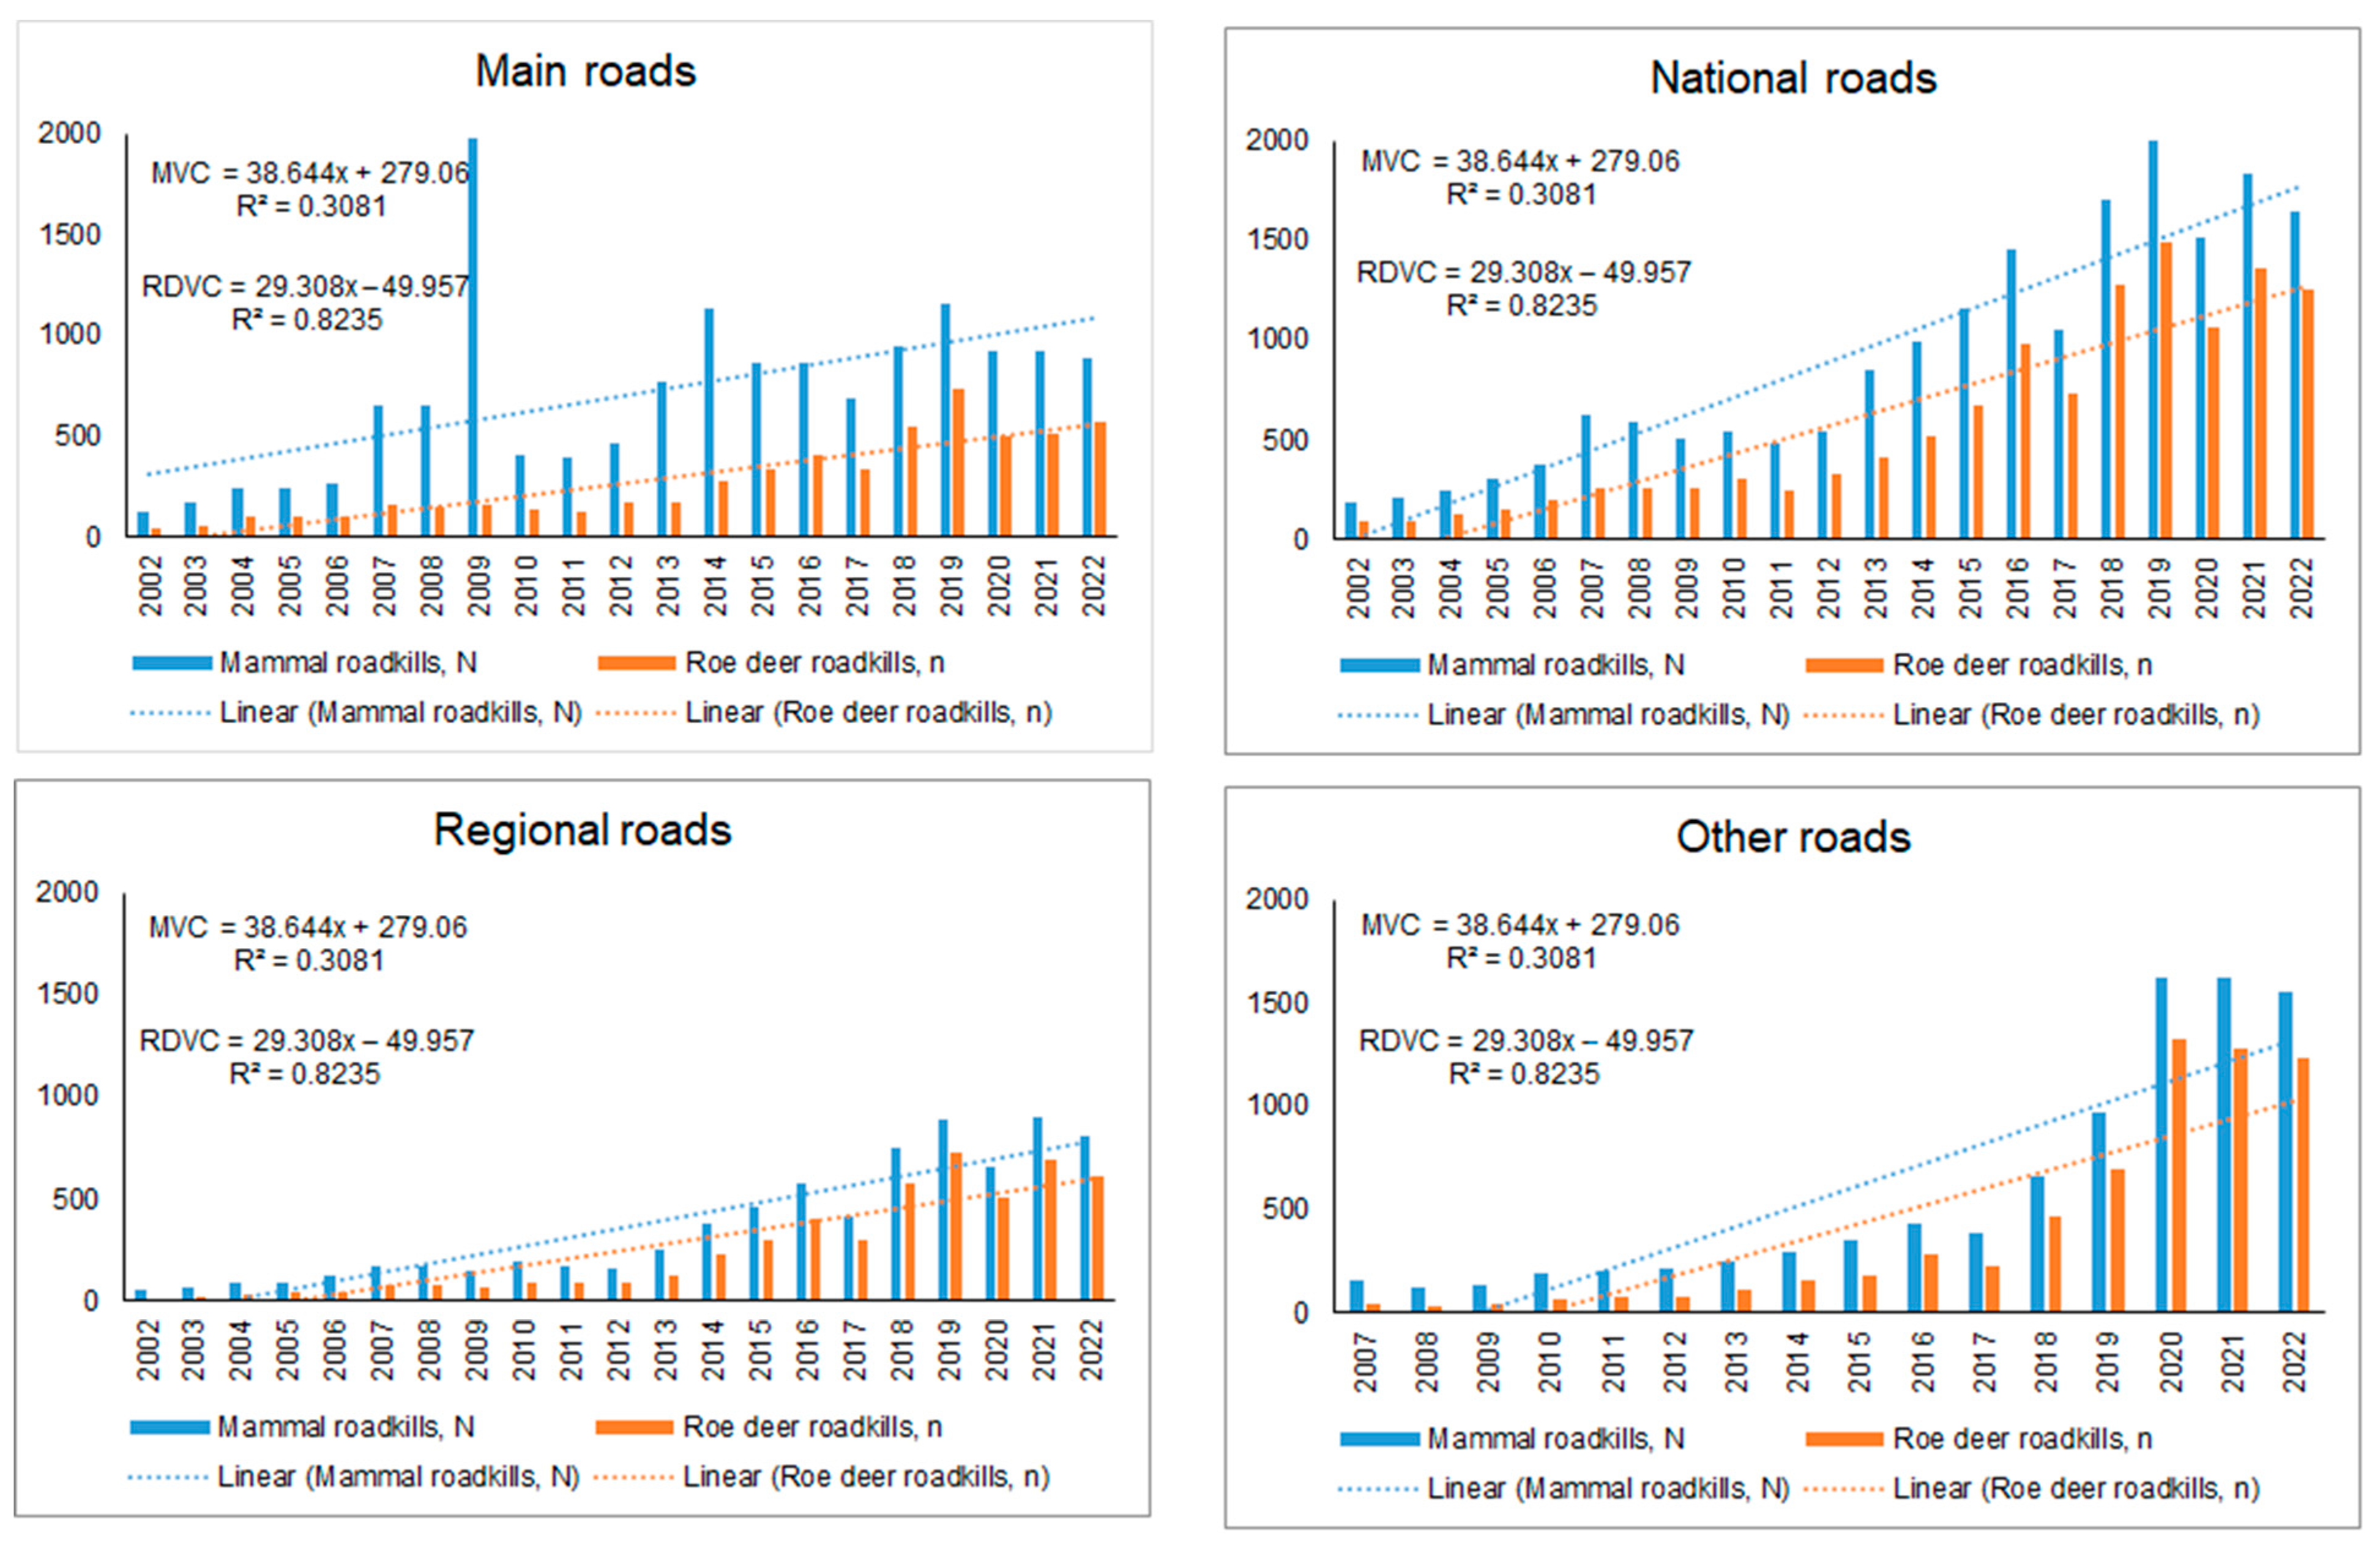
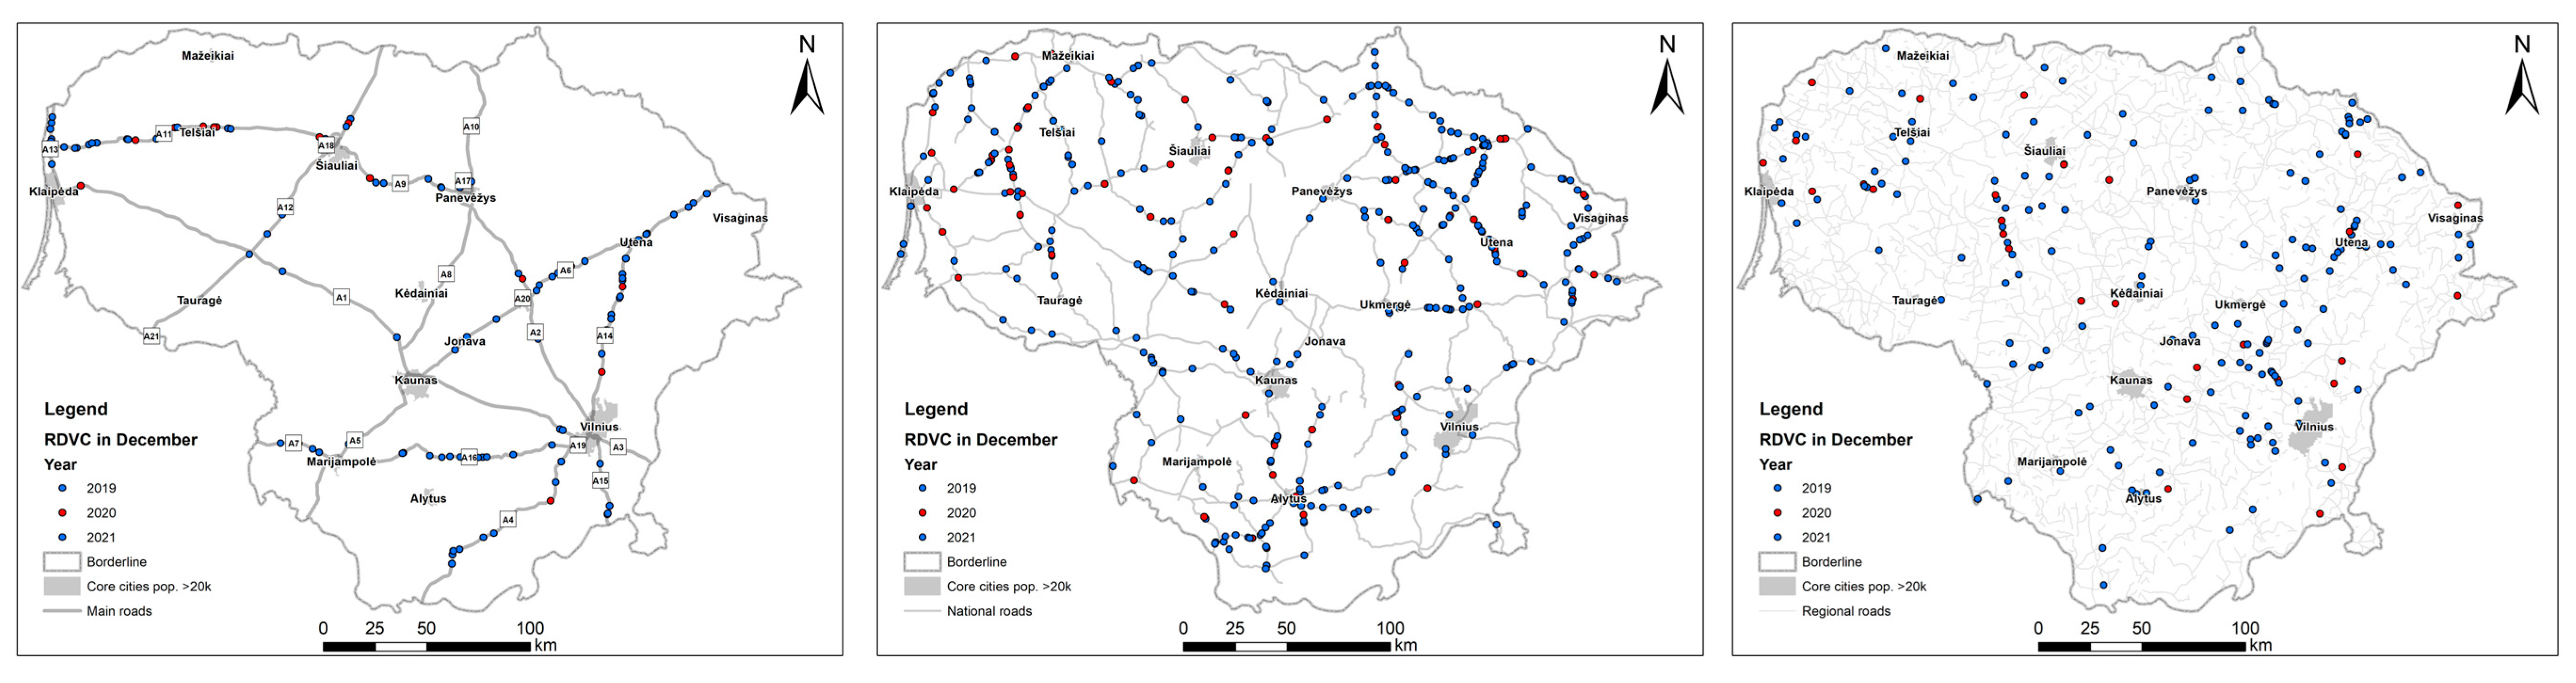
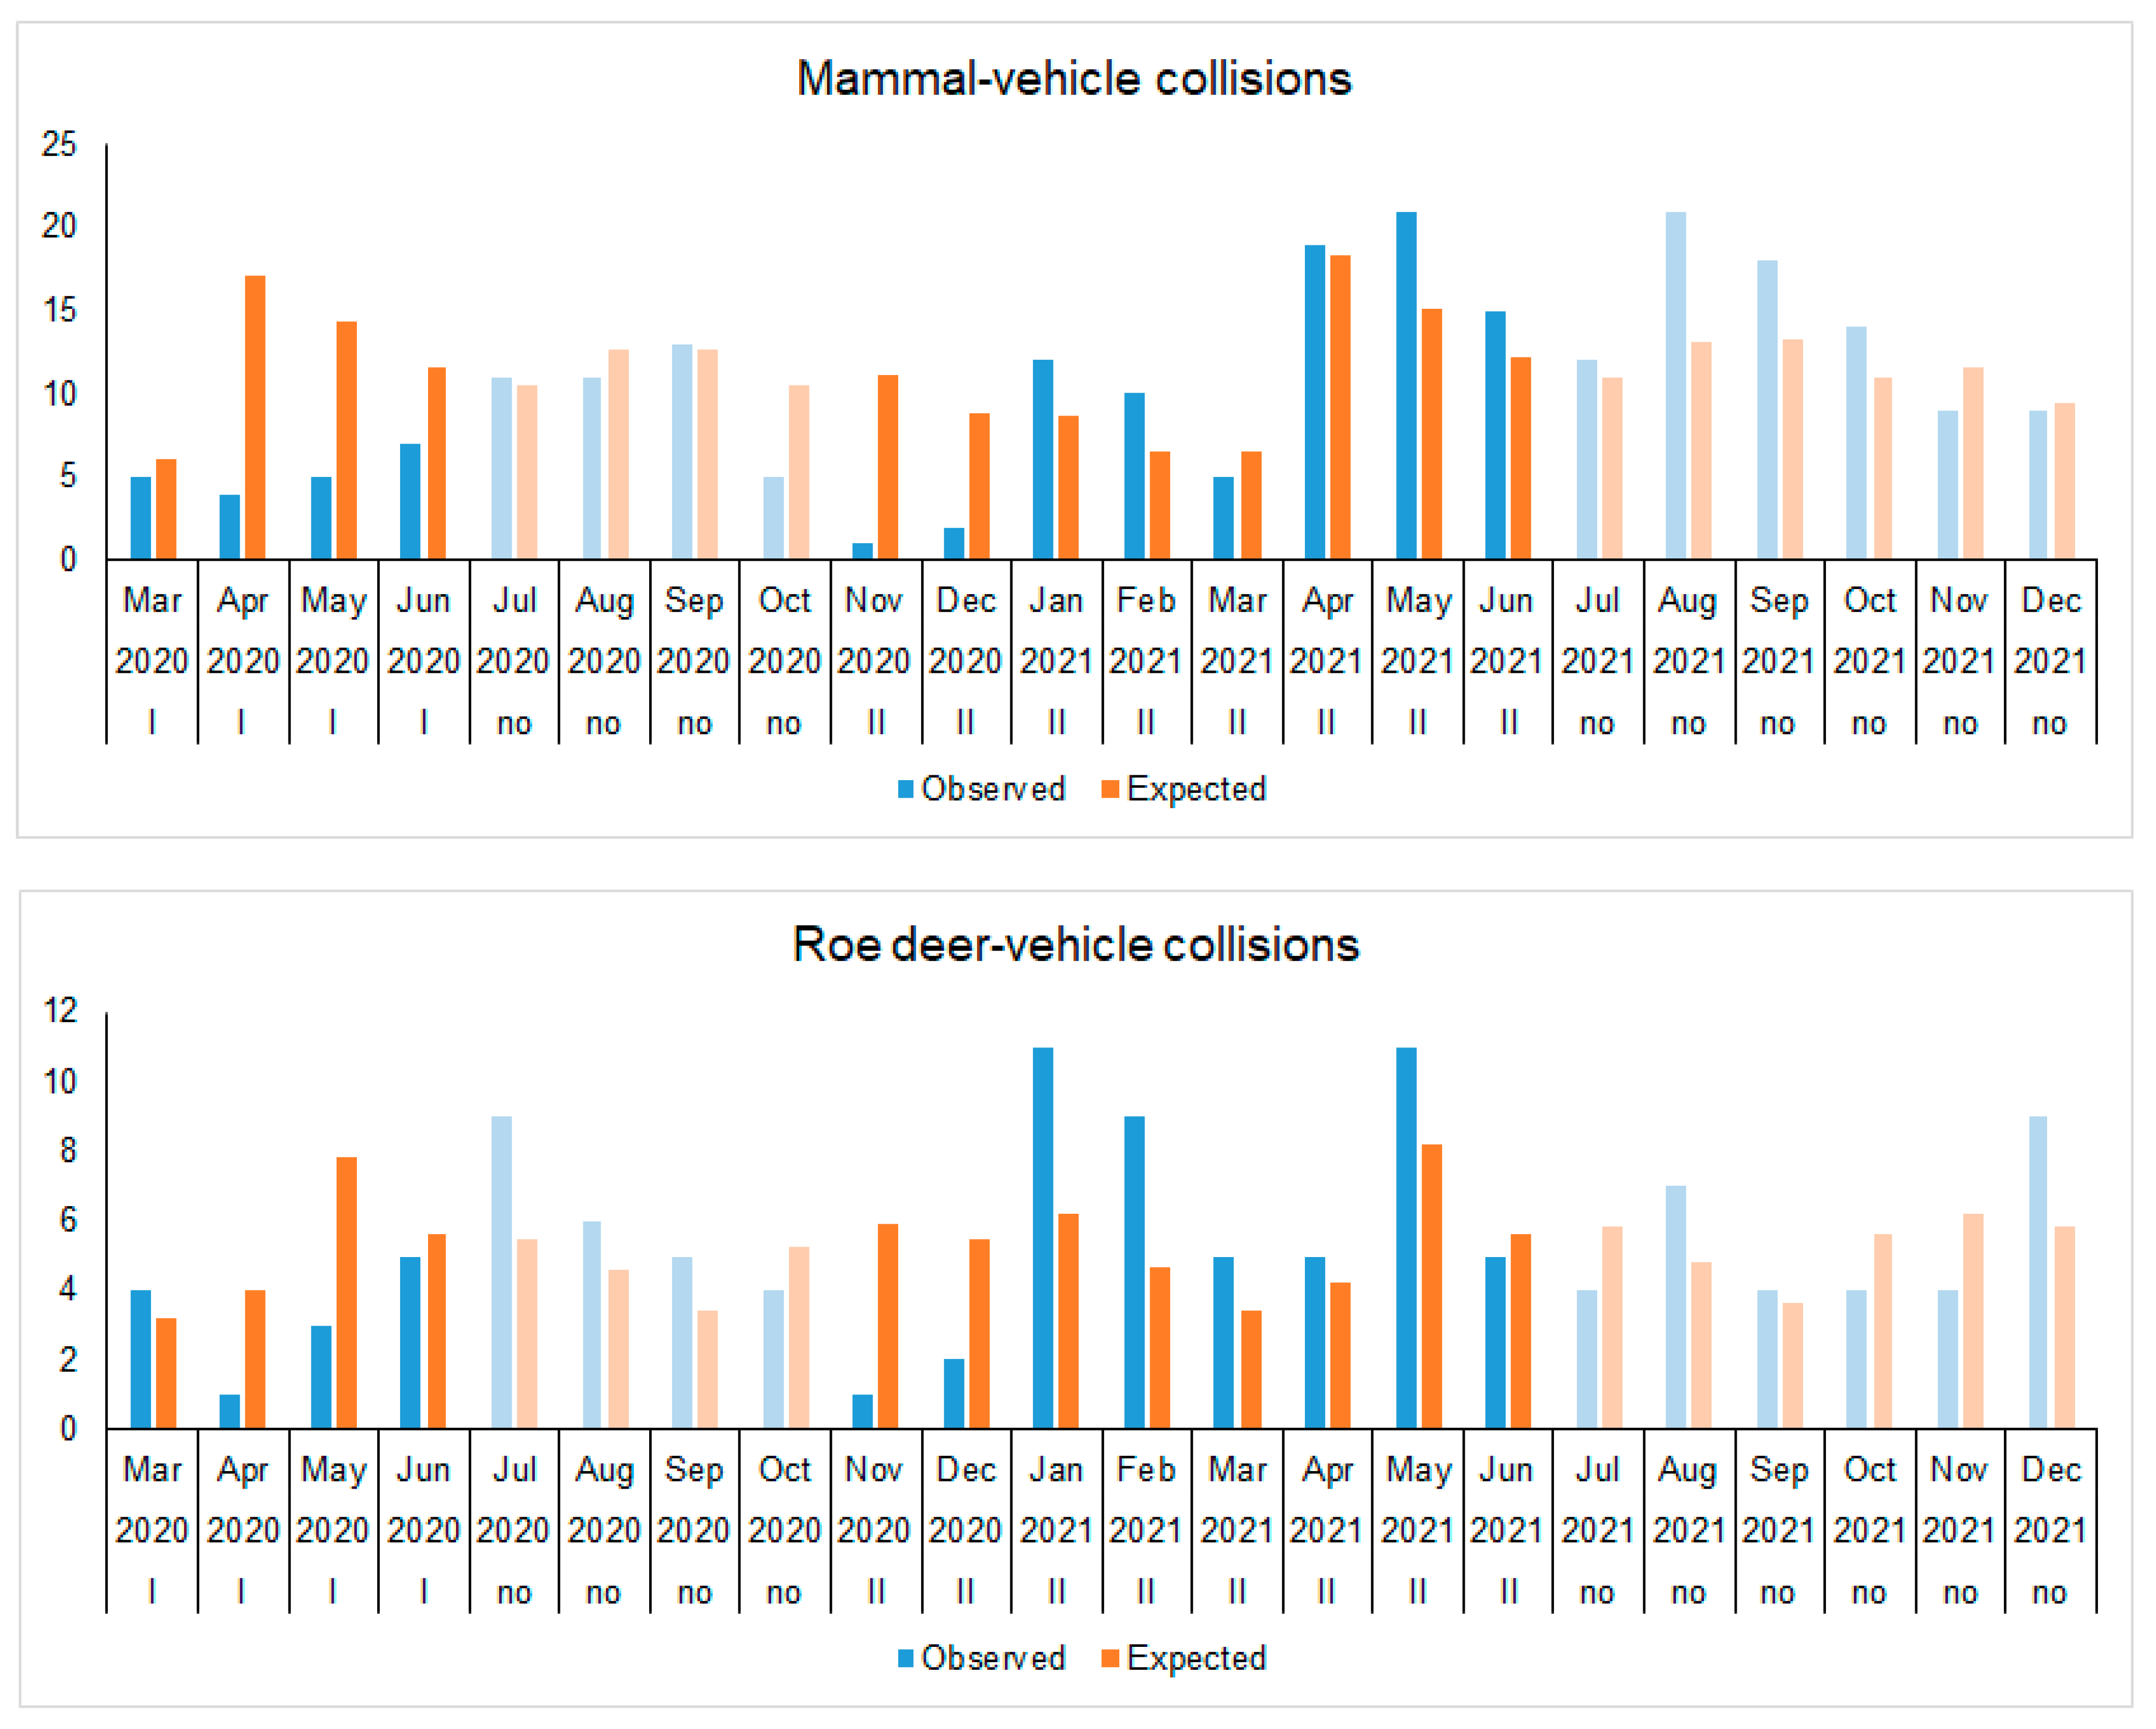
3. Results
3.1. Annual Dynamics of Mammal and Roe Deer Roadkill
3.2. Monthly Dynamics of Mammal and Roe Deer Roadkill during the COVID-19 Restrictions
3.3. Monthly Dynamics of Mammal and Roe Deer Roadkill on the A14 Main Road during the COVID-19 Restriction Periods
4. Discussion
5. Conclusions
- During the months of mobility restrictions due to the COVID-19 pandemic, the number of MVCs and RDVCs on the main, national and regional roads in Lithuanian was less than expected in comparison to the long-term trend, with the most pronounced reduction in April–May 2020 (beginning of lockdown period I) and November–December 2020 (beginning of lockdown period II);
- On A14, the main road with the best registration activity, MVC decreased by up to 90% and RDVC by up to 75% in comparison to the expected numbers in the same months;
- Collision numbers with wildlife on the main, national and regional roads exceeded the anticipated levels in the months immediately following the relaxation of restrictions on human mobility;
- The total numbers of MVCs and RDVCs in Lithuania in the years of the COVID-19 pandemic, 2020 and 2021, were higher than expected, according to long-term dynamics. Despite a marked decrease on the main, national and regional roads, this was due to the increased number of roadkills on roads in urban areas.
Supplementary Materials
Author Contributions
Funding
Institutional Review Board Statement
Informed Consent Statement
Data Availability Statement
Acknowledgments
Conflicts of Interest
References
- Gaynor, K.M.; Brashares, J.S.; Gregory, G.H.; Kurz, D.J.; Seto, K.L.; Withey, L.S.; Fiorella, K.J. Anticipating the impacts of the COVID-19 pandemic on wildlife. Front. Ecol. Environ. 2020, 18, 542–543. [Google Scholar] [CrossRef]
- Bates, A.E.; Primack, R.B.; Biggar, B.S.; Bird, T.J.; Clinton, M.E.; Command, R.J.; Richards, C.; Shellard, M.; Geraldi, N.R.; Vergara, V.; et al. Global COVID-19 lockdown highlights humans as both threats and custodians of the environment. Biol. Conserv. 2021, 263, 109175. [Google Scholar] [CrossRef] [PubMed]
- Primack, R.B.; Bates, A.E.; Duarte, C.M. The conservation and ecological impacts of the COVID-19 pandemic. Biol. Conserv. 2021, 260, 109204. [Google Scholar] [CrossRef]
- Stenhouse, A.; Perry, T.; Grützner, F.; Rismiller, P.; Koh, L.P.; Lewis, M. COVID restrictions impact wildlife monitoring in Australia. Biol. Conserv. 2022, 267, 109470. [Google Scholar] [CrossRef] [PubMed]
- Miller-Rushing, A.J.; Athearn, N.; Blackford, T.; Brigham, C.; Cohen, L.; Cole-Will, R.; Edgar, T.; Ellwood, E.R.; Fisichelli, N.; Pritz, C.F.; et al. COVID-19 pandemic impacts on conservation research, management, and public engagement in US national parks. Biol. Conserv. 2021, 257, 109038. [Google Scholar] [CrossRef] [PubMed]
- Anderson, A.K.; Waller, J.S.; Thornton, D.H. Partial COVID-19 closure of a national park reveals negative influence of low-impact recreation on wildlife spatiotemporal ecology. Sci. Rep. 2023, 13, 687. [Google Scholar] [CrossRef]
- Manenti, R.; Mori, E.; Di Canio, V.; Mercurio, S.; Picone, M.; Caffi, M.; Brambilla, M.; Ficetola, G.F.; Rubolini, D. The good, the bad and the ugly of COVID-19 lockdown effects on wildlife conservation: Insights from the first European locked down country. Biol. Conserv. 2020, 249, 108728. [Google Scholar] [CrossRef]
- Remuzzi, A.; Remuzzi, G. COVID-19 and Italy: What next? Lancet 2020, 395, 1225–1228. [Google Scholar] [CrossRef]
- Corlett, R.T.; Primack, R.B.; Devictor, V.; Maas, B.; Goswami, V.R.; Bates, A.E.; Koh, L.P.; Regan, T.J.; Loyola, R.; Pakeman, R.J.; et al. Impacts of the coronavirus pandemic on biodiversity conservation. Biol. Conserv. 2020, 246, 108571. [Google Scholar] [CrossRef]
- Coman, I.A.; Cooper-Norris, C.E.; Longing, S.; Perry, G. It Is a Wild World in the City: Urban Wildlife Conservation and Communication in the Age of COVID-19. Diversity 2022, 14, 539. [Google Scholar] [CrossRef]
- Schrimpf, M.B.; Des Brisay, P.G.; Johnston, A.; Smith, A.C.; Sánchez-Jasso, J.; Robinson, B.G.; Warrington, M.H.; Mahony, N.A.; Horn, A.G.; Strimas-Mackey, M.; et al. Reduced human activity during COVID-19 alters avian land use across North America. Sci. Adv. 2021, 7, eabf5073. [Google Scholar] [CrossRef] [PubMed]
- Altringer, L.; McKee, S.C.; Kougher, J.D.; Begier, M.J.; Stephanie, A.; Shwiff, S.A. The impact of the COVID-19 pandemic on wildlife–aircraft collisions at US airports. Sci. Rep. 2023, 13, 11602. [Google Scholar] [CrossRef] [PubMed]
- Warrington, M.H.; Schrimpf, M.B.; Des Brisay, P.; Taylor, M.E.; Koper, N. Avian behaviour changes in response to human activity during the COVID-19 lockdown in the United Kingdom. Proc. R. Soc. B 2022, 289, 20212740. [Google Scholar] [CrossRef] [PubMed]
- Vez-Garzón, M.; Giménez, J.; Sánchez-Márquez, A.; Montalvo, T.; Navarro, J. Changes in the feeding ecology of an opportunistic predator inhabiting urban environments in response to COVID-19 lockdown. R. Soc. Open Sci. 2023, 10, 221639. [Google Scholar] [CrossRef]
- LeTourneux, F.; Grandmont, T.; Dulude-de Broin, F.; Martin, M.C.; Lefebvre, J.; Kato, A.; Bêty, J.; Gauthie, G.; Legagneux, P. COVID19-induced reduction in human disturbance enhances fattening of an overabundant goose species. Biol. Conserv. 2021, 255, 108968. [Google Scholar] [CrossRef]
- Perkins, S.E.; Shilling, F.; Collinson, W. Anthropause Opportunities: Experimental Perturbation of Road Traffic and the Potential Effects on Wildlife. Front. Ecol. Evol. 2022, 10, 833129. [Google Scholar] [CrossRef]
- Bíl, M.; Andrášik, R.; Cícha, V.; Arnon, A.; Kruuse, M.; Langbein, J.; Náhlik, A.; Niemi, M.; Pokorny, B.; Colino-Rabanal, V.J.; et al. COVID-19 related travel restrictions prevented numerous wildlife deaths on roads: A comparative analysis of results from 11 countries. Biol. Conserv. 2021, 256, 109076. [Google Scholar] [CrossRef]
- Abd Rabou, A.N. How Is the COVID-19 Outbreak Affecting Wildlife around the World? Open J. Ecol. 2020, 10, 497–517. [Google Scholar] [CrossRef]
- Dörler, D.; Heigl, F. A decrease in reports on road-killed animals based on citizen science during COVID-19 lockdown. PeerJ 2021, 9, e12464. [Google Scholar] [CrossRef]
- Driessen, M.M. COVID-19 restrictions provide a brief respite from the wildlife roadkill toll. Biol. Conserv. 2021, 256, 109012. [Google Scholar] [CrossRef]
- LeClair, G.; Chatfield, M.W.H.; Wood, Z.; Parmelee, J.; Frederick, C.A. Influence of the COVID-19 pandemic on amphibian road mortality. Conserv. Sci. Pract. 2021, 3, e535. [Google Scholar] [CrossRef] [PubMed]
- Łopucki, R.; Kitowski, I.; Perlińska-Teresiak, M.; Klich, D. How Is Wildlife Affected by the COVID-19 Pandemic? Lockdown Effect on the Road Mortality of Hedgehogs. Animals 2021, 11, 868. [Google Scholar] [CrossRef] [PubMed]
- Pokorny, B.; Cerri, J.; Bužan, E. Roadkill in a time of pandemic: The analysis of wildlife-vehicle collisions reveals the differential impact of COVID-19 lockdown over mammal assemblages. COVID-19 Lockdown Wildl.-Veh. Collis. Slov. 2021, 1–37. [Google Scholar] [CrossRef]
- García-Martínez-de-Albéniz, Í.; Ruiz-de-Villa, J.A.; Rodriguez-Hernandez, J. Impact of COVID-19 Lockdown on Wildlife-Vehicle Collisions in NW of Spain. Sustainability 2022, 14, 4849. [Google Scholar] [CrossRef]
- Heigl, F.; Teufelbauer, N.; Resch, S.; Schweiger, S.; Stückler, S.; Dörler, D. A dataset of road-killed vertebrates collected via citizen science from 2014–2020. Sci. Data 2022, 9, 504. [Google Scholar] [CrossRef]
- Antón, S.F. Monitoring roadkill in Spain: A three years survey during pandemic times. Res. Sq. 2023, 1–24. [Google Scholar] [CrossRef]
- Carter, N.H.; Zuckerwise, A.; Pradhan, N.M.B.; Subedi, N.; Lamichhane, B.R.; Hengaju, K.D.; Acharya, H.B.; Kandel, R.C. Rapid behavioral responses of endangered tigers to major roads during COVID-19 lockdown. Glob. Ecol. Conserv. 2023, 42, e02388. [Google Scholar] [CrossRef]
- Raymond, S.; Spencer, M.; Chadwick, E.A.; Madden, J.R.; Perkins, S.E. The impact of the COVID-19 lockdowns on wildlife–vehicle collisions in the UK. J. Anim. Ecol. 2023, 92, 1244–1255. [Google Scholar] [CrossRef]
- Asari, Y. Decreased traffic volume during COVID-19 did not reduce roadkill on fenced highway network in Japan. Landsc. Ecol. Eng. 2022, 18, 121–124. [Google Scholar] [CrossRef]
- Basak, S.M.; O’Mahony, D.T.; Lesiak, M.; Basak, A.K.; Ziółkowska, E.; Kaim, D.; Hossain, M.S.; Wierzbowska, I.A. Animal-vehicle collisions during the COVID-19 lockdown in early 2020 in the Krakow metropolitan region, Poland. Sci. Rep. 2022, 12, 7572. [Google Scholar] [CrossRef]
- Abraham, J.O.; Mumma, M.A. Elevated wildlife-vehicle collision rates during the COVID-19 pandemic. Sci. Rep. 2021, 11, 20391. [Google Scholar] [CrossRef] [PubMed]
- Garcia, F.; da Silva, A.A.; Freitas, H.; Sousa, J.P.; Alves, J. The effect of COVID-19 confinement on the activity behaviour of red deer. Glob. Ecol. Conserv. 2023, 45, e02525. [Google Scholar] [CrossRef] [PubMed]
- Bruinderink, G.G.; Hazebroek, E. Ungulate traffic collisions in Europe. Conserv. Biol. 1996, 10, 1059–1067. [Google Scholar] [CrossRef]
- Putmam, R.J. Deer and road traffic accidents: Options for management. J. Environ. Manag. 1997, 51, 43–57. [Google Scholar] [CrossRef]
- Forman, R.T.; Alexander, L.E. Roads and their major ecological effects. Annu. Rev. Ecol. Syst. 1998, 29, 207–231. [Google Scholar] [CrossRef]
- Trombulak, S.C.; Frissell, C.A. Review of ecological effects of roads on terrestrial and aquatic communities. Conserv. Biol. 2001, 14, 18–30. [Google Scholar] [CrossRef]
- Coffin, A.W. From roadkill to road ecology: A review of the ecological effects of roads. J. Transp. Geogr. 2007, 15, 396–406. [Google Scholar] [CrossRef]
- Grilo, C.; Koroleva, E.; Andrášik, R.; Bíl, M.; González-Suárez, M. Roadkill risk and population vulnerability in European birds and mammals. Front. Ecol. Environ. 2020, 18, 323–328. [Google Scholar] [CrossRef]
- Grilo, C.; Borda-de-Água, L.; Beja, P.; Goolsby, E.; Soanes, K.; le Roux, A.; Koroleva, E.; Flávio, Z.; Ferreira, F.Z.; Gagné, S.A.; et al. Conservation threats from roadkill in the global road network. Global Ecol. Biogeogr. 2021, 30, 2200–2210. [Google Scholar] [CrossRef]
- Moore, L.J.; Petrovan, S.O.; Bates, A.J.; Hicks, H.L.; Baker, P.J.; Perkins, S.E.; Yarnell, R.W. Demographic effects of road mortality on mammalian populations: A systematic review. Biol. Rev. 2023, 98, 1033–1050. [Google Scholar] [CrossRef]
- Pokorny, B.; Cerri, J.; Bužan, E. Wildlife roadkill and COVID-19: A biologically significant, but heterogeneous, reduction. J. Appl. Ecol. 2022, 59, 1291–1301. [Google Scholar] [CrossRef]
- Rutz, C.; Loretto, M.C.; Bates, A.E.; Davidson, S.C.; Duarte, C.M.; Jetz, W.; Johnson, M.; Kato, A.; Kays, R.; Mueller, T.; et al. COVID-19 lockdown allows researchers to quantify the effects of human activity on wildlife. Nat. Ecol. Evol. 2020, 4, 1156–1159. [Google Scholar] [CrossRef] [PubMed]
- Eismo Įvykiuose Daugėja Susidūrimų su Miško Žvėrimis: Kaip Elgtis? Available online: https://www.draudimas.lt/naujienos/eismo-ivykiuose-daugeja-susidurimu-su-misko-zverimis-kaip-elgtisij (accessed on 10 August 2023).
- Jasińska, K.D.; Krauze-Gryz, D.; Jackowiak, M.; Gryz, J. Changes in roe deer (Capreolus capreolus) daily activity patterns in Warsaw during the COVID-19 pandemic. Eur. Zool. J. 2022, 89, 870–876. [Google Scholar] [CrossRef]
- Balčiauskas, L.; Kučas, A.; Balčiauskienė, L. The Impact of Roadkill on Cervid Populations in Lithuania. Forests 2023, 14, 1224. [Google Scholar] [CrossRef]
- Shilling, F.; Nguyen, T.; Saleh, M.; Kyaw, M.K.; Tapia, K.; Trujillo, G.; Bejarano, M.; Waetjen, D.; Peterson, J.; Kalisz, G.; et al. A Reprieve from US wildlife mortality on roads during the COVID-19 pandemic. Biol. Conserv. 2021, 256, 109013. [Google Scholar] [CrossRef]
- Miraglia, N.; Di Brita, A. Behavior of Wildlife Species in Urban Areas to Changing Conditions during COVID-19 Lockdowns: A Review. J. Appl. Anim. Welf. Sci. 2022, 25, 119–125. [Google Scholar] [CrossRef]
- Tucker, M.A.; Schipper, A.M.; Adams, T.S.; Attias, N.; Avgar, T.; Babic, N.L.; Barker, K.J.; Bastille-Rousseau, G.; Behr, D.M.; Belant, J.L.; et al. Behavioral responses of terrestrial mammals to COVID-19 lockdowns. Science 2023, 380, 1059–1064. [Google Scholar] [CrossRef]
- Tremblay, J.; Davis, M.; Bagchi, R. COVID-19 Pandemic Impacts on Mammalian Carnivore Activity in the Eastern United States. Honors Scholar Theses. 881. University of Connecticut. 2022. Available online: https://opencommons.uconn.edu/srhonors_theses/881 (accessed on 10 August 2023).
- Balčiauskas, L.; Stratford, J.; Balčiauskienė, L.; Kučas, A. Importance of professional roadkill data in assessing diversity of mammal roadkills. Transp. Res. D Transp. Environ. 2020, 87, 102493. [Google Scholar] [CrossRef]
- Re-Open, EU. Available online: https://reopen.europa.eu/en (accessed on 15 July 2023).
- Traffic Volumes. Available online: https://lakd.lt/en/traffic-volumes (accessed on 5 September 2023).
- Past 4—The Past of the Future. Available online: https://www.nhm.uio.no/english/research/resources/past/ (accessed on 1 July 2023).
- Kučas, A.; Balčiauskas, L. Temporal patterns of ungulate-vehicle collisions in Lithuania. J. Environ. Manag. 2020, 273, 111172. [Google Scholar] [CrossRef]
- Bíl, M.; Andrášik, R.; Kušta, T.; Bartonička, T. Ungulate-vehicle crashes peak a month earlier than 38 years ago due to global warming. Clim. Chang. 2023, 176, 84. [Google Scholar] [CrossRef]
- Relevant Information about COVID-19 in Lithuania. Available online: https://koronastop.lrv.lt/lt/ (accessed on 25 July 2023).
- Terry, C.; Rothendler, M.; Zipf, L.; Dietze, M.C.; Primack, R.B. Effects of the COVID-19 pandemic on noise pollution in three protected areas in metropolitan Boston (USA). Biol. Conserv. 2021, 256, 109039. [Google Scholar] [CrossRef] [PubMed]
- Shtayat, A.; Moridpour, S. An Alternative System for Assessing Pavement Condition in the Event of an Epidemic: A Case of COVID-19. Sustainability 2023, 15, 8227. [Google Scholar] [CrossRef]
- Silva-Rodríguez, E.A.; Gálvez, N.; Swan, G.J.; Cusack, J.J.; Moreira-Arce, D. Urban wildlife in times of COVID-19: What can we infer from novel carnivore records in urban areas? Sci. Total Environ. 2021, 765, 142713. [Google Scholar] [CrossRef] [PubMed]
- Aaris-Sørensen, J. Road-kills of badgers (Meles meles) in Denmark. Ann. Zool. Fenn. 1995, 2, 31–36. [Google Scholar]
- Hels, T.; Buchwald, E. The effect of road kills on amphibian populations. Biol. Conserv. 2001, 99, 331–340. [Google Scholar] [CrossRef]
- Ruiz-Capillas, P.; Mata, C.; Malo, J.E. How many rodents die on the road? Biological and methodological implications from a small mammals’ roadkill assessment on a Spanish motorway. Ecol. Res. 2015, 30, 417–427. [Google Scholar] [CrossRef]
- Thurstan, R.H.; Hockings, K.J.; Hedlund, J.S.; Bersacola, E.; Collins, C.; Early, R.; Ermiasi, Y.; Fleischer-Dogley, F.; Gilkes, G.; Harrison, M.E.; et al. Envisioning a resilient future for biodiversity conservation in the wake of the COVID-19 pandemic. People Nat. 2021, 3, 990–1013. [Google Scholar] [CrossRef]
- Yasin, Y.J.; Grivna, M.; Abu-Zidan, F.M. Global impact of COVID-19 pandemic on road traffic collisions. World J. Emerg. Surg. 2021, 16, 51. [Google Scholar] [CrossRef]
- Fletcher, R.; Massarella, K.; Ferraz, K.M.; Kiwango, W.A.; Komi, S.; Mabele, M.B.; Marchini, S.; Nygren, A.; Sandroni, L.T.; Peter, S.; et al. The production-protection nexus: How political-economic processes influence prospects for transformative change in human-wildlife interactions. Global Environ. Chang. 2023, 82, 102723. [Google Scholar] [CrossRef]
- Zhu, A.L.; Chen, R.; Rizzolo, J.; Qian, J. Perceptions of COVID-19 origins and China’s wildlife policy reforms. Glob. Ecol. Conserv. 2023, 43, e02463. [Google Scholar] [CrossRef]
- Murray, M.H.; Byers, K.A.; Buckley, J.; Lehrer, E.W.; Kay, C.; Fidino, M.; Magle, S.B.; German, D. Public perception of urban wildlife during a COVID-19 stay-at-home quarantine order in Chicago. Urban Ecosyst. 2023, 26, 127–140. [Google Scholar] [CrossRef] [PubMed]
- Soga, M.; Evans, M.J.; Cox, D.T.; Gaston, K.J. Impacts of the COVID-19 pandemic on human–nature interactions: Pathways, evidence and implications. People Nat. 2021, 3, 518–527. [Google Scholar] [CrossRef] [PubMed]
- Pop, M.I.; Gradinaru, S.R.; Popescu, V.D.; Haase, D.; Iojă, C.I. Emergency-line calls as an indicator to assess human–wildlife interaction in urban areas. Ecosphere 2023, 14, e4418. [Google Scholar] [CrossRef]
- Procko, M.; Naidoo, R.; LeMay, V.; Burton, A.C. Human impacts on mammals in and around a protected area before, during, and after COVID-19 lockdowns. Conserv. Sci. Pract. 2022, 4, e12743. [Google Scholar] [CrossRef] [PubMed]
- Halfwerk, W. The quiet spring of 2020. Science 2020, 370, 523–524. [Google Scholar] [CrossRef]


| Restriction Period | Date | Length, Days (Months) | Transport Restrictions |
|---|---|---|---|
| I | 26 February 2020–17 June 2020 | 112 (3.7) | Blocked |
| none | 17 June 2020–4 November 2020 | 140 (4.7) | Limited |
| II | 4 November 2020–2 July 2021 | 240 (8.0) | Blocked |
| none | 2 July 2021–14 February 2022 | 227 (7.6) | Unlimited |
| Road Type | 2010 | 2011 | 2012 | 2013 | 2014 | 2015 | 2016 | 2017 | 2018 | 2019 | 2020 | 2021 | 2022 |
|---|---|---|---|---|---|---|---|---|---|---|---|---|---|
| Main | 7268 | 7497 | 7518 | 7781 | 8274 | 8463 | 9047 | 9413 | 9614 | 10,010 | 9156 | 9692 | 10,260 |
| National | 1930 | 1944 | 1934 | 1978 | 2044 | 2109 | 2173 | 2261 | 2331 | 2381 | 2282 | 2330 | 2360 |
| Regional | 359 | 355 | 357 | 346 | 357 | 365 | 373 | 390 | 406 | 413 | 417 | 432 | 439 |
| Year | Total Mammals, N | Roe Deer, n | Roe Deer, % |
|---|---|---|---|
| 2002 | 373 | 150 | 40.2 |
| 2003 | 447 | 167 | 37.4 |
| 2004 | 571 | 265 | 46.4 |
| 2005 | 641 | 295 | 46.0 |
| 2006 | 781 | 355 | 45.5 |
| 2007 | 1625 | 535 | 32.9 |
| 2008 | 1534 | 523 | 34.1 |
| 2009 | 2774 | 531 | 19.1 |
| 2010 | 1350 | 607 | 45.0 |
| 2011 | 1265 | 545 | 43.1 |
| 2012 | 1379 | 671 | 48.7 |
| 2013 | 2120 | 825 | 38.9 |
| 2014 | 2810 | 1198 | 42.6 |
| 2015 | 2824 | 1486 | 52.6 |
| 2016 | 3327 | 2075 | 62.4 |
| 2017 | 2554 | 1593 | 62.4 |
| 2018 | 4065 | 2870 | 70.6 |
| 2019 | 5027 | 3652 | 72.6 |
| 2020 | 4717 | 3393 | 71.9 |
| 2021 | 5281 | 3847 | 72.8 |
| 2022 | 4902 | 3673 | 74.9 |
| Period | Year | Month | All Roads | Main Roads | National Roads | Regional Roads | ||||||||||||
|---|---|---|---|---|---|---|---|---|---|---|---|---|---|---|---|---|---|---|
| Obs | Exp | Diff | % | Obs | Exp | Diff | % | Obs | Exp | Diff | % | Obs | Exp | Diff | % | |||
| I | 2020 | Mar | 229 | 254 | −25 | −9.8 | 46 | 44 | 2 | 3.5 | 90 | 97 | −7 | −7.3 | 42 | 46 | −4 | −7.8 |
| I | 2020 | Apr | 326 | 330 | −4 | −1.2 | 73 | 86 | −13 | −15.4 | 114 | 120 | −6 | −5.1 | 39 | 49 | −10 | −20.8 |
| I | 2020 | May | 590 | 535 | 55 | 10.2 | 155 | 180 | −25 | −13.8 | 147 | 171 | −24 | −13.9 | 64 | 71 | −7 | −9.4 |
| I | 2020 | Jun | 355 | 350 | 5 | 1.4 | 73 | 100 | −27 | −27.0 | 122 | 123 | −1 | −0.6 | 58 | 58 | 0 | 0.1 |
| II | 2020 | Nov | 452 | 460 | −8 | −1.7 | 40 | 76 | −36 | −47.5 | 115 | 173 | −58 | −33.6 | 50 | 80 | −30 | −37.8 |
| II | 2020 | Dec | 367 | 417 | −50 | −12.1 | 29 | 64 | −35 | −54.4 | 81 | 160 | −79 | −49.5 | 40 | 73 | −33 | −45.0 |
| II | 2021 | Jan | 370 | 326 | 44 | 13.6 | 41 | 49 | −8 | −16.6 | 111 | 130 | −19 | −14.5 | 54 | 56 | −2 | −3.8 |
| II | 2021 | Feb | 291 | 235 | 56 | 23.9 | 32 | 34 | −2 | −6.3 | 99 | 99 | 0 | 0.4 | 50 | 45 | 5 | 10.1 |
| II | 2021 | Mar | 332 | 269 | 63 | 23.3 | 34 | 46 | −12 | −26.8 | 110 | 103 | 7 | 7.2 | 72 | 48 | 24 | 48.5 |
| II | 2021 | Apr | 368 | 349 | 19 | 5.4 | 78 | 90 | −12 | −13.6 | 142 | 127 | 15 | 11.7 | 64 | 52 | 12 | 22.5 |
| II | 2021 | May | 542 | 566 | −24 | −4.2 | 137 | 188 | −51 | −27.2 | 191 | 180 | 11 | 6.0 | 81 | 75 | 6 | 8.0 |
| II | 2021 | Jun | 398 | 369 | 29 | 7.9 | 92 | 104 | −12 | −11.4 | 135 | 129 | 6 | 4.3 | 72 | 61 | 11 | 17.3 |
| Chi-square test | χ2 = 21.96, p < 0.05 | χ2 = 15.71, NS | χ2 = 35.10, p < 0.001 | χ2 = 25.17, p < 0.01 | ||||||||||||||
| Wilcoxon test * | W = 54, NS | W = 76.5, p < 0.002 | W = 46, NS | W = 35, NS | ||||||||||||||
| Period | Year | Month | All Roads | Main Roads | National Roads | Regional Roads | ||||||||||||
|---|---|---|---|---|---|---|---|---|---|---|---|---|---|---|---|---|---|---|
| Obs | Exp | Diff | % | Obs | Exp | Diff | % | Obs | Exp | Diff | % | Obs | Exp | Diff | % | |||
| I | 2020 | Mar | 161 | 179 | −18 | −10.1 | 27 | 23 | 4 | 15.9 | 67 | 70 | −3 | −3.7 | 33 | 35 | −2 | −4.4 |
| I | 2020 | Apr | 238 | 227 | 11 | 5.0 | 41 | 49 | −8 | −17.1 | 80 | 85 | −5 | −5.9 | 34 | 37 | −3 | −7.6 |
| I | 2020 | May | 487 | 396 | 91 | 22.9 | 122 | 116 | 6 | 5.2 | 117 | 134 | −17 | −12.5 | 52 | 58 | −6 | −10.2 |
| I | 2020 | Jun | 253 | 229 | 24 | 10.3 | 40 | 52 | −12 | −22.8 | 90 | 89 | 1 | 1.0 | 41 | 42 | −1 | −3.0 |
| II | 2020 | Nov | 371 | 328 | 43 | 13.0 | 28 | 40 | −12 | −30.0 | 87 | 124 | −37 | −30.0 | 43 | 61 | −18 | −29.4 |
| II | 2020 | Dec | 299 | 305 | −6 | −2.0 | 17 | 37 | −20 | −54.6 | 64 | 119 | −55 | −46.2 | 31 | 59 | −28 | −47.4 |
| II | 2021 | Jan | 310 | 244 | 66 | 27.0 | 33 | 29 | 4 | 12.2 | 96 | 99 | −3 | −3.0 | 42 | 44 | −2 | −5.3 |
| II | 2021 | Feb | 222 | 185 | 37 | 20.0 | 26 | 23 | 3 | 15.4 | 72 | 75 | −3 | −3.8 | 37 | 34 | 3 | 9.2 |
| II | 2021 | Mar | 269 | 191 | 78 | 40.8 | 26 | 25 | 1 | 5.3 | 88 | 74 | 14 | 19.1 | 55 | 37 | 18 | 49.1 |
| II | 2021 | Apr | 256 | 241 | 15 | 6.1 | 39 | 52 | −13 | −25.5 | 100 | 90 | 10 | 10.9 | 47 | 39 | 8 | 20.0 |
| II | 2021 | May | 438 | 421 | 17 | 4.0 | 96 | 123 | −27 | −21.7 | 159 | 142 | 17 | 12.1 | 76 | 62 | 14 | 23.1 |
| II | 2021 | Jun | 273 | 244 | 29 | 12.0 | 50 | 55 | −5 | −8.6 | 102 | 94 | 8 | 8.1 | 54 | 45 | 9 | 20.1 |
| Chi-square test | χ2 = 19.30, p = 0.09 | χ2 = 12.88, NS | χ2 = 25.25, p < 0.01 | χ2 = 18.97, p = 0.06 | ||||||||||||||
| Wilcoxon test * | W = 72, p < 0.01 | W = 62, p = 0.07 | W = 46.5, NS | W = 39, NS | ||||||||||||||
Disclaimer/Publisher’s Note: The statements, opinions and data contained in all publications are solely those of the individual author(s) and contributor(s) and not of MDPI and/or the editor(s). MDPI and/or the editor(s) disclaim responsibility for any injury to people or property resulting from any ideas, methods, instructions or products referred to in the content. |
© 2023 by the authors. Licensee MDPI, Basel, Switzerland. This article is an open access article distributed under the terms and conditions of the Creative Commons Attribution (CC BY) license (https://creativecommons.org/licenses/by/4.0/).
Share and Cite
Balčiauskas, L.; Stratford, J.; Kučas, A.; Balčiauskienė, L. Lockdown’s Silver Lining? Different Levels of Roadkill during the COVID-19 Times in Lithuania. Animals 2023, 13, 2918. https://doi.org/10.3390/ani13182918
Balčiauskas L, Stratford J, Kučas A, Balčiauskienė L. Lockdown’s Silver Lining? Different Levels of Roadkill during the COVID-19 Times in Lithuania. Animals. 2023; 13(18):2918. https://doi.org/10.3390/ani13182918
Chicago/Turabian StyleBalčiauskas, Linas, Jos Stratford, Andrius Kučas, and Laima Balčiauskienė. 2023. "Lockdown’s Silver Lining? Different Levels of Roadkill during the COVID-19 Times in Lithuania" Animals 13, no. 18: 2918. https://doi.org/10.3390/ani13182918
APA StyleBalčiauskas, L., Stratford, J., Kučas, A., & Balčiauskienė, L. (2023). Lockdown’s Silver Lining? Different Levels of Roadkill during the COVID-19 Times in Lithuania. Animals, 13(18), 2918. https://doi.org/10.3390/ani13182918