
A Comparative Phylogeography of Three Marine Species with Different PLD Modes Reveals Two Genetic Breaks across the Southern Caribbean Sea
 , , , , and
Simple Summary
Abstract
1. Introduction

2. Materials and Methods
2.1. Sampling
2.2. Laboratory Procedures
2.3. De Novo Assembly Reads
2.4. Analysis of Data
2.4.1. Genetic and Phylogeographic Structure
2.4.2. Population Model
2.4.3. Phylogeographic Concordance between Species
3. Results
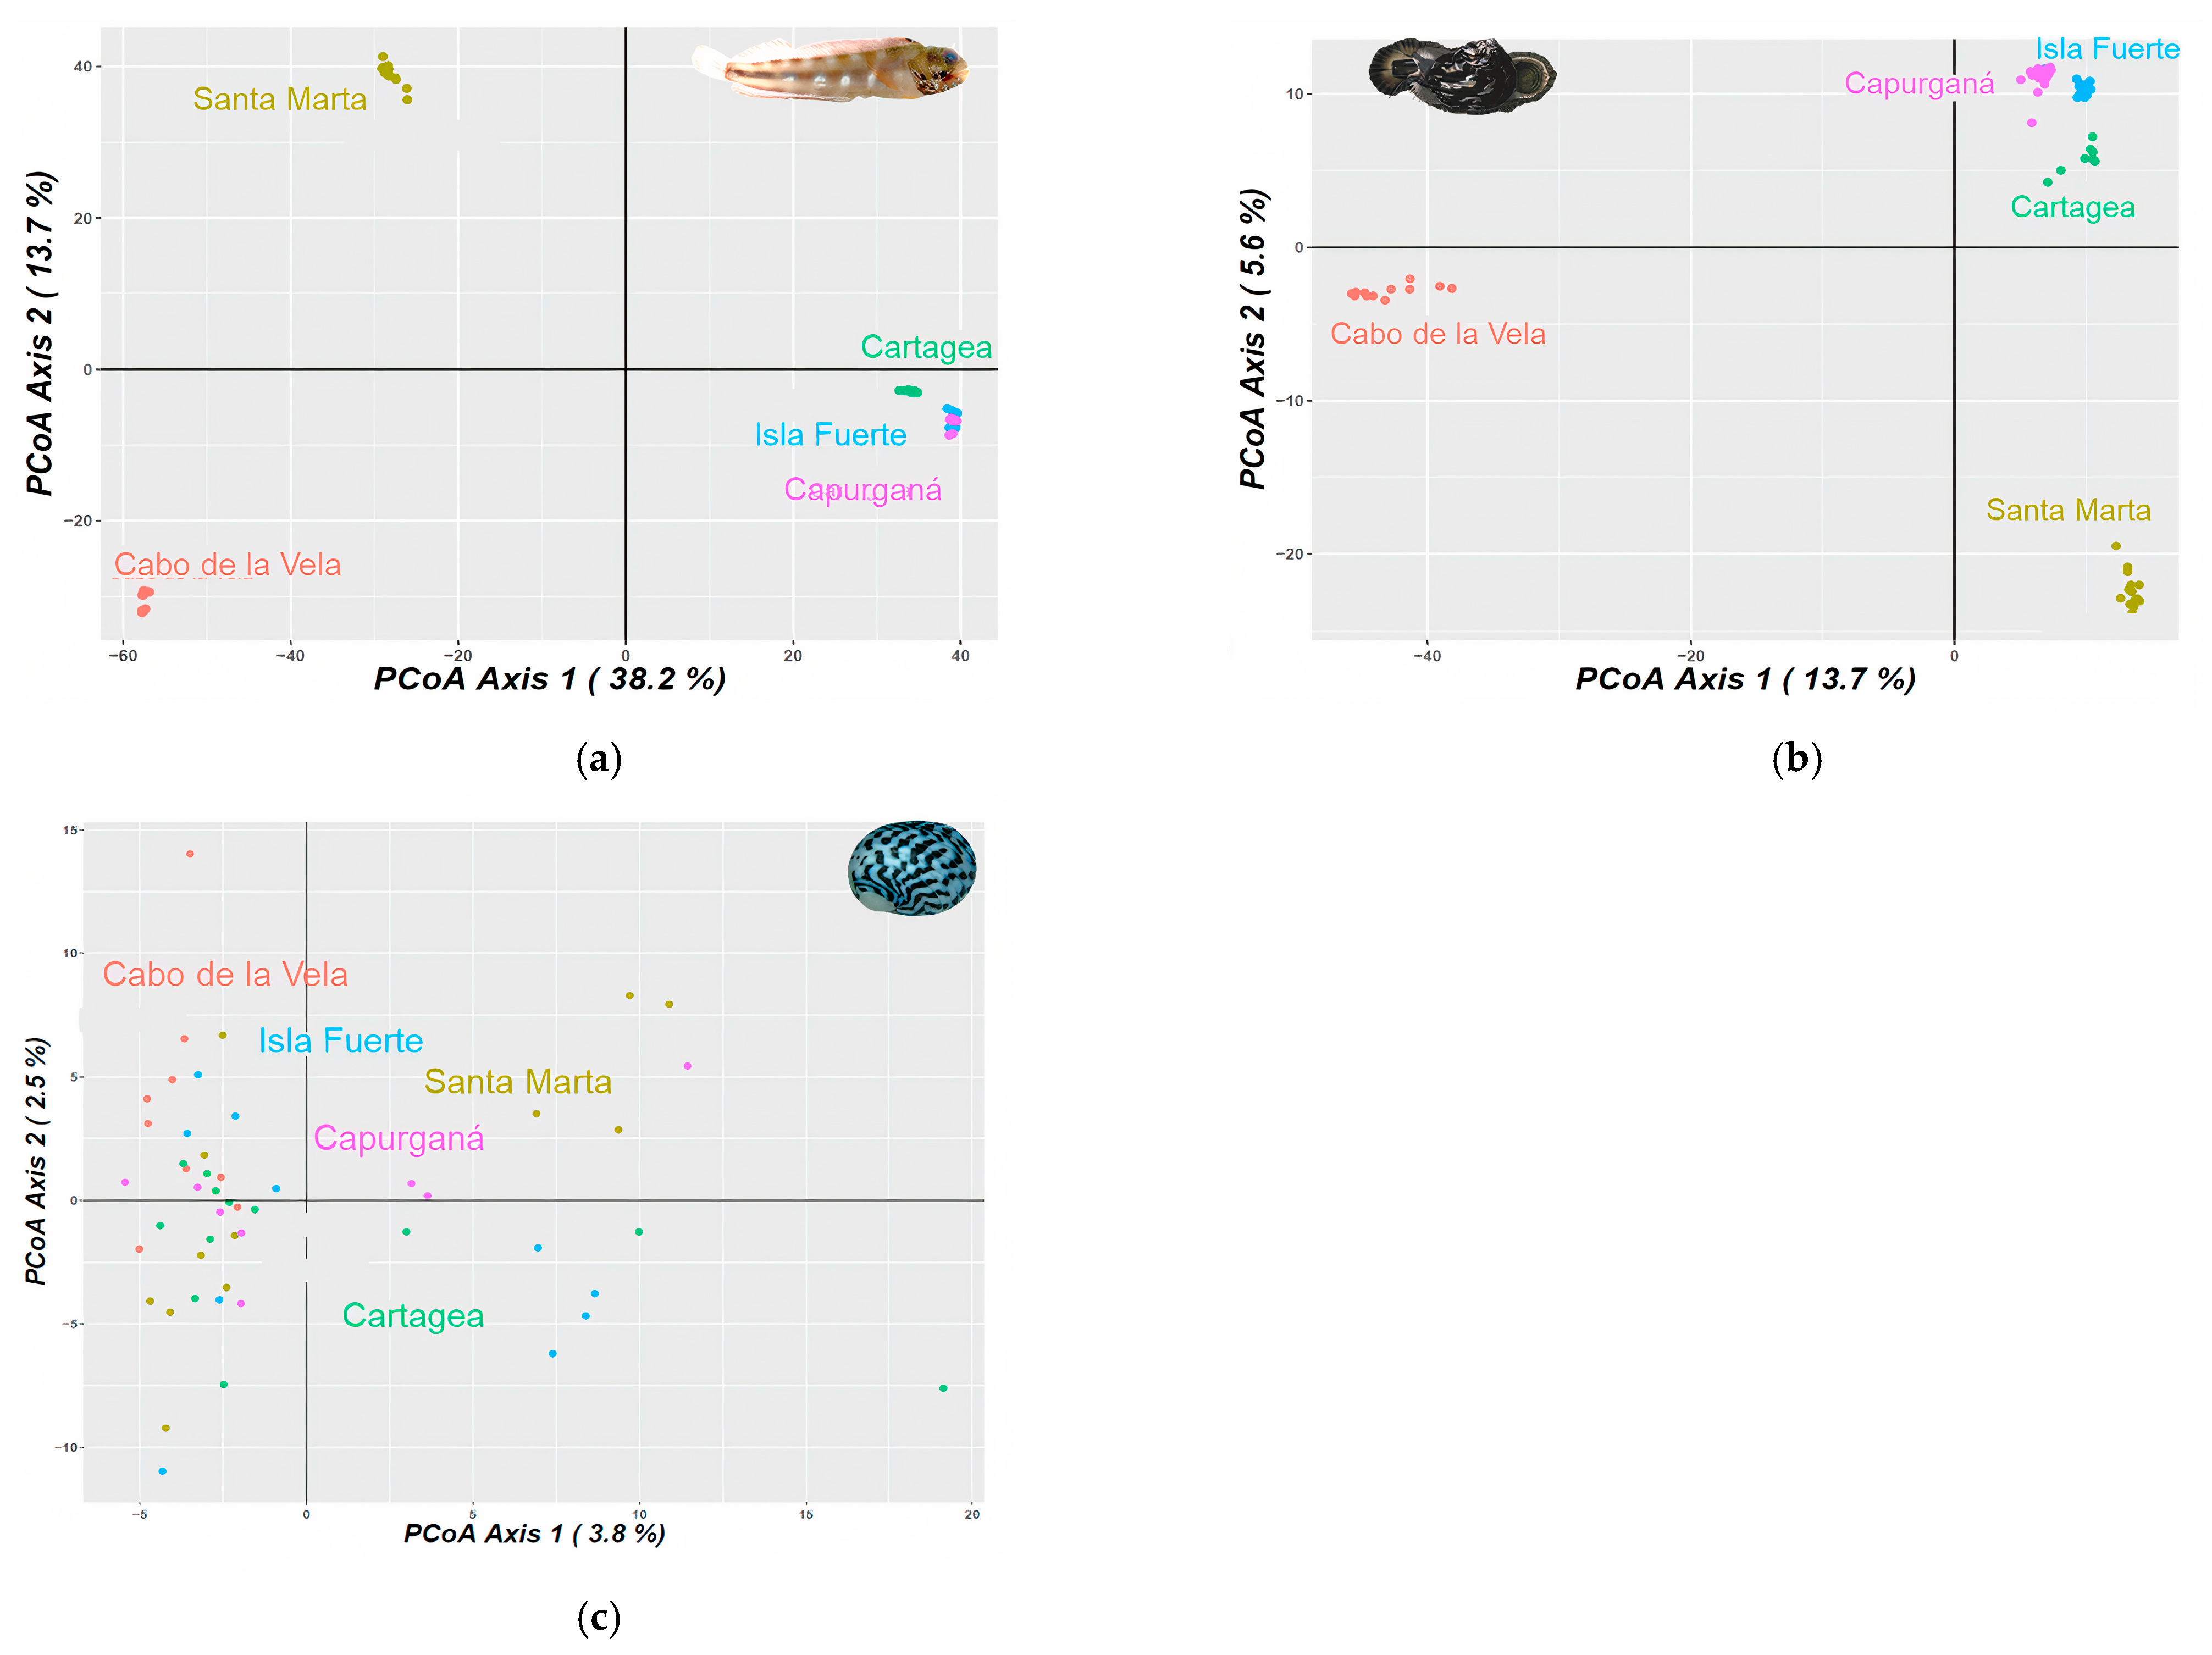
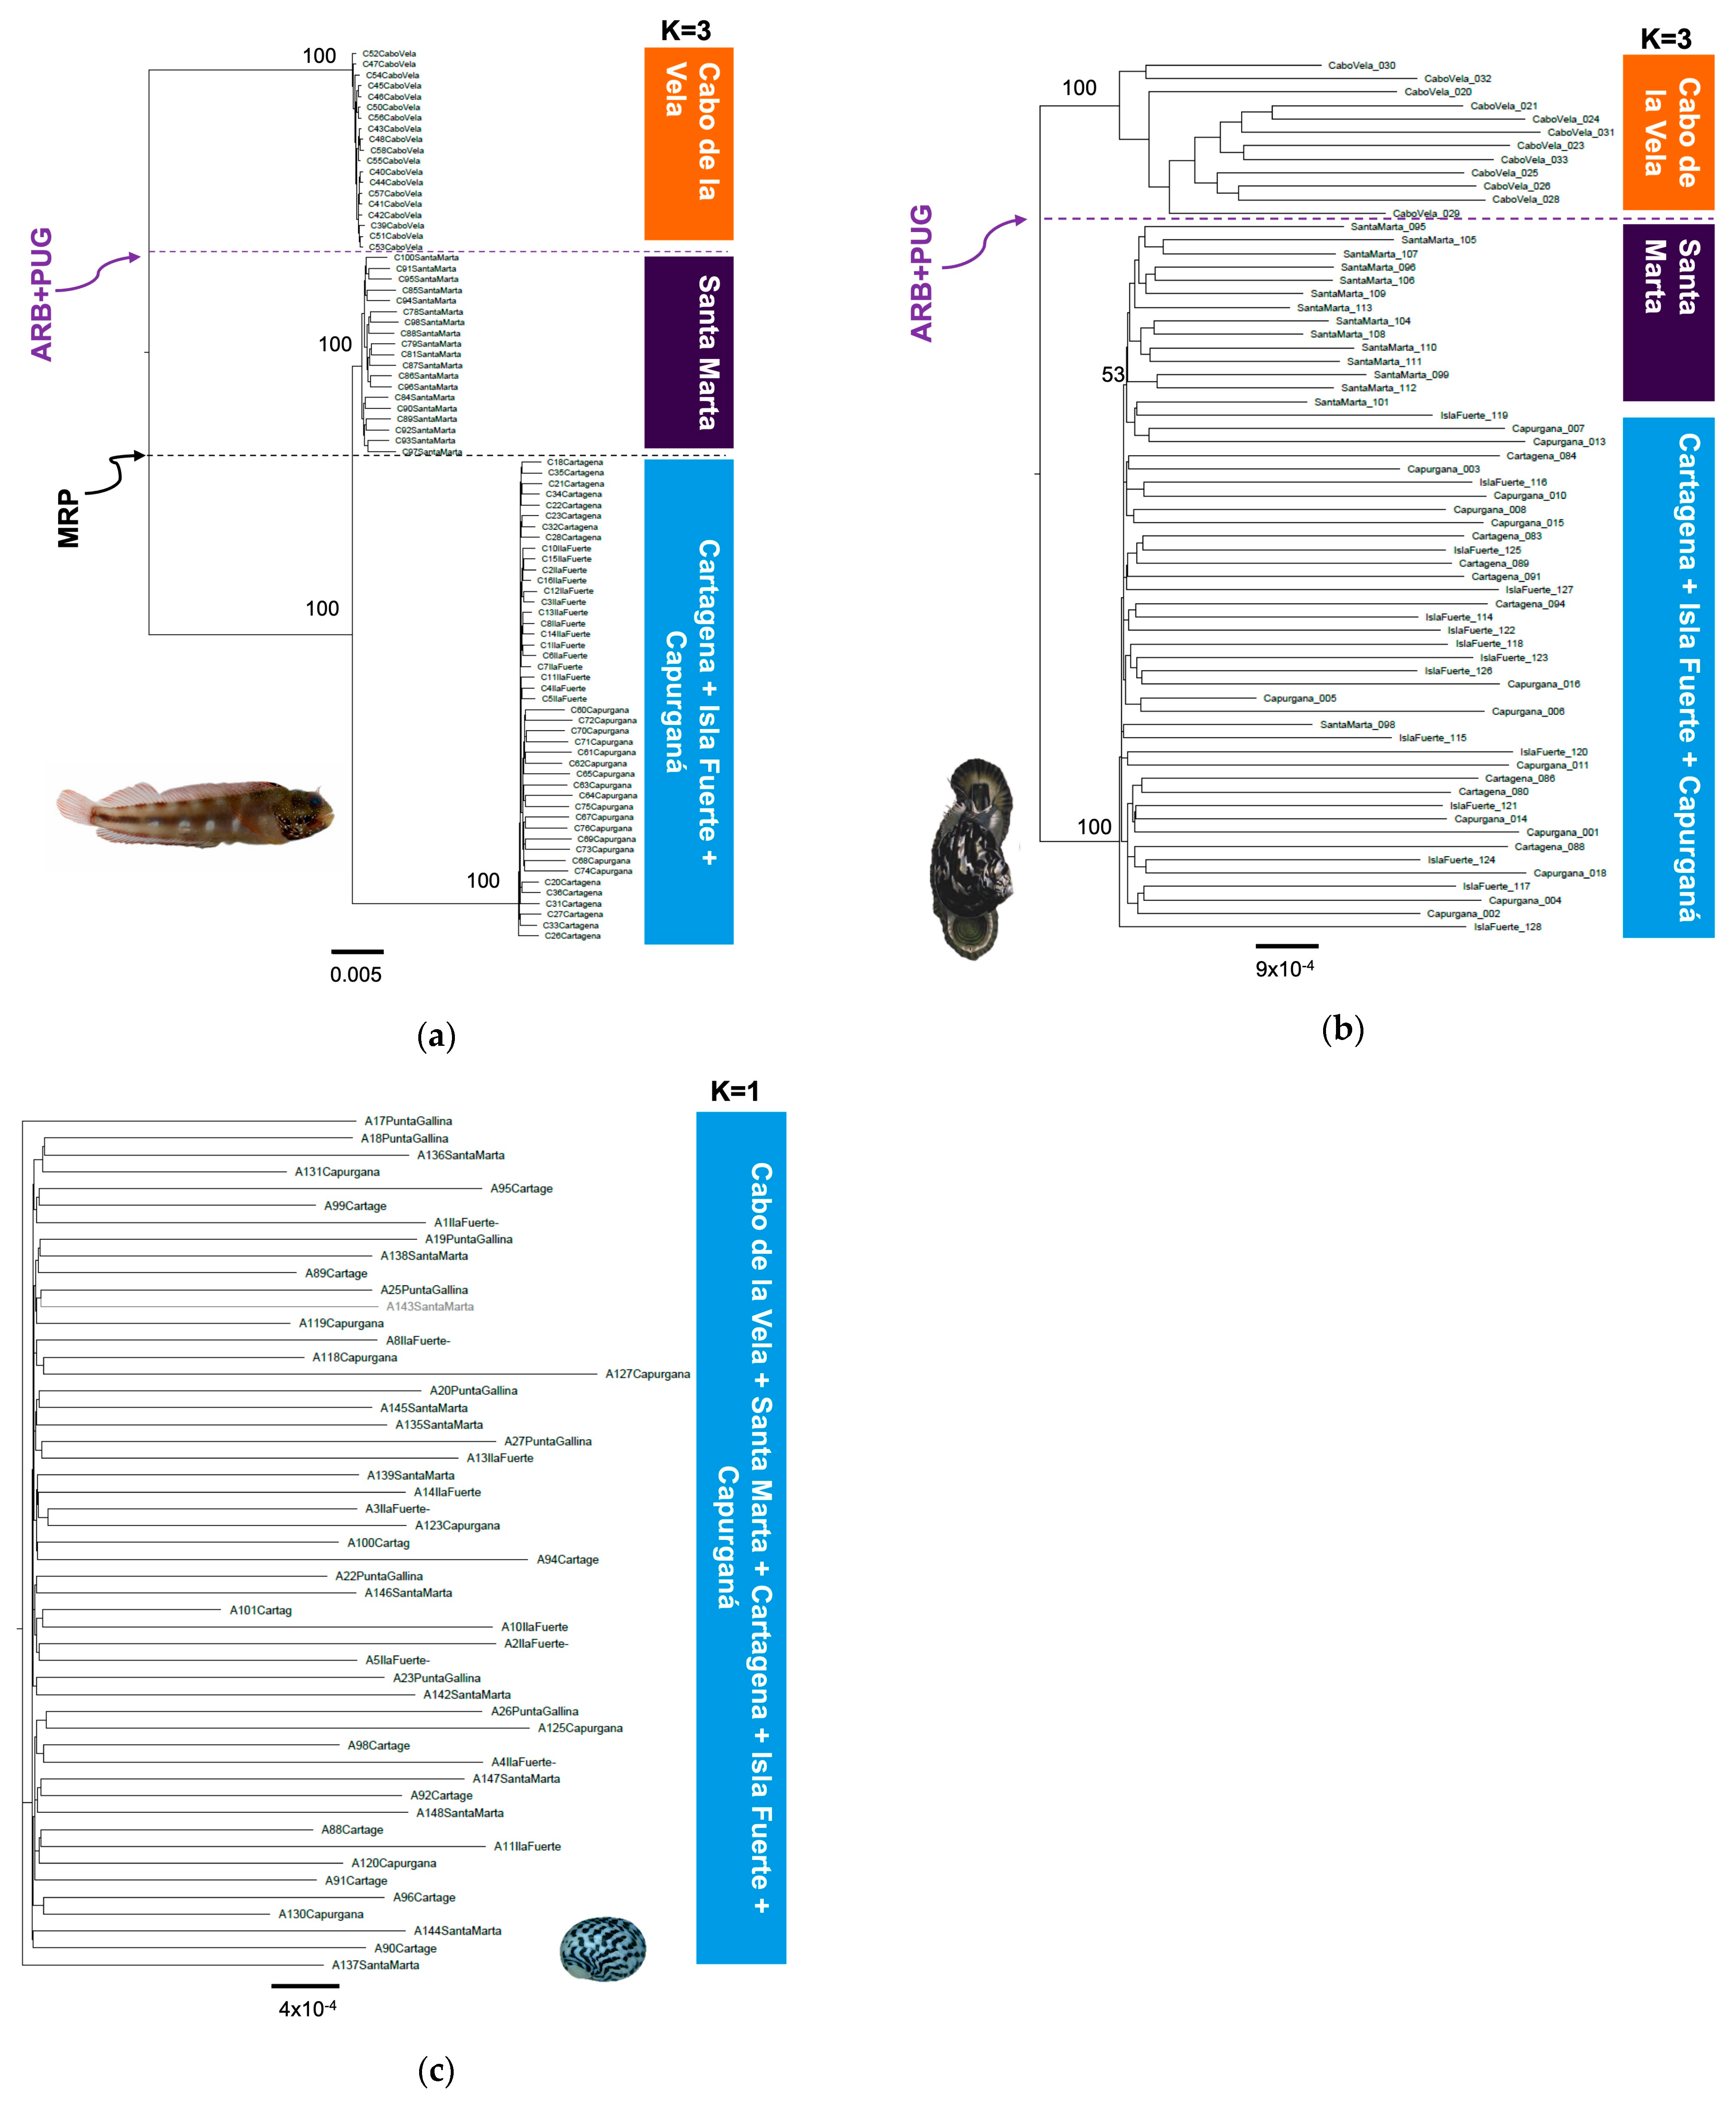
3.1. Genetic and Phylogeographic Structure
3.2. Identification of Phylogeographic Breaks
3.3. Population Model
3.4. Phylogeographic Concordance between Species
4. Discussion
4.1. Genetic and Phylogeographic Structure
4.2. Identification of Phylogeographic Breaks, Population Models, and Phylogeographic Concordance
4.3. Conservation Aspects
5. Conclusions
Supplementary Materials
Author Contributions
Funding
Institutional Review Board Statement
Informed Consent Statement
Data Availability Statement
Acknowledgments
Conflicts of Interest
References
- Hellberg, M.E.; Burton, R.S.; Neigel, J.E.; Palumbi, S.R. Genetic Assessment of Connectivity among Marine Populations. Bull. Mar. Sci. 2002, 70, 273–290. [Google Scholar]
- Cowen, R.K. Larval Dispersal and Retention and Consequences for Population Connectivity. In Coral Reef Fishes; Elsevier: Amsterdam, The Netherlands, 2002; pp. 149–170. [Google Scholar] [CrossRef]
- Crandall, E.D.; Frey, M.A.; Grosberg, R.K.; Barber, P.H.; Crandall, E.D.; Frey, M.A.; Grosberg, R.K.; Barber, P.H. Contrasting Demographic History and Phylogeographical Patterns in Two Indo-Pacific Gastropods. Mol. Ecol. 2008, 17, 611–626. Available online: https://digitalcommons.csumb.edu/sns_fac (accessed on 1 December 2022). [CrossRef] [PubMed]
- Avise, J.C. Phylogeography: Retrospect and Prospect. J. Biogeogr. 2009, 36, 3–15. [Google Scholar] [CrossRef]
- Ayre, D.J.; Minchinton, T.E.; Perrin, C. Does Life History Predict Past and Current Connectivity for Rocky Intertidal Invertebrates across a Marine Biogeographic Barrier? Mol. Ecol. 2009, 18, 1887–1903. [Google Scholar] [CrossRef]
- Pelc, R.A.; Warner, R.R.; Gaines, S.D. Geographical Patterns of Genetic Structure in Marine Species with Contrasting Life Histories. J. Biogeogr. 2009, 36, 1881–1890. [Google Scholar] [CrossRef]
- Derycke, S.; Backeljau, T.; Moens, T. Dispersal and Gene Flow in Free-Living Marine Nematodes. Front. Zool. 2013, 10, 1. [Google Scholar] [CrossRef] [PubMed]
- Crandall, E.D.; Treml, E.A.; Liggins, L.; Gleeson, L.; Yasuda, N.; Barber, P.H.; Wörheide, G.; Riginos, C. Return of the Ghosts of Dispersal Past: Historical Spread and Contemporary Gene Flow in the Blue Sea Star Linckia Laevigata. Bull. Mar. Sci. 2014, 90, 399–425. [Google Scholar] [CrossRef]
- Fenberg, P.B.; Posbic, K.; Hellberg, M.E. Historical and Recent Processes Shaping the Geographic Range of a Rocky Intertidal Gastropod: Phylogeography, Ecology, and Habitat Availability. Ecol. Evol. 2014, 4, 3244–3255. [Google Scholar] [CrossRef]
- Villamor, A.; Costantini, F.; Abbiati, M. Genetic Structuring across Marine Biogeographic Boundaries in Rocky Shore Invertebrates. PLoS ONE 2014, 9, e101135. [Google Scholar] [CrossRef]
- Mattos, G.; Seixas, V.C.; Paiva, P.C. Comparative Phylogeography and Genetic Connectivity of Two Crustacean Species with Contrasting Life Histories on South Atlantic Sandy Beaches. Hydrobiologia 2019, 826, 319–330. [Google Scholar] [CrossRef]
- Rocha, L.A. Patterns of Distribution and Processes of Speciation in Brazilian Reef Fishes. J. Biogeogr. 2003, 30, 1161–1171. [Google Scholar] [CrossRef]
- Haye, P.A.; Segovia, N.I.; Muñoz-Herrera, N.C.; Gálvez, F.E.; Martínez, A.; Meynard, A.; Pardo-Gandarillas, M.C.; Poulin, E.; Faugeron, S. Phylogeographic Structure in Benthic Marine Invertebrates of the Southeast Pacific Coast of Chile with Differing Dispersal Potential. PLoS ONE 2014, 9, e88613. [Google Scholar] [CrossRef]
- Dalongeville, A.; Andrello, M.; Mouillot, D.; Albouy, C.; Manel, S. Ecological Traits Shape Genetic Diversity Patterns across the Mediterranean Sea: A Quantitative Review on Fishes. J. Biogeogr. 2016, 43, 845–857. [Google Scholar] [CrossRef]
- Fratini, S.; Ragionieri, L.; Cannicci, S. Demographic History and Reproductive Output Correlates with Intraspecific Genetic Variation in Seven Species of Indo-Pacific Mangrove Crabs. PLoS ONE 2016, 11, e0158582. [Google Scholar] [CrossRef]
- Krueck, N.C.; Treml, E.A.; Innes, D.J.; Ovenden, J.R. Ocean Currents and the Population Genetic Signature of Fish Migrations. Ecology 2020, 101, e02967. [Google Scholar] [CrossRef]
- Cowen, R.K.; Paris, C.B.; Srinivasan, A. Scaling of Connectivity in Marine Populations. Science 2006, 311, 522–527. [Google Scholar] [CrossRef] [PubMed]
- Weersing, K.; Toonen, R.J. Population Genetics, Larval Dispersal, and Connectivity in Marine Systems. Mar. Ecol. Prog. Ser. 2009, 393, 1–12. [Google Scholar] [CrossRef]
- Modica, M.V.; Russini, V.; Fassio, G.; Oliverio, M. Do Larval Types Affect Genetic Connectivity at Sea? Testing Hypothesis in Two Sibling Marine Gastropods with Contrasting Larval Development. Mar. Environ. Res. 2017, 127, 92–101. [Google Scholar] [CrossRef]
- Kyle, C.J.; Boulding, E.G. Comparative Population Genetic Structure of Marine Gastropods (Littorina Spp.) with and without Pelagic Larval Dispersal. Mar. Biol. 2000, 137, 835–845. [Google Scholar] [CrossRef]
- Blanco, G.E.; Knutsen, H.; Jorde, P.E. Habitat Discontinuities Separate Genetically Divergent Populations of a Rocky Shore Marine Fish. PLoS ONE 2016, 11, e0163052. [Google Scholar] [CrossRef]
- Riginos, C.; Nachman, M.W. Population Subdivision in Marine Environments: The Contributions of Biogeography, Geographical Distance and Discontinuous Habitat to Genetic Differentiation in a Blennioid Fish, Axoclinus nigricaudus. Mol. Ecol. 2001, 10, 1439–1453. [Google Scholar] [CrossRef]
- Baums, I.B.; Paris, C.B.; Chérubin, L.M. A Bio-Oceanographic Filter to Larval Dispersal in a Reef-Building Coral. Limnol. Ocean. 2006, 51, 1969–1981. [Google Scholar] [CrossRef]
- Dong, Y.W.; Wang, H.S.; Han, G.D.; Ke, C.H.; Zhan, X.; Nakano, T.; Williams, G.A. The Impact of Yangtze River Discharge, Ocean Currents and Historical Events on the Biogeographic Pattern of Cellana toreuma along the China Coast. PLoS ONE 2012, 7, e36178. [Google Scholar] [CrossRef]
- Yu, H.J.; Kim, J.K. Upwelling and Eddies Affect Connectivity among Local Populations of the Goldeye Rockfish, Sebastes thompsoni (Pisces, Scorpaenoidei). Ecol. Evol. 2018, 8, 4387–4402. [Google Scholar] [CrossRef]
- Arndt, A.; Smith, M.J. Genetic Diversity and Population Structure in Two Species of Sea Cucumber: Differing Patterns According to Mode of Development. Mol. Ecol. 1998, 7, 1053–1064. [Google Scholar] [CrossRef]
- Kelly, R.P.; Palumbi, S.R. Genetic Structure among 50 Species of the Northeastern Pacific Rocky Intertidal Community. PLoS ONE 2010, 5, e8594. [Google Scholar] [CrossRef]
- Teske, P.R.; Sandoval-Castillo, J.; Waters, J.; Beheregaray, L.B. An Overview of Australia’s Temperate Marine Phylogeography, with New Evidence from High-Dispersal Gastropods. J. Biogeogr. 2017, 44, 217–229. [Google Scholar] [CrossRef]
- Loera-Padilla, F.J.; Piñeros, V.J.; Baldwin, C.C.; Cox, C.E.; Simoes, N.; Ribeiro, E.; Lasso-Alcalá, O.M.; Domínguez-Domínguez, O. Phylogeography, Population Connectivity and Demographic History of the Stoplight Parrotfish, Sparisoma viride (Teleostei: Labridae), in the Greater Caribbean. Coral Reefs 2021, 41, 753–765. [Google Scholar] [CrossRef]
- Stark, T.E.; Simoes, N.; Daly, M. Phylogeography and Genetic Diversity of the Commercially-Collected Caribbean Blue-Legged Hermit Crab (Clibanarius tricolor). Conserv. Genet. 2021, 22, 465–482. [Google Scholar] [CrossRef]
- Luiz, O.J.; Madin, J.S.; Ross Robertson, D.; Rocha, L.A.; Wirtz, P.; Floeter, S.R. Ecological Traits Influencing Range Expansion across Large Oceanic Dispersal Barriers: Insights from Tropical Atlantic Reef Fishes. Proc. R. Soc. B Biol. Sci. 2012, 279, 1033–1040. [Google Scholar] [CrossRef]
- Silva, D.; Martins, K.; Oliveira, J.; da Silva, R.; Sampaio, I.; Schneider, H.; Gomes, G. Genetic Differentiation in Populations of Lane Snapper (Lutjanus synagris—Lutjanidae) from Western Atlantic as Revealed by Multilocus Analysis. Fish. Res. 2018, 198, 138–149. [Google Scholar] [CrossRef]
- Spalding, M.D.; Fox, H.E.; Allen, G.R.; Davidson, N.; Ferdaña, Z.A.; Finlayson, M.; Halpern, B.S.; Jorge, M.A.; Lombana, A.; Lourie, S.A.; et al. Marine Ecoregions of the World: A Bioregionalization of Coastal and Shelf Areas. Bioscience 2007, 57, 573–583. [Google Scholar] [CrossRef]
- Robertson, D.R.; Cramer, K.L. Defining and Dividing the Greater Caribbean: Insights from the Biogeography of Shorefishes. PLoS ONE 2014, 9, e102918. [Google Scholar] [CrossRef] [PubMed]
- Betancur-R, R.; Arturo Acero, P.; Duque-Caro, H.; Santos, S.R. Phylogenetic and Morphologic Analyses of a Coastal Fish Reveals a Marine Biogeographic Break of Terrestrial Origin in the Southern Caribbean. PLoS ONE 2010, 5, e11566. [Google Scholar] [CrossRef] [PubMed]
- Diaz, J.M. Zoogeography of Marine Gastropod in the Southern Caribbean: A New Look at Provinciality. Caribb. J. Sci. 1995, 31, 104–121. [Google Scholar]
- Flórez, A. Colombia: Evolución de Sus Relieves y Modelados, Bogotá. 2003. Available online: https://repositorio.unal.edu.co/handle/unal/53415 (accessed on 18 February 2023).
- Taylor, M.S.; Hellberg, M.E. Genetic Evidence for Local Retention of Pelagic Larvae in a Caribbean Reef Fish. Science 2003, 299, 107–109. [Google Scholar] [CrossRef]
- Baums, I.B.; Miller, M.W.; Hellberg, M.E. Regionally Isolated Populations of an Imperiled Caribbean Coral, Acropora palmata. Mol. Ecol. 2005, 14, 1377–1390. [Google Scholar] [CrossRef]
- Díaz-Ferguson, E.; Haney, R.; Wares, J.; Silliman, B. Population Genetics of a Trochid Gastropod Broadens Picture of Caribbean Sea Connectivity. PLoS ONE 2010, 5, e12675. [Google Scholar] [CrossRef]
- Foster, N.L.; Paris, C.B.; Kool, J.T.; Baums, I.B.; Stevens, J.R.; Sanchez, J.A.; Bastidas, C.; Agudelo, C.; Bush, P.; Day, O.; et al. Connectivity of Caribbean Coral Populations: Complementary Insights from Empirical and Modelled Gene Flow. Mol. Ecol. 2012, 21, 1143–1157. [Google Scholar] [CrossRef]
- Porto-Hannes, I.; Zubillaga, A.L.; Shearer, T.L.; Bastidas, C.; Salazar, C.; Coffroth, M.A.; Szmant, A.M. Population Structure of the Corals Orbicella faveolata and Acropora palmata in the Mesoamerican Barrier Reef System with Comparisons over Caribbean Basin-Wide Spatial Scale. Mar. Biol. 2015, 162, 81–98. [Google Scholar] [CrossRef]
- Devlin-Durante, M.K.; Baums, I.B. Genome-Wide Survey of Single-Nucleotide Polymorphisms Reveals Fine-Scale Population Structure and Signs of Selection in the Threatened Caribbean Elkhorn Coral, Acropora palmata. PeerJ 2017, 2017, e4077. [Google Scholar] [CrossRef]
- Rippe, J.P.; Matz, M.V.; Green, E.A.; Medina, M.; Khawaja, N.Z.; Pongwarin, T.; Pinzón C, J.H.; Castillo, K.D.; Davies, S.W. Population Structure and Connectivity of the Mountainous Star Coral, Orbicella faveolata, throughout the Wider Caribbean Region. Ecol. Evol. 2017, 7, 9234–9246. [Google Scholar] [CrossRef]
- Alegría-Ortega, A.; Sanín-Pérez, M.J.; Quan-Young, L.I.; Londoño-Mesa, M.H. Genetic Structure of Orbicella faveolata Population Reveals High Connectivity among a Marine Protected Area and Varadero Reef in the Colombian Caribbean. Aquat. Conserv. 2021, 31, 764–776. [Google Scholar] [CrossRef]
- Ospina-Guerrero, S.; Landínez-García, R.; Rodríguez-Castro, D.; Arango, R.; Márquez, E. Genetic Connectivity of Stegastes partitus in the South Caribbean Evidenced by Microsatellite Analysis. Cienc. Mar. 2008, 34, 155–163. [Google Scholar] [CrossRef][Green Version]
- Landínez-García, R.M.; Ospina-Guerrero, S.P.; Rodríguez-Castro, D.J.; Arango, R.; Márquez, E. Genetic Analysis of Lutjanus synagris Populations in the Colombian Caribbean. Cienc. Mar. 2009, 35, 321–331. [Google Scholar] [CrossRef]
- Díaz-Ferguson, E.; Haney, R.A.; Wares, J.P.; Silliman, B.R. Genetic Structure and Connectivity Patterns of Two Caribbean Rocky-Intertidal Gastropods. J. Molluscan Stud. 2012, 78, 112–118. [Google Scholar] [CrossRef]
- Caiafa-Hernández, I.; Narváez-Barandica, J.; Acero-Pizarro, A. Genetic Variation and Genetic Structure of Caranx hippos (Teleostei: Carangidae) in the Colombian Caribbean. Rev. Biol. Trop. 2018, 66, 122–135. [Google Scholar] [CrossRef]
- Mendoza-Ureche, R.; Quintero-Galvis, J.F.; Narváez-Barandica, J.C. Baja Variabilidad y Diferenciación Genética Poblacional En La “Lisa”, Mugil incilis (Teleostei: Mugilidae) Del Caribe Colombiano. Rev. Biol. Trop. 2019, 67, 501–517. [Google Scholar]
- Benavides Serrato, M. Connectivity between Natural Populations of the Sea Urchin Echinometra Lucunter Lucunter (Echinodermata: Echinoidea: Echinometridae) throughout the Caribbean Region. Available online: https://repositorio.unal.edu.co/handle/unal/79147?show=full (accessed on 18 July 2023).
- Atencia-Galindo, M.A.; Narvaéz, J.C.; Ramírez, A.; Paramo, J.; Aguirre-Pabón, J.C. Genetic Structure of the Pink Shrimp Penaeus (Farfantepenaeus) notialis (Pérez-Farfante, 1967) (Decapoda: Penaeidae) in the Colombian Caribbean. Fish. Res. 2021, 243, 106052. [Google Scholar] [CrossRef]
- Velasco-Montoya, D.A.; Millán-Márquez, A.M.; Tavera, J. Genetic Connectivity in Sparisoma aurofrenatum (Redband Parrotfish): An Unexpected Journey. Hydrobiologia 2022, 849, 1727–1741. [Google Scholar] [CrossRef]
- García-Urueña, R.; Kitchen, S.A.; Schizas, N.V. Fine Scale Population Structure of Acropora palmata and Acropora cervicornis in the Colombian Caribbean. PeerJ 2022, 10, e13854. [Google Scholar] [CrossRef]
- Andrade Amaya, C.A. Oceanografía Dinámica de La Cuenca de Colombia, 1st ed.; Alpha Editores: Cartagena, Colombia, 2015. [Google Scholar]
- Correa-Ramirez, M.; Rodriguez-Santana, Á.; Ricaurte-Villota, C.; Paramo, J. The Southern Caribbean Upwelling System off Colombia: Water Masses and Mixing Processes. Deep Sea Res. Part I Oceanogr. Res. Pap. 2020, 155, 103145. [Google Scholar] [CrossRef]
- Bernal, G.; Poveda, G.; Roldán, P.; Andrade, C. Patrones de Variabilidad de Las Temperaturas Superficiales Del Mar En La Costa Caribe Colombiana. Rev. Acad. Colomb. Cienc. Exactas Fis. Nat. 2006, 30, 195–208. [Google Scholar]
- Orfila, A.; Urbano-Latorre, C.P.; Sayol, J.M.; Gonzalez-Montes, S.; Caceres-Euse, A.; Hernández-Carrasco, I.; Muñoz, Á.G. On the Impact of the Caribbean Counter Current in the Guajira Upwelling System. Front. Mar. Sci. 2021, 8, 626823. [Google Scholar] [CrossRef]
- Gaspar, A.G.; Acero, A.P. Comparison of the Upwellings of the Colombian Guajira and Eastern Venezuela. Bol. Investig. Mar. Y Costeras 2020, 49, 131–172. [Google Scholar] [CrossRef]
- Acero, P.A.; Polanco, F.A. Biodiversidad Íctica de Los Mares Colombianos: Riqueza Amenazada. Rev. Acad. Colomb. Cienc. Exactas Fis. Nat. 2017, 41, 200. [Google Scholar] [CrossRef][Green Version]
- Bell, L.J. Reproduction and Larval Development of the West Indian Topshell, Cittarium pica (Trochidae), in the Bahamas. Bull. Mar. Sci. 1992, 51, 250–266. [Google Scholar]
- Velasco, L.A.; Barros, J. Spawning and Early Development of the West Indian Top Shell, Cittarium pica (Linnaeus, 1758), under Ex-Situ Conditions. Aquat. Living Resour. 2017, 30, 22. [Google Scholar] [CrossRef]
- Acero, A. The Chaenopsine Blennies of the Southwestern Caribbean (Pisces: Clinidae: Chaenopsinae). II. The Genera Acanthemblemaria, Ekemblemaria and Lucayablennius. Rev. Biol. Trop. 1984, 32, 35–44. [Google Scholar]
- Johnson, G.D.; Brothers, E.B. Acanthemblemaria Paula, a New Diminutive Chaenopsid (Pisces: Blennioidei) from Belize, with Comments on Life History. Proc. Biol. Soc. Wash. 1989, 102, 1018–1030. [Google Scholar]
- Underwood, A.J. Comparative Studies on the Biology of Nerita atramentosa Reeve, Bembicium nanum (Lamarck) and Cellana tramoserica (Sowerby) (Gastropoda: Prosobranchia) in S.E. Australia. J. Exp. Mar. Biol. Ecol. 1975, 18, 153–172. [Google Scholar] [CrossRef]
- Waters, J.M.; King, T.M.; O’Loughlin, P.M.; Spencer, H.G. Phylogeographical Disjunction in Abundant High-Dispersal Littoral Gastropods. Mol. Ecol. 2005, 14, 2789–2802. [Google Scholar] [CrossRef]
- Reisser, C.M.O.; Bell, J.J.; Gardner, J.P.A. Correlation between Pelagic Larval Duration and Realised Dispersal: Long-Distance Genetic Connectivity between Northern New Zealand and the Kermadec Islands Archipelago. Mar. Biol. 2014, 161, 297–312. [Google Scholar] [CrossRef]
- Hastings, P.A.; Eytan, R.I.; Summers, A.P. Acanthemblemaria aceroi, a New Species of Tube Blenny from the Caribbean Coast of South America with Notes on Acanthemblemaria johnsoni (Teleostei: Chaenopsidae). Zootaxa 2020, 4816, 209–216. [Google Scholar] [CrossRef]
- Gutiérrez-Garíca, T.A.; Vázquez-Domínguez, E. Comparative Phylogeography: Designing Studies While Surviving the Process. BioScience 2011, 61, 857–868. [Google Scholar] [CrossRef]
- Li, Y.-L.; Liu, J.-X.; Jin-Xian Liu, C. StructureSelector: A Web-Based Software to Select and Visualize the Optimal Number of Clusters Using Multiple Methods. Mol. Ecol. Resour. 2017, 18, 176–177. [Google Scholar] [CrossRef]
- Peterson, B.K.; Weber, J.N.; Kay, E.H.; Fisher, H.S.; Hoekstra, H.E. Double Digest RADseq: An Inexpensive Method for de Novo SNP Discovery and Genotyping in Model and Non-Model Species. PLoS ONE 2012, 7, e37135. [Google Scholar] [CrossRef]
- Baird, N.A.; Etter, P.D.; Atwood, T.S.; Currey, M.C.; Shiver, A.L.; Lewis, Z.A.; Selker, E.U.; Cresko, W.A.; Johnson, E.A. Rapid SNP Discovery and Genetic Mapping Using Sequenced RAD Markers. PLoS ONE 2008, 3, e3376. [Google Scholar] [CrossRef]
- Catchen, J.; Hohenlohe, P.A.; Bassham, S.; Amores, A.; Cresko, W.A. Stacks: An Analysis Tool Set for Population Genomics. Mol. Ecol. 2013, 22, 3124–3140. [Google Scholar] [CrossRef]
- Rochette, N.C.; Rivera-Colón, A.G.; Catchen, J.M. Stacks 2: Analytical Methods for Paired-End Sequencing Improve RADseq-Based Population Genomics. Mol. Ecol. 2019, 28, 4737–4754. [Google Scholar] [CrossRef]
- Paris, J.R.; Stevens, J.R.; Catchen, J.M. Lost in Parameter Space: A Road Map for Stacks. Methods Ecol. Evol. 2017, 8, 1360–1373. [Google Scholar] [CrossRef]
- Nadukkalam Ravindran, P.; Bentzen, P.; Bradbury, I.R.; Beiko, R.G. RADProc: A Computationally Efficient de Novo Locus Assembler for Population Studies Using RADseq Data. Mol. Ecol. Resour. 2019, 19, 272–282. [Google Scholar] [CrossRef] [PubMed]
- Lischer, H.E.L.; Excoffier, L. PGDSpider: An Automated Data Conversion Tool for Connecting Population Genetics and Genomics Programs. Bioinformatics 2012, 28, 298–299. [Google Scholar] [CrossRef] [PubMed]
- Meirmans, P.G. Genodive Version 3.0: Easy-to-Use Software for the Analysis of Genetic Data of Diploids and Polyploids. Mol. Ecol. Resour. 2020, 20, 1126–1131. [Google Scholar] [CrossRef]
- Hubisz, M.J.; Falush, D.; Stephens, M.; Pritchard, J.K. Inferring Weak Population Structure with the Assistance of Sample Group Information. Mol. Ecol. Resour. 2009, 9, 1322–1332. [Google Scholar] [CrossRef]
- Evanno, G.; Regnaut, S.; Goudet, J. Detecting the Number of Clusters of Individuals Using the Software Structure: A Simulation Study. Mol. Ecol. 2005, 14, 2611–2620. [Google Scholar] [CrossRef]
- Raj, A.; Stephens, M.; Pritchard, J.K. FastSTRUCTURE: Variational Inference of Population Structure in Large SNP Data Sets. Genetics 2014, 197, 573–589. [Google Scholar] [CrossRef]
- Puechmaille, S.J. The Program Structure Does Not Reliably Recover the Correct Population Structure When Sampling Is Uneven: Subsampling and New Estimators Alleviate the Problem. Mol. Ecol. Resour. 2016, 16, 608–627. [Google Scholar] [CrossRef]
- Kopelman, N.M.; Mayzel, J.; Jakobsson, M.; Rosenberg, N.A.; Mayrose, I. Clumpak: A Program for Identifying Clustering Modes and Packaging Population Structure Inferences across K. Mol. Ecol. Resour. 2015, 15, 1179–1191. [Google Scholar] [CrossRef]
- Dray, S.; Dufour, A.B. The Ade4 Package: Implementing the Duality Diagram for Ecologists. J. Stat. Softw. 2007, 22, 1–20. [Google Scholar] [CrossRef]
- Kamvar, Z.N.; Tabima, J.F.; Grünwald, N.J. Poppr: An R Package for Genetic Analysis of Populations with Clonal, Partially Clonal, and/or Sexual Reproduction. PeerJ 2014, 2014, e281. [Google Scholar] [CrossRef] [PubMed]
- Nguyen, L.T.; Schmidt, H.A.; Von Haeseler, A.; Minh, B.Q. IQ-TREE: A Fast and Effective Stochastic Algorithm for Estimating Maximum-Likelihood Phylogenies. Mol. Biol. Evol. 2015, 32, 268–274. [Google Scholar] [CrossRef] [PubMed]
- Oksanen, J.; Blanchet, F.G.; Friendly, M.; Kindt, R.; Legendre, P.; McGlinn, D.; Minchin, P.; O’Hara, R.B.; Simpson, G.; Solymos, P.; et al. Vegan: Community Ecology Package. R Package Version 2.5.7; R Project for Statistical Computing: Vienna, Austria, 2020. [Google Scholar]
- Diniz-Filho, J.A.F.; Soares, T.N.; Lima, J.S.; Dobrovolski, R.; Landeiro, V.L.; Telles, M.P.D.C.; Rangel, T.F.; Bini, L.M. Mantel Test in Population Genetics. Genet. Mol. Biol. 2013, 36, 475. [Google Scholar] [CrossRef] [PubMed]
- Meirmans, P.G. The Trouble with Isolation by Distance. Mol. Ecol. 2012, 21, 2839–2846. [Google Scholar] [CrossRef] [PubMed]
- Kendall, M.; Eldholm, V.; Colijn, C. Comparing Phylogenetic Trees According to Tip Label Categories. bioRxiv 2018. [Google Scholar] [CrossRef]
- Jombart, T.; Kendall, M.; Almagro-Garcia, J.; Colijn, C. Treespace: Statistical Exploration of Landscapes of Phylogenetic Trees. Mol. Ecol. Resour. 2017, 17, 1385–1392. [Google Scholar] [CrossRef]
- Campbell, V.; Legendre, P.; Lapointe, F.J. The Performance of the Congruence among Distance Matrices (CADM) Test in Phylogenetic Analysis. BMC Evol. Biol. 2011, 11, 64. [Google Scholar] [CrossRef]
- Paradis, E.; Claude, J.; Strimmer, K. APE: Analyses of Phylogenetics and Evolution in R Language. Bioinformatics 2004, 20, 289–290. [Google Scholar] [CrossRef]
- Narváez Barandica, J.C. Filogeografía Comparada de Organismos Marinos Con Alto y Bajo Potencial de Dispersión En El Caribe Sur; Universidad Nacional de Colombia-INVEMAR: Santa Marta, Colombia, 2022. [Google Scholar]
- Valle, A.G.; Fresneda Rodríguez, A.; Chasqui, L.; Caballero, S. Diversidad Genética Del Langostino Blanco Litopenaeus schmitti En El Caribe Colombiano. Bull. Mar. Coast. Res. 2016, 44, 237–251. [Google Scholar] [CrossRef]
- Alexandra, M.; Bernal, A. Análisis Genético Poblacional Del Tiburón Cazón Antillano, Rhizoprionodon Porosus (Carcharhinidae), En El Caribe Co-Lombiano. 2014. Available online: https://repositorio.unal.edu.co/handle/unal/54011 (accessed on 18 July 2023).
- Truelove, N.K.; Kough, A.S.; Behringer, D.C.; Paris, C.B.; Box, S.J.; Preziosi, R.F.; Butler, M.J. Biophysical Connectivity Explains Population Genetic Structure in a Highly Dispersive Marine Species. Coral Reefs 2017, 36, 233–244. [Google Scholar] [CrossRef]
- Almanza-Bernal, M.; Márquez, E.J.; Chasqui, L. Evaluación de Amplificación Cruzada de Microsatélites Para Estudios de Genética Poblacional Del Cazón Antillano Rhizoprionodon porosus (Carcharhinidae) En El Caribe Colombiano. Bol. Investig. Mar. Y Costeras 2016, 45, 41–56. [Google Scholar] [CrossRef]
- Aguirre-Pabon, J.C.; Berdugo, G.O.; Narváez, J.C. Population Structure and Low Genetic Diversity in the Threatened Lebranche Mugil liza in the Colombian Caribbean. Fish. Res. 2022, 256, 106485. [Google Scholar] [CrossRef]
- Hastings, P.A. Correlates of Male Reproductive Success in the Correlates of Male Reproductive Success in the Browncheek Blenny, Acanthemblemaria crockeri (Blennioidea: Chaenopsidae). Behav. Ecol. Sociobiol. 1988, 22, 95–102. [Google Scholar] [CrossRef]
- Brogan, M.W. Distribution and Retention of Larval Fishes near Reefs in the Gulf of California. Mar. Ecol. Prog. Ser. 1994, 115, 1–13. [Google Scholar] [CrossRef]
- Ramírez-Mella, J.T.; García-Sais, J.R. Offshore Dispersal of Caribbean Reef Fish Larvae: How Far Is It? Bull. Mar. Sci. 2003, 72, 997–1017. [Google Scholar]
- Torregroza-Espinosa, A.C.; Restrepo, J.C.; Correa-Metrio, A.; Hoyos, N.; Escobar, J.; Pierini, J.; Martínez, J.M. Fluvial and Oceanographic Influences on Suspended Sediment Dispersal in the Magdalena River Estuary. J. Mar. Syst. 2020, 204, 103282. [Google Scholar] [CrossRef]
- Torregroza-Espinosa, A.C.; Restrepo, J.C.; Escobar, J.; Pierini, J.; Newton, A. Spatial and Temporal Variability of Temperature, Salinity and Chlorophyll-a in the Magdalena River Mouth, Caribbean Sea. J. S. Am. Earth Sci. 2021, 105, 102978. [Google Scholar] [CrossRef]
- Beier, E.; Bernal, G.; Ruiz-Ochoa, M.; Barton, E.D. Freshwater Exchanges and Surface Salinity in the Colombian Basin, Caribbean Sea. PLoS ONE 2017, 12, e0182116. [Google Scholar] [CrossRef]
- Rocha, L.A.; Robertson, D.R.; Roman, J.; Bowen, B.W. Ecological Speciation in Tropical Reef Fishes. Proc. R. Soc. B Biol. Sci. 2005, 272, 573–579. [Google Scholar] [CrossRef]
- Rocha, L.A.; Rocha, C.R.; Robertson, D.R.; Bowen, B.W. Comparative Phylogeography of Atlantic Reef Fishes Indicates Both Origin and Accumulation of Diversity in the Caribbean. BMC Evol. Biol. 2008, 8, 157. [Google Scholar] [CrossRef]
- Posada, B.; Henao, W. Diagnóstico de La Erosión En La Zona Costera de Caribe Colombiano, 1st ed.; Serie Publicaciones Especiales No. 13; INVEMAR: Santa Marta, Colombia, 2008.
- Daza-Guerra, C.A.; Martínez-Hernández, N.J.; Narváez-Barandica, J.C. Population Aspects of Burgao Cittarium pica (Gastropoda: Tegulidae) in the Rocky Shore of Santa Marta, Magdalena, Colombia. Rev. Mex. Biodivers. 2018, 89, 430–442. [Google Scholar] [CrossRef]
- Sotka, E.E.; Wares, J.P.; Barth, J.A.; Grosberg, R.K.; Palumbi, S.R. Strong Genetic Clines and Geographical Variation in Gene Flow in the Rocky Intertidal Barnacle Balanus Glandula. Mol. Ecol. 2004, 13, 2143–2156. [Google Scholar] [CrossRef] [PubMed]
- Brante, A.; Fernández, M.; Viard, F. Phylogeography and Biogeography Concordance in the Marine Gastropod Crepipatella dilatata (Calyptraeidae) along the Southeastern Pacific Coast. J. Hered. 2012, 103, 630–637. [Google Scholar] [CrossRef] [PubMed]
- Haye, P.A.; Segovia, N.I.; Varela, A.I.; Rojas, R.; Rivadeneira, M.M.; Thiel, M. Genetic and Morphological Divergence at a Biogeographic Break in the Beach-Dwelling Brooder Excirolana Hirsuticauda menzies (Crustacea, Peracarida). BMC Evol. Biol. 2019, 19, 118. [Google Scholar] [CrossRef]
- Reid, K.; Hoareau, T.B.; Graves, J.E.; Potts, W.M.; dos Santos, S.M.R.; Klopper, A.W.; Bloomer, P. Secondary Contact and Asymmetrical Gene Flow in a Cosmopolitan Marine Fish across the Benguela Upwelling Zone. Heredity 2016, 117, 307–315. [Google Scholar] [CrossRef]
- Perez, M.F.; Franco, F.F.; Bombonato, J.R.; Bonatelli, I.A.S.; Khan, G.; Romeiro-Brito, M.; Fegies, A.C.; Ribeiro, P.M.; Silva, G.A.R.; Moraes, E.M. Assessing Population Structure in the Face of Isolation by Distance: Are We Neglecting the Problem? Divers. Distrib. 2018, 24, 1883–1889. [Google Scholar] [CrossRef]
- Knutsen, H.; Catarino, D.; Rogers, L.; Sodeland, M.; Mattingsdal, M.; Jahnke, M.; Hutchings, J.A.; Mellerud, I.; Espeland, S.H.; Johanneson, K.; et al. Combining Population Genomics with Demographic Analyses Highlights Habitat Patchiness and Larval Dispersal as Determinants of Connectivity in Coastal Fish Species. Mol. Ecol. 2022, 31, 2562–2577. [Google Scholar] [CrossRef]
- Barber, P.H.; Erdmann, M.v; Palumbi, S.R. Comparative Phylogeography of Three Codistributed Stomatopods: Origins and Timing of Regional Lineage Diversification in the Coral Triangle. Evolution 2006, 60, 1825–1839. [Google Scholar]
- Dawson, M.N.; Waples, R.S.; Bernardi, G. Phylogeography. In The Ecology of Marine Fishes: California and Adjacent Waters; Allen, L.G., Pondella, D.J., Horn, M.H., Eds.; University of California Press: Berkeley, CA, USA, 2006; pp. 26–54. [Google Scholar]
- Papadopoulou, A.; Knowles, L.L. Toward a Paradigm Shift in Comparative Phylogeography Driven by Trait-Based Hypotheses. Proc. Natl. Acad. Sci. USA 2016, 113, 8018–8024. [Google Scholar] [CrossRef]
- Palsbøll, P.J.; Bérubé, M.; Allendorf, F.W. Identification of Management Units Using Population Genetic Data. Trends Ecol. Evol. 2007, 22, 11–16. [Google Scholar] [CrossRef]
- Edwards, S.V.; Robin, V.V.; Ferrand, N.; Moritz, C. The Evolution of Comparative Phylogeography: Putting the Geography (and More) into Comparative Population Genomics. Genome Biol. Evol. 2022, 14, evab176. [Google Scholar] [CrossRef] [PubMed]
- Tamura, K.; Stecher, G.; Kumar, S. MEGA11: Molecular Evolutionary Genetics Analysis Version 11. Mol. Biol. Evol. 2021, 38, 3022–3027. [Google Scholar] [CrossRef] [PubMed]
- Ward, R.D.; Zemlak, T.S.; Innes, B.H.; Last, P.R.; Hebert, P.D.N. DNA Barcoding Australia’s Fish Species. Philos. Trans. R. Soc. B Biol. Sci. 2005, 360, 1847–1857. [Google Scholar] [CrossRef] [PubMed]


| Acanthemblemaria rivasi | ||||
| Santa Marta | Cartagena | Isla Fuerte | Capurganá | |
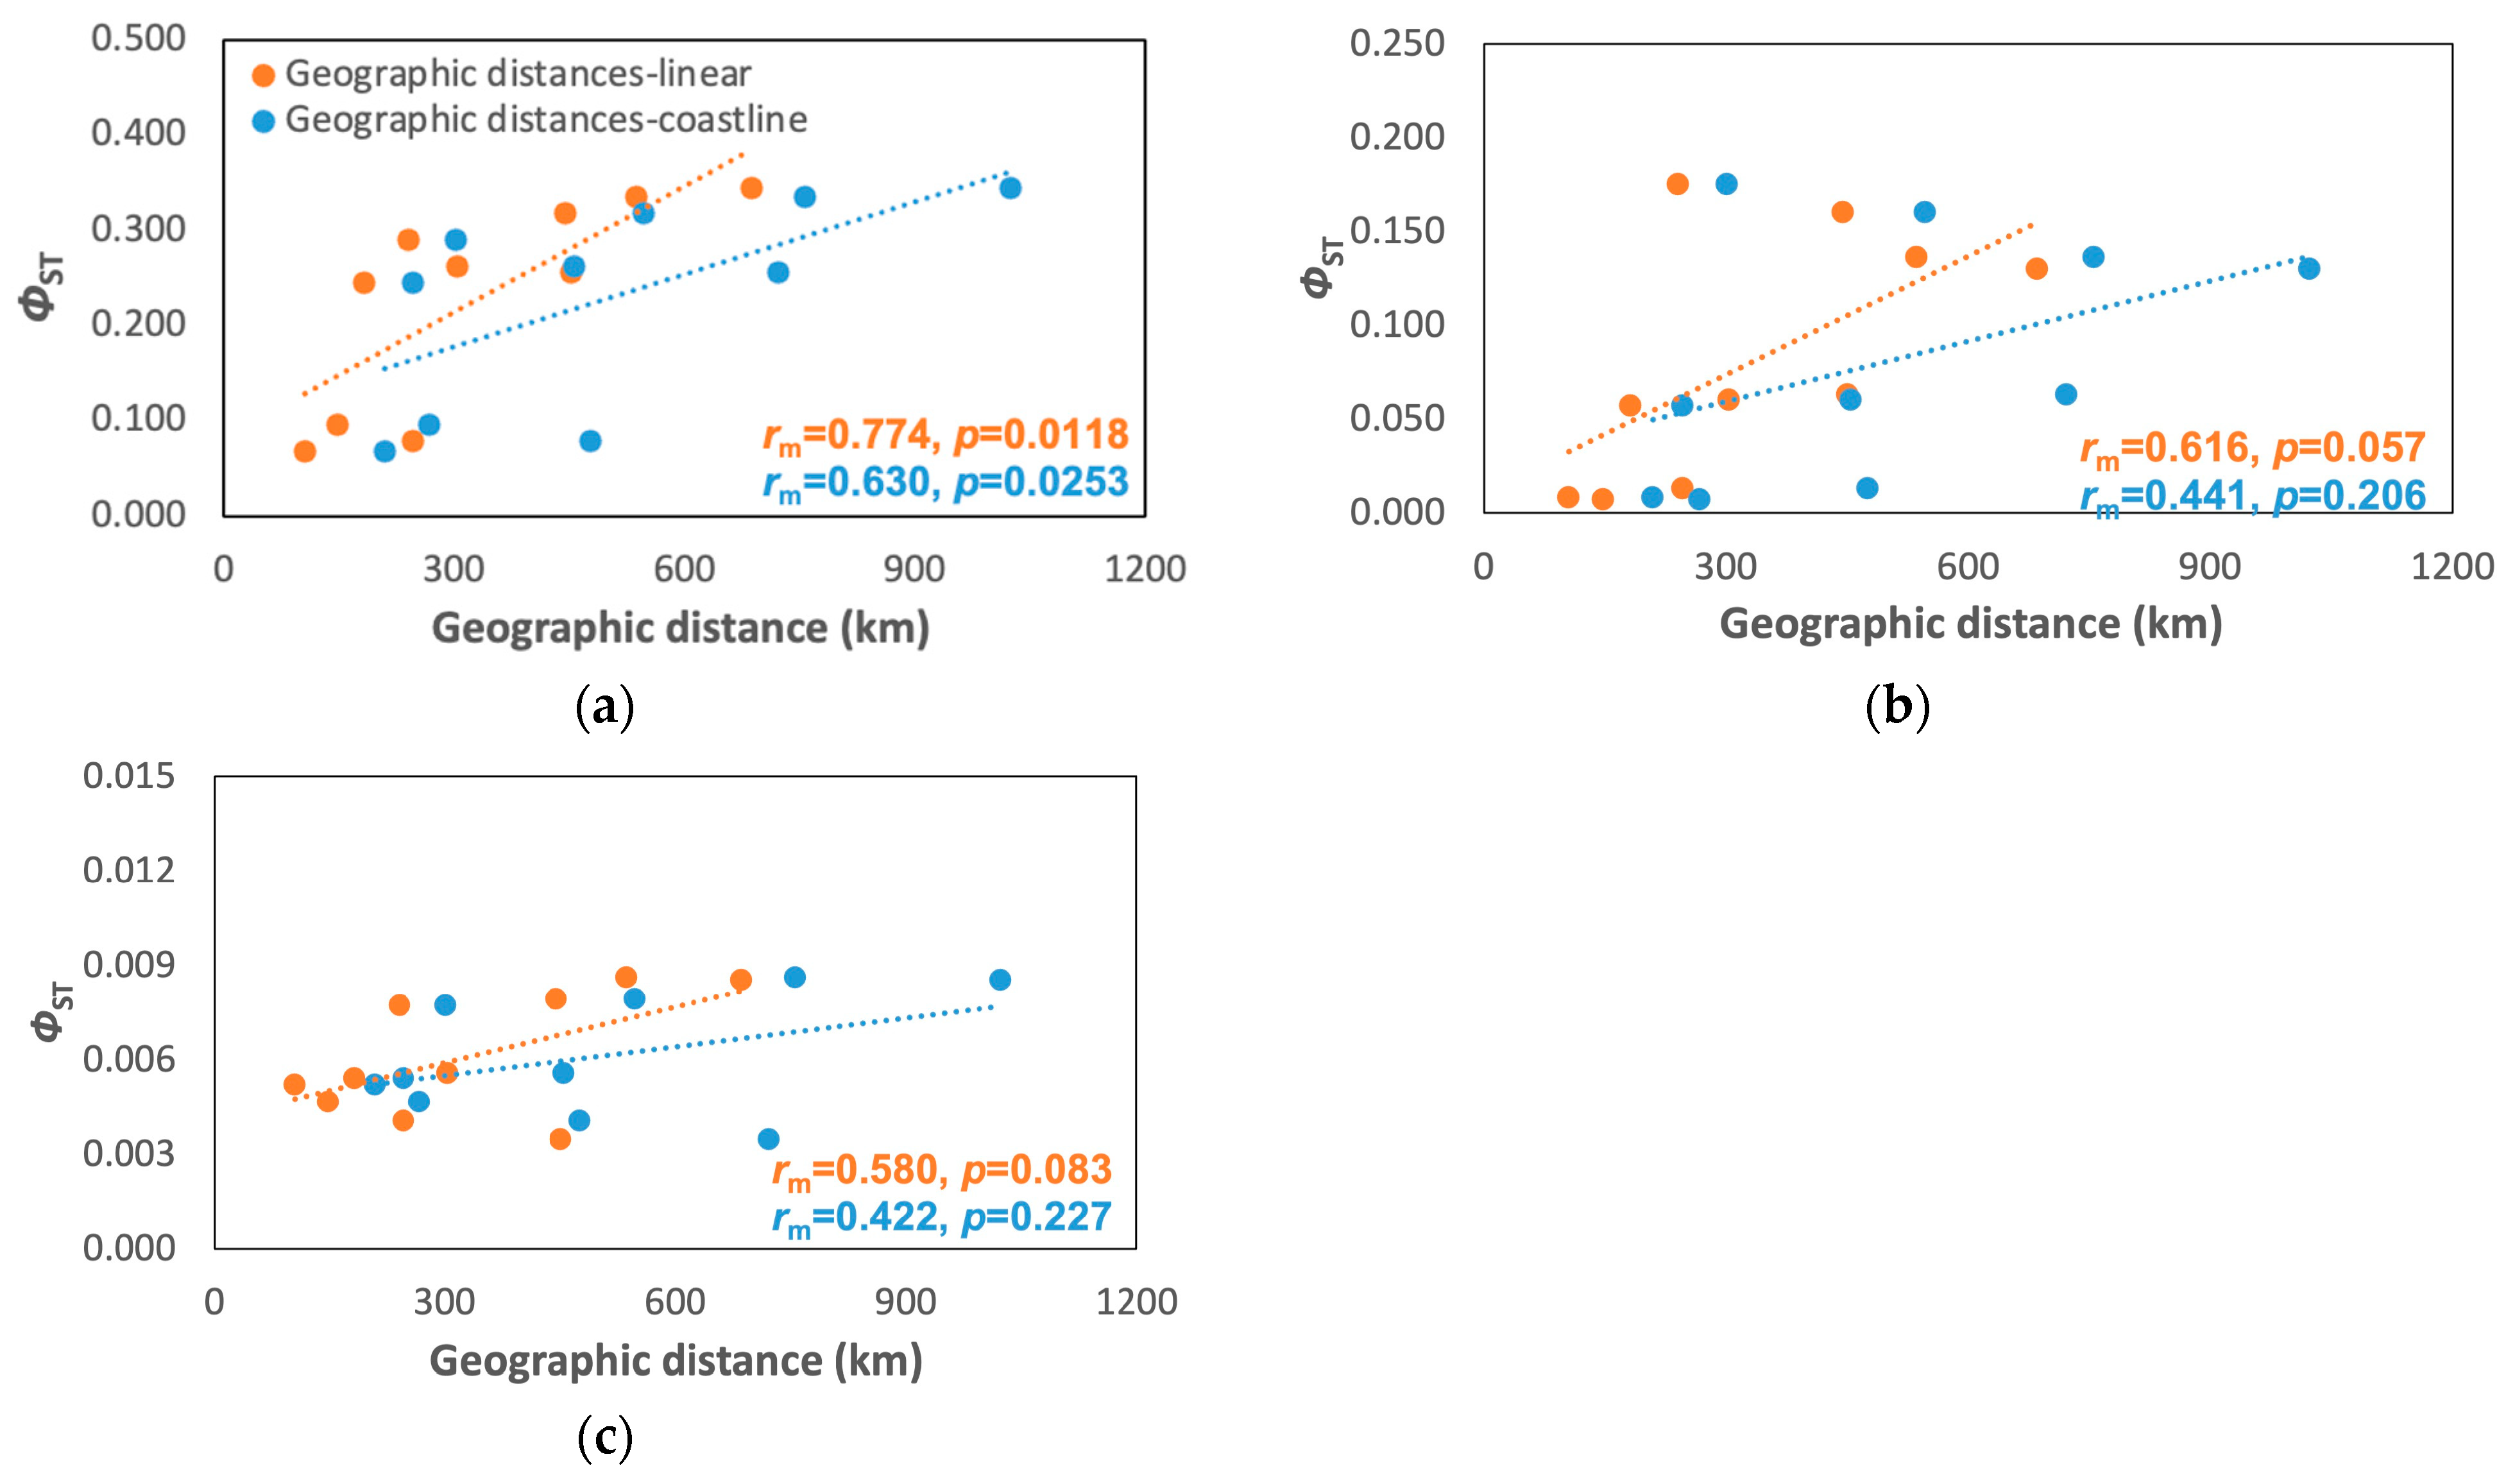
| Cabo de la Vela | 0.290 * | 0.318 * | 0.336 * | 0.345 * |
| Santa Marta | 0.246 * | 0.262 * | 0.257 * | |
| Cartagena | 0.069 * | 0.080 * | ||
| Isla Fuerte | 0.097 * | |||
| Cittarium pica | ||||
| Cabo de la Vela | 0.175 * | 0.160 * | 0.136 * | 0.130 * |
| Santa Marta | 0.057 * | 0.060 * | 0.063 * | |
| Cartagena | 0.008 * | 0.013 * | ||
| Isla Fuerte | 0.007 * | |||
| Nerita tessellata | ||||
| Cabo de la Vela | 0.008 * | 0.008 * | 0.009 * | 0.009 * |
| Santa Marta | 0.005 n.s. | 0.006 n.s. | 0.003 n.s. | |
| Cartagena | 0.005 n.s. | 0.004 n.s. | ||
| Isla Fuerte | 0.005 n.s. | |||
| Acanthemblemaria rivasi | Cittarium pica | Nerita tessellata | ||||
|---|---|---|---|---|---|---|
| PLD | <25 Days | <6 Days | >60 Days | |||
| F statistic | 1. Effect of MRP | |||||
| ΦST | 0.551 * | 44.90% | 0.223 * | 77.70% | 0.129 * | 87.10% |
| ΦSC | 0.226 * | 13.10% | 0.159 * | 14.70% | 0.128 * | 12.80% |
| ΦCT | 0.420 * | 42.00% | 0.076 * | 7.60% | 0.001 n.s. | 0.10% |
| 2. Effect of ARB + PUG | ||||||
| ΦST | 0.582 * | 41.80% | 0.318 * | 68.20% | 0.132 * | 86.80% |
| ΦSC | 0.297 * | 17.60% | 0.120 * | 9.30% | 0.127 * | 12.70% |
| ΦCT | 0.406 * | 40.60% | 0.224 * | 22.40% | 0.005 * | 0.50% |
| 3. Based on K = 3 | ||||||
| ΦST | 0.541 * | 45.90% | 0.251 * | 74.90% | ||
| ΦSC | 0.090 * | 4.60% | 0.093 * | 7.70% | ||
| ΦCT | 0.495 * | 49.5% | 0.174 * | 17.40% | ||
Disclaimer/Publisher’s Note: The statements, opinions and data contained in all publications are solely those of the individual author(s) and contributor(s) and not of MDPI and/or the editor(s). MDPI and/or the editor(s) disclaim responsibility for any injury to people or property resulting from any ideas, methods, instructions or products referred to in the content. |
© 2023 by the authors. Licensee MDPI, Basel, Switzerland. This article is an open access article distributed under the terms and conditions of the Creative Commons Attribution (CC BY) license (https://creativecommons.org/licenses/by/4.0/).
Share and Cite
Narváez-Barandica, J.C.; Quintero-Galvis, J.F.; Aguirre-Pabón, J.C.; Castro, L.R.; Betancur, R.; Acero Pizarro, A. A Comparative Phylogeography of Three Marine Species with Different PLD Modes Reveals Two Genetic Breaks across the Southern Caribbean Sea. Animals 2023, 13, 2528. https://doi.org/10.3390/ani13152528
Narváez-Barandica JC, Quintero-Galvis JF, Aguirre-Pabón JC, Castro LR, Betancur R, Acero Pizarro A. A Comparative Phylogeography of Three Marine Species with Different PLD Modes Reveals Two Genetic Breaks across the Southern Caribbean Sea. Animals. 2023; 13(15):2528. https://doi.org/10.3390/ani13152528
Chicago/Turabian StyleNarváez-Barandica, Juan Carlos, Julián F. Quintero-Galvis, Juan Carlos Aguirre-Pabón, Lyda R. Castro, Ricardo Betancur, and Arturo Acero Pizarro. 2023. "A Comparative Phylogeography of Three Marine Species with Different PLD Modes Reveals Two Genetic Breaks across the Southern Caribbean Sea" Animals 13, no. 15: 2528. https://doi.org/10.3390/ani13152528
APA StyleNarváez-Barandica, J. C., Quintero-Galvis, J. F., Aguirre-Pabón, J. C., Castro, L. R., Betancur, R., & Acero Pizarro, A. (2023). A Comparative Phylogeography of Three Marine Species with Different PLD Modes Reveals Two Genetic Breaks across the Southern Caribbean Sea. Animals, 13(15), 2528. https://doi.org/10.3390/ani13152528