The Effects of Climate Change on the Nesting Phenology of Three Shorebird Species in the United States
Abstract
Simple Summary
Abstract
1. Introduction
2. Materials and Methods
2.1. Study Species and Sites
2.2. Estimating Clutch Initiation Dates
- Only one visit was recorded, making it impossible to know the true stage of the nest;
- The nest was only found during incubation, with no indication of when the eggs were laid or when they started hatching;
- Hatching occurred between visits with more than a 5-day range with no age estimate of the young;
- Only young were observed, but there was no clear age estimate, or the number of young seen was less than the typical clutch size for that species;
- One plover nest was not used because it may have been a later nesting attempt of the same pair that had a failed nest earlier that year in that area.
2.3. Nest Location and Climate Data
2.4. Have CIDs Changed Based on Year, Latitude or Longitude for Our Three Species?
2.5. Has Temperature and Precipitation Changed over Year, Latitude or Longitude in Our Study Areas?
2.6. Does Temperature or Precipitation Predict CID?
3. Results
3.1. Have CIDs Changed Based on Year, Latitude or Longitude for Our Three Species?
3.2. Has Temperature and Precipitation Changed over Year, Latitude, or Longitude in Our Study Areas?
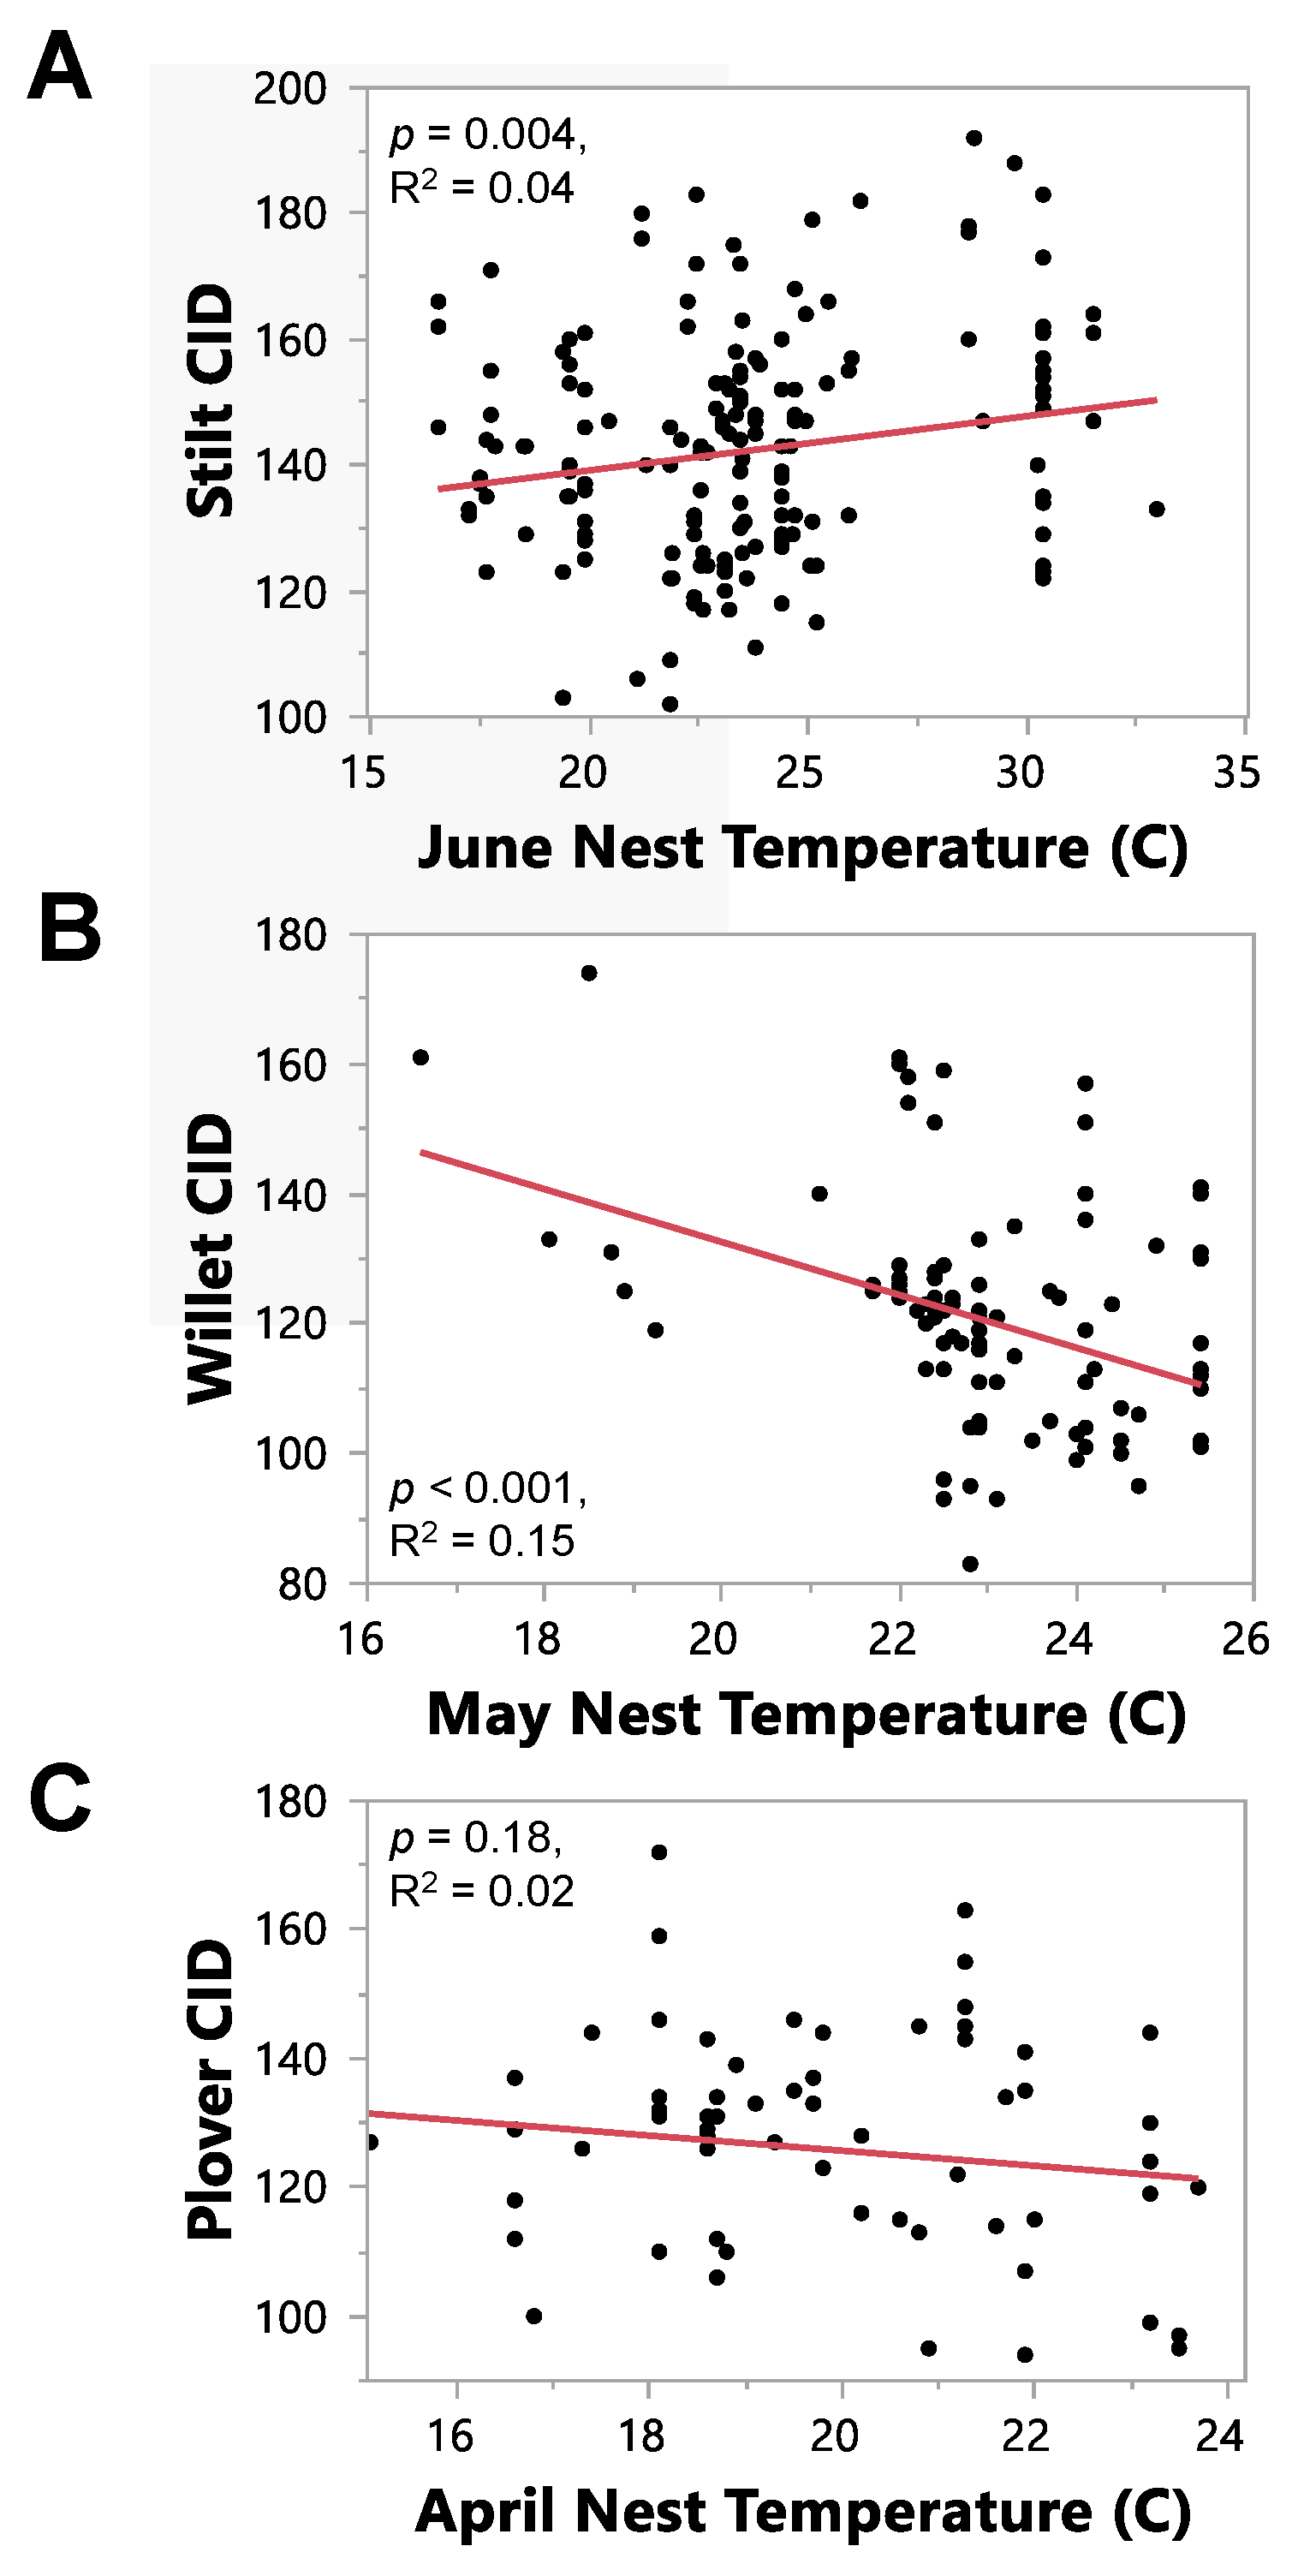
3.3. Question 3: Does Temperature or Precipitation Predict CID?
4. Discussion
4.1. Main Findings Regarding Temperature
4.2. Main Findings Regarding Precipitation
4.3. Different Responses among Species
4.4. The Use of Museum Records to Study Nest Phenology
5. Conclusions
Supplementary Materials
Author Contributions
Funding
Institutional Review Board Statement
Informed Consent Statement
Data Availability Statement
Acknowledgments
Conflicts of Interest
References
- Hegerl, G.C.; Broennimann, S.; Cowan, T.; Friedman, A.R.; Hawkins, E.; Iles, C.E.; Mueller, W.; Schurer, A.; Undorf, S. Causes of climate change over the historical record. Environ. Res. Lett. 2019, 14, 123006. [Google Scholar] [CrossRef]
- Liebezeit, J.R.; Gurney, K.E.B.; Budde, M.; Zack, S.; Ward, D. Phenological advancement in arctic bird species: Relative importance of snow melt and ecological factors. Polar Biol. 2014, 37, 1309–1320. [Google Scholar] [CrossRef]
- Kwon, E.; Weiser, E.L.; Lanctot, R.B.; Brown, S.C.; Gates, H.R.; Gilchrist, H.G.; Kendall, S.J.; Lank, D.B.; Liebezeit, J.R.; McKinnon, L.; et al. Geographic variation in the intensity of warming and phenological mismatch between Arctic shorebirds and invertebrates. Ecol. Monogr. 2019, 89, e01383. [Google Scholar] [CrossRef]
- Smith, J.A.M.; Regan, K.; Cooper, N.W.; Johnson, L.; Olson, E.; Green, A.; Tash, J.; Evers, D.C.; Marra, P.P. A green wave of saltmarsh productivity predicts the timing of the annual cycle in a long-distance migratory shorebird. Sci. Rep. 2020, 10, 20658. [Google Scholar] [CrossRef]
- Van Noordwijk, A.J.; McCleery, R.H.; Perrins, C.M. Selection for the timing of great tit breeding in relation to caterpillar growth and temperature. J. Anim. Ecol. 1995, 64, 451–458. [Google Scholar]
- Both, C.; Visser, M.E. The effect of climate change on the correlation between avian life-history traits. Glob. Chang. Biol. 2005, 11, 1606–1613. [Google Scholar] [CrossRef]
- McGuire, R.L.; Lanctot, R.B.; Saalfeld, S.T.; Ruthrauff, D.R.; Liebezeit, J.R. Shorebird reproductive response to exceptionally early and late springs varies across sites in arctic alaska. Front. Ecol. Evol. 2020, 8, 577652. [Google Scholar] [CrossRef]
- Both, C.; Visser, M.E. Adjustment to climate change is constrained by arrival date in a long-distance migrant bird. Nature 2001, 411, 296–298. [Google Scholar] [CrossRef]
- Carey, C. The impacts of climate change on the annual cycles of birds. Philos. Trans. R. Soc. B Biol. Sci. 2009, 364, 3321–3330. [Google Scholar] [CrossRef]
- Mayor, S.J.; Guralnick, R.P.; Tingley, M.W.; Otegui, J.; Withey, J.C.; Elmendorf, S.C.; Andrew, M.E.; Leyk, S.; Pearse, I.S.; Schneider, D.C. Increasing phenological asynchrony between spring green-up and arrival of migratory birds. Sci. Rep. 2017, 7, 1902. [Google Scholar] [CrossRef]
- Kwon, E.; English, W.B.; Weiser, E.L.; Franks, S.E.; Hodkinson, D.J.; Lank, D.B.; Sandercock, B.K. Delayed egg-laying and shortened incubation duration of Arctic-breeding shorebirds coincide with climate cooling. Ecol. Evol. 2017, 8, 1339–1351. [Google Scholar] [CrossRef] [PubMed]
- Halupka, L.; Czyż, B.; Dominguez, C.M.M. The effect of climate change on laying dates, clutch size and productivity of Eurasian Coots Fulica atra. Int. J. Biometeorol. 2020, 64, 1857–1863. [Google Scholar] [CrossRef]
- Crick, H.Q.P.; Sparks, T.H. Climate change related to egg-laying trends. Nature 1999, 399, 423. [Google Scholar] [CrossRef]
- Both, C.; van Asch, M.; Bijlsma, R.G.; Burg, A.B.v.D.; Visser, M.E. Climate change and unequal phenological changes across four trophic levels: Constraints or adaptations? J. Anim. Ecol. 2008, 78, 73–83. [Google Scholar] [CrossRef] [PubMed]
- Watts, H.E.; Jimenez, D.; Pacheco, V.; Vilgalys, T.P. Temperature-correlated shifts in the timing of egg-laying in House Finches Haemorhous mexicanus. Ibis 2018, 161, 428–434. [Google Scholar] [CrossRef]
- Torti, V.M.; Dunn, P.O. Variable effects of climate change on six species of North American birds. Oecologia 2005, 145, 486–495. [Google Scholar] [CrossRef]
- Bates, J.M.; Fidino, M.; Nowak-Boyd, L.; Strausberger, B.M.; Schmidt, K.A.; Whelan, C.J. Climate change affects bird nesting phenology: Comparing contemporary field and historical museum nesting records. J. Anim. Ecol. 2022, 92, 263–272. [Google Scholar] [CrossRef]
- Trenberth, K.E.; Dai, A.; Rasmussen, R.M.; Parsons, D.B. The changing character of precipitation. Bull. Am. Meteorol. Soc. 2003, 84, 1205–1218. [Google Scholar] [CrossRef]
- Ross, R.J.; Elliott, W.P. Tropospheric water vapor climatology and trends over North America: 1973–1993. J. Clim. 1996, 9, 3561–3574. [Google Scholar] [CrossRef]
- Ross, R.J.; Elliott, W.P. Radiosonde-based northern hemisphere tropospheric water vapor trends. J. Clim. 2001, 14, 1602–1612. [Google Scholar] [CrossRef]
- Hennessy, K.J.; Gregory, J.M.; Mitchell, J.F.B. Changes in daily precipitation under enhanced greenhouse condi-tions. Clim. Dyn. 1997, 13, 667–680. [Google Scholar] [CrossRef]
- Galbraith, H.; DesRochers, D.W.; Brown, S.; Reed, J.M. Predicting vulnerabilities of North American shorebirds to climate change. PLoS ONE 2014, 9, e108899. [Google Scholar] [CrossRef]
- Cohen, J.B.; Houghton, L.M.; Fraser, J.D. Nesting density and reproductive success of piping plovers in response to storm- and human-created habitat changes. Wildl. Monogr. 2009, 173, 1–24. [Google Scholar] [CrossRef]
- Convertino, M.; Bockelie, A.; Kiker, G.A.; Muñoz-Carpena, R.; Linkov, I. Shorebird patches as fingerprints of fractal coastline fluctuations due to climate change. Ecol. Process. 2012, 1, 9. [Google Scholar] [CrossRef]
- Cohen, M.C.L.; de Souza, A.V.; Liu, K.-B.; Rodrigues, E.; Yao, Q.; Pessenda, L.C.R.; Rossetti, D.; Ryu, J.; Dietz, M. Effects of Beach Nourishment Project on Coastal Geomorphology and Mangrove Dynamics in Southern Louisiana, USA. Remote Sens. 2021, 13, 2688. [Google Scholar] [CrossRef]
- Reed, K.A.; Wehner, M.F.; Zarzycki, C.M. Attribution of 2020 hurricane season extreme rainfall to human-induced climate change. Nat. Commun. 2022, 13, 1905. [Google Scholar] [CrossRef]
- DeRose-Wilson, A.; Fraser, J.D.; Karpanty, S.M.; Catlin, D.H. Nest-site selection and demography of Wilson’s Plovers on a North Carolina barrier island. J. Field Ornithol. 2013, 84, 329–344. [Google Scholar] [CrossRef]
- Ackerman, J.T.; Herzog, M.P.; Takekawa, J.Y.; Hartman, C.A. Comparative reproductive biology of sympatric species: Nest and chick survival of American avocets and black-necked stilts. J. Avian Biol. 2014, 45, 609–623. [Google Scholar] [CrossRef]
- White, E.E.; Ury, E.A.; Bernhardt, E.S.; Yang, X. Climate change driving widespread loss of coastal forested wetlands throughout the north american coastal plain. Ecosystems 2021, 25, 812–827. [Google Scholar] [CrossRef]
- Smith, P.A.; Gilchrist, H.G.; Smith, J.N.M. Effects of nest habitat, food, and parental behavior on shorebird nest success. Condor 2007, 109, 15–31. [Google Scholar] [CrossRef]
- Arnold, T.W. What limits clutch size in waders? J. Avian Biol. 1999, 30, 216–220. [Google Scholar] [CrossRef]
- Griffith, G.E.; Omernik, J.M.; Smith, D.W.; Cook, T.D.; Tallyn, E.; Moseley, K.; Johnson, C.B. Ecoregions of California (Poster): U.S. Geological Survey Open-File Report 2016–1021, with Map, Scale 1:1,100,000; U.S. Geological Survey: Reston, VA, USA, 2016. [Google Scholar] [CrossRef]
- Noss, R.F.; Platt, W.J.; Sorrie, B.A.; Weakley, A.S.; Means, D.B.; Costanza, J.; Peet, R.K. How global biodiversity hotspots may go unrecognized: Lessons from the North American Coastal Plain. Divers. Distrib. 2014, 21, 236–244. [Google Scholar] [CrossRef]
- Robinson, J.A.; Reed, J.M.; Skorupa, J.P.; Oring, L.W. Black-necked Stilt (Himantopus mexicanus), version 1.0. In Birds of the World; Poole, A.F., Gill, F.B., Eds.; Cornell Lab of Ornithology: Ithaca, NY, USA, 2020. [Google Scholar] [CrossRef]
- Zdravkovic, M.G.; Corbat, C.A.; Bergstrom, P.W. Wilson’s Plover (Charadrius wilsonia), version 1.0. In Birds of the World; Rodewald, P.G., Ed.; Cornell Lab of Ornithology: Ithaca, NY, USA, 2020. [Google Scholar] [CrossRef]
- Lowther, P.E.; Iii, H.D.D.; Gratto-Trevor, C.L. Willet (Tringa semipalmata), version 1.0. In Birds of the World; Poole, A.F., Gill, F.B., Eds.; Cornell Lab of Ornithology: Ithaca, NY, USA, 2020. [Google Scholar] [CrossRef]
- American Museum of Natural History, New York, USA. Available online: https://data.nhm.ac.uk/dataset/collection-specimens/resource/05ff2255-c38a-40c9-b657-4ccb55ab2feb?filters=collectionCode%3Azoo (accessed on 18 June 2023).
- Denver Museum of Nature and Science, Colorado, USA. Available online: https://arctos.database.museum/collection/DMNS:Egg (accessed on 18 June 2023).
- Jurica-Suchy Nature Museum at Benedictine University, Illinois, USA. Available online: https://arctos.database.museum/collection/JSNM:Egg (accessed on 18 June 2023).
- Museum of Vertebrate Zoology (MVZ), University of California, Berkeley, California, USA. Available online: https://arctos.database.museum/collection/MVZ:Egg (accessed on 18 June 2023).
- Smithsonian National Museum of Natural History, Smithsonian Institution, Washington, DC, USA. Available online: https://siarchives.si.edu/ (accessed on 18 June 2023).
- Western Foundation of Vertebrate Zoology, California, USA. Available online: https://collections.wfvz.org/ (accessed on 18 June 2023).
- McNair, D.B. A Comparison of Oology and Nest Record Card Data in Evaluating the Reproductive Biology of Lark Sparrows, Chondestes grammacus. Southwest. Nat. 1985, 30, 213. [Google Scholar] [CrossRef]
- Scharlemann, J.P.W. Museum egg collections as stores of long-term phenological data. Int. J. Biometeorol. 2001, 45, 208–211. [Google Scholar] [CrossRef]
- MapTiler Team. Epsg.io. MapTiler. 2022. Available online: https://epsg.io/map#srs=4326&x=0.000000&y=0.000000&z=1&layer=streets (accessed on 18 June 2023).
- Intergovernmental Panel on Climate Change (IPCC). Impacts, adaptation, and vulnerability. Part B: Regional aspects. In Contribution of Working Group II to the Fifth Assessment Report of the Intergovernmental Panel on Climate Change; Barros, V.R., Field, C.B., Dokken, D.J., Mastrandrea, M.D., Mach, K.J., Bilir, T.E., Chatterjee, M., Ebi, K.L., Estrada, Y.O., Genova, R.C., et al., Eds.; Cam-bridge University Press: Cambridge, UK, 2014; p. 688. [Google Scholar]
- AMAP. Arctic Climate Issues 2011: Changes in Arctic Snow, Water, Ice and Permafrost. SWIPA 2011; Overview Report; AMAP: Oslo, Norway, 2012; 112p. [Google Scholar]
- Root, T.L.; Price, J.T.; Hall, K.R.; Schneider, S.H.; Rosenzweig, C.; Pounds, J.A. Fingerprints of global warming on wild animals and plants. Nature 2003, 421, 57–60. [Google Scholar] [CrossRef]
- Shave, A.; Garroway, C.; Siegrist, J.; Fraser, K.C. Timing to temperature: Egg-laying dates respond to temperature and are under stronger selection at northern latitudes. Ecosphere 2019, 10, e02974. [Google Scholar] [CrossRef]
- Fischer, E.M.; Knutti, R. Observed heavy precipitation increase confirms theory and early models. Nat. Clim. Chang. 2016, 6, 986–991. [Google Scholar] [CrossRef]
- Berg, P.; Moseley, C.; Haerter, J.O. Strong increase in convective precipitation in response to higher temperatures. Nat. Geosci. 2013, 6, 181–185. [Google Scholar] [CrossRef]
- Trenberth, K.E. Atmospheric moisture residence Times AND cycling: Implications for rainfall rates and climate change. Clim. Chang. 1998, 39, 667–694. [Google Scholar] [CrossRef]
- Davis, D.E.; Hanson, C.H.; Hansen, R.B. Constructed wetland habitat for American avocet and black-necked stilt foraging and nesting. J. Wildl. Manag. 2008, 72, 143–151. [Google Scholar] [CrossRef]
- Raquel, A.J.; Devries, J.H.; Howerter, D.W.; Clark, R.G. Reproductive consequences of climate variability in migratory birds: Evidence for species-specific responses to spring phenology and cross-seasonal effects. Oecologia 2019, 191, 217–229. [Google Scholar] [CrossRef]
- Andres, B.A.; Smith, P.A.; Morrison, R.I.G.; Gratto-Trevor, C.L.; Brown, S.C.; Friis, C.A. Population estimates of North American shorebirds, 2012. Wader Study Group Bull. 2012, 119, 178–194. [Google Scholar]
- Zdravkovic, M.G. Conservation Plan for the Wilson’s Plover (Charadrius wilsonia); Version 1.0.; Manomet Center for Conservation Sciences: Manomet, MA, USA, 2013. [Google Scholar]
- Green, R.E.; Scharlemann, J.P.W. Egg and skin collections as a resource for long-term ecological studies. Bull. Br. Ornithol. Club 2003, 123, 165–176. [Google Scholar]
- Marini, M.; Hall, L.; Bates, J.; Steinheimer, F.D.; McGowan, R.; Silveira, L.F.; Lijtmaer, D.A.; Tubaro, P.L.; Córdoba-Córdoba, S.; Gamauf, A.; et al. The five million bird eggs in the world’s museum collections are an invaluable and underused resource. Ornithology 2020, 137, ukaa036. [Google Scholar] [CrossRef]
- Lack, D. Clutch and brood size in the robin. Br. Birds 1946, 39, 98–109, 130–135. [Google Scholar]
- Thompson, J.E.; Birkhead, T.R. Avian egg collections: Museum collection bias driven by shape and size. J. Avian Biol. 2020, 51, jav.02507. [Google Scholar] [CrossRef]
- Kiff, L.F. History, Present Status, and Future Prospects of Avian Eggshell Collections in North America. Auk 2005, 122, 994–999. [Google Scholar] [CrossRef][Green Version]
- McNair, D.B. Egg data slips-are they useful for information on egg-laying dates and clutch size? Condor 1987, 89, 369–376. [Google Scholar] [CrossRef]
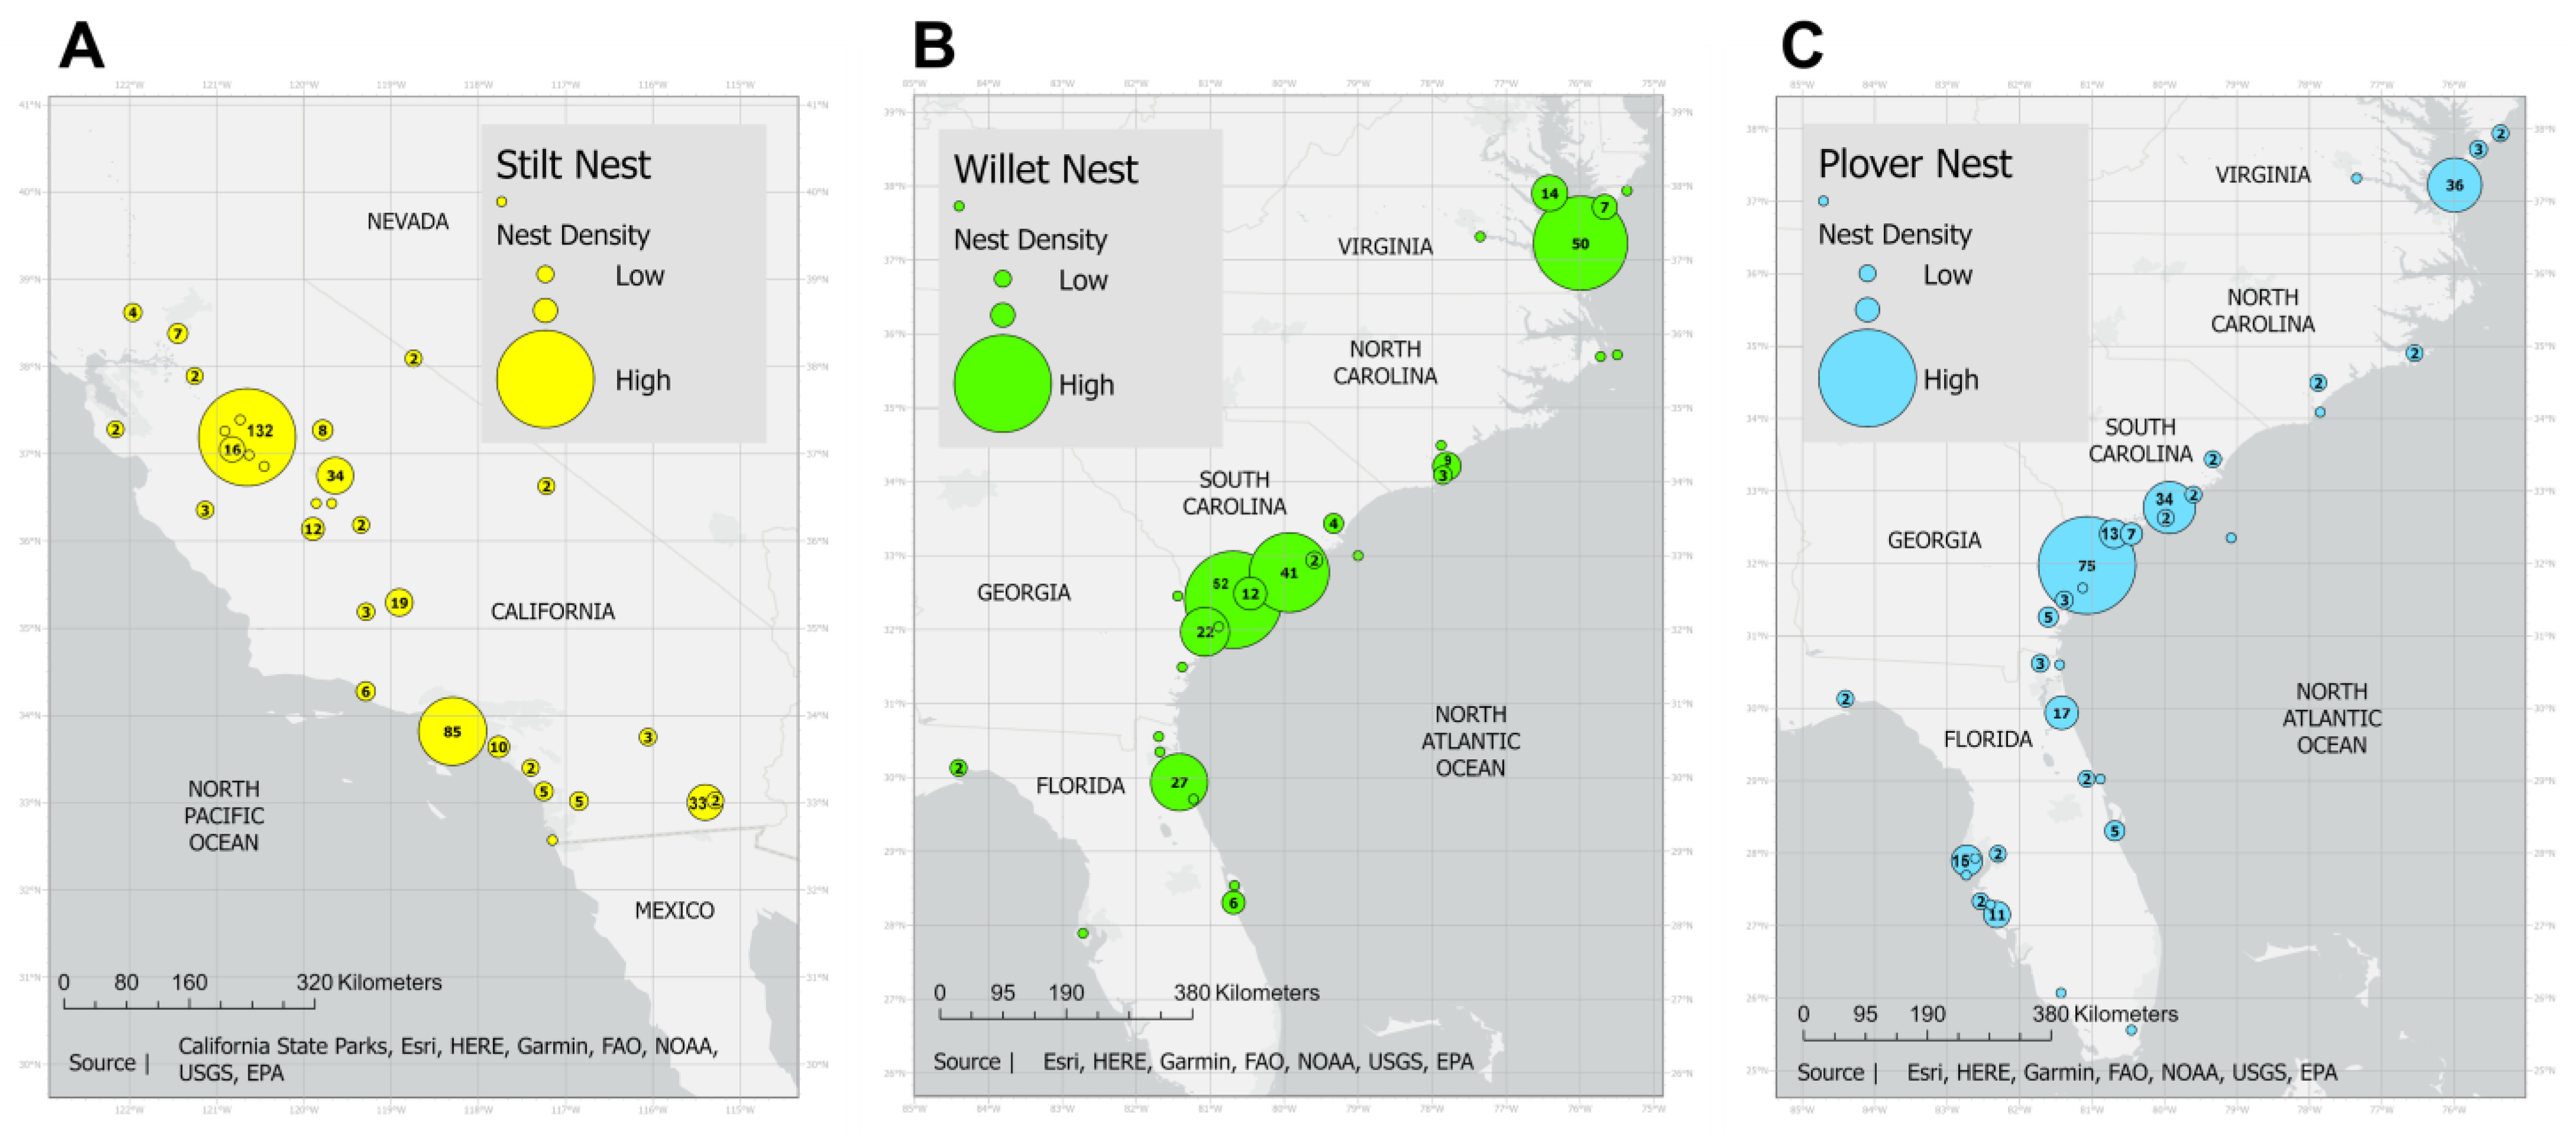
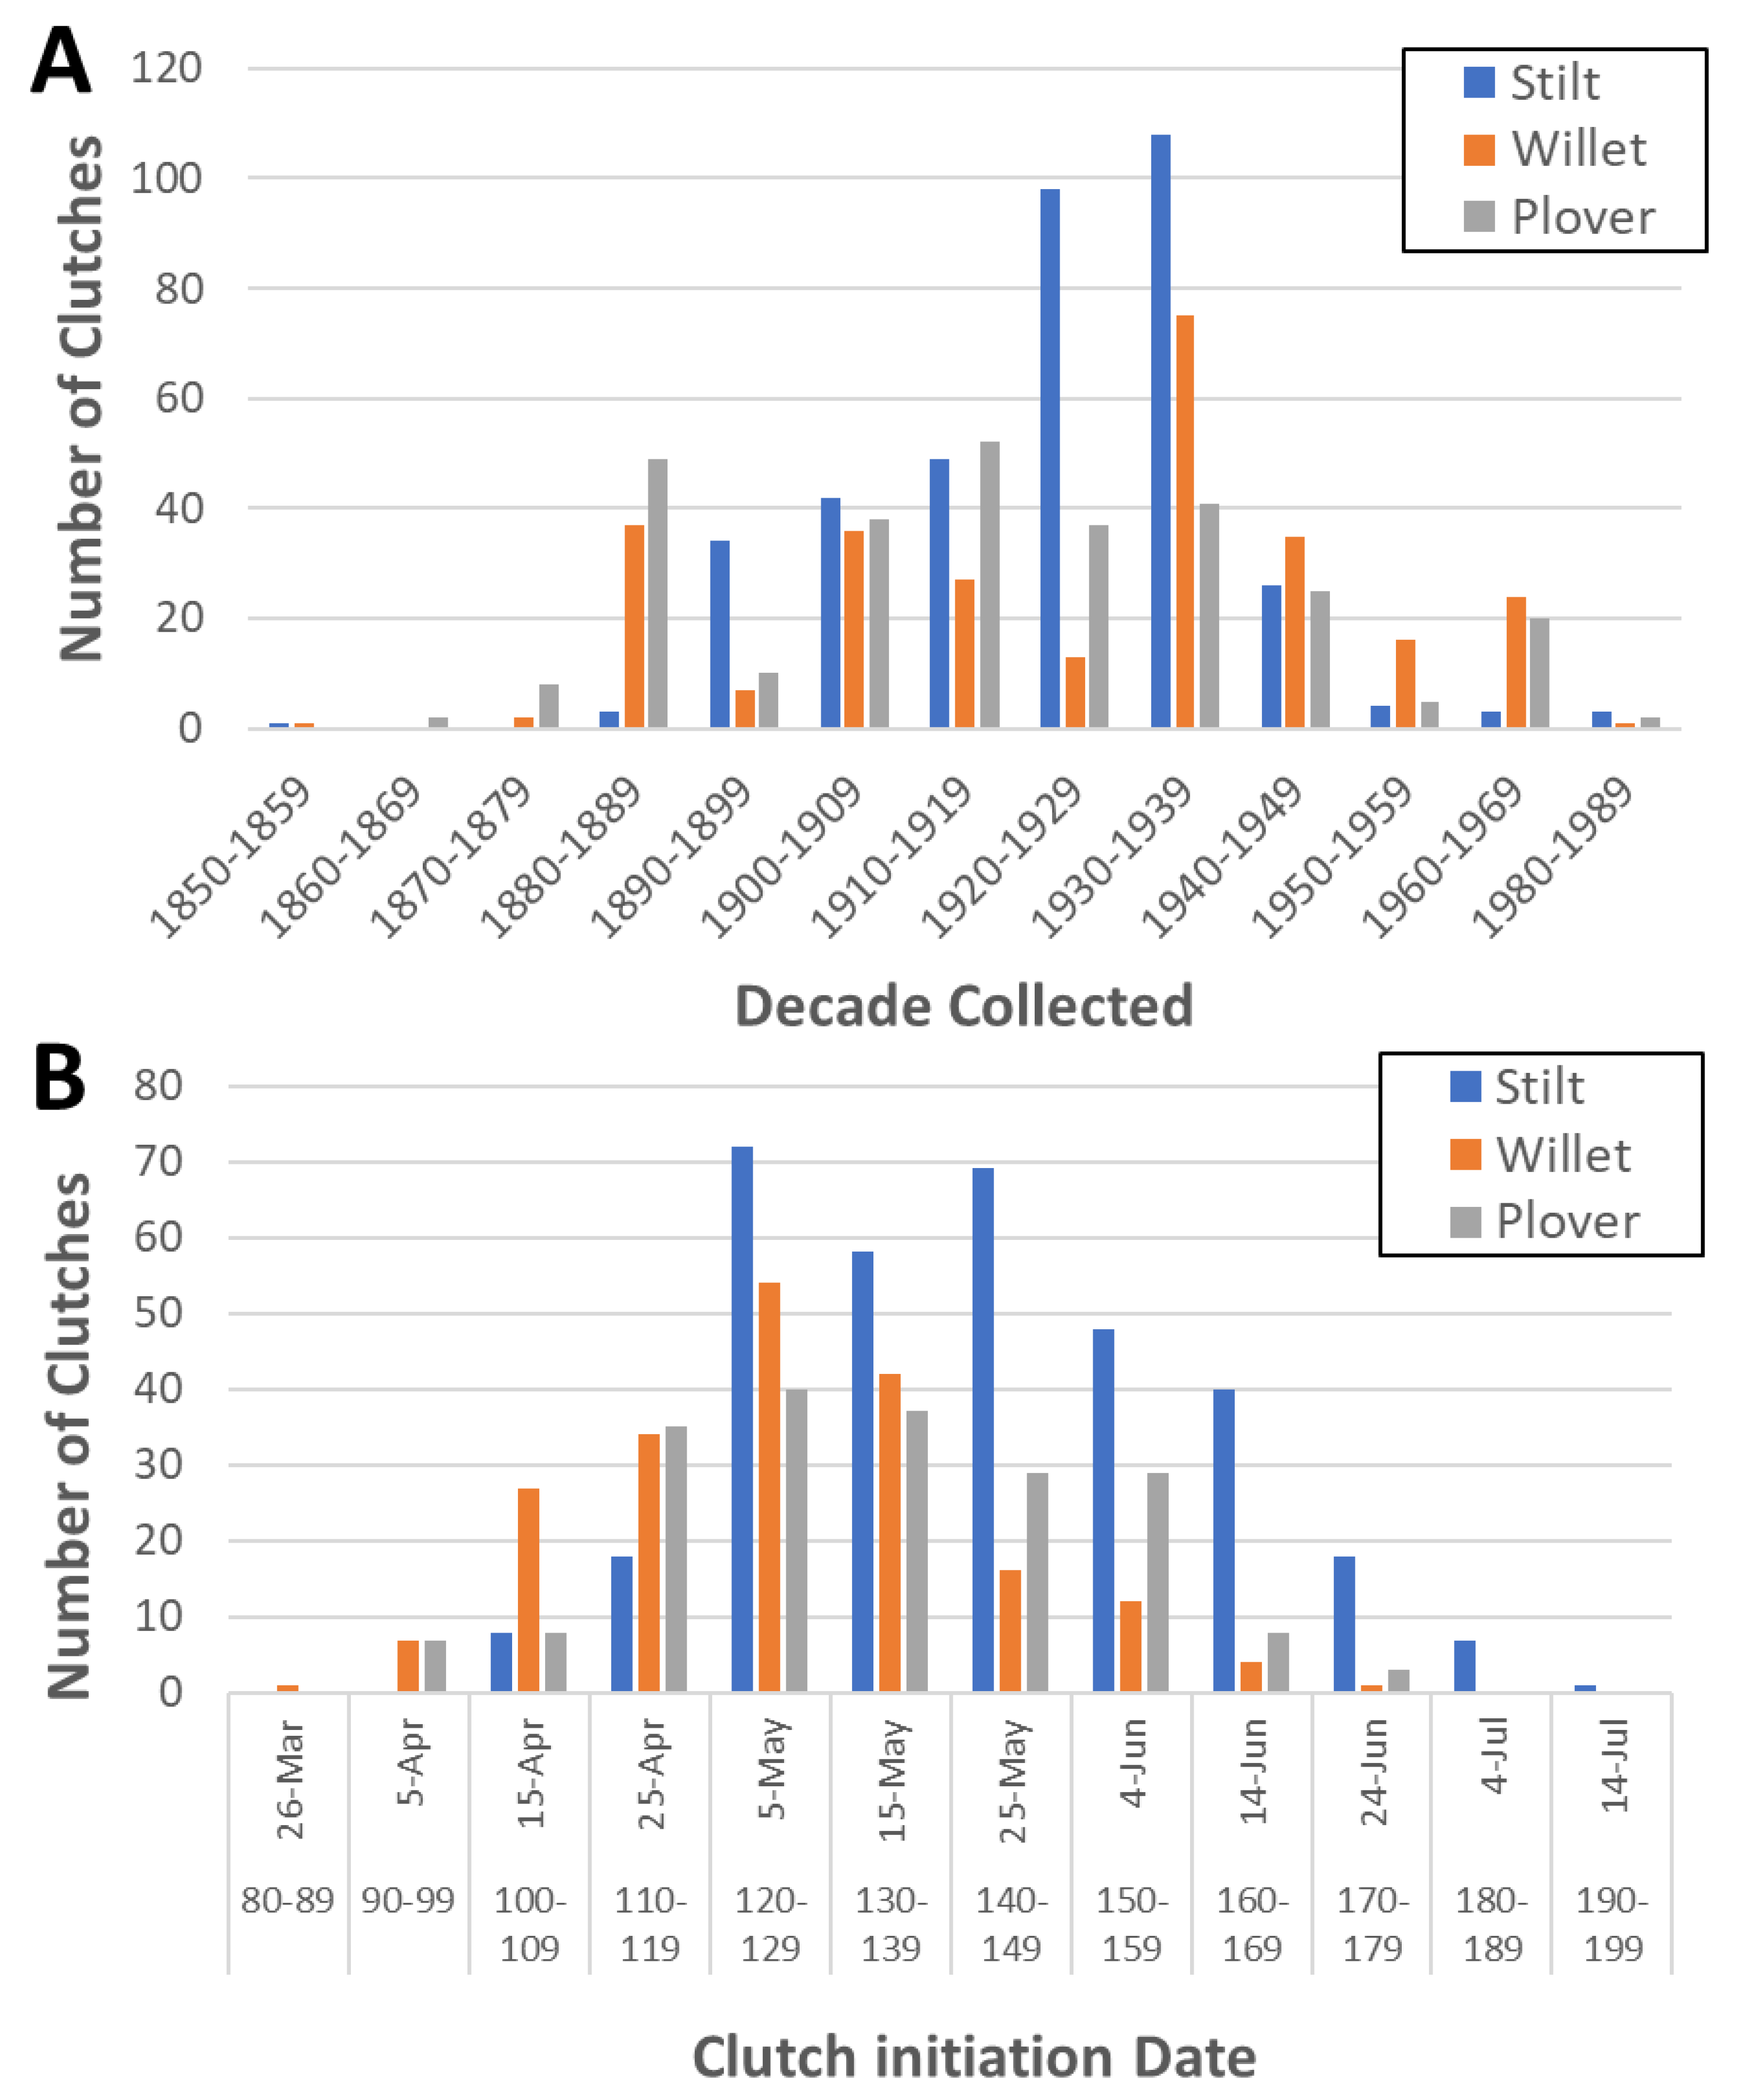
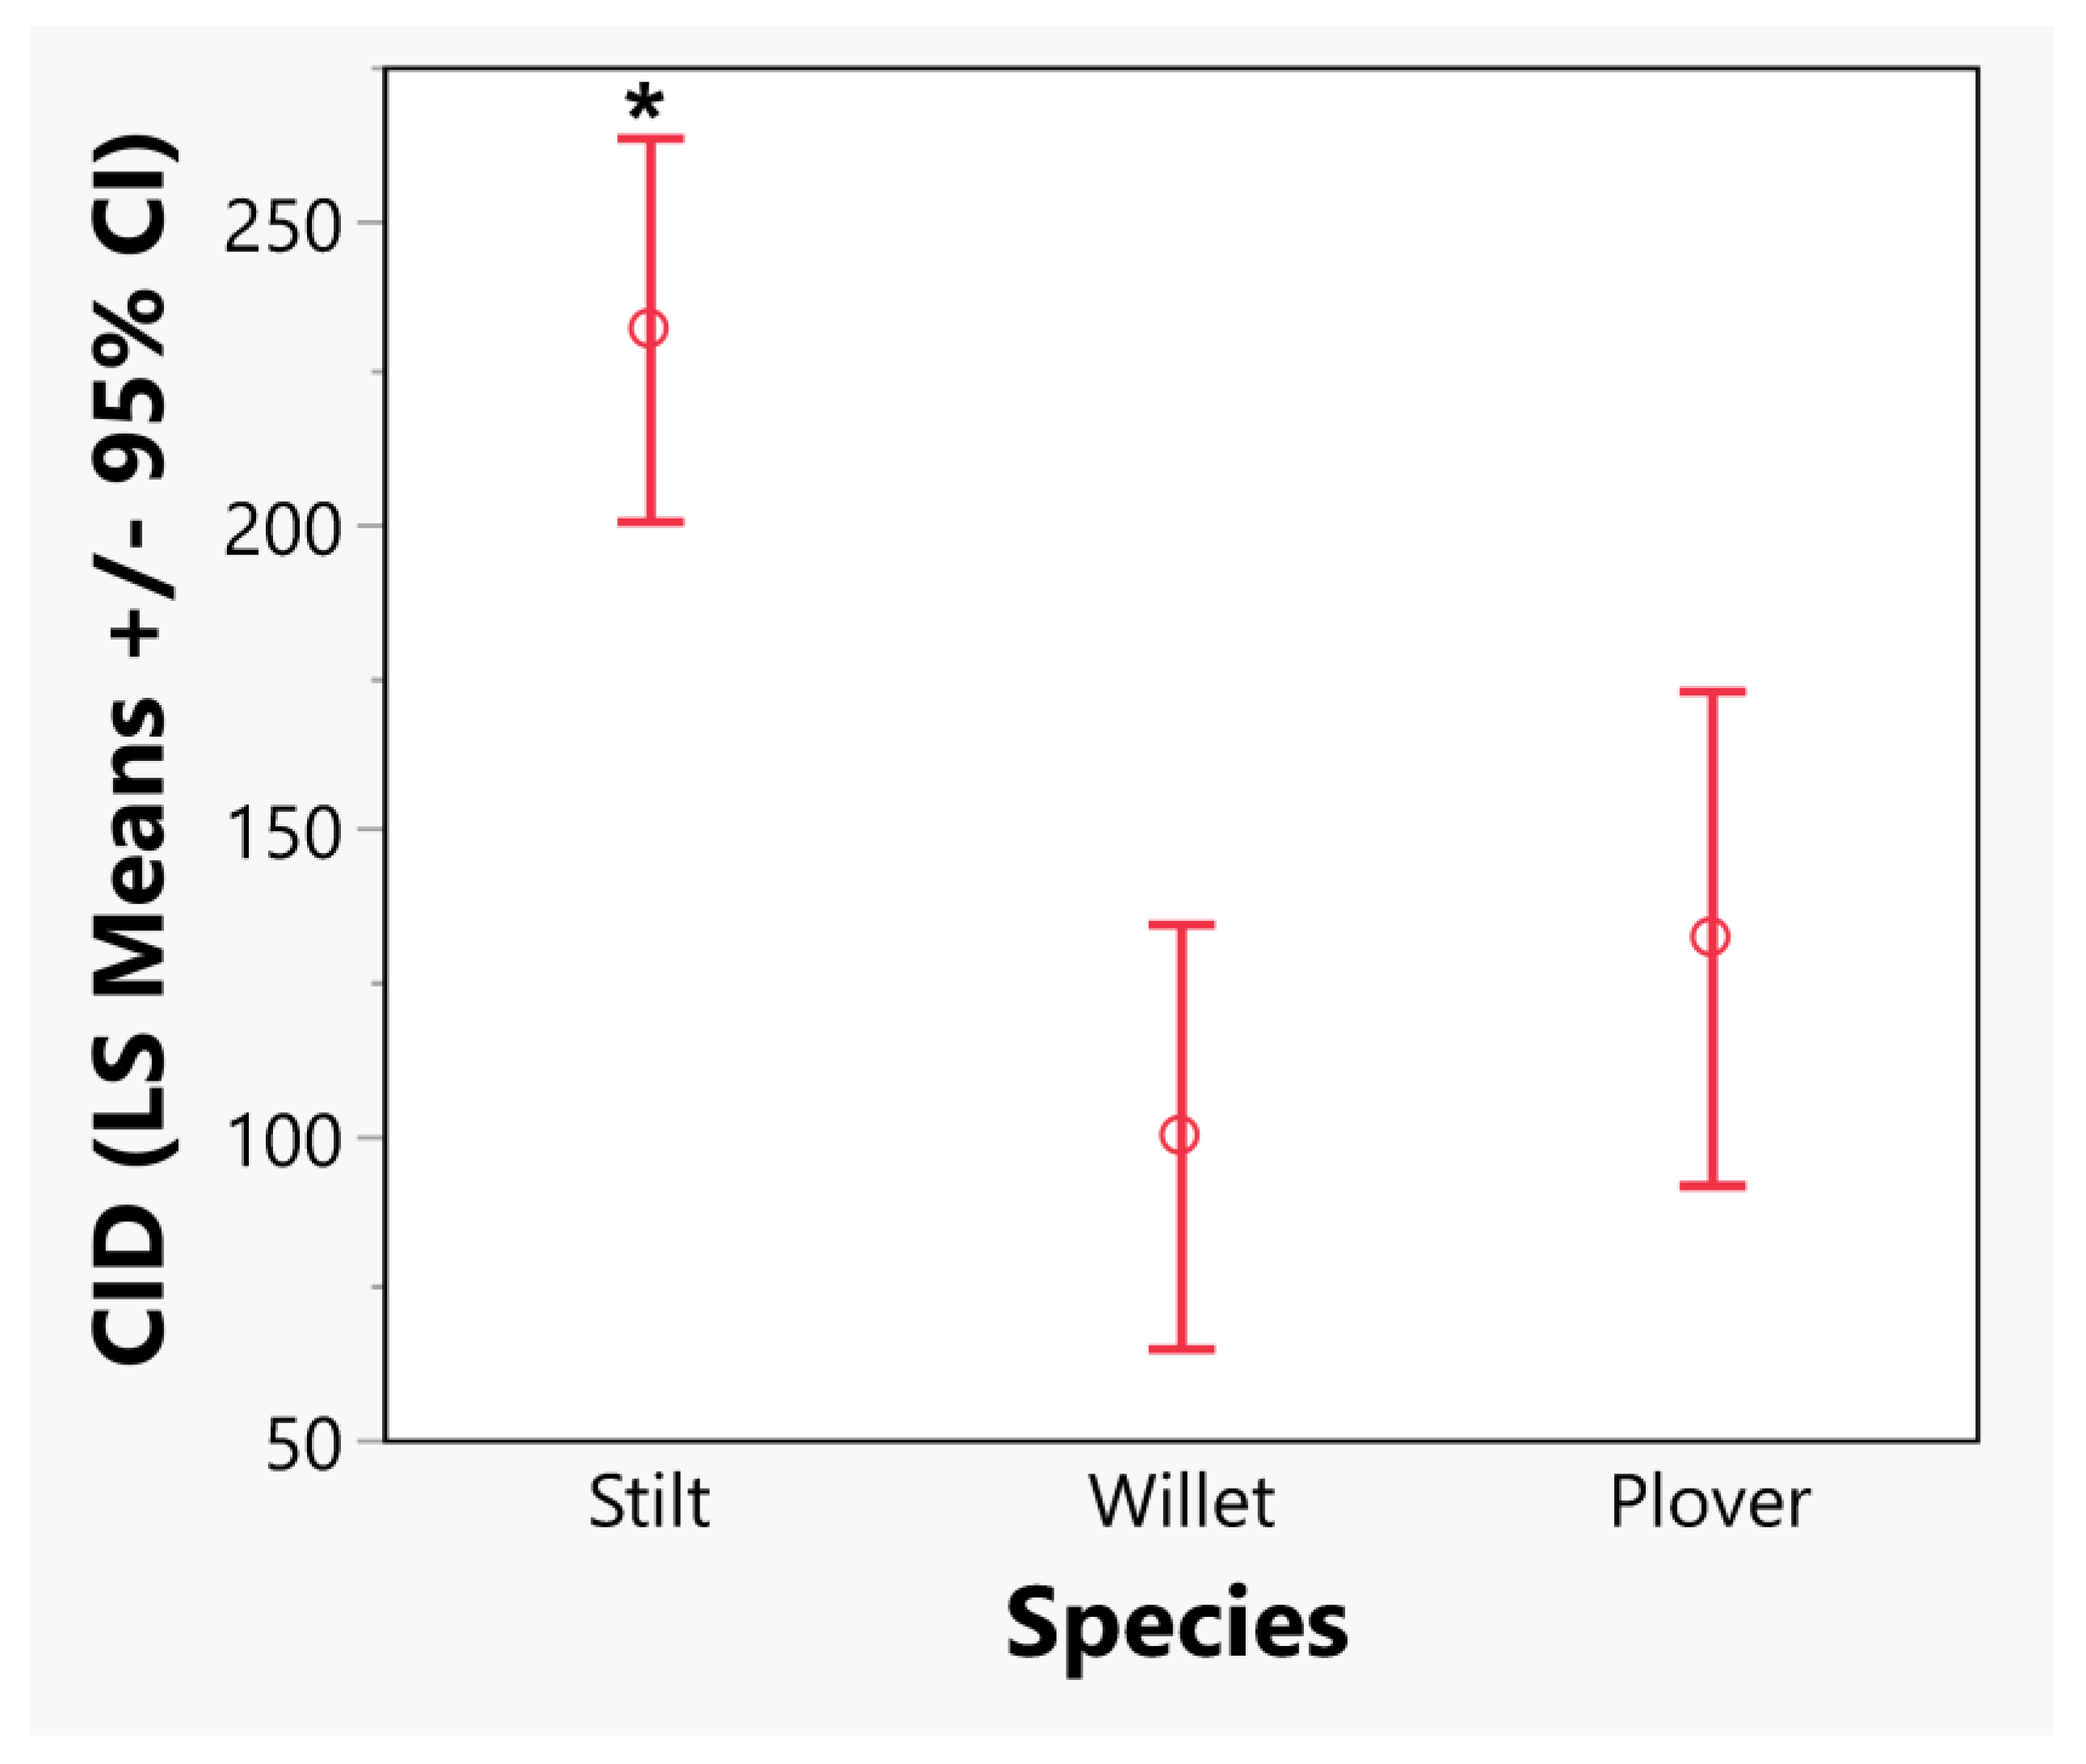
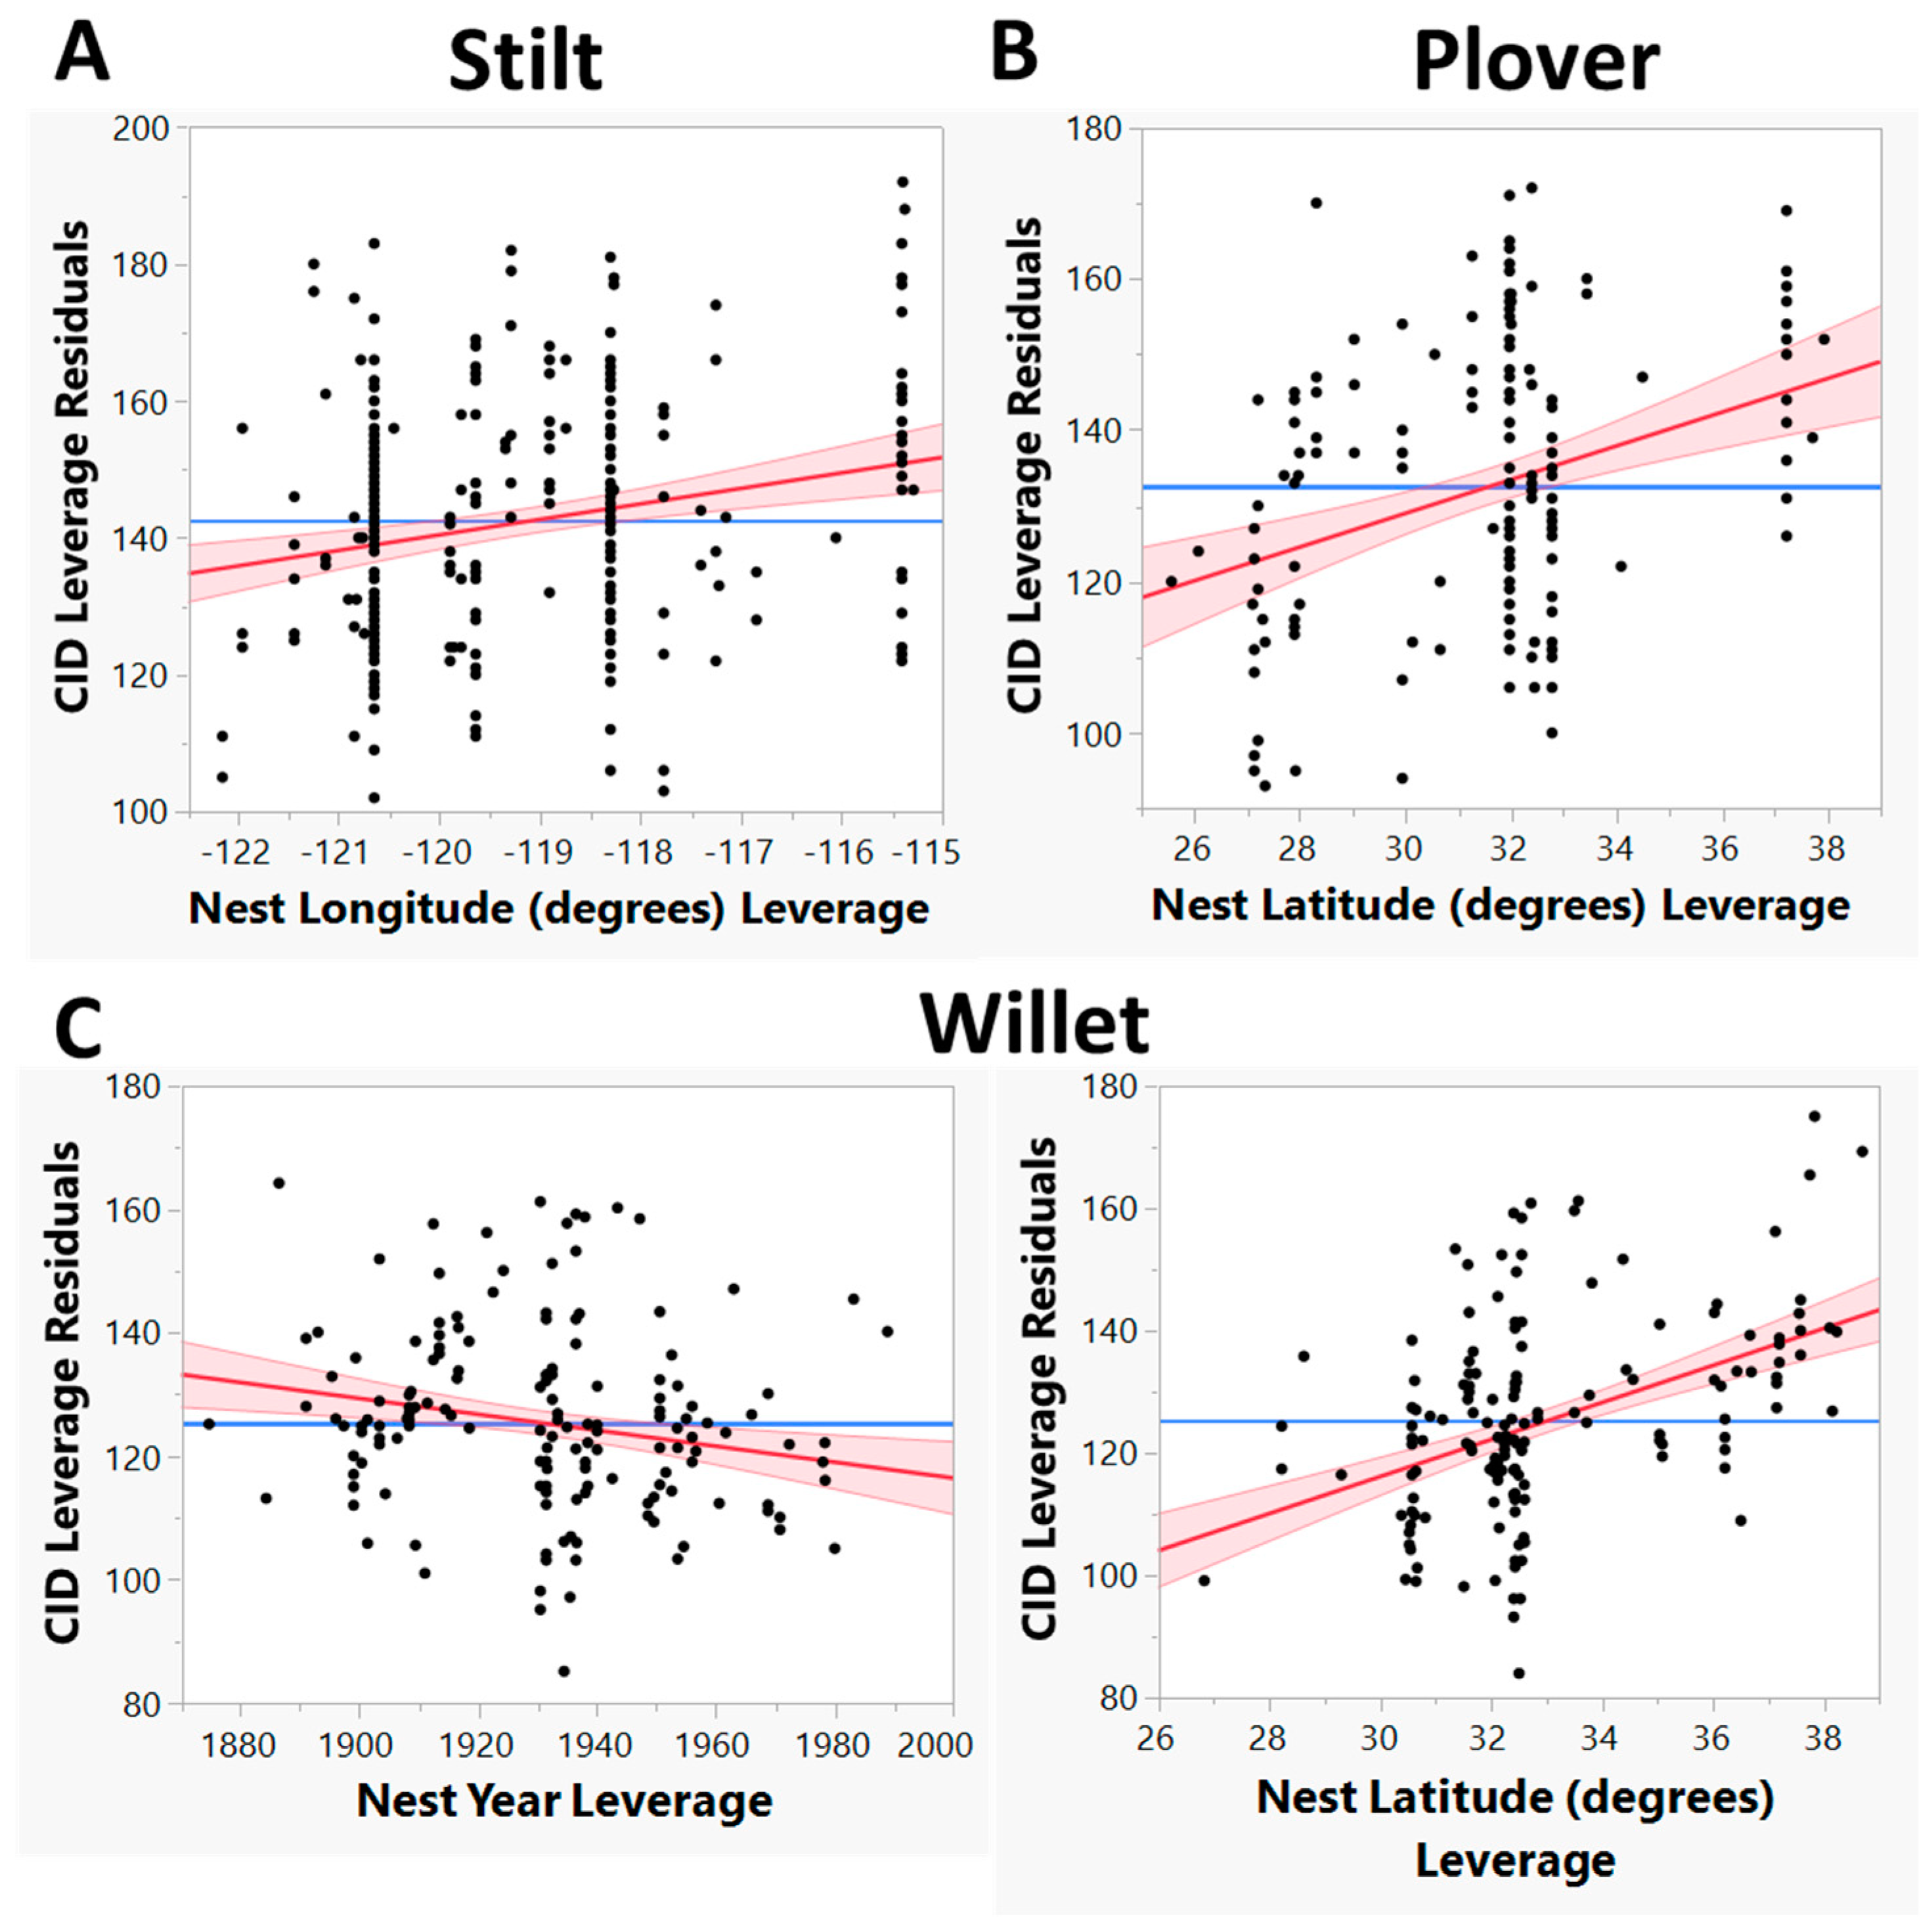
| Species | Average Clutch Size | Average Incubation Period | Assumed Laying Period |
|---|---|---|---|
| Stilt | 4 | 25 | 4 |
| Willet | 4 | 26 | 6 |
| Plover | 3 | 25 | 5 |
| Source for Clutch | Stilt | Willet | Plover | Total |
|---|---|---|---|---|
| American Museum of Natural History [37] | 0 | 20 | 27 | 47 |
| Clemson University Bob and Betsy Campbell Natural History Museum | 7 | 36 | 26 | 69 |
| Denver Museum of Nature and Science * [38] | 15 | 5 | 6 | 26 |
| Jurica-Suchy Nature Museum at Benedictine University * [39] | 1 | 1 | 4 | 6 |
| Museum of Vertebrate Zoology * [40] | 27 | 2 | 9 | 38 |
| Smithsonian National Museum of Natural History [41] | 5 | 9 | 27 | 41 |
| Western Foundation of Vertebrate Zoology [42] | 314 | 203 | 181 | 698 |
| Cornell NestWatch Program | 43 | 11 | 15 | 69 |
| Total | 412 | 287 | 295 | 994 |
| Collector Incubation Stage Terms | Incubation Stage Category | Estimated % of Incubation at Collection | Estimated Number of Days of Incubation |
|---|---|---|---|
| All fresh, Fresh, Nearly fresh, Perfectly fresh | Fresh | 0% | 0 |
| Fresh to slight | Median of “Fresh” and “Slight” | 8% | Only applies to two willet clutches: 2 |
| Slight, Slightly incubated, Very slight, Began, Begun, Begun in all, Just begun, Commenced, Barely commenced, Just commenced, Trace, Trace only, Small embryos, Started, Just started, Few days | Slight Incubation | 15–16% | 4 |
| 1/4 incubated, 25%, About 25% | 1/4 incubation | 25% | Stilt and plover: 6, willet: 7 |
| 1/3, 1/3 incubated, 1/3 advanced, About 1/3, About 1/3 advanced, About one third | 1/3 incubation | 33% | Stilt and plover: 8, willet: 9 |
| 2/5 incubated | 2/5 incubation | 40% | Only applies to one stilt clutch: 10 |
| 1/2, 1/2 incubated, Halfway, 1/2 advanced, About 1/2, About 1/2 advanced, Half, About half, About one half, Medium embryos, Well along, Well begun, Well started, 50% incubated, Medium, Nearly 1/2 | 1/2 incubation | 50% | 13 |
| Advanced, Advanced-far, Highly advanced, Large embryos, Heavy, Considerable, Far advanced, Very far advanced, Well advanced | Advanced Incubation | 80% | Stilt and plover: 20, willet: 21 |
| Ready to hatch, Nearly ready to hatch, Feathers ready to hatch | Two days left of incubation | 96% | Stilt and plover: 24, willet: 25 |
| Fixed Effects | Estimate | p-Value |
|---|---|---|
| Nest Year | −0.09 | 0.003 |
| Nest Latitude | 1.75 | 0.008 |
| Nest Longitude | 2.03 | <0.001 |
| Species: Stilt | 77.34 | <0.001 |
| Species: Willet | −54.91 | <0.001 |
| Species: Plover | −22.43 | 0.03 |
| Species (Stilt) × Longitude | 2.39 | 0.02 |
| Species (Willet) × Longitude | −0.57 | 0.37 |
| Species (Plover) × Longitude | −1.82 | 0.02 |
| A | West Temperature | East Temperature | |||||
|---|---|---|---|---|---|---|---|
| Month | Fixed Effects | Adjusted R2 | Estimate | p-Value | Adjusted R2 | Estimate | p-Value |
| March | Year | 0.83 | 0.02 | <0.001 | 0.80 | 0.004 | 0.02 |
| Latitude | −1.17 | <0.001 | −1.11 | <0.001 | |||
| Longitude | - | - | - | - | |||
| April | Year | 0.84 | 0.01 | <0.001 | 0.86 | 0.01 | <0.001 |
| Latitude | - | - | −0.84 | <0.001 | |||
| Longitude | 0.90 | <0.001 | - | - | |||
| May | Year | 0.87 | 0.01 | <0.001 | 0.80 | 0.004 | <0.001 |
| Latitude | - | - | −0.43 | <0.001 | |||
| Longitude | 0.88 | <0.001 | −0.32 | <0.001 | |||
| Year | 0.92 | 0.01 | <0.001 | 0.69 | 0.01 | <0.001 | |
| June | Latitude | 0.96 | 0.01 | −0.22 | <0.001 | ||
| Longitude | 1.68 | <0.001 | −0.24 | 0.001 | |||
| B | West Precipitation | East Precipitation | |||||
| Month | Fixed Effects | Adjusted R2 | Estimate | p-value | Adjusted R2 | Estimate | p-value |
| March | Year | 0.28 | - | - | 0.09 | −0.14 | <0.001 |
| Latitude | −4.88 | 0.006 | 6.76 | <0.001 | |||
| Longitude | −13.15 | <0.001 | −6.68 | <0.001 | |||
| April | Year | 0.23 | - | - | 0.09 | 0.21 | <0.001 |
| Latitude | −1.76 | 0.053 1 | 3.66 | <0.001 | |||
| Longitude | −4.57 | <0.001 | −4.08 | <0.001 | |||
| May | Year | 0.14 | - | - | 0.07 | - | - |
| Latitude | 1.68 | <0.001 | −4.71 | <0.001 | |||
| Longitude | - | - | 7.02 | <0.001 | |||
| Year | 0.15 | - | - | 0.20 | 0.28 | <0.001 | |
| June | Latitude | 1.12 | <0.001 | −9.71 | <0.001 | ||
| Longitude | 0.41 | 0.04 | - | - | |||
| A | Species | Month | R2 | F-Value with df | Estimate | p-Value | n |
|---|---|---|---|---|---|---|---|
| Stilt | March | 0.01 | 2.28 1, 210 | 0.85 | 0.13 | 212 | |
| April | 0.01 | 3.00 1, 211 | 0.93 | 0.08 | 213 | ||
| May | 0.02 | 5.02 1, 212 | 0.81 | 0.03 | 214 | ||
| June 1 | 0.04 | 8.52 1, 219 | 0.86 | 0.004 | 221 | ||
| Willet | March | 0.08 | 9.22 1, 113 | −2.10 | 0.003 | 115 | |
| April | 0.13 | 16.10 1, 111 | −2.93 | <0.001 | 113 | ||
| May 1 | 0.15 | 20.11 1, 110 | −4.07 | <0.001 | 112 | ||
| June | 0.07 | 8.71 1, 108 | −3.96 | 0.004 | 110 | ||
| Plover | March | 0.01 | 0.84 1, 75 | −0.81 | 0.36 | 77 | |
| April 1 | 0.0233 | 1.83 1, 77 | −1.17 | 0.18 | 79 | ||
| May | 0.0227 | 1.80 1, 77 | 1.95 | 0.18 | 79 | ||
| June | 0.017 | 1.33 1, 75 | 2.09 | 0.25 | 77 | ||
| B | Species | Month | R2 | F-value with df | Estimate | p-value | n |
| Stilt | March 1 | 0.014 | 3.12 1, 221 | −0.07 | 0.08 | 223 | |
| April | 0 | 0.15 1, 215 | −0.02 | 0.70 | 217 | ||
| May | 0 | 0.01 1, 207 | −0.01 | 0.93 | 209 | ||
| June | 0.011 | 2.32 1, 213 | −0.38 | 0.13 | 215 | ||
| Willet | March | 0 | 0.15 1, 124 | 0.01 | 0.70 | 126 | |
| April | 0.017 | 2.05 1, 118 | 0.04 | 0.15 | 120 | ||
| May | 0 | 0.08 1, 126 | 0.01 | 0.78 | 128 | ||
| June 1 | 0.018 | 2.35 1, 125 | −0.03 | 0.13 | 127 | ||
| Plover | March | 0.01 | 0.60 1, 95 | 0.02 | 0.44 | 97 | |
| April | 0 | 0.03 1, 93 | −0.01 | 0.87 | 95 | ||
| May 1 | 0.03 | 2.75 1, 96 | −0.05 | 0.10 | 98 | ||
| June | 0.01 | 1.05 1, 96 | −0.02 | 0.31 | 98 |
Disclaimer/Publisher’s Note: The statements, opinions and data contained in all publications are solely those of the individual author(s) and contributor(s) and not of MDPI and/or the editor(s). MDPI and/or the editor(s) disclaim responsibility for any injury to people or property resulting from any ideas, methods, instructions or products referred to in the content. |
© 2023 by the authors. Licensee MDPI, Basel, Switzerland. This article is an open access article distributed under the terms and conditions of the Creative Commons Attribution (CC BY) license (https://creativecommons.org/licenses/by/4.0/).
Share and Cite
Abernathy, V.E.; Good, A.; Blanchard, A.; Bongiovanni, M.; Bonds, E.; Warner, H.; Chaknis, E.; Pulsifer, G.; Huntley, F. The Effects of Climate Change on the Nesting Phenology of Three Shorebird Species in the United States. Animals 2023, 13, 2459. https://doi.org/10.3390/ani13152459
Abernathy VE, Good A, Blanchard A, Bongiovanni M, Bonds E, Warner H, Chaknis E, Pulsifer G, Huntley F. The Effects of Climate Change on the Nesting Phenology of Three Shorebird Species in the United States. Animals. 2023; 13(15):2459. https://doi.org/10.3390/ani13152459
Chicago/Turabian StyleAbernathy, Virginia E., Abby Good, Autum Blanchard, Marlisa Bongiovanni, Emily Bonds, Hampton Warner, Eleni Chaknis, Gabriella Pulsifer, and Faith Huntley. 2023. "The Effects of Climate Change on the Nesting Phenology of Three Shorebird Species in the United States" Animals 13, no. 15: 2459. https://doi.org/10.3390/ani13152459
APA StyleAbernathy, V. E., Good, A., Blanchard, A., Bongiovanni, M., Bonds, E., Warner, H., Chaknis, E., Pulsifer, G., & Huntley, F. (2023). The Effects of Climate Change on the Nesting Phenology of Three Shorebird Species in the United States. Animals, 13(15), 2459. https://doi.org/10.3390/ani13152459


