Article

Novel Gene Rearrangement Pattern in Pachycrepoideus vindemmiae Mitochondrial Genome: New Gene Order in Pteromalidae (Hymenoptera: Chalcidoidea)

1
Collaborative Innovation Center of Recovery and Reconstruction of Degraded Ecosystem in Wanjiang Basin Co-founded by Anhui Province and Ministry of Education, School of Ecology and Environment, Anhui Normal University, Wuhu 241000, China
2
Key Laboratory of Zoological Systematics and Evolution, Institute of Zoology, Chinese Academy of Sciences, Chaoyang District, Beijing 100101, China
3
Centre de Biologie pour la Gestion des Populations (CBGP), INRAE, CIRAD, IRD, Montpellier SupAgro, Université de Montpellier, 34398 Montpellier, France
4
Anhui Provincial Key Laboratory of the Conservation and Exploitation of Biological Resources, College of Life Sciences, Anhui Normal University, Wuhu 241000, China
*
Authors to whom correspondence should be addressed.
Animals 2023, 13(12), 1985; https://doi.org/10.3390/ani13121985
Submission received: 18 April 2023 / Revised: 5 June 2023 / Accepted: 9 June 2023 / Published: 14 June 2023
(This article belongs to the Section Animal Genetics and Genomics)

Abstract

:

Simple Summary

The mitochondrial genome is a reliable genetic marker for reconstructing phylogeny and Pteromalidae is a diverse and complex family of chalcid wasps, but its evolutionary history is still poorly understood. In this study, we sequenced the mitochondrial genomes of four species (Muscidifurax similadanacus, M. sinesensilla, Nasonia vitripennis, and Pachycrepoideus vindemmiae) of Pteromalidae. Additionally, a phylogenetic hypothesis was reconstructed for the subfamilies of Pteromalidae that includes newly acquired mitogenomes and those deposited in NCBI. We used pairwise breakpoint distances to infer this phylogeny. Our study enriches the overall knowledge on gene rearrangement in Pteromalidae, reveals the evolutionary relationships among several major groups of Pteromalidae, accumulates molecular data for a Pteromalidae phylogeny, and provides a genetic background basis for biological control in agriculture and forestry.

Abstract

The mitochondrial genomes of Muscidifurax similadanacus, M. sinesensilla, Nasonia vitripennis, and Pachycrepoideus vindemmiae were sequenced to better understand the structural evolution of Pteromalidae mitogenomes. These newly sequenced mitogenomes all contained 37 genes. Nucleotide composition was AT-biased and the majority of the protein-coding genes exhibited a negative AT skew. All 13 protein-coding genes (PCGs) initiated with the standard start codon of ATN, excepted for nad1 of N. vitripennis, which started with TTG, and terminated with a typical stop codon TAA/TAG or an incomplete stop codon T. All transfer RNA (tRNA) genes were predicted to fold into the typical clover-leaf secondary structures, except for trnS1, which lacks the DHU arm in all species. In P. vindemmiae, trnR and trnQ lack the DHU arm and TΨC arm, respectively. Although most genes evolved under a strong purifying selection, the Ka/Ks value of the atp8 gene of P. vindemmiae was greater than 1, indicating putative positive selection. A novel transposition of trnR in P. vindemmiae was revealed, which was the first of this kind to be reported in Pteromalidae. Two kinds of datasets (PCG12 and AA) and two inference methods (maximum likelihood and Bayesian inference) were used to reconstruct a phylogenetic hypothesis for the newly sequenced mitogenomes of Pteromalidae and those deposited in GenBank. The topologies obtained recovered the monophyly of the three subfamilies included. Pachyneurinae and Pteromalinae were recovered as sister families, and both appeared sister to Sycophaginae. The pairwise breakpoint distances of mitogenome rearrangements were estimated to infer phylogeny among pteromalid species. The topology obtained was not totally congruent with those reconstructed using the ML and BI methods.

1. Introduction

The animal mitochondrial genome is maternally inherited and fast-evolving [1]. Mitochondrial DNA is usually double-stranded and composed of 37 genes, 13 protein-coding genes, 2 rRNAs, and 22 tRNAs [2,3,4]. Information contained by the gene organization of mitogenomes is a valuable tool for phylogenetic and genetic studies [5,6,7,8,9]. Moreover, mitochondrial genome sequences are widely used in studies of molecular evolution and population genetics [10,11,12,13,14]. In recent years, an increasing number of mitochondrial genomes have been sequenced in Hymenoptera with a phylogenetic purpose.
The phylogeny of Pteromalidae has long been debated and is still controversial. The relationships among Pteromalidae and other chalcid families are still uncertain. Chen et al. considered that Agaonidae was closely related to Pteromalidae [15], whereas Wu et al. proposed that Pteromalidae and Eurytomidae were sister groups [16]. Pteromalidae has been considered as a polyphyletic group for decades [17]. This concept was supported by several studies [18,19,20], even though Pteromalidae was recovered as monophyletic in several other studies [16,21,22]. Rasplus et al. [23] suggested that Sycoecinae, Otitesellinae, and Sycoryctinae (used to be Agaonidae) should be transferred to Pteromalidae based on ribosomal and mitochondrial genes as well as morphology. Dzhanokmen [24] combined morphology and biological characters to reconstruct an unformal phylogeny and suggested Pteromalinae to be sister to all other Pteromalidae. Desjardins et al. [25] used four nuclear coding genes to reconstruct the phylogenetic relationship of Pteromalidae. Their results confirmed the monophyly of nearly all tribes represented by multiple specimens, and two subfamilies. Other subfamilies appeared para- or polyphyletic, and monophyly was significantly rejected for Miscogasterinae, Ormocerinae, and Colotrechninae. Munro et al. [18] conducted a molecular analysis based on 18S and 28S ribosomal genes, which supported the monophyly of seven subfamilies and the paraphyly or polyphyly of nine subfamilies. A similar result was recovered by Heraty et al. [19]. Pteromalidae, as historically understood, is both a highly diverse and a highly disparate group, these properties rendering it difficult to reconstruct a reliable phylogenetic hypothesis based on both morphological and molecular characters. Hereafter, we propose to investigate the relationships among Pteromalidae based on complete mitochondrial genomes.
In most insect groups, gene rearrangements in mitogenomes are relatively rare events and can be reliably used as phylogenetic markers [3]. To the opposite, gene rearrangements appear common in Chalcidoidea mitogenomes and may represent evolutionarily independent events. Gene rearrangements in Chalcidoidea have been hypothesized to correlate with the diversity of their life-history traits and with their phylogenetic positions [14]. In Pteromalidae, twenty nearly complete mitochondrial genomes belonging to four subfamilies have been reported so far, and a total of 14 gene rearrangements have been found in these subfamilies [14,16,26]. Oliveira et al. [26] first sequenced a partial mitochondrial genome of N. vitripennis. Compared with a hypothetical ancestral pattern, they identified six inverted protein-coding genes (PCGs). The incomplete mitochondrial genome of Nasonia vitripennis Walker, 1836 (Pteromalidae) was the first mitochondrial genome to be reported in Chalcidoidea; it showed novel gene rearrangements compared to other insects and was considered the typical model for Chalcidoidea [26]. However, nine genes were not sequenced and the gene arrangements of N. vitripennis were still partly undetermined. Subsequently, Xiao et al. [14] sequenced the mitochondrial genomes of two species of Sycoryctinae and showed that gene rearrangements mostly concerned tRNAs. Finally, Tang et al. and Wu et al. [16,27] performed mitochondrial sequencing of Pteromalidae species and summarized gene rearrangements.
The CREx program online is widely used to heuristically determine pairwise rearrangement events in mitochondrial genomes [28]. It considers transpositions, reverse transpositions, reversals, and tandem-duplication-random-loss (TDRL) events, which are based on common intervals that reflect genes that appear consecutively in several of the input gene orders. Wu et al. [16] proposed that “closely related groups in lower taxonomic levels tend to exhibit more similar gene orders, which indicates that gene rearrangements may still be useful for phylogenetic analysis at higher taxonomic levels. Pairwise breakpoint distances can be used to analyze the rates of mitochondrial gene rearrangement for Chalcidoidea using the CREx web server”.
We measured complete or nearly complete mitochondrial genomes of four Pteromalidae, Muscidifurax similadanacus Xiao and Zhou, 2018 [29], M. sinesensilla Xiao & Zhou, 2018 [29], and N. vitripennis as primary parasitoids and Pachycrepoideus vindemmiae Rondani, 1875 which is both a primary parasitoid and hyperparasitoid [29,30,31,32,33,34,35,36]. Using these newly acquired mitogenomes of Pteromalidae as well as those deposited in GenBank, we propose a phylogenetic hypothesis based on mitogenomes for Pteromalidae. A second aim of this study is to analyze the characteristics of the Pteromalidae mitogenomes and to test the ability of pairwise breakpoint distances to infer reliable phylogenetic relationships.

2. Materials and Methods

2.1. Sample Preparation and DNA Extraction

All specimens were collected from the wild, including the three primary parasitoids and Pachycrepoideus vindemmiae as primary parasitoids and hyperparasitoids [37]. M. similadanacus and M. sinesensilla were collected in Xinjiang province of China, N. vitripennis was collected in Shandong province, and P. vindemmiae in Anhui province (Table 1), and then they were reared in the laboratory for more than three years. All the specimens were stored at −20 °C in absolute ethanol prior to DNA extraction. Total genomic DNA was extracted using the cetyltrimethyl ammonium bromide (CTAB) method [38].

2.2. Sequencing and Assembly

Sequencing was performed using a whole-genome shotgun (WGS) strategy on the Illumina Novaseq platform. The PCR library was constructed with the use of a TruSeqTM DNA Sample Prep Kit for each species using genomic DNA with an insert size of 350 bp and was sequenced on the Illumina platform at Berry Genomics, Beijing; a total of 10 Gb clean data (150 bp pair-end reads) were obtained for each species. The fragments were repaired by the combined action of 3′-5′ exonuclease and polymerase in an End Repair Mix. Thereafter, magnetic beads purified the connection products, which were incubated with the DNA fragment to remove free and self-connecting joint sequences. Finally, the homogenized and mixed libraries were gradually diluted and quantified to 4–5 pM for sequencing. The quality of data was checked with FastQC [6,41]. The original data adapter had been removed by AdapterRemoval version 2 [42]. SOAPec version 2.01 was used for quality correction with K-mer set to 17. Reads with a length of less than 50 bp were excluded. Geneious v 11.0.2 was used to assemble and annotate the mitochondrial (mt) genomes [6,43]. The COX1 gene of N. vitripennis (MT635402) was used as a reference to map and to identify the COX1 gene of these four pteromalid species in our mitogenome sequences [44]. Subsequently, the sequence was extended on each side using a de novo method based on the local alignment method.

2.3. Mitochondrial Genome Annotation

The tRNA genes and protein-coding genes were identified using the MITOS Webserver. The secondary structure was also predicted using the MITOS WebSever, setting the parameters with the Invertebrate Mito genetic code [6,45]. Protein-coding genes (PCGs) were identified as open reading frames corresponding to the 13 PCGs in the metazoan mitogenomes. Mitogenome maps were produced using Organellar Genome DRAW (OGDRAW) [46].

2.4. Comparative Analysis

Base composition and relative synonymous codon usage (RSCU) were analyzed using MEGA X [47]. Geneious v 11.0.2 [43] was used to check all the genes in the mitochondrial genome. Comparative analyses of codon usage for these four mitogenomes were calculated using PhyloSuite [22,45]. The predicted secondary structures of all tRNAs were drawn using Adobe Illustrator CC 2018. Multiple-substitution correction of Non-synonymous (Ka)/synonymous (Ks) mutation rate ratios among the 13 PCGs was calculated with DnaSP v5, using that of Pachyneuron aphidis (Pteromalidae: Pachyneurinae) as a reference sequence [48,49]. AT/GC skewness was calculated as AT skew= (A − T)/(A + T) and GC skew = (G − C)/(G + C) [50].

2.5. Phylogenetic Analysis

To reconstruct the phylogeny of Pteromalidae, 4 newly generated mitogenomes and 18 others downloaded from GenBank were analyzed. Species of Eupelmus (Eupelmidae) and Torymus (Torymidae) were used as outgroups (Table 1). All protein-coding genes were aligned individually based on codon optimized multiple alignments using the MAFFT 7.3.1 and G-INS-I algorithm [51]. Aligned sequences were then concatenated into two different datasets (PCG12, including the first and second codon of 13 protein-coding genes, and AA: 13 PCGs translated into amino acids). Maximum-likelihood (ML) analysis was conducted in W-IQtree [52] using the best-fit substitution model. An ultrafast bootstrap (UFB) [53] of 1000 replications and the SH-aLRT test [54] was used to assess branch supports. Bayesian inference was implemented in PhyloBayes MPI 1.5a [55] and we used a site-heterogeneous mixture model (CAT+GTR). The trees were sampled every 1000 generations, and the burning rate was set as 0.25 of the sampled value. FigTree v.1.3.1 [56] was used to view topologies.

2.6. Ancestral Character Reconstruction and Gene Rearrangement in Pteromalidae

To explore the effect of parasitic lifestyles (primary parasitoids or/and hyperparasitoids) and of the phylogenetic position in gene rearrangement, we performed an ancestral character reconstruction using Mesquite 3.04 [57]. Because some mitogenome sequences were incomplete and pairwise breakpoint distances could not be calculated, we used mitogenomes with 37 genes (13 PCGs, 2 rRNAs, 22 tRNAs) and the complete/incomplete control region to performed our test.
Four newly generated mitogenomes and three obtained from GenBank were analyzed to reconstruct the ancestral character of Pteromalidae. The parasitic lifestyle of the species included in our dataset was coded as follows: 1: primary parasitoids; 2: both primary parasitoids and hyperparasitoids; and 3: undefined. The results obtained were organized in figures using Adobe Illustrator CC 2018. A map of the mitochondrial gene rearrangement was depicted with the Illustrator of biological sequences (IBS) [58]. Pairwise breakpoint distances (PBD) were used to analyze the rate of mitochondrial gene rearrangement for Pteromalidae (complete mitogenomes only) using the CREx web server [28]. A heatmap of the pairwise breakpoint distance was drawn using TBtools [59].

3. Results

3.1. Genome Structure

The M. similadanacus (GenBank accession number: MT712139), M. sinesensilla (GenBank accession number: MT712140), N. vitripennis (GenBank accession number: MT712141), and P. vindemmiae (GenBank accession number: MT712142) mitochondrial genomes have a total length of 15,080 bp, 15,020 bp, 14,791 bp, and 14,850 bp, respectively, and all were typical double-chain circular molecular structures (Figure 1). They contained 22 tRNA genes, 2 rRNA genes (rrnL and rrnS), and 13 protein-coding genes (nad1-6, nad4l, cox1-3, atp8, atp6, cytb). The transcription direction of encoding genes observed in the newly sequenced mitogenomes was generally consistent with other insects. The positions of four genes (trnR, trnF, trnN, trnE) of P. vindemmiae differ from those for the three other newly sequenced species (Table 2 and Table 3). In P. vindemmiae, 28 genes (16 tRNAs, 10 PCGs, and 2 rRNAs) were in the J chain, and 9 genes (6 tRNAs and 3 PCGs) and an AT-rich region were located in the N chain.

3.2. Characteristics of Base Composition

The nucleotide composition of the mitogenomes exhibits a high A + T content, with an average of 83.98%, which is usual in mtDNA in arthropods and Hymenoptera [60,61,62]. Among the newly generated mitogenomes, P. vindemmiae had the highest AT content (85.3%) and N. vitripennis had the lowest (83.0%) (Table 1 and Table 2). Based on the analysis of base content, the range of the AT (GC) skew value varies from 0.018 (−0.112) to 0.047 (−0.091); for P. vindemmiae it was 0.036 (−0.108), indicating a high A-T bias in Pteromalidae mitogenomes.
Among the 13 PCGs, the highest AT content was 84.2% for P. vindemmiae, and the lowest was 81.7% for N. vitripennis. Among the newly generated mitogenomes, P. vindemmiae had the highest AT contents for the full genome, PCGs, tRNAs, and rRNAs, which were 85.3%, 84.2%, 88.9%, and 88.0%, respectively (Table 4). There are three hydrogen bonds between G and C and two hydrogen bonds between A and T, so GC was more stable than AT. High AT content is likely to be one of the most important factors explaining rearrangement in mitochondrial genomes.

3.3. Overlap and Gap

A total length of 370 bp of gaps were found in the newly sequenced mitogenomes, of which M. similadanacus had 58 bp of gaps, M. sinesensilla 121 bp, N. vitripennis 94 bp, and P. vindemmiae 97 bp. Among these species, the longest gap was 35 bp and was located between trnI and nad2 of P. vindemmiae. The shortest gap was 1 bp and was located between trnQ and nad1 of M. similadanacus, trnN and trnR and trnH and nad4 of M. sinesensilla, trnD and atp8 and cytb and nad6 with N. vitripennis, trnS1 and trnY and trnC and trnN, cox2, and trnK, trnQ, and nad1 of P. vindemmiae.
Overlapping genes are common in mitochondrial genomes of arthropods. A total of 98 bp of overlaps were observed in our sequenced mitogenomes. Overlapping genes might reflect the selection for a short and economic mitogenome, and they usually involve trn genes, because their sequences are constrained by fewer mutations [63,64]. Most of the discovered overlaps appeared in tRNA. M. similadanacus had 31 bp of overlaps, M. sinesensilla 23 bp, N. vitripennis 21 bp, and P. vindemmiae 23 bp. The length of overlap ranged from 1 to 10 bp, and the longest was located between atp8 and atp6 of M. similadanacus and M. sinesensilla. The shortest was 1 bp and were located between atp6 and cox3, cytb and nad6, and trnS2 and cytb of M. similadanacus; nad3 and trnC and atp6 and cox3 of M. sinesensilla; nad3 and trnC and nad5 and trnF of N. vitripennis; and atp6 and cox3, trnT and nad4l, and cytb and nad6 of P. vindemmiae.

3.4. Transfer RNA and Ribosomal RNA Genes

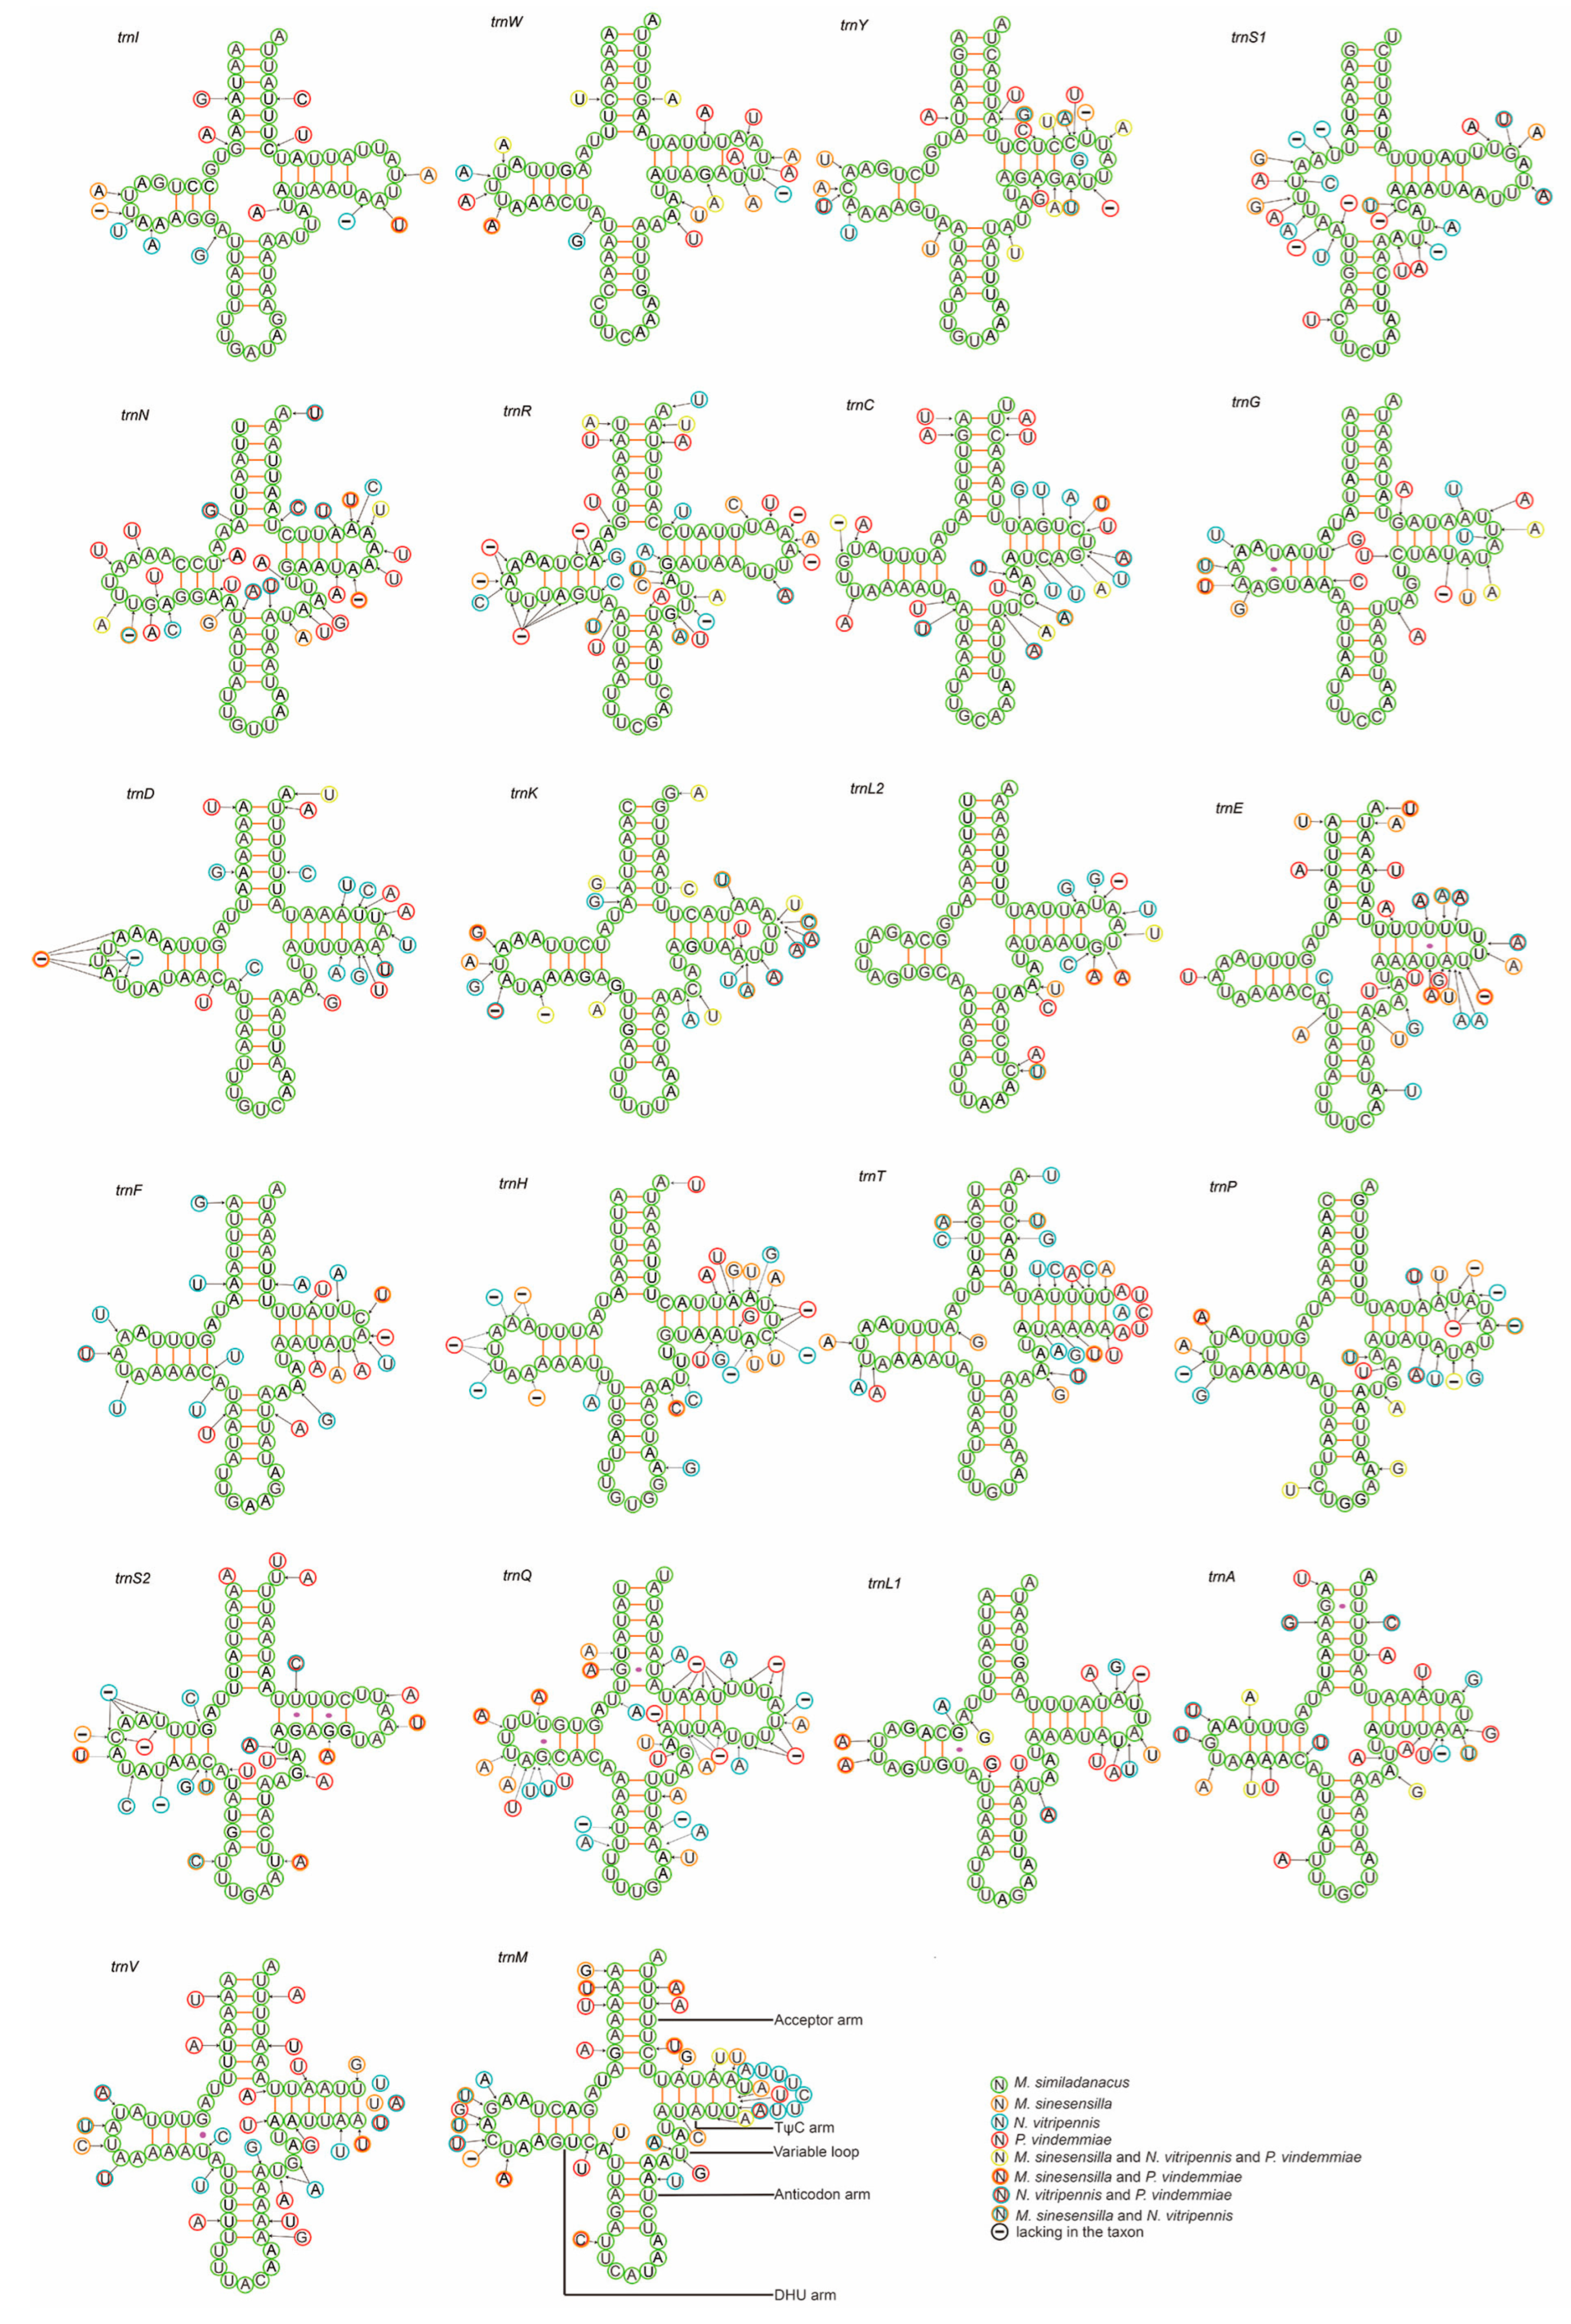
In total, 22 tRNA genes were interspersed throughout the mitochondrial genomes of Pteromalidae. Within the tRNA secondary structures of pteromalid mitogenomes, the DHU arm of trnS1 was missing, while in P. vindemmiae, the DHU arm and TΨC arm were missing in trnR and trnQ, respectively. Many insects lack DHU arms in the trnS1 secondary structures, while other secondary structures are typical clover structures. This folding probably happened early in the evolution of Metazoa [65]. The TΨC arm of some insects is also missing [66]. Among the 22 tRNAs, 16 tRNAs were in the J chain and the six others were in the N chain. Additionally, the size of tRNAs ranged from 55 to 74 bp (Figure 2). The average nucleotide composition of these tRNAs was A: 44.5%, T: 43.7%, C: 6.9%, and G: 4.9%, with a total average A + T content of 88.2%. Most AT skews were positive, except in P. vindemmiae (−0.006). In the same manner, all GC skews were negative, which indicates a slight bias towards the use of A and T in tRNAs.
The positions of large and small ribosomal RNA genes (rrnL and rrnS) were consistent with those observed in most other insects (between trnL1-trnA and trnA-trnV). The lengths of rrnS and rrnL for N. vitripennis were the longest among the four species, and the lengths of rrnS and of rrnL for P. vindemmiae were the shortest. Among these four species, the length of rrnS ranged from 763 to 787 bp, and the average AT content was 87.6% (P. vindemmiae had the highest AT content); the length of rrnL ranged from 1300 to 1325 bp, and the average AT content was 87.0%. In P. vindemmiae, the length of the rrnS gene was 763 bp with an AT content of 88.9%, while the rrnL gene was 1300 bp with an AT content of 87.5%.

3.5. Protein-Coding Genes

In our four new mitogenomes, 10 of 13 protein-coding genes were encoded by the majority strand, while 3 genes (nad2, nad6 and cytb) were encoded by the minority strand; the length of the 13 protein-coding genes ranged from 161 bp to 1675 bp. Among them, the length of the 13 protein-coding genes of P. vindemmiae was 159-1672 bp. Among the 13 protein-coding genes, the shortest and longest encoding genes were atp8 and nad5. In M. similadanacus and M. sinesensilla, the protein-encoding genes had the same length excepted for nad1, nad5, and nad6. The length of cox3, atp6, and nad4l were the same in the four newly sequenced species, being, respectively, 786 bp, 675 bp, and 288 bp.
The total length of the PCGs of the four new mitogenomes ranged from 11092 bp to 11117 bp. The shortest was 11092 bp in P. vindemmiae and accounted for 74.69% of the entire genome. The highest average AT content of the 13 protein-coding genes was 84.20% in P. vindemmiae and the lowest was 81.70% in N. vitripennis. In all new mitogenomes, cox1 had the lowest AT content in the 13 PCGs, ranging from 76.9% (P. vindemmiae) to 74.5% (N. vitripennis), and atp8 had the highest AT content in these 13 PCGs, ranging from 92.50% (P. vindemmiae) to 88.10% (N. vitripennis).
The preferred initiation codon of the pteromalid mitogenomes was ATN, as observed in most other insect mitogenomes [47], except for nad1 of N. vitripennis, which starts with TTG. In these four pteromalid species, the start codon of six genes (cox3, atp6, cox1, nad4, nad6, and cytb) was ATG and it was ATT for the other three genes (cox2, nad5, nad4l). The stop codon of eight genes (nad2, cox3, atp6, atp8, cox2, nad4l, nad6, cytb) was TAA. TAG was the stop codon of nad5 of N. vitripennis. Four genes of P. vindemmiae (nad3, cox1, nad4, and nad5), two genes of N. vitripennis (cox1 and nad4), two genes of M. sinesensilla (nad5 and nad1), and one gene of M. similadanacus (nad5) use the incomplete T- as stop codons (Table 2 and Table 3).
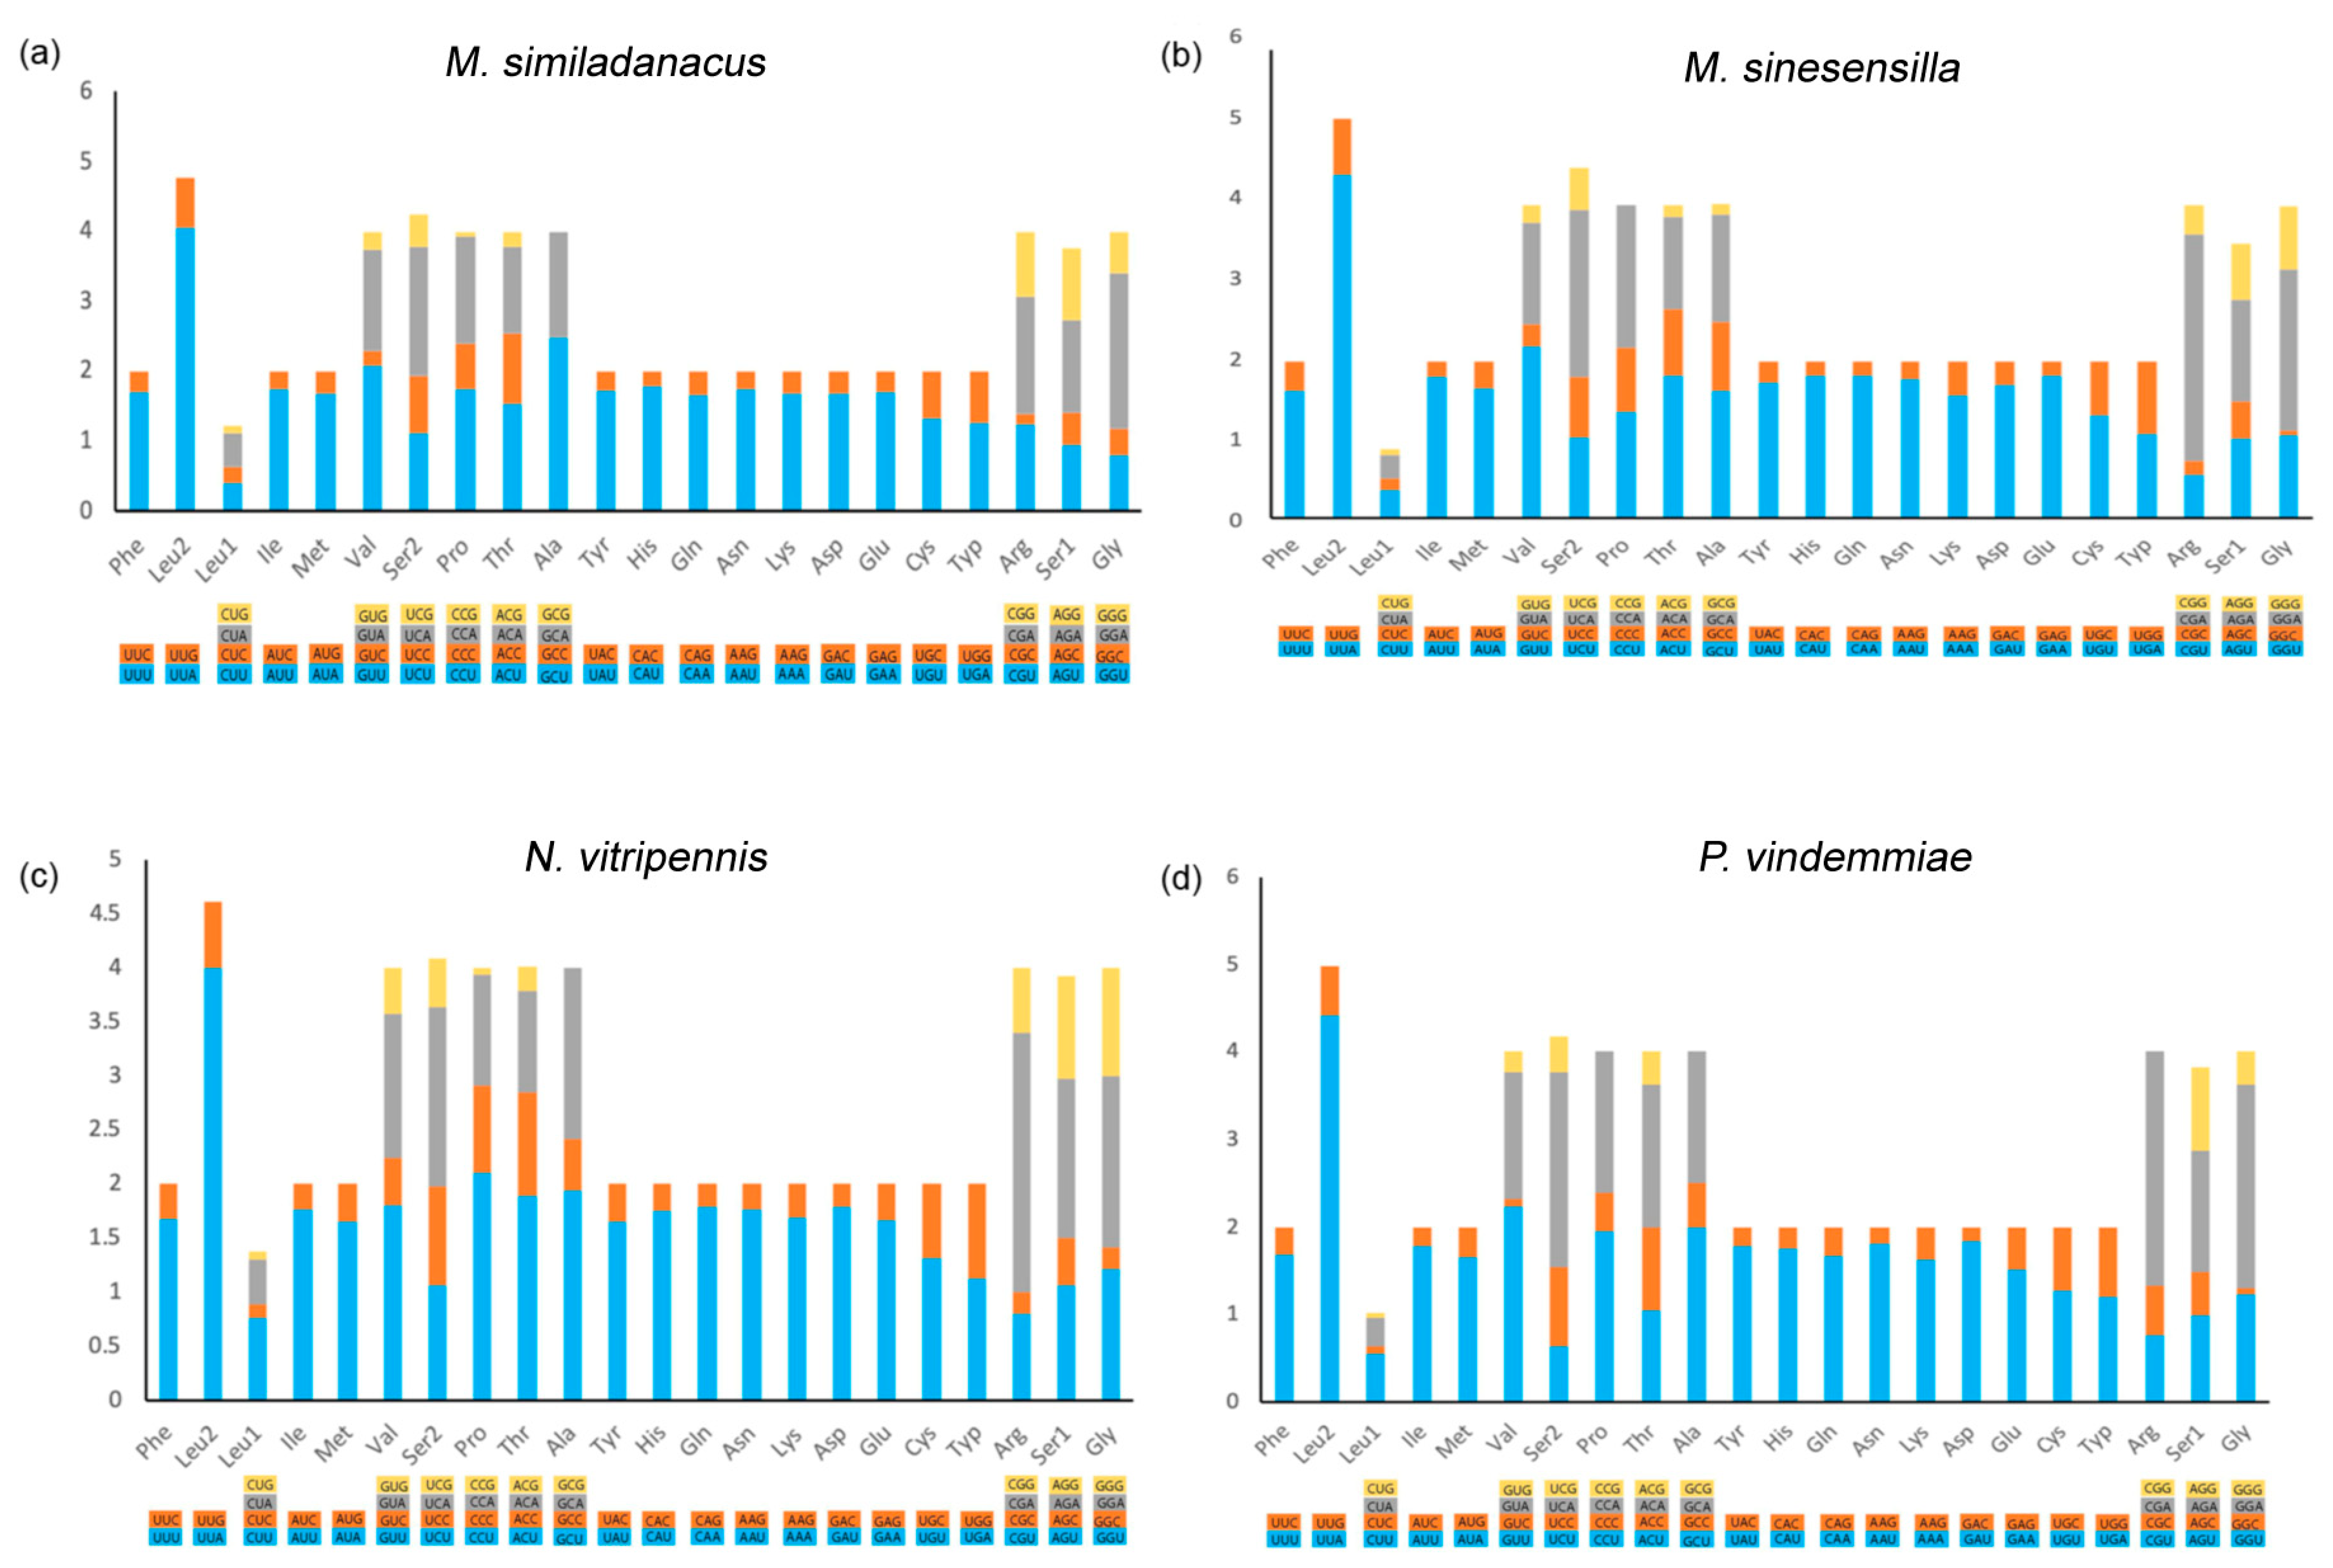
Codons with high AT content were preferred, which was consistent with most other insect mitogenomes [67]. The relative synonymous codon usages (RSCU) of these four species are shown in Figure 3. Taken together, the most frequently used codons were UUA (Leu2), CGA (Arg), GGA (Gly), UCA (Ser2), CCU (Pro), GUU (Val), and GCU (Ala), whereas codons ending with G or C, CUG, CUC, CAG, and GGC, were the less frequently used codons. The third codon position of A/T occurred more frequently than that of G/C, reflecting AT nucleotide bias in the mitochondrial PCGs among Pteromalidae.

3.6. Evolutionary Rate Analysis

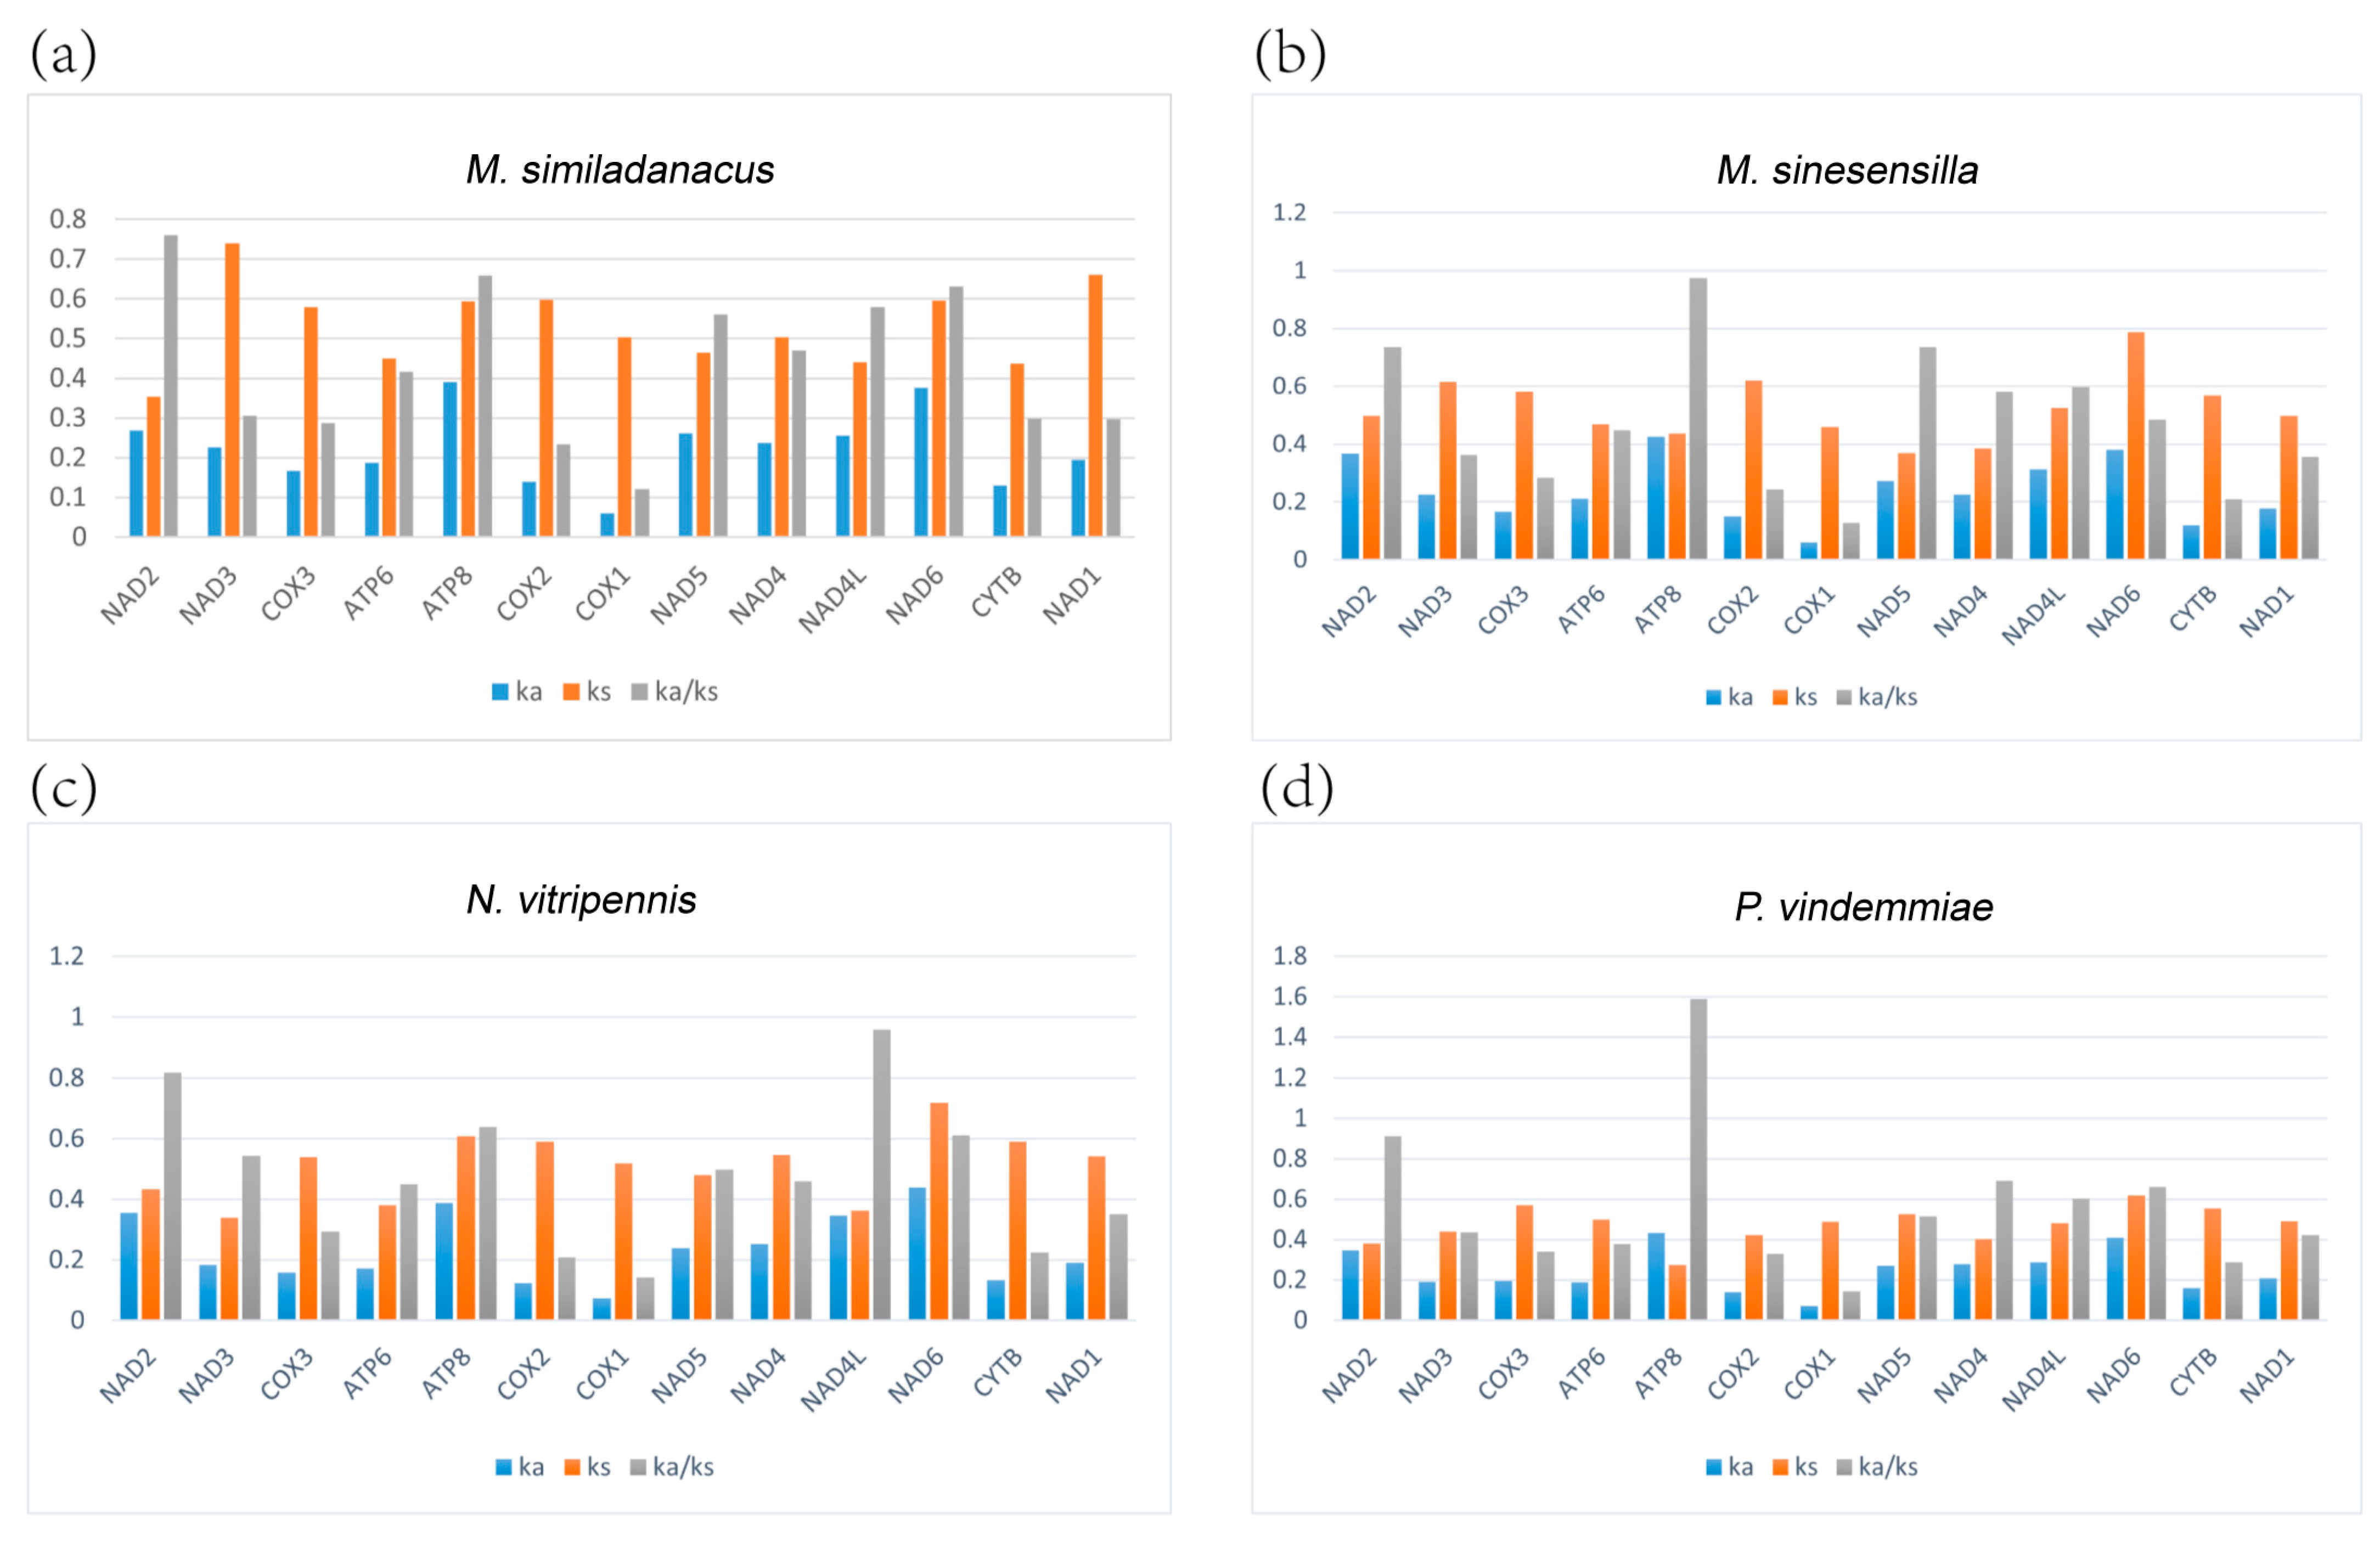
The non-synonymous/synonymous substitution ratio (Ka/Ks) can be used to estimate whether a sequence is undergoing purifying, neutral, or positive selection. Among the four new mitogenomes, the Ka/Ks value of cox1 was the lowest, at 0.12, 0.13, 0.14, and 0.14, respectively; among M. sinesensilla and P. vindemmiae, the Ka/Ks value of atp8 was the highest at 0.97 and 1.59 respectively, but the highest Ka/Ks value of M. similadanacus was that of nad2 (0.76), and the highest of N. vitripennis was that of nad4l (0.96).
In total, only the Ka/Ks value of atp8 of P. vindemmiae was greater than one. A Ka/Ks greater than one indicates that this protein-coding gene has been subjected to positive selection effects during evolution. This may suggest that non-synonymous mutations of atp8 were selectively retained, which is rarely observed in insects. Following non-synonymous mutations, the mutated protein-coding gene was retained. Additionally, most of the 13 protein-coding genes were under purifying selection (Figure 4).

3.7. Phylogenetic Analysis

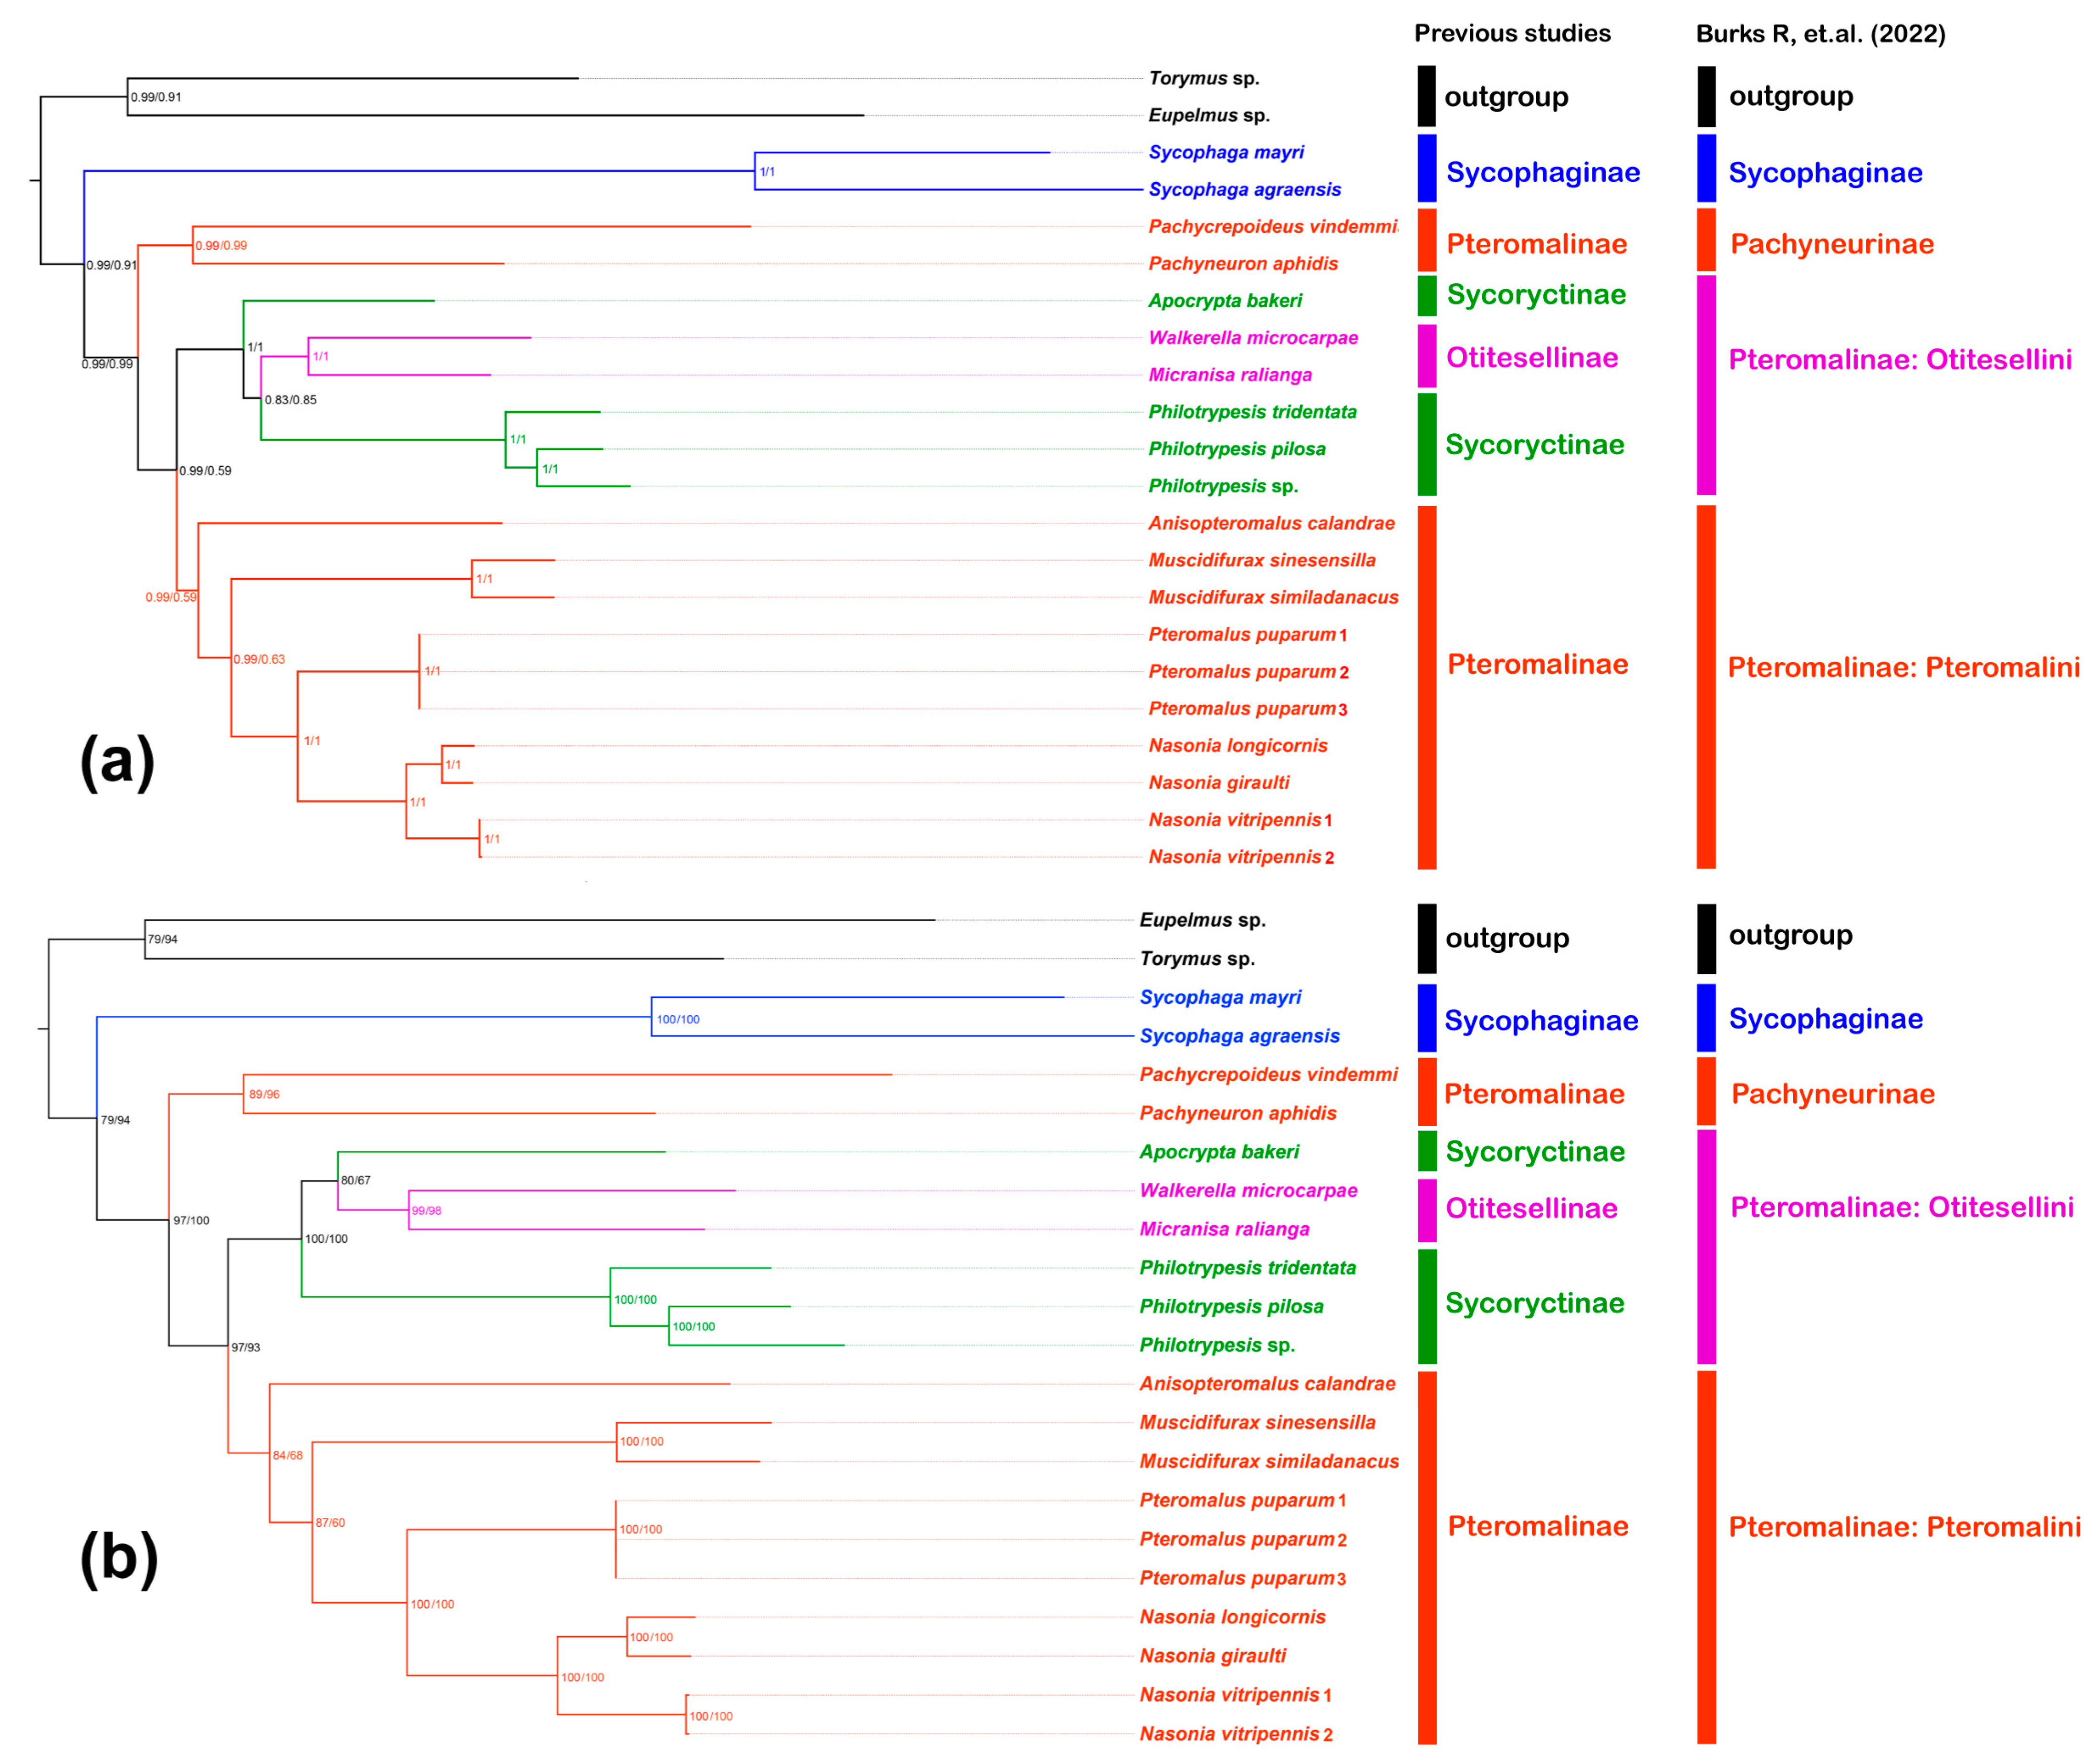
Two datasets (PCG12 and AA) and two inference methods, namely maximum-likelihood (ML) and Bayesian inference (BI), were used to reconstruct the phylogeny of pteromalid mitogenomes, and four topologies of ML-AA, ML-PCG12, BI-AA, and BI-PCG12 were reconstructed. All topologies were highly supported and both methods yield similar topologies. All pteromalid subfamilies were recovered as monophyletic. In all topologies, Pachyneurinae was recovered as sister to Pteromalinae, and this clade was then sister to Sycophaginae. Pteromalinae were subdivided into two monophyletic tribes, Otitesellini and Pteromalini (Figure 5).

3.8. Ancestral Character Reconstruction and Gene Rearrangement

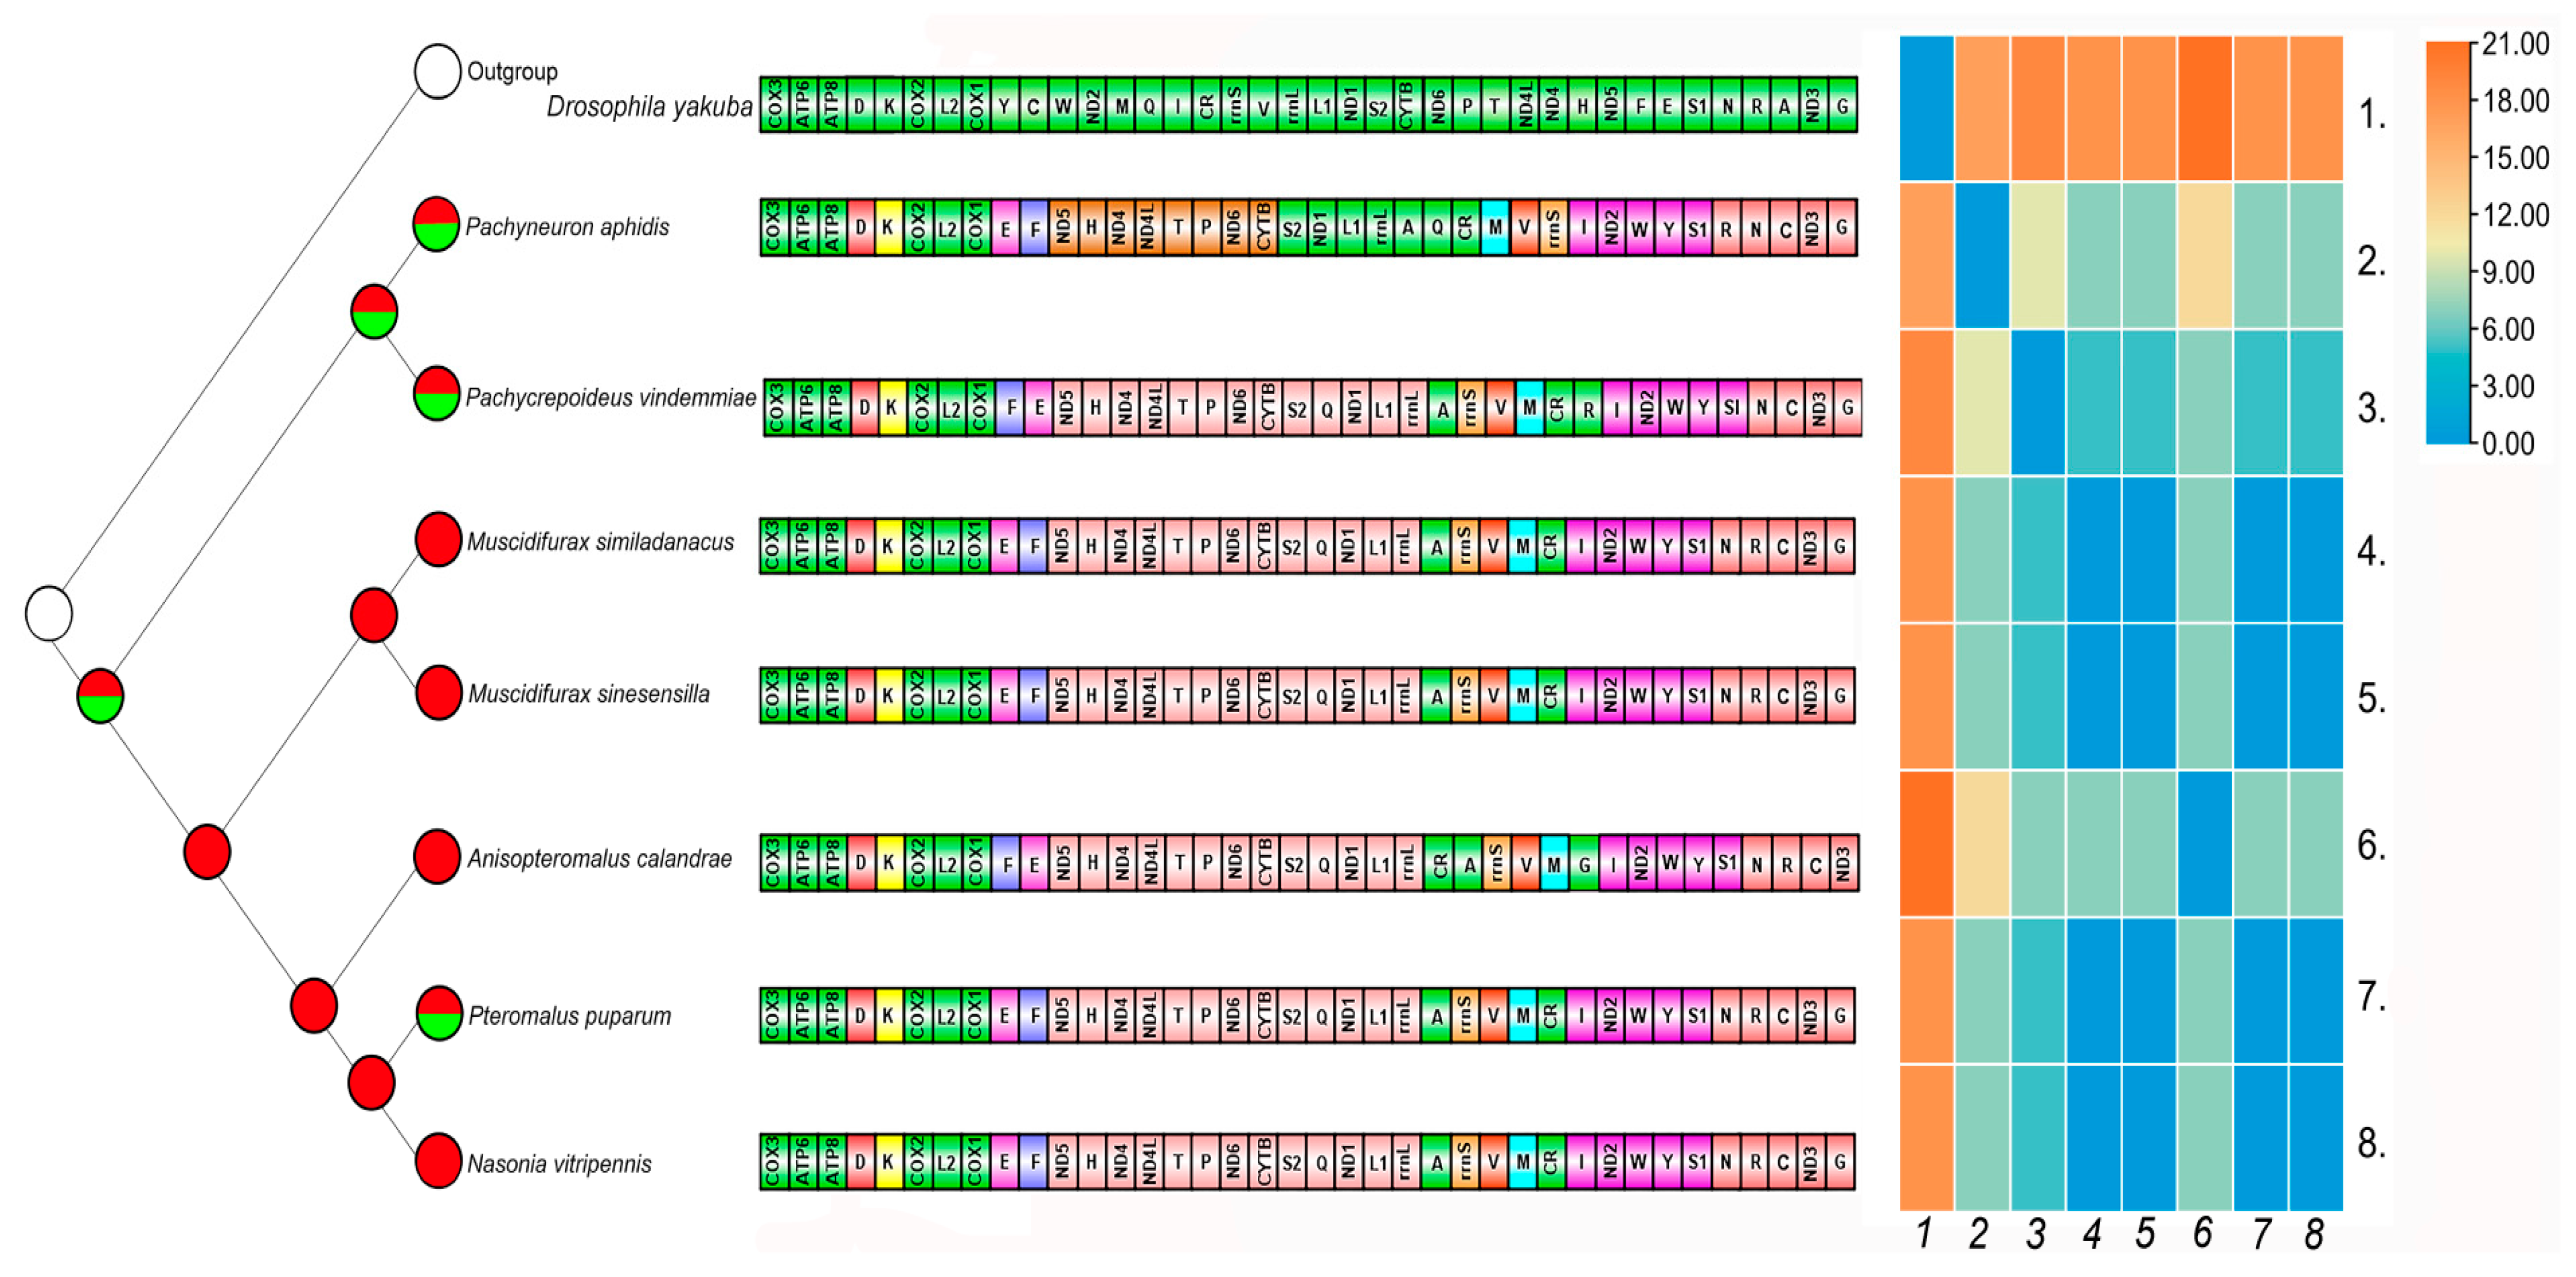
Based on the BI topology, the ancestral biology of Pteromalidae included in the analysis was inferred to be both primary parasitoid and hyperparasitoid (Figure 6).
Gene rearrangement patterns in Hymenoptera are usually more complex and variable than in other insect orders. Compared to the putative ancestral pattern [69,70] of the insect mitogenome, dramatic gene rearrangements were observed in Pteromalidae mitogenomes. These rearrangements occurred in tRNA genes but also in protein-coding genes. Five gene blocks were found in Pteromalidae (only considering complete mitogenomes). The first gene block was cox3-atp6-atp8, which existed in all sequenced species. With the exception of Philotrypesis tridentata, all other species shared the gene block cox2-trnL2-cox1. All species also shared the gene block of nad5-trnH-nad4-nad4l-trnT-trnP-nad6-cytb, but P. tridentata showed an inversion segment (cytb-nad6-trnP-trnT-nad4l-nad4-trnH-nad5). Finally, most species exhibited a gene block of trnS2-trnQ-nad1-trnL1-rrnL-trnA. In addition, gene block trnI-nad2-trnW-trnY-trnS1 was shared by all sequenced genomes.
Muscidifurax similadanacus, M. sinesensilla, and N. vitripennis shared the same gene rearrangement pattern. Eighteen rearrangements were observed between these three pteromalid species and the putative ancestral mitogenome of D. yakuba, including one inversion from trnV-rrnS to rrnS-trnV, and three reversed genes. Pachycrepoideus vindemmiae exhibited a new rearrangement pattern in Pteromalidae and a total of 19 genes were rearranged (Figure 6). Compared with the gene order of N. vitripennis, three kinds of rearrangements were discovered in P. vindemmiae and one inversion from trnE-trnF to trnF-trnE, and trnR had a transposition; for details see Figure 6. In the mitogenome of P. vindemmiae, three gene blocks (trnF-trnE, trnS1-trnN, and rrnS-trnV) were shared with the putative ancestral D. yakuba. Comparison of P. aphidis and P. vindemmiae mitogenomes showed two (CR-trnM-trnV-rrnS and trnE-trnF) inversions and two (trnQ and trnR) transpositions. Comparison of P. aphidis and A. calandrae mitogenomes, highlighted three (trnE-trnF, trnR-trnN, and trnV-rrnS) inversions and two (CR and trnG) transpositions.
Comparison with other pteromalid mitogenomes revealed a novel inversion in the trnE-trnF gene cluster of Pachyneurinae and a novel transposition of trnR in P. vindemmiae, which was the first of this kind to be reported in Pteromalidae (Figure 6). The accelerated rate of gene rearrangement may be the result of the fast evolution of this group [71,72,73].
In Pteromalidae, most species have a high frequency of mitochondrial gene rearrangements, and the breakpoint distances range from 0 to 21 (Figure 6). According to our phylogeny, M. similadanacus and M. sinesensilla were the most closely related species, and the pairwise breakpoint distance between them was 0, which is in agreement with the assumption that a lower value of the pairwise breakpoint distance indicates close relationship in the topology (Figure 6). P. vindemmiae was sister to P. aphidis and the pairwise breakpoint distance between them was 10. P. vindemmiae and M. similadanacus were more distantly related in the topology; however, the pairwise breakpoint distance observed between them was only 5, which is a lower value than that observed between P. vindemmiae and P. aphidis. N. vitripennis and A. calandrae were closely related on the phylogenetic tree, and the pairwise breakpoint distance value was 7, whereas the value of N. vitripennis and P. vindemmiae was only 5. Globally, the pairwise breakpoint distance of mitogenome rearrangements appeared not to be consistent with the relationships and the proximity between Pteromalidae species observed in our topology.

4. Discussion

Gene rearrangement information is highly valuable for phylogenetic reconstruction of specific lineages [8,64], especially in the classification of low-level elements [27,74]. Gene rearrangement has been reported in most insect orders and an increased rate of gene rearrangements has been observed in Hemiptera [10,73], Protura [75], and Hymenoptera [4,14,62]. Since the pioneering work of Boore et al. [2], it has been acknowledged that the gene structure of mitochondrial genomes contains phylogenetic signal [3]. Detection of gene rearrangements in lower-level elements of insect mitogenomes is expected to shed light on the evolution of these taxa [62,74]. The mitochondria of Hymenoptera generally exhibit extremely high molecular evolution rates and extensive gene rearrangements due to their parasitic lifestyles. However, our understanding of the mitochondrial genome of pteromalids is still limited, and the mechanism of gene rearrangement is still unclear.
Our study confirms the gene block cox3-atp6-atp8-trnD-trnK-cox2-trnL2-cox1 observed in Chalcidoidea and acknowledged by Wu et al. [16], though it was not observed in P. tridentata. Wu et al. [16] also observed a large conserved gene block (nad5-trnH-nad4-nad4l-trnT-trnP-nad6-cytb-nad1-trnL1-rrnL) in most mitogenomes of chalcidoid wasps. This gene block was also observed in most species of our study, except in Philotrypesis. Our study also corroborated the fact that most chalcidoid wasps have a gene cluster (nad3-trnG) next to cox3, except Philotrypesis Pilosa, as proposed by Wu et al. [16]. Two other gene blocks proposed by Wu et al. [16], trnI-nad2-trnW and trnY-trnS1, were found to be merged into a larger gene block (trnI-nad2-trnW-trnY-trnS1) in our new mitogenomes. Feng et al. [76] proposed that the gene block CR-trnI-trnQ-trnM-nad2-trnW-trnC-trnY was the main hot spot of gene rearrangement. Our study confirms that the gene rearrangement hot spot of Pteromalidae also occurs in this gene region (Figure 6).
The site-heterogeneous mixture model (CAT+GTR) implemented in PhyloBayes has been shown to correct the wrong grouping of unrelated taxa that share a similar base composition and an accelerated evolutionary rate [77]. ML and BI analyses yield similar topologies (Figure 5). Because Pteromalidae mitogenomes show a high evolutionary rate, we selected the BI topology to reconstruct the ancestral states. In previous classification, Walkerella microcarpae and Micranisa ralianga belonged to Otitesellinae and Apocrypta bakeri, Philotrypesis tridentata, Philotrypesis pilosa, and Philotrypesis sp. to Sycoryctinae. Based our results, Otitesellinae were recovered as nested within Sycoryctinae, which made Sycoryctinae paraphyletic, a result consistent with Zhao et al. [40] and Cruaud et al. [78]. The clade comprising Otitesellinae and Sycoryctinae appeared sister to other Pteromalinae included in our analysis, a result consistent with Rasplus et al. [23]. In addition, Sycoryctinae were not recovered as monophyletic, a result consistent with Munro et al. [18]. However, according to the classification system recently proposed by Burks et al. [68] and based on the analyses by Cruaud et al. [78], our results also corroborated that members of the previous Otitesellinae and Sycoryctinae belong in fact to Pteromalinae and represent at most a tribe of this subfamily. All other pteromalid subfamilies were recovered as monophyletic. Therefore, our study supports the classification proposed by Burks et al. [68] based on nuclear Ultra-Conserved Elements and exons [78]. Our result shows the power of mitogenomes to reconstruct family-level phylogenies in Chalcidoidea, only for three of the eight pteromalid subfamilies and 11 of the 500+ recognized genera. The monophyly of Pteromalidae was not directly tested in the present study and this will be an important issue for future studies.
The pairwise breakpoint distances of mitogenome rearrangements appeared not to be completely consistent with the relationships observed among our Pteromalidae species; see Figure 6. However, the number of mitogenomes used in this study is still limited and increasing sampling is necessary to confirm this result.
Our studies highlighted new Pteromalidae gene rearrangements, revealed the evolutionary relationship between the main groups of Pteromalidae, accumulated molecular data for the study of Pteromalidae phylogeny, and provided a genetic background for biological control in agriculture and forestry.

Author Contributions

Conceptualization, Y.H.; methodology, Y.Y. and L.Q.; data curation, Y.Y. and L.Q.; writing—original draft preparation, Y.H., Y.Y. and L.Q.; writing—review and editing, H.H., J.-Y.R. and X.W.; funding acquisition, Y.H. and X.W. All authors have read and agreed to the published version of the manuscript.

Funding

This work was supported by the National Natural Science Foundation of China (32100355, 32100352), the Natural Science Fund of Anhui Province (1908085QC93) and Natural Science Foundation of Universities of Anhui Province (KJ2020A0094).

Institutional Review Board Statement

Not applicable.

Informed Consent Statement

Not applicable.

Data Availability Statement

All sequences generated during this study have been deposited in the GenBank (https://www.ncbi.nlm.nih.gov/genbank/).

Conflicts of Interest

The authors declare no conflict of interest.

References

  1. Wolstenholme, D. Animal Mitochondrial DNA: Structure and Evolution. In International Review of Cytology; Academic Press: Cambridge, MA, USA, 1992; Volume 141, pp. 173–216. [Google Scholar]
  2. Boore, J.L. Animal mitochondrial genomes. Nucleic Acids Res. 1999, 27, 1767–1780. [Google Scholar] [CrossRef] [PubMed] [Green Version]
  3. Cameron, S.L. Insect mitochondrial genomics: Implications for evolution and phylogeny. Annu. Rev. Entomol. 2014, 59, 95–117. [Google Scholar] [CrossRef] [PubMed] [Green Version]
  4. Wei, S.J.; Shi, M.; Sharkey, M.J.; Cornelisvan, C.A.; Chen, X.X. Comparative mitogenomics of Braconidae (Insecta: Hymenoptera) and the phylogenetic utility of mitochondrial genomes with special reference to Holometabolous insects. BMC Genom. 2010, 11, 371. [Google Scholar] [CrossRef] [Green Version]
  5. Hua, J.; Li, M.; Dong, P.; Cui, Y.; Xie, Q.; Bu, W. Phylogenetic analysis of the true water bugs (Insecta: Hemiptera: Heteroptera: Nepomorpha): Evidence from mitochondrial genomes. BMC Evol. Biol. 2009, 9, 134. [Google Scholar] [CrossRef] [PubMed] [Green Version]
  6. Huang, Y.X.; Feng, J.R.; Bartlett, C.R.; Wei, Y.S.; Qin, D.Z. Contribution to the mitogenome diversity in Delphacinae: Phylogenetic and ecological implications. Genomics 2020, 112, 1363–1370. [Google Scholar] [CrossRef] [PubMed]
  7. Ma, C.; Yang, P.; Jiang, F.; Chapuis, M.P.; Shali, Y.; Sword, G.A.; Kang, L. Mitochondrial genomes reveal the global phylogeography and dispersal routes of the migratory locust. Mol. Ecol. 2012, 21, 4344–4358. [Google Scholar] [CrossRef] [PubMed]
  8. Wang, Y.; Chen, J.; Jiang, L.Y.; Qiao, G.X. Hemipteran mitochondrial genomes: Features, structures and implications for phylogeny. Int. J. Mol. Sci. 2015, 16, 12382–12404. [Google Scholar] [CrossRef] [Green Version]
  9. Nelson, L.A.; Lambkin, C.L.; Batterham, P.; Wallman, J.F.; Dowton, M.; Whiting, M.F.; Yeates, D.K.; Cameron, S.L. Beyond barcoding: A mitochondrial genomics approach to molecular phylogenetics and diagnostics of blowflies (Diptera: Calliphoridae). Gene 2012, 511, 131–142. [Google Scholar] [CrossRef] [Green Version]
  10. Cameron, S.L.; Lambkin, C.L.; Barker, S.C.; Whiting, M.F. A mitochondrial genome phylogeny of Diptera: Whole genome sequence data accurately resolve relationships over broad timescales with high precision. Syst. Entomol. 2007, 32, 40–59. [Google Scholar] [CrossRef]
  11. Cameron, S.L.; Whiting, M.F. Mitochondrial genomic comparisons of the subterranean termites from the Genus Reticulitermes (Insecta: Isoptera: Rhinotermitidae). Genome 2007, 50, 188–202. [Google Scholar] [CrossRef]
  12. Ingman, M.; Kaessmann, H.; Pääbo, S.; Gyllensten, U. Mitochondrial genome variation and the origin of modern humans. Nature 2000, 408, 708–713. [Google Scholar] [CrossRef] [PubMed]
  13. Reyes, A.; Gissi, C.; Pesole, G.; Saccone, C. Asymmetrical directional mutation pressure in the mitochondrial genome of mammals. Mol. Biol. Evol. 1998, 15, 957–966. [Google Scholar] [CrossRef] [PubMed] [Green Version]
  14. Xiao, J.H.; Jia, J.G.; Murphy, R.W.; Huang, D.W. Rapid evolution of the mitochondrial genome in Chalcidoid wasps (Hymenoptera: Chalcidoidea) driven by parasitic lifestyles. PLoS ONE 2011, 6, e26645. [Google Scholar] [CrossRef] [Green Version]
  15. Chen, L.; Chen, P.Y.; Xue, X.F.; Hua, H.Q.; Li, Y.X.; Zhang, F.; Wei, S.J. Extensive gene rearrangements in the mitochondrial genomes of two egg parasitoids, Trichogramma japonicum and Trichogramma ostriniae (Hymenoptera: Chalcidoidea: Trichogrammatidae). Sci. Rep. 2018, 8, 7034. [Google Scholar] [CrossRef] [PubMed]
  16. Wu, Y.F.; Yang, H.L.; Feng, Z.B.; Li, B.Y.; Zhou, W.B.; Song, F.; Li, H.; Zhang, L.; Cai, W.Z. Novel gene rearrangement in the mitochondrial genome of Pachyneuron aphidis (Hymenoptera: Pteromalidae). Int. J. Biol. Macromol. 2020, 149, 1207–1212. [Google Scholar] [CrossRef]
  17. Gibson, G.J.Z.S. Sister-group relationships of the Platygastroidea and Chalcidoidea (Hymenoptera)—An alternate hypothesis to Rasnitsyn (1998). Zool. Scr. 1999, 28, 125–138. [Google Scholar] [CrossRef]
  18. Munro, J.B.; Heraty, J.M.; Burks, R.A.; Hawks, D.; Mottern, J.; Cruaud, A.; Rasplus, J.Y.; Jansta, P. A molecular phylogeny of the Chalcidoidea (Hymenoptera). PLoS ONE 2011, 6, e27023. [Google Scholar] [CrossRef] [Green Version]
  19. Heraty, J.M.; Burks, R.A.; Cruaud, A.; Gibson, G.A.P.; Liljeblad, J.; Munro, J.; Rasplus, J.Y.; Delvare, G.; Janšta, P.; Gumovsky, A.; et al. A phylogenetic analysis of the megadiverse Chalcidoidea (Hymenoptera). Cladistics Int. J. Willi Hennig Soc. 2013, 29, 466–542. [Google Scholar] [CrossRef] [Green Version]
  20. Peters, R.S.; Niehuis, O.; Gunkel, S.; Bläser, M.; Mayer, C.; Podsiadlowski, L.; Kozlov, A.; Donath, A.; Noort, S.V.; Liu, S.; et al. Transcriptome sequence-based phylogeny of chalcidoid wasps (Hymenoptera: Chalcidoidea) reveals a history of rapid radiations, convergence, and evolutionary success. Mol. Phylogenetics Evol. 2018, 120, 286–296. [Google Scholar] [CrossRef]
  21. Zhang, Y.Z.; Xiong, M.; Zhou, Q.S.; Jiang, G.C.; Zhu, C.D. The mitochondrial gensome of Platencyrtus parkeri Feriere (Hymenoptera: Encyrtidae). Mitochondrial DNA Part B Resour. 2019, 4, 3479–3481. [Google Scholar] [CrossRef] [Green Version]
  22. Zhang, D.; Gao, F.; Jakovlić, I.; Zou, H.; Zhang, J.; Li, W.X.; Wang, G.T. PhyloSuite: An integrated and scalable desktop platform for streamlined molecular sequence data management and evolutionary phylogenetics studies. Mol. Ecol. Resour. 2020, 20, 348–355. [Google Scholar] [CrossRef] [PubMed]
  23. Rasplus, J.Y.; Kerdelhué, C.; Le Clainche, I.; Mondor, G. Molecular phylogeny of fig wasps Agaonidae are not monophyletic. In Comptes Rendus de l’Académie des Sciences-Series III-Sciences de la Vie; Elsevier: Amsterdam, The Netherlands, 1998; Volume 321, pp. 517–526. [Google Scholar] [CrossRef]
  24. Dzhanokmen, K.A. Phylogenetic relations between Palaearctic Pteromalidae (Hymenoptera, Chalcidoidea) subfamilies. Zool. Zhurnal 2000, 79, 564–571. [Google Scholar] [CrossRef]
  25. Desjardins, C.A.; Regier, J.C.; Mitter, C. Phylogeny of pteromalid parasitic wasps (Hymenoptera: Pteromalidae): Initial evidence from four protein-coding nuclear genes. Mol. Phylogenetics Evol. 2007, 45, 454–469. [Google Scholar] [CrossRef] [PubMed]
  26. Oliveira, D.C.S.G.; Raychoudhury, R.; Lavrov, D.V.; Werren, J.H. Rapidly evolving mitochondrial genome and directional selection in mitochondrial genes in the parasitic wasp nasonia (hymenoptera: Pteromalidae). Mol. Biol. Evol. 2008, 25, 2167–2180. [Google Scholar] [CrossRef] [PubMed] [Green Version]
  27. Tang, P.; Zhu, J.C.; Zheng, B.Y.; Wei, S.J.; Sharkey, M.; Chen, X.X.; Vogler, A.P. Mitochondrial phylogenomics of the Hymenoptera. Mol. Phylogenetics Evol. 2019, 131, 8–18. [Google Scholar] [CrossRef] [PubMed]
  28. Bernt, M.; Merkle, D.; Ramsch, K.; Fritzsch, G.; Perseke, M.; Bernhard, D.; Schlegel, M.; Stadler, P.F.; Middendorf, M. CREx: Inferring genomic rearrangements based on common intervals. Bioinformatics 2007, 23, 2957–2958. [Google Scholar] [CrossRef] [Green Version]
  29. Xiao, H.; Zhou, S.Y.; Tong, Y.F. A taxonomic study of Muscidifurax Girault & Sanders from China (Hymenoptera, Chalcidoidea, Pteromalidae). ZooKeys 2018, 776, 91–103. [Google Scholar] [CrossRef]
  30. Chen, W.; He, Z.; Ji, X.L.; Tang, S.T.; Hu, H.Y. Hyperparasitism in a Generalist Ectoparasitic Pupal Parasitoid, Pachycrepoideus vindemmiae (Hymenoptera: Pteromalidae), on Its Own Conspecifics: When the Lack of Resource Lead to Cannibalism. PLoS ONE 2015, 10, e0124305. [Google Scholar] [CrossRef] [Green Version]
  31. Doğanlar, M. A new species of Muscidifurax Girault & Sanders, 1910 (Hymenoptera: Pteromalidae) from Adana province, Turkey. Turk. J. Entomol. 2007, 31, 243–252. [Google Scholar]
  32. Gao, M.Q.; Cheng, J.Q.; Hu, W.; Pan, D.; Xiao, H.; Hu, H.Y. Life tables of two newly discovered parasitoid wasps, Muscidifura similadanacus and M. sinesensilla (Hymenoptera: Pteromalidae), reared on Musca domestica (Diptera: Muscidae). Biocontrol Sci. Technol. 2020, 30, 779–794. [Google Scholar] [CrossRef]
  33. Girault, A.A.; Sanders, G.E. The chalcidoid parasites of the common house or typhoid fly (|Musca domestica| Linn.) and its allies. ii. Reconstruction of the genus |Pachycrepoideus| Ashmead of the family Pteromalidae. Psyche 1910, 17, 108–117. [Google Scholar] [CrossRef]
  34. Legner, E.F. Some Effects of the Ambient Arthropod Complex on the Density and Potential Parasitization of Muscoid Diptera in Poultry Wastes. J. Econ. Entomol. 1971, 64, 1406–1417. [Google Scholar] [CrossRef]
  35. Noyes, J.S. Universal Chalcidoidea Database. World Wide Web Electronic Publication. Available online: http://www.nhm.ac.uk/our-science/data/chalcidoids/familyindex.html (accessed on 9 December 2021).
  36. Zhou, C.Q.; Zhan, H.X.; Xiao, C.; Zhang, J.P. The development, fecundity, and functional response of Pachycrepoideus vindemmiae on the pupae of Drosophila melanogaster. J. Environ. Entomol. 2019, 41, 599–604. [Google Scholar]
  37. Museum, N.H. Available online: https://www.nhm.ac.uk/our-science/data/chalcidoids/pteromalidae1.html (accessed on 24 January 2022).
  38. Shahjahan, R.M.; Hughes, K.J.; Leopold, R.A.; DeVault, J.D. Lower incubation temperature increases yield of insect genomic DNA isolated by the CTAB method. BioTechniques 1995, 19, 332–334. [Google Scholar] [PubMed]
  39. Wang, J.X.; Liu, J.; Miao, Y.H.; Huang, D.W.; Xiao, J.H. Tracking the Distribution and Burst of Nuclear Mitochondrial DNA Sequences (NUMTs) in Fig Wasp Genomes. Insects 2020, 11, 680. [Google Scholar] [CrossRef]
  40. Zhao, D.; Xin, Z.Z.; Hou, H.X.; Zhou, Y.; Wang, J.X.; Xiao, J.H.; Huang, D.W. Inferring the Phylogenetic Positions of Two Fig Wasp Subfamilies of Epichrysomallinae and Sycophaginae Using Transcriptomes and Mitochondrial Data. Life 2021, 11, 40. [Google Scholar] [CrossRef]
  41. Babraham Institute. Available online: http://www.bioinformatics.babraham.ac.uk/projects/ (accessed on 10 February 2020).
  42. Schubert, M.; Lindgreen, S.; Orlando, L. AdapterRemoval v2: Rapid adapter trimming, identification, and read merging. BMC Res. Notes 2016, 9, 88. [Google Scholar] [CrossRef] [Green Version]
  43. Kearse, M.; Moir, R.; Wilson, A.; Stones, H.S.; Cheung, M.; Sturrock, S.; Buxton, S.; Cooper, A.; Markowitz, S.; Duran, C.; et al. Geneious Basic: An integrated and extendable desktop software platform for the organization and analysis of sequence data. Bioinformatics 2012, 28, 1647–1649. [Google Scholar] [CrossRef] [Green Version]
  44. Lin, Z.J.; Wang, X.; Wang, J.; Tan, Y.; Tang, X.; Werren, J.H.; Zhang, D.; Wang, X. Comparative analysis reveals the expansion of mitochondrial DNA control region containing unusually high G-C tandem repeat arrays in Nasonia vitripennis. Int. J. Biol. Macromol. 2021, 166, 1246–1257. [Google Scholar] [CrossRef]
  45. Bernt, M.; Donath, A.; Jühling, F.; Externbrink, F.; Florentz, C.; Fritzsch, G.; Pütz, J.; Middendorf, M.; Stadler, P.F. MITOS: Improved de novo metazoan mitochondrial genome annotation. Mol. Phylogenetics Evol. 2013, 69, 313–319. [Google Scholar] [CrossRef]
  46. Lohse, M.; Drechsel, O.; Kahlau, S.; Bock, R. OrganellarGenomeDRAW—A suite of tools for generating physical maps of plastid and mitochondrial genomes and visualizing expression data sets. Nucleic Acids Res. 2013, 41, W575–W581. [Google Scholar] [CrossRef] [PubMed]
  47. Kumar, S.; Stecher, G.; Li, M.; Knyaz, C.; Tamura, K. MEGA X: Molecular Evolutionary Genetics Analysis across Computing Platforms. Mol. Biol. Evol. 2018, 35, 1547–1549. [Google Scholar] [CrossRef] [PubMed]
  48. Librado, P.; Rozas, J. DnaSP v5: A software for comprehensive analysis of DNA polymorphism data. Bioinformatics 2009, 25, 1451–1452. [Google Scholar] [CrossRef] [Green Version]
  49. Ma, Y.; Zheng, B.Y.; Zhu, J.C.; Tang, P.; Chen, X.X. The mitochondrial genome of Aenasius arizonensis (Hymenoptera: Encyrtidae) with novel gene order. Mitochondrial DNA Part B 2019, 4, 2023–2024. [Google Scholar] [CrossRef] [Green Version]
  50. Perna, N.T.; Kocher, T.D. Patterns of nucleotide composition at fourfold degenerate sites of animal mitochondrial genomes. J. Mol. Evol. 1995, 41, 353–358. [Google Scholar] [CrossRef]
  51. Katoh, K.; Standley, D.M. A simple method to control over-alignment in the MAFFT multiple sequence alignment program. Bioinformatics 2016, 32, 1933–1942. [Google Scholar] [CrossRef] [Green Version]
  52. Trifinopoulos, J.; Nguyen, L.T.; von Haeseler, A.; Minh, B.Q. W-IQ-TREE: A fast online phylogenetic tool for maximum likelihood analysis. Nucleic Acids Res. 2016, 44, W232–W235. [Google Scholar] [CrossRef] [Green Version]
  53. Minh, B.Q.; Nguyen, M.A.T.; Haeseler, A.V. Ultrafast approximation for phylogenetic bootstrap. Mol. Biol. Evol. 2013, 30, 1188–1195. [Google Scholar] [CrossRef] [Green Version]
  54. Guindon, S.; Dufayard, J.F.; Lefort, V.; Anisimova, M.; Hordijk, W.; Gascuel, O. New algorithms and methods to estimate maximum-likelihood phylogenies: Assessing the performance of PhyML 3.0. Syst. Biol. 2010, 59, 307–321. [Google Scholar] [CrossRef] [PubMed] [Green Version]
  55. Lartillot, N.; Rodrigue, N.; Stubbs, D.; Richer, J. PhyloBayes MPI: Phylogenetic reconstruction with infinite mixtures of profiles in a parallel environment. Syst. Biol. 2013, 62, 611–615. [Google Scholar] [CrossRef] [PubMed] [Green Version]
  56. Rambaut, A. FigTree v1.3.1. Available online: http://tree.bio.ed.ac.uk/software/figtree (accessed on 10 February 2018).
  57. Polme, S.; Bahram, M.; Yamanaka, T.; Nara, K.; Dai, Y.C.; Grebenc, T.; Kraigher, H.; Toivonen, M.; Wang, P.H.; Matsuda, Y.; et al. Biogeography of ectomycorrhizal fungi associated with alders (Alnus spp.) in relation to biotic and abiotic variables at the global scale. New Phytol. 2013, 198, 1239–1249. [Google Scholar] [CrossRef] [Green Version]
  58. Liu, W.; Xie, Y.; Ma, J.; Luo, X.; Nie, P.; Zuo, Z.; Lahrmann, U.; Zhao, Q.; Zheng, Y.; Zhao, Y.; et al. IBS: An illustrator for the presentation and visualization of biological sequences. Bioinformatics 2015, 31, 3359–3361. [Google Scholar] [CrossRef] [PubMed] [Green Version]
  59. Chen, C.; Chen, H.; Zhang, Y.; Thomas, H.R.; Frank, M.H.; He, Y.; Xia, R. TBtools: An Integrative Toolkit Developed for Interactive Analyses of Big Biological Data. Mol. Plant 2020, 13, 1194–1202. [Google Scholar] [CrossRef] [PubMed]
  60. Crozier, R.H.; Crozier, Y.C. The mitochondrial genome of the honeybee Apis mellifera: Complete sequence and genome organization. Genetics 1993, 133, 97–117. [Google Scholar] [CrossRef] [PubMed]
  61. Cameron, S.L.; Dowton, M.; Castro, L.R.; Ruberu, K.; Whiting, M.F.; Austin, A.D.; Diement, K.; Stevens, J. Mitochondrial genome organization and phylogeny of two vespid wasps. Genome 2008, 51, 800–808. [Google Scholar] [CrossRef] [PubMed]
  62. Mao, M.; Dowto, M. Complete mitochondrial genomes of Ceratobaeus sp. and Idris sp. (Hymenoptera: Scelionidae): Shared gene rearrangements as potential phylogenetic markers at the tribal level. Mol. Biol. Rep. 2014, 41, 6419–6427. [Google Scholar] [CrossRef] [PubMed]
  63. Doublet, V.; Ubrig, E.; Alioua, A.; Bouchon, D.; Marcadé, I.; Maréchal-Drouard, L. Large gene overlaps and tRNA processing in the compact mitochondrial genome of the crustacean Armadillidium vulgare. RNA Biol. 2015, 12, 1159–1168. [Google Scholar] [CrossRef] [PubMed] [Green Version]
  64. Liu, F.F.; Li, Y.P.; Jakovlic, I.; Yuan, X.Q. Tandem duplication of two tRNA genes in the mitochondrial genome of Tagiades vajuna (Lepidoptera: Hesperiidae). Eur. J. Entomol. 2017, 114, 407–415. [Google Scholar] [CrossRef] [Green Version]
  65. Ojala, D.; Montoya, J.; Attardi, G. tRNA punctuation model of RNA processing in human mitochondria. Nature 1981, 290, 470–474. [Google Scholar] [CrossRef]
  66. Beckenbach, A.T.; Joy, J.B. Evolution of the mitochondrial genomes of gall midges (Diptera: Cecidomyiidae): Rearrangement and severe truncation of tRNA genes. Genome Biol. Evol. 2009, 1, 278–287. [Google Scholar] [CrossRef] [Green Version]
  67. Foster, P.G.; Jermiin, L.S.; Hickey, D.A. Nucleotide Composition Bias Affects Amino Acid Content in Proteins Coded by Animal Mitochondria. J. Mol. Evol. 1997, 44, 282–288. [Google Scholar] [CrossRef] [Green Version]
  68. Burks, R.; Mitroiu, M.D.; Fusu, L.; Heraty, J.M. From hell’s heart I stab at thee! A determined approach towards a monophyletic Pteromalidae and reclassification of Chalcidoidea (Hymenoptera). J. Hymenoptrea Res. 2022, 94, 13–88. [Google Scholar] [CrossRef]
  69. Clary, D.O.; Wolstenholme, D.R. The mitochondrial DNA molecular of Drosophila yakuba: Nucleotide sequence, gene organization, and genetic code. J. Mol. Evol. 1985, 22, 252–271. [Google Scholar] [CrossRef] [PubMed]
  70. Simon, S.; Hadrys, H. A comparative analysis of complete mitochondrial genomes among Hexapoda. Mol. Phylogenetics Evol. 2013, 69, 393–403. [Google Scholar] [CrossRef] [PubMed]
  71. Shen, Z.C.; Chen, L.; Chen, L.; Li, Y.X. Information from the mitochondrial genomes of two egg parasitoids, Gonatocerus sp. and Telenomus sp., reveals a controversial phylogenetic relationship between Mymaridae and Scelionidae. Genomics 2019, 111, 1059–1065. [Google Scholar] [CrossRef] [PubMed]
  72. Zheng, B.Y.; Cao, L.J.; Tang, P.; Achterberg, K.V.; Hoffmann, A.A.; Chen, H.Y.; Chen, X.X.; Wei, S.J. Gene arrangement and sequence of mitochondrial genomes yield insights into the phylogeny and evolution of bees and sphecid wasps (Hymenoptera: Apoidea). Mol. Phylogenetics Evol. 2018, 124, 1–9. [Google Scholar] [CrossRef]
  73. Covacin, C.; Shao, R.; Cameron, S.; Barker, S.C. Extraordinary number of gene rearrangements in the mitochondrial genomes of lice (Phthiraptera: Insecta). Insect Mol. Biol. 2006, 15, 63–68. [Google Scholar] [CrossRef]
  74. Li, Q.; Wei, S.J.; Shi, M.; Chen, X.X. Complete mitochondrial genome of Neochauliodes bowringi (MacLachlan) (Megaloptera: Corydalidae). Mitochondrial DNA 2015, 26, 112–113. [Google Scholar] [CrossRef]
  75. Chen, W.J.; Bu, Y.; Carapelli, A.; Dallai, R.; Li, S.; Yin, W.Y.; Luan, Y.X. The mitochondrial genome of Sinentomon erythranum (Arthropoda: Hexapoda: Protura): An example of highly divergent evolution. BMC Evol. Biol. 2011, 11, 246. [Google Scholar] [CrossRef] [Green Version]
  76. Feng, Z.B.; Wu, Y.F.; Yang, C.; Gu, X.H.; Wilson, J.J.; Li, H.; Cai, W.Z.; Yang, H.L.; Song, F. Evolution of tRNA gene rearrangement in the mitochondrial genome of ichneumonoid wasps (Hymenoptera: Ichneumonoidea). Int. J. Biol. Macromol. 2020, 164, 540–547. [Google Scholar] [CrossRef]
  77. Song, F.; Li, H.; Liu, G.H.; Wang, W.; James, P.; Colwell, D.D.; Tran, A.; Gong, S.; Cai, W.; Shao, R. Mitochondrial Genome Fragmentation Unites the Parasitic Lice of Eutherian Mammals. Syst. Biol. 2019, 68, 430–440. [Google Scholar] [CrossRef] [PubMed] [Green Version]
  78. Cruaud, A.; Rasplus, J.Y.; Zhang, J.; Burks, R.; Delvare, G.; Fusu, L.; Gumovsky, A.; Huber, J.T.; Janšta, P.; Mitroiu, M.D.; et al. The Chalcidoidea bush of life—A massive radiation blurred by mutational saturation. bioRxiv 2022. [Google Scholar] [CrossRef]
Figure 1. Circular maps of the mitochondrial genomes of M. similadanacus, M. sinesensilla, N. vitripennis, and P. vindemmiae of Pteromalidae. Protein-coding and ribosomal genes are shown with standard abbreviations. The N strand is visualized on the outer circle and the J strand on the inner circle. (a) Circular map of the mitochondrial genome of M. similadanacus. (b) Circular map of the mitochondrial genome of M. sinesensilla. (c) Circular map of the mitochondrial genome of N. vitripennis. (d) Circular map of the mitochondrial genome of P. vindemmiae.
Animals 13 01985 g001
Figure 2. Predicted secondary cloverleaf structure for the tRNAs of M. similadanacus, M. sinesensilla, N. vitripennis, and P. vindemmiae of Pteromalidae.
Animals 13 01985 g002
Figure 3. Relative synonymous codon usage (RSCU) of protein-coding genes of M. similadanacus, M. sinesensilla, N. vitripennis, and P. vindemmiae. (a) The RSCU of protein-coding genes of M. similadanacus. (b) The RSCU of protein-coding genes of M. sinesensilla. (c) The RSCU of protein-coding genes of N. vitripennis. (d) The RSCU of protein-coding genes of P. vindemmiae.
Animals 13 01985 g003
Figure 4. Evolutionary rates of mitochondrial genomes of Pteromalidae. The numbers of nonsynonymous substitutions per nonsynonymous site (Ka), the number of synonymous substitutions per synonymous site (Ks), and the ratio of Ka/Ks for every mitochondrial genome are given, using that of Pachyneuron aphidis as a reference sequence. (a) The Ka/Ks of M. similadanacus. (b) The Ka/Ks of M. sinesensilla. (c) The Ka/Ks of N. vitripennis. (d) The Ka/Ks of P. vindemmiae.
Animals 13 01985 g004
Figure 5. ML and BI phylogenetic trees based on the nucleotide sequence data of PCG12 and amino acid sequence data of AA: (a) represents the BI tree; Bayesian posterior probabilities (PP) are indicated on the branch, with values of AA at the left side and PCG12 at the right side; (b) represents the ML tree; ultrafast bootstrap (UFB) is indicated on the branch, with values of AA at the left side and PCG12 at the right side [68].
Animals 13 01985 g005
Figure 6. Left side is the ancestral state reconstruction based on the BI tree. Red pies represent primary parasitoids, half-green and half-red pies represent primary parasitoids and hyperparasitoids, and white pies represent undefined biology. Gene orders were arranged on the right side of pteromalids. Different gene rearrangements are highlighted in different colors. The heat map of the pairwise breakpoint distance of Pteromalidae is on the right side.
Animals 13 01985 g006
Table 1. List of species investigated and their related information.
No.FamilySubfamilyTribeTaxaGenBank Accession No.Location/Reference
1Eupelmidae Eupelmus sp.MG923493[27]
2Torymidae Torymus sp.MG923516[27]
3PteromalidaePachyneurinae Pachycrepoideus vindemmiaeMT712142This study, Anhui
4 Pachyneuron aphidisMK577639[16]
5 PteromalinaePteromaliniAnisopteromalus calandraeMW817149Unpublished
6 Muscidifurax sinesensillaMT712140This study, Xinjiang
7 Muscidifurax similadanacusMT712139This study, Xinjiang
8 Nasonia giraultiEU746611, EU746614[26]
9 Nasonia longicornisEU746612, EU746616[26]
10 Nasonia vitripennisEU746609, EU746613[26]
11 Nasonia vitripennisMT712141This study, Shandong
12 Pteromalus puparumMH051556Unpublished
13 Pteromalus puparumNC039656Unpublished
14 Pteromalus puparumMG923513[27]
15 OtiteselliniApocrypta bakeriMT906648[39]
16 Micranisa raliangaMW167115[40]
17 Philotrypesis tridentataMT947602[39]
18 Philotrypesis pilosaJF808723[14]
19 Philotrypesis sp.JF808722[14]
20 Walkerella microcarpaeMW167116[40]
21 Sycophaginae Sycophaga agraensisMT947599[39]
22 Sycophaga mayriMW167114[40]
Table 2. Mitogenomic organization of M. similadanacus, M. sinesensilla, and N. vitripennis.
PositionSize (bp)Intergenic NucleotidesCodonStrand
FromTo StartStop
M. similadanacus/M. sinesensilla/N. vitripennis
trnI1/1/169/68/7069/68/70 +/+/+
nad289/87/921096/1094/11021008/1008/101119/18/21ATT/ATT/ATATAA/TAA/TAA−/−/−
trnW1095/1101/11051161/1167/117167/67/67−2/6/2 −/−/−
trnY1160/1166/11701226/1230/123767/65/68−2/−2/−2 +/+/+
trnS11233/1240/12401295/1302/129963/63/606/9/2 +/+/+
trnN1299/1324/13021366/1391/136868/68/673/21/2 −/−/−
trnR1362/1393/13751430/1463/144569/71/71−5/1/6 +/+/+
trnC1433/1475/14481496/1537/151464/63/672/11/2 +/+/+
nad31500/1537/15141850/1887/1864351/351/3513/−1/−1ATT/ATT/ATATAA/TAA/TAA+/+/+
trnG1851/1888/18651916/1954/193266/67/68 +/+/+
cox31917/1960/19352702/2745/2720786/786/786−/5/2ATG/ATG/ATGTAA/TAA/TAA+/+/+
atp62702/2745/27233376/3419/3397675/675/675−1/−1/2ATG/ATG/ATGTAA/TAA/TAA+/+/+
atp83367/3410/33913528/3571/3549162/162/159−10/−10/−7ATT/ATT/ATATAA/TAA/TAA+/+/+
trnD3529/3572/35513597/3636/361569/65/65−/−/1 +/+/+
trnK3601/3652/36193669/3722/369269/71/743/15/3 −/−/−
cox23670/3726/36964344/4400/4364675/675/669−/3/3ATT/ATT/ATTTAA/TAA/TAA+/+/+
trnL24345/4401/43654410/4468/443266/68/68 +/+/+
cox14413/4471/44335942/6000/59631530/1530/15312/2/−ATG/ATG/ATGTAA/TAA/T+/+/+
trnE5945/6003/59646010/6067/603366/65/702/2/− −/−/−
trnF6009/6072/60456072/6136/610964/65/65−2/4/11 +/+/+
nad56073/6137/61097741/7808/77941669/1672/1686−/−/−1ATT/ATT/ATTT/T/TAG+/+/+
trnH7750/7812/77957818/7877/785969/66/658/3/− +/+/+
nad47819/7879/78609159/9219/91981341/1341/1339−/1/−ATG/ATG/ATGTAA/TAA/T+/+/+
nad4l9153/9213/91929440/9500/9479288/288/288−7/−7/−7ATT/ATT/ATTTAA/TAA/TAA+/+/+
trnT9441/9501/94799504/9564/954364/64/65−/−/−1 −/−/−
trnP9507/9565/95449575/9629/960869/65/652/−/− +/+/+
nad69581/9633/961710126/10184/10165546/552/5495/3/8ATG/ATG/ATGTAA/TAA/TAA−/−/−
cytb10126/10185/1016711271/11330/113061146/1146/1140−1/−/1ATG/ATG/ATGTAA/TAA/TAA−/−/−
trnS211271/11329/1130511339/11396/1137169/68/67−1/−2/−2 −/−/−
trnQ11341/11409/1139811408/11480/1146868/72/711/12/26 +/+/+
nad111409/11484/1146912338/12405/12401930/922/933−/3/−ATT/ATT/TTGTAA/T/TAA+/+/+
trnL112339/12406/1240212404/12472/1246866/67/67 +/+/+
rrnL12405/12473/1246913717/13780/137931313/1308/1325 +/+/+
trnA13718/13781/1379413782/13845/1385765/65/64 +/+/+
rrnS13783/13846/1385814558/14625/14644776/780/787 +/+/+
trnV14559/14626/1464514623/14691/1471265/66/68 +/+/+
trnM14626/14694/1471614690/14758/1478765/65/722/2/3 +/+/+
AT-rich14691/14759/1478815080/15020/14791390/262/4 -/-/-
Table 3. Mitogenomic organization of P. vindemmiae.
PositionSize (bp)Intergenic NucleotidesCodonStrand
FromTo StartStop
P. vindemmiae
trnR15959
trnI63131693 +
nad21671168100235ATTTAA
trnW11721241703
trnY1240130566−2 +
trnS113071366601 +
trnN13701438693 +
trnC14401504651 +
nad315051853349 ATTT+
trnG1854191865 +
cox319192704786 ATGTAA+
atp627043378675−1ATGTAA+
atp833723530159−7ATTTAA+
trnD354436086513 +
trnK36183689729
cox2369143596691ATTTAA+
trnL24360442566 +
cox1442659591534 ATGT+
trnF5958602063−2
trnE6021608565 +
nad5608677571672 ATTT+
trnH77607823642 +
nad4782491561333 ATGT+
nad4l91509437288−7ATTTAA+
trnT9437950670−1
trnP95149577647 +
nad6958110,1475673ATGTAA
cytb10,14711,2831137−1ATGTAA
trnS211,28211,34867−2
trnQ11,36411,4185515 +
nad111,42012,3409211ATTTAA+
trnL112,34112,40565 +
rrnL12,40613,7051300 +
trnA13,70613,77065 +
rrnS13,77114,533763 +
trnV14,53414,60067 +
trnM14,60114,66767 +
AT-rich14,66814,850183 -
Table 4. Nucleotide composition and skewness of mitogenomes.
RegionsSpeciesSize (bp)T%C%A%G%AT (%)GC (%)AT SkewGC Skew
Full genomeM. similadanacus1508041.09.042.57.583.516.50.018−0.091
M. sinesensilla1502040.78.843.47.184.115.90.032−0.107
N. vitripennis1479139.69.443.57.583.017.00.047−0.112
P. vindemmiae1485041.18.244.26.685.314.70.036−0.108
PCGsM. similadanacus1110739.79.342.58.482.317.70.034−0.051
M. sinesensilla1110839.79.143.28.182.817.20.042−0.058
N. vitripennis1111738.69.943.18.481.718.30.055−0.082
P. vindemmiae1109240.08.644.27.384.215.80.050−0.082
tRNAsM. similadanacus146744.06.544.15.388.111.90.001−0.102
M. sinesensilla146443.76.644.94.888.611.40.014−0.158
N. vitripennis148442.27.744.95.287.112.90.031−0.194
P. vindemmiae143844.76.744.24.488.911.1−0.006−0.207
rRNAsM. similadanacus208945.47.642.24.887.612.4−0.037−0.226
M. sinesensilla208844.38.143.44.287.712.3−0.010−0.317
N. vitripennis211243.18.043.85.086.913.10.008−0.231
P. vindemmiae206344.87.543.24.588.012.00.018−0.250
Control regionM. similadanacus39042.117.736.24.178.221.8−0.075−0.624
M. sinesensilla26236.316.042.45.378.621.40.076−0.502
N. vitripennis450.00.050.00.0100.00.00.0000.000
P. vindemmiae18334.48.751.94.986.313.70.203−0.279
Disclaimer/Publisher’s Note: The statements, opinions and data contained in all publications are solely those of the individual author(s) and contributor(s) and not of MDPI and/or the editor(s). MDPI and/or the editor(s) disclaim responsibility for any injury to people or property resulting from any ideas, methods, instructions or products referred to in the content.