Article

The Thyroid Hormone and Immunoglobulin Concentrations in Blood Serum and Thyroid Gland Morphology in Young Hens Fed with Different Diets, Sources, and Levels of Iodine Supply

1
Department of Animal Nutrition and Feed Science, Wrocław University of Environmental and Life Sciences, 50-375 Wrocław, Poland
2
Department of Biostructure and Animal Physiology, Wrocław University of Environmental and Life Sciences, 50-375 Wrocław, Poland
*
Author to whom correspondence should be addressed.
Animals 2023, 13(1), 158; https://doi.org/10.3390/ani13010158
Submission received: 30 September 2022 / Revised: 11 November 2022 / Accepted: 15 November 2022 / Published: 31 December 2022
(This article belongs to the Special Issue Role of Trace Element in Animal Health and Metabolic)

Abstract

:

Simple Summary

Bioactive micronutrients, such as iodine, regulate many key metabolic pathways in the body. Iodine is responsible, above all, for proper functioning of the thyroid gland and the hormones it secretes, which, in turn, determine the correct course of many processes. There is a close relationship between the level and source of iodine in the diets of animals and the activity of the thyroid gland. In addition, attention should also be paid to the presence in the diet of compounds that can decrease iodine utilization, such as the goitrogenic substances present in some feed materials. The examined effects of various sources and levels of iodine, as well as the presence of rapeseed meal in laying hen diets, indicated that the applied iodine sources and levels had no influence on thyroid hormone and immunoglobulin concentrations. However, iodine presence in the rapeseed meal diet and higher iodine concentrations can increase free triiodothyronine concentrations in blood serum. The level and source of iodine had an effect on the follicular diameter and height of the follicular epithelium cells.

Abstract

The aim of this study was to examine the influence of the level (1, 3, and 5 mg I/kg) and source of iodine (KI, Ca(IO3)2, and KIO3) on thyroid hormone and immunoglobulin concentrations in the blood serum of laying hens alongside a histological picture of the thyroid. In the first, birds were fed grain–soybean meal mixtures, and in the second, two kinds of diets based on corn–soybean or corn–soybean–rapeseed meal were applied. In the experiments, we determined the levels of the blood serum thyroid hormones fT3 and fT4, as well as the morphological structure of the thyroid gland. In the second experiment, the concentration of immunoglobulins in blood serum was assayed. In both experiments, no influence of iodine source on thyroid hormone concentration was observed. However, increasing the iodine level in the full mixture and adding rapeseed meal in both experiments caused an increase in fT3 concentration. Increasing I-addition in both experiments led to a decrease in thyroid gland follicle diameter. Rapeseed meal inclusion (at a level of 10%) to the complete hen mixture led to an increase in thyroid gland follicle diameter. Applying KIO3 as an iodine source in both experiments caused a decrease in the thyroid gland height of follicle epithelial cells. Immunoglobulin concentrations in the serum were not affected by experimental factors. The results suggest that the methodologies of studies on the bioavailability of minerals and the corresponding analytical methods require unification. The lack of such standardization makes it impossible to engage in a satisfactory discussion of the results and exchange experiences.

1. Introduction

The thyroid gland has multiple functions and activities, and the dynamics of triiodothyronine (T3) and thyroxine (T4) creation depend on the supply of proper amounts of essential iodine in feeds. Iodine-containing hormones are involved in the growth and development of organisms and are important for the productivity of animals. Avian thyroglobulins are highly iodized molecules (1.5% of I) and can contain about 50–90 atoms of iodine [1]. The majority of thyroid hormones are secreted as T4 but can be reverted back into reversible T3 (rT3) via deiodination [2]. The T3 hormone was observed to be more metabolically active than T4 [3,4]. However, Shellabarger [3] confirmed that in birds, T3 and T4 are similarly effective. There is a close relationship between iodine levels in a diet and thyroid gland activity, which, in turn, regulates essential metabolic processes in the organism, especially brain function; heat production; thermoregulation; energy and lipid metabolism, including cholesterol, cellular oxidation processes, and protein synthesis; and cell and tissue maturity [5,6,7,8,9,10,11]. Moreover, numerous investigations found significant impacts of the thyroid on blood circulation, nervous system functions, reproduction, and skin regeneration [12,13,14]. Thyroid gland iodine-dependent hormones are responsible for metabolic processes that play an important role in immunoresponse [1,15,16]. The content of iodine in diet and its binding with thyrosine regulates the complex conversion of different thyronine forms and thyroxine [17,18,19]. The biosynthesis of thyroid hormones in an organism encounter the binding of iodine mainly through potassium iodine and the accumulation of I during the iodinization of tyrosine and the formation of triiodothyronine (T3) and thyroxine (T4). Large doses of iodine and their application in an organic form inhibit the conversion of thyroxine (T4) and can evoke a transmitted secretion of T4 from hepatocytes into blood serum [2,17,20]. The concentration of T3 in serum also depends on dietary carbohydrate levels [21] and other factors. A high content of carbohydrates in the diet is connected with an increased concentration of serum T3. The most important proteins for the creation of a matrix for thyroid hormone biosynthesis are thyreoglobulins [22]. The mechanisms of iodine management in the organism and thyroid gland are very complex. The turnover time of iodinated proteins synthetized continually in the thyroid is strictly connected with I-supply. A deficiency in I-supply leads to increased iodination of slowly metabolized unusual proteins, which can be used in the recycling process in the organism [13].
The supplementation of an animal’s diet with iodine is a common practice. Iodine in poultry is used mainly in the form of inorganic salts such as potassium iodide (KI), potassium iodate (KIO3), and calcium iodate (Ca(IO3)2), which are added into the mineral mixtures or premixes [23,24,25]. Numerous studies have shown that the bioavailability of iodine from these chemical forms can vary [25,26,27,28,29], which should also be taken into account when establishing recommended levels of iodine for the nutrition of farm animals, including poultry. According to Polish recommendations for laying hens, iodine levels in the complete mixture should be 1 mg per 1 kg [30]. According to EU Commission regulations [31], the upper tolerated level of dietary I recommended for laying hens is 5 mg/kg. Goitrogenic substances, an iodine transfer antagonist, present in feeds originating from the Cruciferae family, can act similarly to thiouracil inhibitors of triiodothyronine (T3) synthesis in thyroid tissue and may reduce the profitable activities of iodine supply in the diet [32,33,34]. Moreover, a long-term excess of iodine in rations (200–500 mg I/kg) can produce dangerous toxicosis in organisms and disorders in the conversion of triiodothyronine to thyroxin [9,17,18,19]. Taking the above into consideration when using iodine additives, particular attention should be paid to the form, level, and presence of antagonistic substances in the diets of animals because these factors may have an effect on the animals’ iodine supply.
Under this background, the aim of the present study was to examine the effects of various sources and levels of iodine, as well as the presence of rapeseed meal, in laying hen diets on thyroid hormones and immunoglobulin concentrations. We also present a thyroid histological picture. This paper presents data derived from two individual experiments that were conducted with the same line of lying hens under similar environmental conditions.

2. Materials and Methods

2.1. Animals and Management

Experiment I (Exp. I) was carried out in the winter–spring and early summer periods, while experiment two (Exp. II) was carried out in the summer–autumn period. The first experiment lasted 180 days, and the second lasted 150 days. In both experiments, sixteen-week-old Hy-Line variety brown pullets were placed into battery cages and, before the laying period, were fed with a standard mixture containing about 145 g/kg of crude protein and 11.5 MJ of metabolizable energy. After attaining about a 30% laying rate, at the age of about 18 weeks, the 216 hens were allocated into cages according to body weight and laying rate at the starting time. In Exp. I, the cages were randomly divided into six treatments, each involving twelve replications, with thirty-six hens per treatment. In Exp. II, the cages were randomly divided into twelve treatments, each involving six replications with three hens per cage, for a total eighteen hens per treatment (Table 1).
In both experiments, free access to water (nipples) was ensured, and the environmental conditions were registered. The room temperature varied between 16 and 25 °C, and the lighting program was set up for fourteen hours of light daily. Management was performed in compliance with European Union regulations, and The Local Ethics Commission for Experiments with Animals accepted all experimental procedures. The experiments were carried out in an experimental henhouse belonging to the Wrocław University of Life Sciences in Pruszowice.

2.2. Diets and Feeding Program

The diet composition in both experiments was based on our own chemical analyses of feed components and calculated using linear optimization. The energy concentration was calculated using the values given in European Tables [35]. In the first experiment, hens received diets based on maize, barley, and wheat with soybean meal. To the basal diet, we added 1 or 5 mg/kg iodine in the form of KI, Ca(IO3)2, or KIO3 (Table 2).
In the second experiment, two kind of diets were applied: one based on corn–soybean (CS) and the second based on corn–soybean–rapeseed meal (CSR). Each diet was enriched with iodine using either KI or KIO3 in amounts appropriate to the anticipated iodine supplement at levels of 1, 3, and 5 mg of I/kg of feed (Table 2). Experimental concentrate mixtures in each experiment were isoproteic and isoenergetic and were prepared prior to the experiment. A homogenous mixture of iodine within the feeds was obtained by preparing premixtures of iodine supplements with iodine-free mineral–vitamin premixes that were made for the purposes of the experiments.

2.3. Analytical Methods in Feed Mixtures

The chemical composition of the feed components and complete mixtures were determined according to standard methods [36]. The nitrogen content was determined using a Kjeltec 2300 Foss Tecator apparatus (Höganäs, Sweden), and crude protein was calculated by multiplying the nitrogen content by 6.25 (AOAC, Rockville, Maryland, 984.13). Crude fiber was assayed via the Henneberg–Stohmann method using an Fibertec Tecator (Höganäs, Sweden) apparatus (AOAC, 978.10). After prior wet mineralization of the samples with nitric acid (HNO3) using a MarsX apparatus (CEM Corporation, Matthews, NC, USA), calcium and sodium content in the feeds was determined through atomic absorption spectrophotometry using an AA 240 FS apparatus with SIPS 20 (Varian, Mulgrave, Australia, AOAC, 968.08). Phosphorus content was analyzed after previous wet mineralization with nitric acid (HNO3) and perchloric acid (HClO4) according to the ammonium vanadomolybdate method using a Specol 11 spectrophotometer (Carl Zeiss, Jena, Germany) at a wave length of 470 nm (AOAC, 965.17).
To determine the amino acid composition, samples of feeds were hydrolyzed with 6 M hydrochloric acid (HCl) for 24 h at 110 °C. Then, amino acids were separated according to the Moore and Stein method [37]. To determine sulfur amino acids, the feed samples were oxidized (0 °C, 16 h) with formic acid and hydrogen peroxide (9:1/v:v) prior to HCl hydrolysis and then separated using an AAA 400 Ingos Analyzer (Prague, Czech Republic). The iodine content in diets was analyzed using a spectrophotometric method based on the Sandell–Kolthoff reaction [38] on the basis of the speed of reaction: 2 Ce4+ + As3+ → 2 Ce3+ + As5+ [39,40]. The principle of the assessment was to reduce Ce4+ to Ce3+ in the presence of As3+, where iodide ions acts as catalyst for this reaction. The analyses were carried out at the Department of Animal Nutrition and Feed Science of Wrocław University of Environmental and Life Sciences.

2.4. Blood Collection and Analysis

At the end of the experiments (on the 180th day of Exp. I, the age of laying hens was 42 weeks, and on the 150th day of Exp. II, the age of laying hens was 38 weeks), six hens from each treatment were randomly selected for blood sampling. Blood samples (5 mL) were taken into clean sterilised tubes from the vena brachialis by a specialized veterinarian. The serum was obtained via centrifugation of the blood at 1500× g for 15 min at room temperature and stored at 20 °C until analysis. The concentration of immunoglobulins (Ig) in the blood serum was determined via ELISA kits f. Bethyl Laboratories, Inc. The absorption of light across the solution—effects of a colorimetric reaction with the chromogenic substrate TMB (3, 3′, 5, 5′ tetramytylobenzidyne)—was measured using a Thermo Scientific Multiskan EX. The content of thyroid hormones free triiodothyronine (fT3) and free thyroxine (fT4) in the blood serum was determined using a chemiluminescence immunoassay (CLIA) with an Immulite 1000 apparatus and chemotest f. Siemens. Biochemical assays were then performed in an accredited analytical laboratory.

2.5. Histological Examinations

At the end of each experiment, six hens from each treatment were chosen. After killing the hens via cervical dislocation, the thyroid glands were immediately removed. The thyroid glands were stabilized and fixed in 4% aqueous buffered formalin solution with calcium carbonate in a ratio of 9:1 (v/v) for 72 h. Then, the thyroid samples were rinsed for 24 h under running water, dehydrated with an increased alcohol series, and embedded in paraffin. This biological material was cut with a microtome into 7 µm thick slides and stained with hematoxylin according to Delafield’s method, as well as with eosin using the A2A-NOVUM method according to Geidies [41]. The histological preparations were examined using an optical microscope Nicon Eclipse 801 in transmitted light. For each sample, about 15–20 pictures were reviewed. The microphotographs were obtained using a Canon PS66 Camera. Morphometric measurements were made using the Nis-elements AR software, and the follicle diameter and height of the epithelial cells of follicles were examined. The assays were carried out at the Department of Biostructure and Animal Physiology of Wrocław University of Environmental and Life Sciences.

2.6. Statistical Evaluation of Results

All numerical data were evaluated using one, two, or three factorial ANOVA in the Statistica® version 10 computer software [42]. The differences between treatments and experimental factors were tested according to the following statistical models:
yij = µ + αi + eij (for differences between treatments)
yjik = µ + αi+ βj + (αβ)ij + eijk (for kind of diet or inclusion level of I-supplement or their level), or
yijkl = µ + αi+ βj +γk + (αβ)ij + (αγ)jk + (αβγ)ijk + eijkl
Where yij, yijk, and yjikl represent the variance associated with parameter α; µ is the overall mean; αi is the treatment effect; βj is the kind of diet, I-supplement, or their levels; (αβ)ij is the the interaction effect; and eij or eijk ( eijkl) is an error term.
The individual measurements were treated as experimental units, and differences between treatments and averages for experimental factors (means) were analyzed for significance (p < 0.05 or p < 0.01) using Tukey’s test. All data are presented as average values and are accompanied by the corresponding SEM (standard error of mean) values.

3. Results

3.1. Thyroid Hormone Concentration in Hen Blood Serum

In the first experiment, the concentration of total free triiodothyronine (fT3) and free thyroxine (fT4) in individual treatments was similar, with no differences between treatments. However, there was a significant (p = 0.020) influence of iodine level addition into the diet on the fT3 concentration in blood serum. A larger iodine addition caused an increase in fT3 concentration from 4.94 to 5.83 pmol/L (Table 3). The types of I-bonds, KI, Ca(IO3)2, or KIO3, did not significantly influence thyroid hormone concentration in the serum.
In the second experiment, the content of both thyroid gland hormones in the blood serum was insignificantly diversified via experimental treatments. However, a comparison of the results concerning fT3 concentration within each dietary treatment showed that increasing iodine content with the same source in the diet from 1 to 5 ppm caused an increase in fT3 concentration but a decrease in fT4 concentration. The kind of diet, iodine source, and level of iodine supplement had no influence on the fT4 concentration in hen blood serum. On the other hand, the addition of 10% rapeseed meal to the hens’ diet significantly enhanced (p = 0.006) fT3 concentration, from 8.71 in the CS diet to 11.24 in the CSR diet (mean; Table 3). Similarly, the highest dietary I-supplementation content at 5 mg/kg caused an increase in fT3 content to 11.28 pmol/L in comparison to the fT3 concentration observed in the hen blood serum after 1 or 3 mg of I-supply to the diets (a mean of 9.3 pmol/L fT3).

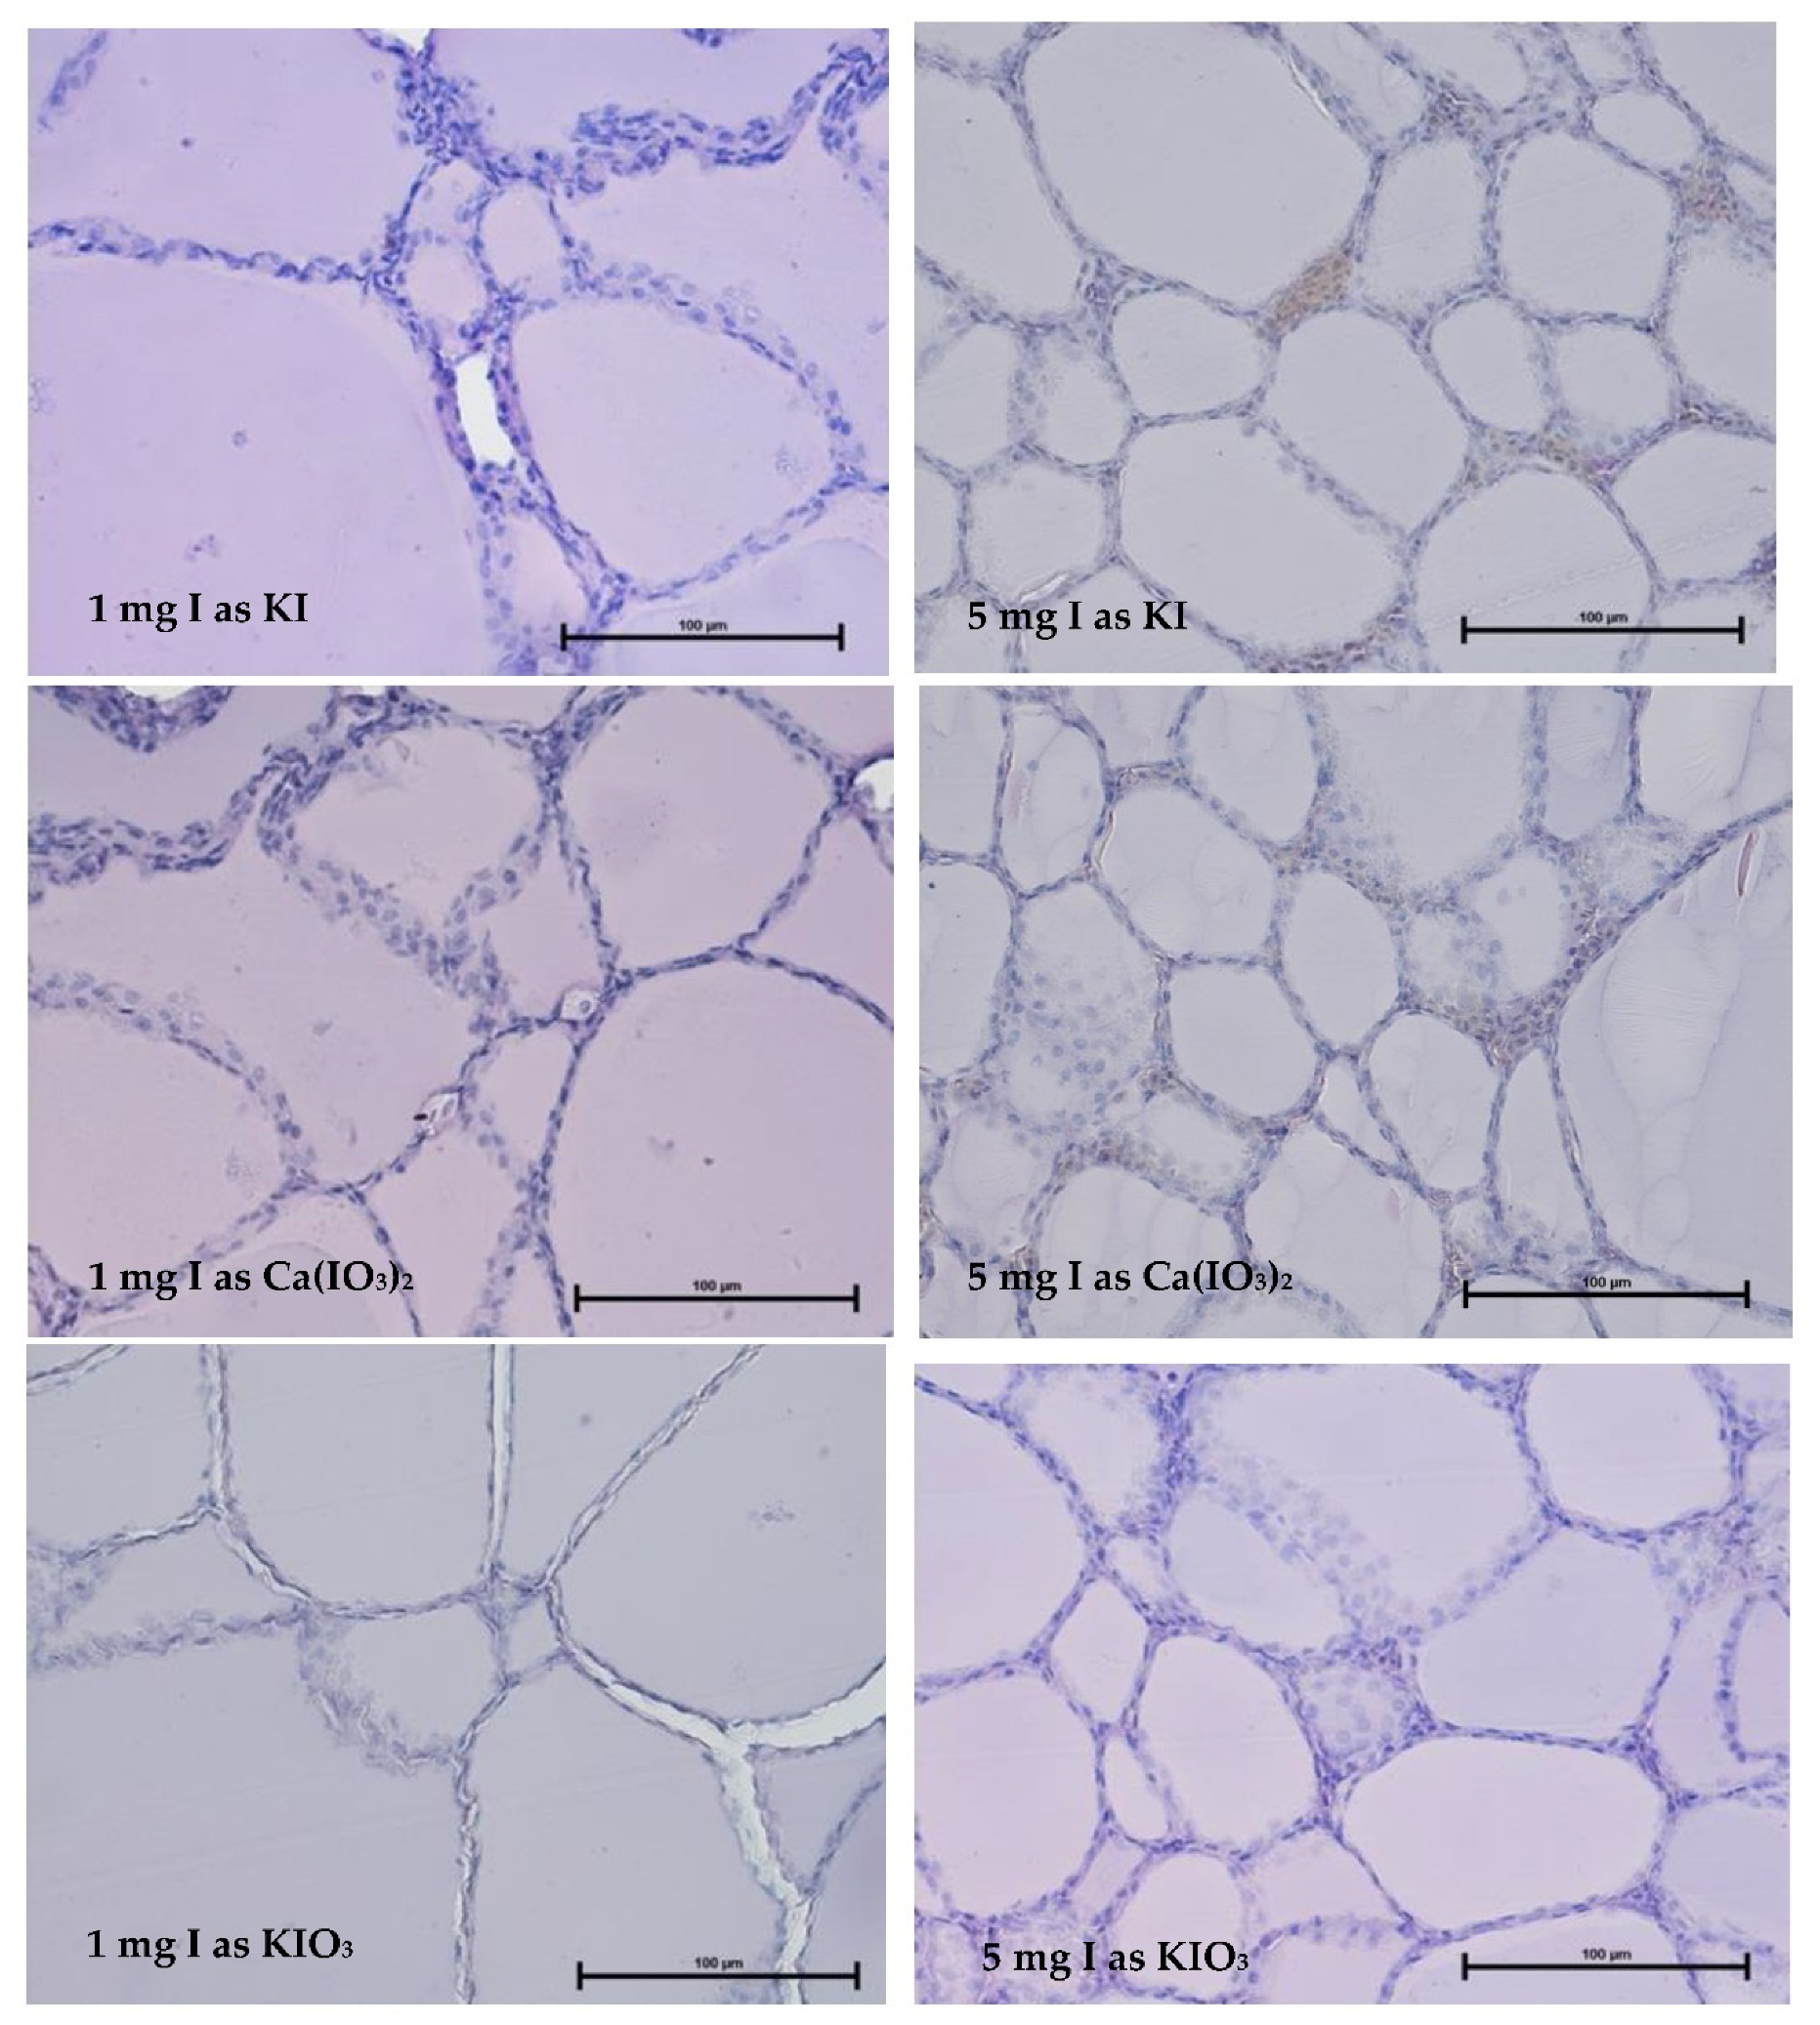
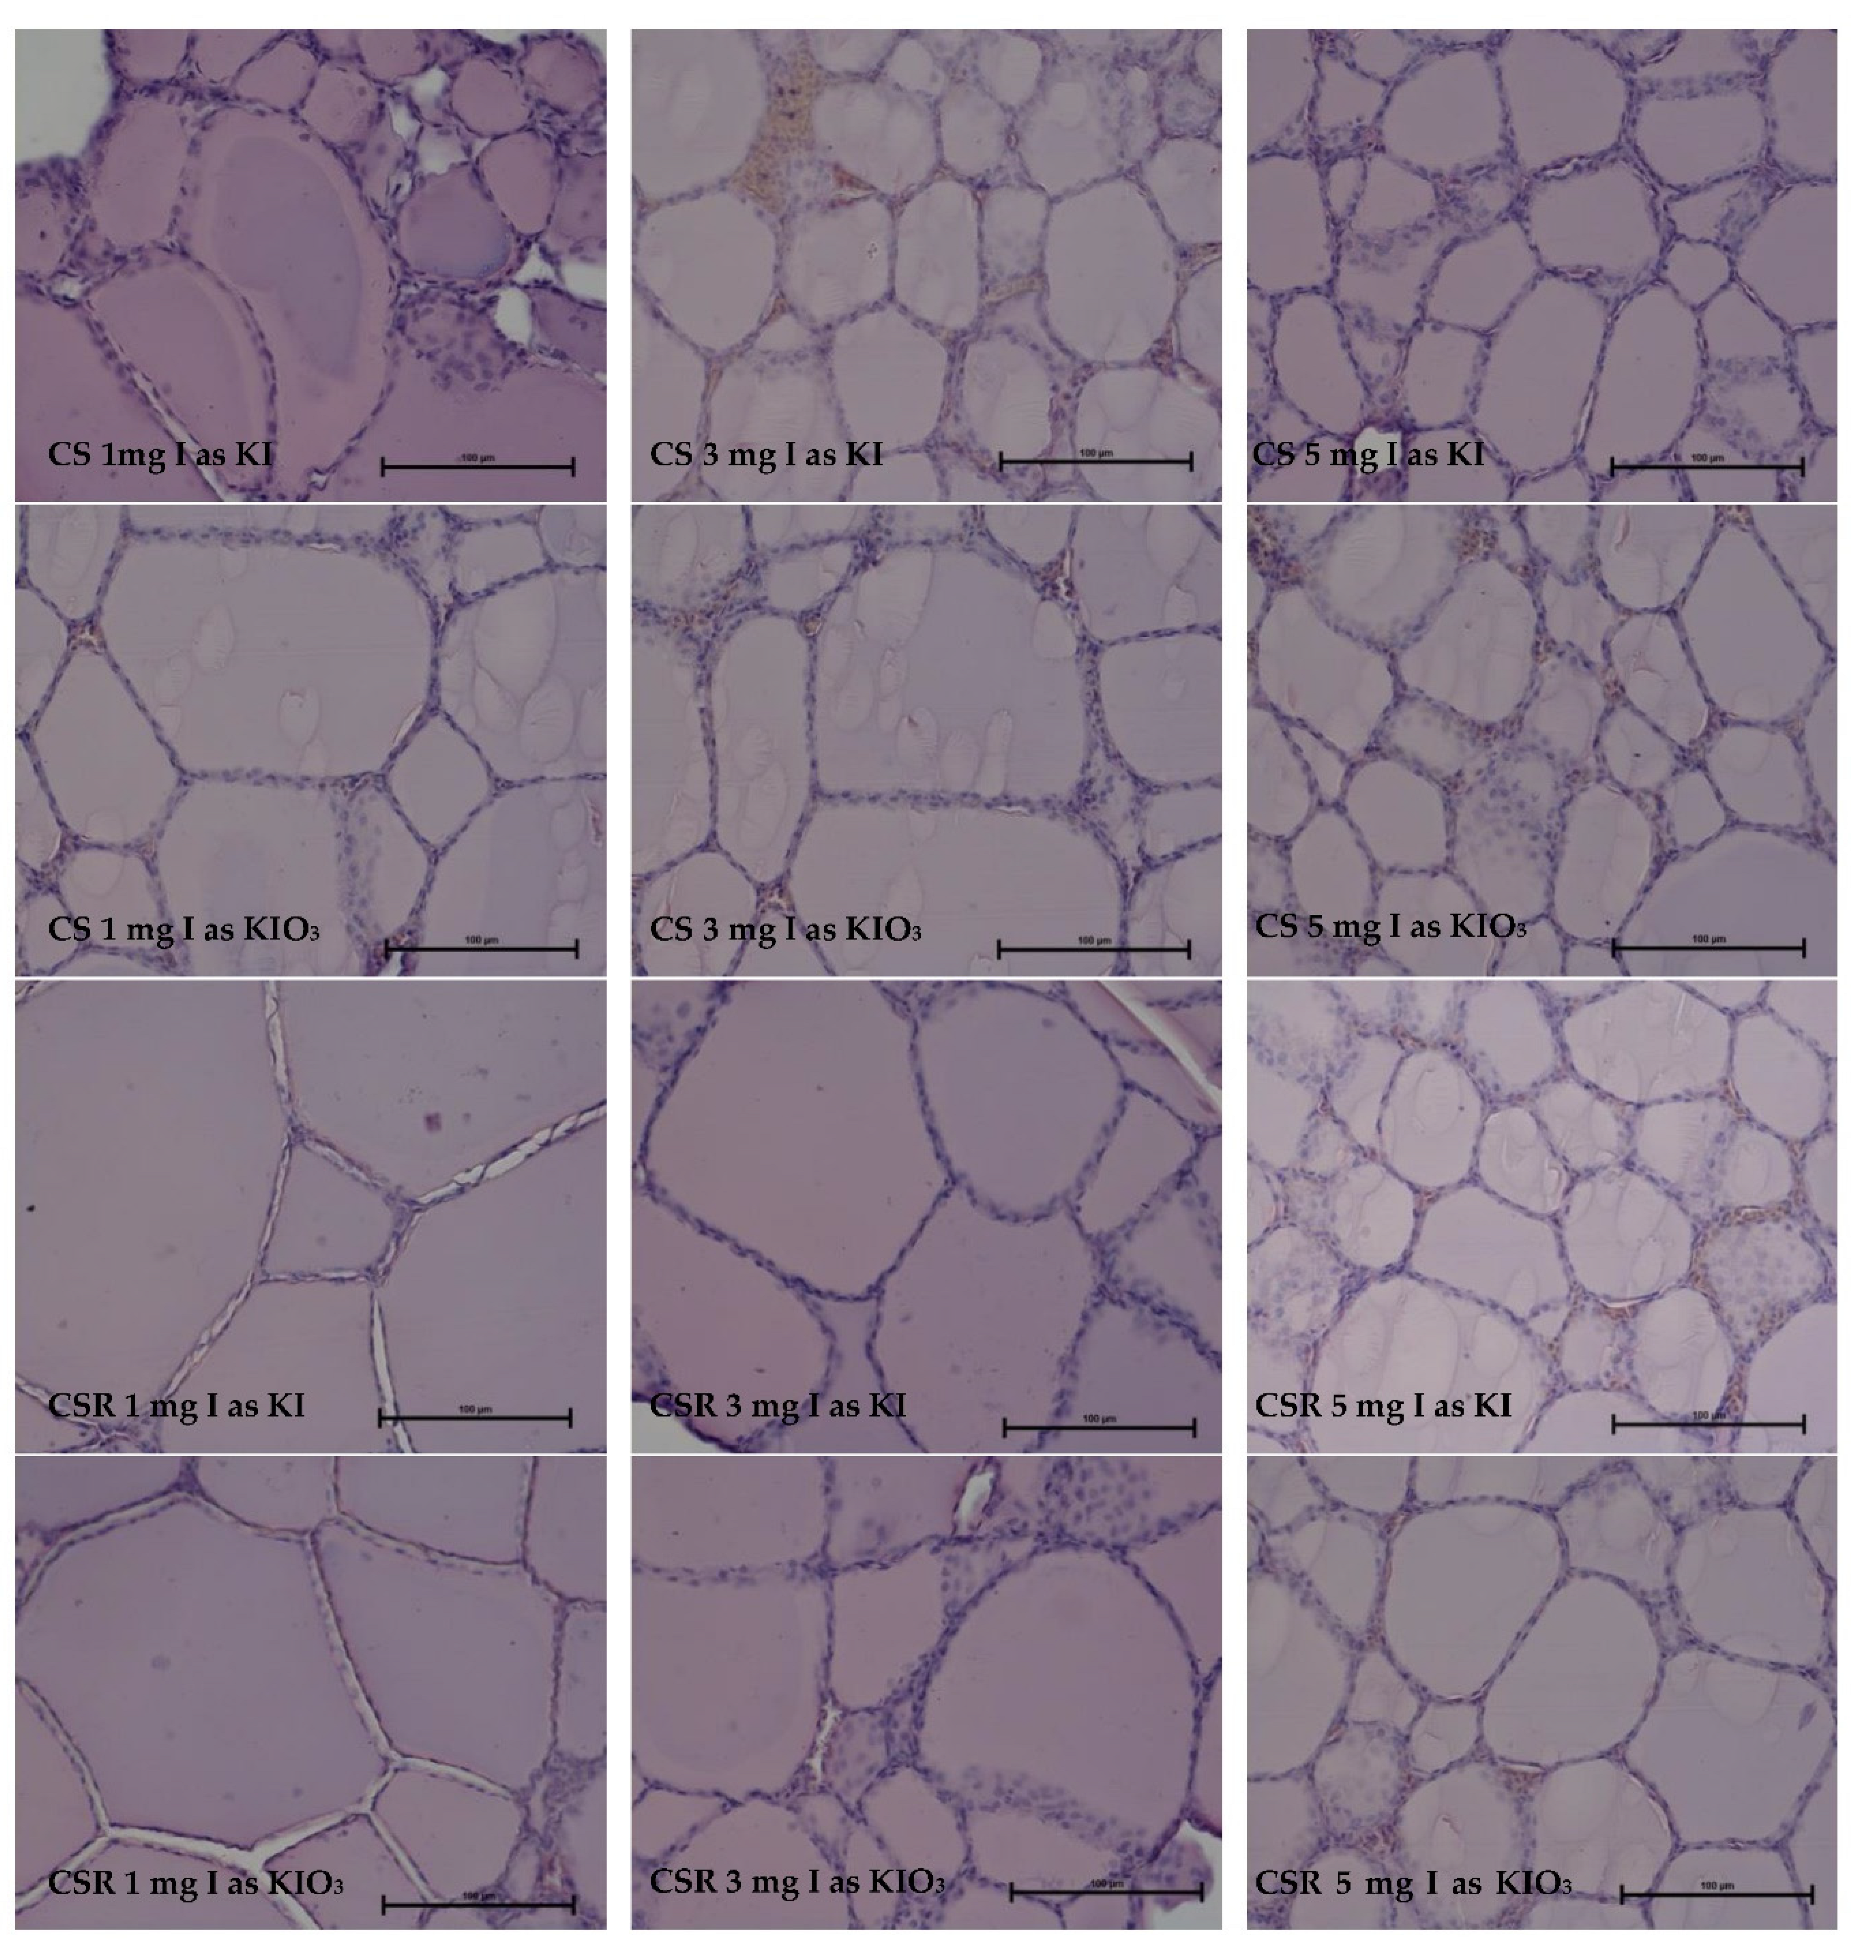
3.2. Thyroid Gland Structure

The analyzed material for the thyroid gland structure of hens in experiment I (Figure 1) presented a normal histological picture. These glands, which were derived from birds in all treatment groups, did not deviate from the healthy organs and were typical for the time of year in which the experiment was conducted.
In the group of birds fed the I-additives in an amount of 1 mg/kg, thyroid follicles were statistically (p = 0.000) larger (average above 70 μm), entirely filled with colloid, and surrounded by a dense network of blood vessels (Table 4). Follicular epithelial cells took the form of a cube and were slightly flattened in places. The thyroid cell surface was irregular, which may indicate a large mobilization of both secretory processes and colloid resorption. In the group of birds fed a higher dose of iodine, the thyroid follicles were about ¼ smaller (about 50 μm), whereas the epithelial cells were slightly larger. This result demonstrates the positive effects of additives on the process of thyroid hormone secretion.
The source of iodine applied in the experiment had no significant influence on the follicle diameter of the thyroid gland and ranged from 62.9 for KI to 67.1 for KIO3. The opposite relationship was noted for the height of the follicle epithelium cells. The iodine source significantly (p = 0.001) affected this parameter. The height of follicle epithelial cells was the highest for Ca(IO3)2 and the lowest for KIO3 (4.88 vs. 3.26 µm, respectively).
In experiment II, the analyzed thyroid gland structure of the hens presented a normal histological picture (Figure 2). In the microscopic picture, we observed a small amount of connective tissue filling the space between the follicle-containing colloid. The shapes of follicular epithelial cells resemble the squamous epithelium, with some visible areas showing active resorption of colloid where the epithelium becomes larger and resembles a cuboidal epithelium.
Morphometric analysis of the thyroid gland structure showed significant differences in particular treatments (Table 4). However, due to the existing interactions, these results are difficult to interpret. We observed that the main experimental factors (kind of diet, iodine source, and level) had an influence on both the follicle diameter and the height of follicle epithelial cells. Follicle diameter was larger (p = 0.011) in animals fed with a diet containing rapeseed meal (76.2 µm), but this factor did not have an influence on follicle epithelial cell height. The source of iodine used in experiment II did not change the thyroid gland follicle diameter. However, this parameter was reported to have an effect on the height of follicle epithelial cells. This effect was stronger in the thyroid glands of hens that received KI as a source of iodine (4.04 µm). Increasing iodine levels in the diets clearly decreased (p = 0.005) follicle size from 83.1 (for 1 mg of I/kg) to 67.8 µm for 5 mg of I/kg. A reverse relationship was noted for the height of follicle epithelial cells. The highest value for this parameter (4.24 µm) was found in hens receiving iodine addition of 5 mg/kg and the lowest in those receiving 1 mg/kg of iodine.

3.3. Immunoglobulin Concentration

The types of diets, iodine sources, and levels of I-supply did not produce a significant influence on the immunoglobulin concentration in blood serum (Table 5).
The mean level of IgA was 0.337 g/L, that of IgM was 1.168 g/L, and that of IgG was 11.33 g/L. The IgM and IgA concentrations were near the levels determined in healthy hens, but the IgG amounts in blood serum were relatively high.

4. Discussion

Thyroid hormones in blood plasma demonstrate great variability and can vary depending on animal age or season [5,33]. An important factor that can affect the values of obtained results concerning thyroid hormone concentration is the applied analytical method [24,43]. The use of two methods to analyze thyroid hormones in the serum of broiler breeders [44] (the chemiluminescence immunoassay (CLIA) or enzyme-linked immunosorbent assay (ELISA) methods) could diversify the observed concentrations of examined hormones, which could create difficulties in interpreting the obtained results. The study in [44] revealed the following values using CLIA and ELISA, respectively: T4: 31.6 and 21.3 nmol/L; T3: 1.47 and 1.08 nmol/L; fT4: 10.8 and 7.2 pmol/L; and fT3: 4.6 and 6.3 pmol/L. Stojević et al. [45] noted that in 28-day-old chickens, the triiodothyronine (T3) level could range between 1.2 and 2.0 nmol/L; at the age of 35 days, between 1.3 and 2.3 nmol/L; and at the age of 42 days, between 1.8 and 3.9 nmol/L, while the thyroxine (T4) concentration increased from 16–38 to 18–42 and 24–38 nmol/L, respectively. Together with aging, the plasma hormone levels can vary between 3.6 and 1.4 T3 ng/mL and 6.6 and 18.4 T4 ng/mL [46]. The concentrations of thyroid hormones in the blood serum of chickens given by Ma et al. [47] were 1.3–1.7 nmol/L for T3, 39–49 nmol/L for T4, 1.7–3.14 pmol/L for fT3, and 6.1–8.0 pmol/L for fT4. Similarly, the age of adult laying hens (22-34 weeks) has a significant impact on thyroid hormone levels in plasma, which were 0.97–2.93 nmol/L for T3, 25–39 nmol for T4, 10.0–14.5 pmol/L for fT4, and 3.8–18.4 pmol/L for fT3 [48].
The results for the concentration of thyroid hormones obtained in both experiments were within the values given by the above-mentioned authors. This result may indicate that the applied experimental factors did not cause dysregulation in the thyroid hormone balance. However, the seasonal fluctuations in hormone concentration in blood serum cannot be clearly stated, while the hormones were determined in two different hen groups.
Available literature data indicate that the applied iodine levels influenced the concentration determined in the blood serum thyroid hormone concentration. The iodine supplementation of diets caused an insignificant decrease in the T3 concentration (1.98–2.33 nmol/L) in pig blood plasma and a significantly (p < 0.01) increased level of T4 from 50.4 to 95.9 nmol/L [49]. By adding 10 µg iodine in the form of KIO3 to 1 mL of drinking water for rats, T4 increased to 16.3 µg/dL compared to the control animal (10 µg/mL), fT4 increased to 5.74 (control: 2.83 pmol/L), and fT3 increased to 2.31 pmol/L (control: 2.12 pmol/L) [14]. Röttger et al. [25] observed significant growth of the iodine concentration in the thyroid gland due to I-supply in the diet using 4 or 10 mg I/kg of feed in the form of KI or KIO3. Li et al. [11] found no impact on the T3 thyroid gland, but other authors noted a clear response of thyroid activity to high I-levels in the diet [50] or increased thyroid stimulating hormone pituitary TSH concentrations. For experiments with broilers, Behroozlak et al. [51] observed that the dietary inclusion levels of iodine supplementation (0, 2.5, and 5 mg/kg) as KI had no influence on the T3 concentration, unlike the T4 concentration, which significantly increased from 12.45 (with an iodine concentration of 2.5 mg/kg) to 14.11 nmol/L (with iodine concentration 5 mg/kg). In experiments with laying hens fed over a period 12 weeks with a diet containing various levels of CIOD and EDDI as supplemental iodine sources (2.0, 4.0, and 8.0 mg/kg of feed), Sarlak et al. [24] observed that both experimental factors had an effect on serum T3 and T4 concentrations. In hens that received EDDI as an I-supplement after 12 weeks of experimentation, both T3 and T4 concentrations increased in comparison with the animals that received CIOD (T3 and T4 concentrations for EDDI were 1.97 and 16.02 ng/mL, respectively, whereas these values for CIOD were 1.81 and 15.47 ng/mL, respectively). In our experiments, we observed no effect of iodine source on fT3 and fT4 concentrations. In a previous experiment [24], only the highest concentration of iodine (8.0 mg/kg of diet) led to an increase in T3 and T4 concentration to 2.75 and 17.78 ng/mL, respectively. This result is in agreement with the data from our own studies with respect to fT3 concentration: increasing the level of I-supplementation led to an increased fT3 concentration in both experiments. Contrary to the cited data, no effect of iodine levels on the fT4 concentration was observed. In an experiment by Ahmadi M. [52], different levels of rapeseed meal addition (5%, 10%, and 15%) to the diet had no significant effect on T3 and T4 concentrations. On the other hand, Maroufyan E. and Kermanshahi H. [53], in experiments with broilers, noted that increasing the rapeseed level from 7.5% to 15% in the full mixture led to an increase of serum T3 concentration on the 42nd day of the experiment (1.50 vs. 1.90 ng/mL, respectively), while there was no effect on T4 concentration. Data from our experiment (Exp. II) showed a similar effect of rapeseed meal addition on fT3 and fT4 concentrations.
The small seasonally variable morphology of the thyroid gland in birds has been observed by other authors. In winter, due to the shorter amount of daylight, thyrotropin (TSH) and thyroid hormone activities are reduced, leading to greater heat production and thermoregulation; consequently, the follicles are larger than 100 µm, and the follicular secretion cells have a flattened shape to a height of about 2 µm. In the summer, the follicles have a diameter of about 60 µm, and the height of the follicular epithelial cells reaches up to 12 µm [54,55,56,57]. Additionally, age-specific changes can be observed in birds, where the follicles become larger (average), and the height of the epithelial cells decreases. Our studies of follicular size measurements did not provide clear answer regarding the effects of dietary I-supplementation. The numerous significant differences between treatments in Exp. I and II, as well as the significant interactions between experimental factors, made interpretation of the results very difficult. Factorial analysis showed a significant decrease in follicular size based on the I-level in the diet (Exp. I), without influence from the iodine source. An inverse relationship between the level and source of iodine was found for follicle epithelial cell height. In experiment II, the use of rapeseed meal in the diet significantly enlarged the follicle size; by supplying 5 mg I/kg, a decrease in follicle diameter was observed. Using KIO3 as an I-source decreased the height epithelial cells compared to the effects of KI. The highest epithelium was observed after using 5 mg I/kg I-addition.
A greater follicle size indicates the accelerated mobilization of colloid, but in the case of the analyzed material, this mobilization seems to yield slower growth of the follicles. In the case of treatments with the addition of rapeseed meal, there are fewer follicular cells, which may indicate a lower potential for future growth (i.e., fewer cells that can enter the follicle). The relationship between follicle size and their number present in the area of the microscopic picture adjacent to the bladder offers potential for hypertrophy, as well as synthesis rate and colloid mobilization. Thyroid hormones have two stages: the original cells and cells separated into the light bladder before resorption, at which point the condenser must be enriched with iodine in colloid. Therefore, the synthesis of thyroid stimulating hormone is associated with the accelerated synthesis of colloid and its resorption. In the initial phase, this phenomenon means an increase in the synthesis of colloidal and larger bubbles and their subsequent resorption. In animals, this stage is followed by stabilization of the vesicles, and these processes adopt all classical structures. An increase in the volume of thyroid follicles can thus be caused by colloid synthesis acceleration and deceleration of its resorption. These phenomena yield a slowdown in metabolism in autumn and winter but rapid acceleration in spring and summer.
In the present study, (Exp. II), we did not observe any influence of the applied diets and iodine sources or levels on serum immunoglobulin concentrations. Mehner and Hartfiel [43] reported that the individual variability of IgG usually amounts to 5.5–8.2 g/L but can oscillate between 2.79 and 14.45 g/L with variability of about 564%. In quails, Niemiec [58] observed very low concentrations with 16–21.9 µg/dL IgM, 4.9–6.4 µg/dL IgG, and 3.8–4.7 µg/dL IgA. The long-term fortification of iodine content in the hens’ diet had no negative influence on the physiological and biochemical parameters in the blood or the good health of the birds [29]. Additionally, thyroid gland morphology and immunoglobulin concentrations in the blood serum corresponded to correct thyroid functions in laying hens.

5. Conclusions

The experimental factors did not show any negative effects on changes in the structure and functioning of the thyroid gland, which may indicate the possibility to safely use iodine supplementation in laying hens over a long period of time, even in higher amounts. Observed changes in fT3 and fT4 concentrations as an effect of increased iodine levels in the diet may indicate a shift in the balance towards a more metabolically active form of the hormone. There was no effect of diet, level of iodine, or I-supplementation on immunoglobulin concentrations in hen blood serum.
Overall, the methodologies of studies on the bioavailability of minerals and the corresponding analytical methods require unification. The lack of such standardization makes it impossible to develop a satisfactory discussion of the results and exchange experiences. Another problem in interpreting the data is the number of factors that are simultaneously taken into account in such experiments.

Author Contributions

Conceptualization, D.J., M.S., J.O. and A.W.; methodology, M.S., D.J., J.O., A.W. and P.K.; investigation, M.S., J.O., A.W. and P.K.; resources, D.J., M.S. and B.K.; writing—original draft preparation, M.S.; writing—review and editing, M.S. and D.J. All authors have read and agreed to the published version of the manuscript.

Funding

Research was realized within the project “BIOFOOD—innovative, functional products of animal origin” (no. POIG.01.01.02-014-090/09) co-financed by the European Union from the European Regional Development Fund within the Innovative Economy Operational Programme 2007–2013.

Institutional Review Board Statement

The animal study protocol was approved by the II Local Ethical Committee for the Animal Experiments of WARSAW UNIVERSITY OF LIFE SCIENCES (protocol code 27/2009, date of approval 16 April 2009).

Informed Consent Statement

Not applicable.

Data Availability Statement

Not applicable.

Conflicts of Interest

The authors declare no conflict of interest.

References

  1. Sturkie, P.D. (Ed.) Avian Physiology; Springer: New York, NY, USA, 1986. [Google Scholar]
  2. Klandorf, H.; Sharp, P.J.; Duncan, I.J.H. Variations in levels of plasma thyroxine and triiodothyronine in juvenile female chickens during 24- and 16-hr lighting cycles. Gen. Comp. Endocrinol. 1978, 36, 238–243. [Google Scholar] [CrossRef] [PubMed]
  3. Shellabarger, C.J. A comparison of triiodothyronine and thyroxine in the chick goiter-prevention test. Poult. Sci. 1955, 34, 1437–1440. [Google Scholar] [CrossRef]
  4. Tata, J.R.; Shellabarger, C.J. An explanation for the difference between the responses of mammals and birds to thyroxine and tri-iodothyronine. Biochem. J. 1959, 72, 608–613. [Google Scholar] [CrossRef] [PubMed] [Green Version]
  5. Bobek, S.; Jastrzebski, M.; Pietras, M. Age-related changes in oxygen consumption and plasma thyroid hormone concentration in the young chicken. Gen. Comp. Endocrinol. 1976, 31, 169–174. [Google Scholar] [CrossRef]
  6. Sourgens, H.; Frőmblich-Borges, A.; Kemper, P.H. Iodine and Autoregulation of Thyroid Gland Function: Inhibition of Secretion of Thyroid Hormones in the Rat. 5. Spurenelement-Symposium, Jod. J.Boden, Pflanze, Tier, Mensch; Friedrich-Schiller-Universitat: Jena, Germany, 1986; pp. 53–59. [Google Scholar]
  7. McDowell, L.R. Iodine. In Minerals in Animal and Human Nutrition; Academic Press Inc.: New York, NY, USA, 1992; pp. 225–245. [Google Scholar]
  8. Delange, F. Risks and benefits of iodine supplementation. Lancet 1998, 351, 923–924. [Google Scholar] [CrossRef]
  9. Goldhaber, S.B. Trace element risk assessment: Essentiality vs. toxicity. Regul. Toxicol. Pharmacol. 2003, 38, 232–242. [Google Scholar] [CrossRef]
  10. Lewis, P.D. Responses of domestic flow to excess iodine: A review. Br. J. Nutr. 2004, 91, 29–39. [Google Scholar] [CrossRef]
  11. Li, Q.; Mair, C.; Schedle, K.; Hammerl, S.; Schodl, K.; Windisch, W. Effect of iodine source and dose on growth and iodine content in tissue and plasma thyroid hormones in fattening pigs. Eur. J. Nutr. 2012, 51, 685–691. [Google Scholar] [CrossRef]
  12. Delange, F. The disorders induced by iodine deficiency. Thyroid. 1994, 4, 107–128. [Google Scholar] [CrossRef] [Green Version]
  13. Van Middlesworth, L. Iodinated Thyroid Proteins Which Accumulate during Iodine Deficiency. 16. Arbeitstagung “Mengen und Spurenelemente”; Friedrich-Schiller-Universitat: Jena, Germany, 1996; pp. 920–921. [Google Scholar]
  14. Liu, N.Q.; Xu, Q.; Hou, X.L.; Liu, P.S.; Chai, Z.F.; Zhu, L.; Zhao, Z.Y.; Wang, Z.H.; Li, Y.F. The distribution patterns of trace element in the brain and erythrocytes in a rat experimental model of iodine deficiency. Brain Res. Bull. 2001, 55, 309–312. [Google Scholar] [CrossRef]
  15. Bagchi, N.; Brown, T.R.; Sundick, R.S. Thyroid cell injury is an initial event in the production of autoimmune thyroiditis by iodine in obese strain chicken. Endocrinology 1995, 136, 5054–5060. [Google Scholar] [CrossRef] [PubMed]
  16. Lydygard, P.; Whelan, A.; Fanger, M.W. Instant Notes in Immunology; Hames, B.D., Ed.; BIOS Scientific Publisher, Taylor and Francis Group: Abingdon, UK, 2000. [Google Scholar]
  17. Arrington, L.R.; Santa Cruz, R.A.; Harms, R.H.; Wilson, H.R. Effects of excess dietary iodine upon pullets and laying hens. J. Nutr. 1967, 92, 325–330. [Google Scholar] [CrossRef] [PubMed]
  18. Bürgi, H.; Schaffner, T.H.; Seiler, J.P. The toxicology of iodate: A review of the literature. Thyroid 2001, 11, 449–456. [Google Scholar] [CrossRef] [Green Version]
  19. Baker, D.H. Iodine toxicity and its amelioration. Exp. Biol. Med. 2004, 229, 473–478. [Google Scholar] [CrossRef] [Green Version]
  20. Ślebodziński, A. Zarys Endokrynologii Zwierząt Domowych; Outline of Endocrinology of Domestical Animals; PWN: Warszawa, Poland, 1979; pp. 174–194. (In Polish) [Google Scholar]
  21. Kopp, W. Nutrition, evolution and thyroid hormone levels-a link to iodine deficiency disorders? Med. Hypotheses 2004, 62, 871–875. [Google Scholar] [CrossRef] [PubMed]
  22. Dunn, J.T.; Dunn, A.D. The importance of thyroglobulin structure for thyroid hormone biosynthesis. Biochimie 1999, 81, 505–509. [Google Scholar] [CrossRef]
  23. Miller, E.R.; Ammerman, C.B. Iodine bioavailability. In Bioavailability of Nutrients for Animals; Ammerman, C.B., Baker, D.H., Lewis, A.J., Eds.; Academic Press: San Diego, CA, USA, 2005; pp. 157–167. [Google Scholar]
  24. Sarlak, S.; Tabeidian, S.A.; Toghyani, M.; Shahraki, A.D.F.; Goli, M.; Habibian, M. Supplementation of two sources and three levels of iodine in the diet of laying hens: Effects on performance, egg quality, serum and egg yolk lipids, antioxidant status, and iodine accumulation in eggs. Ital. J. Anim. Sci. 2020, 19, 974–988. [Google Scholar] [CrossRef]
  25. Röttger, A.S.; Halle, I.; Wagner, H.; Breves, G.; Dänicke, S.; Flachowsky, G. The effects of iodine level and source on iodine carry-over in eggs and body tissues of laying hens. Arch. Anim. 2012, 66, 385–401. [Google Scholar] [CrossRef]
  26. Preston, R.C. Serum inorganic iodine dynamics in cattle following a single oral dose of several iodine sources. Faseb J. 2009, 8, A43. [Google Scholar]
  27. Leeson, S.; Summers, J.D. Commercial Poultry Nutrition, 3rd ed.; Nottingham University Press: Nottingham, UK, 2009; pp. 72–73. [Google Scholar]
  28. Bakhshalinejad, R.; Hassanabadi, A.; Nassiri-Moghaddam, H.; Zarghi, H. The effects of dietary calcium iodate on productive performance, egg quality and iodine accumulation in eggs of laying hens. J. Anim. Physiol. Anim. Nutr. 2018, 102, 746–754. [Google Scholar] [CrossRef]
  29. Słupczyńska, M.; Jamroz, D.; Orda, J.; Wiliczkiewicz, A. Effect of various sources and levels of iodine, as well as the kind of diet, on the performance of young laying hens, iodine accumulation in eggs, egg characteristics, and morphotic and biochemical indices in blood. Poult. Sci. 2014, 93, 2536–2547. [Google Scholar] [CrossRef] [PubMed]
  30. Smulikowska, S.; Rutkowski, A. Zalecenia Żywieniowe i Wartość Pokarmowa pasz dla Drobiu; Poultry Nutrition Standards. Nutritional Recommendations and Nutritive Value of Feeds in Poultry, 5th ed.; Instytut Fizjologii i Żywienia Zwierząt im. Jana Kielanowskiego, Polskiej Akademii Nauk, Polski Oddział Światowego Stowarzyszenia Wiedzy Drobiarskiej PB WPSA: Poznań, Poland, 2018; p. 37. (In Polish) [Google Scholar]
  31. EFSA. Opinion of the scientific panel on additives and products or substances used in animal feed on the request from the Commission on the use of iodine in feedingstuffs. EFSA J. 2005, 13, 1–42. [Google Scholar]
  32. Tripathi, M.K.; Agrawal, I.S.; Sharma, S.D.; Mishra, D.P. Effect of untreated, HCl treated or copper and iodine supplemented high glucosinolate mustard (Brassica juncea) meal on nutrient utilization, liver enzymes, thyroid hormones and growth of calves. Anim. Feed Sci. Technol. 2001, 92, 73–85. [Google Scholar] [CrossRef]
  33. Lichovnikova, M.; Zeman, L. The effects of a higher amount of iodine supplement on the efficiency of laying hens fed extruded rapeseed and on eggshell quality. Czech J. Anim. Sci. 2004, 49, 199–203. [Google Scholar] [CrossRef] [Green Version]
  34. Haldimann, M.; Alt, A.; Blanc, A.; Blondeau, K. Iodine content of food groups. J. Food Compos. Anal. 2005, 18, 461–471. [Google Scholar] [CrossRef]
  35. World’s Poultry Science Association. European Table of Energy Values for Poultry Feedstuffs, 3rd ed.; WPSA: Poznań, Poland, 1989; pp. 11–28. [Google Scholar]
  36. AOAC. Official Methods of Analysis., 18th ed.; Association of Official Analytical Chemists (AOAC): Arlington, VA, USA, 2007. [Google Scholar]
  37. Moore, S.; Stein, N.H. Discussion of classic methods of acid hydrolysis. Methods Enzymol. 1963, 6, 819–823. [Google Scholar]
  38. Gąsior, R.; Szczypuła, M. Validation of method for determination of iodine in food and biological material. Rocz. Nauk. Zoot. 2010, 37, 63–73. (In Polish) [Google Scholar]
  39. Knapp, G.; Maichin, B.; Fecher, P.; Hasse, S.; Schramel, P. Iodine determination in biological materials: Options for sample preparation and final determination. J. Anal. Chem. 1998, 362, 508–513. [Google Scholar]
  40. Zhang, W.; Mnastsakanov, A.; Hower, R.; Cantor, H.; Wang, Y. Urinary iodine assays and ionophore based potentiometric iodide sensors. Front. Biosci. 2005, 10, 88–93. [Google Scholar] [CrossRef] [Green Version]
  41. Gabe, M. Techniques Histologiques; Masson, P., Ed.; Masson: Paris, France, 1968; p. 1113. [Google Scholar]
  42. StatSoft Inc. Statistica Data Analysis Software System; Version 9; StatSoft Inc.: Tulsa, OK, USA, 2012. [Google Scholar]
  43. Mehner, A.; Hartfiel, W. Handbuch der Geflügelphysiologie. Teil 2; Karger Verlag: Basel, Switzerland; München, Germany, 1983; pp. 344–345. [Google Scholar]
  44. Eshratkhah, B.; Asad Zadeh, S.; Forouzan, V.; Pour Parsa, A.A.; Ghiasi Ghalehkandi, J. Comparative study on the determination of serum thyroid hormones by two methods of immunoassay in broiler breeder poultry. Comp. Clin. Path. 2011, 20, 337–340. [Google Scholar] [CrossRef]
  45. Stojević, Z.; Milinković-Tur, S.; Ćurčija, K. Changes in thyroid hormones concentrations in chicken blood plasma during fattening. Veterinarski Arhiv. 2000, 70, 31–37. [Google Scholar]
  46. Moayyedian, H.; Asasi, K.; Nazifi, S.; Hassanzadeh, M.; Ansari-Lari, M. Relationship between venous blood gas parameters, thyroid hormone levels and ascites syndrome in broiler chickens exposed to cold temperature. Iran. J. Vet. Res. 2011, 12, 31–38. [Google Scholar]
  47. Ma, H.T.; Tang, X.; Tian, C.Y.; Zou, S.X.; Huang, G.Q.; Chen, W.H. Effects of dehydroepiandrosterone on growth performance, lipid metabolic hormones and parameters in broilers. Vet. Medic. 2008, 53, 543–549. [Google Scholar] [CrossRef] [Green Version]
  48. Eshratkhah, B.; Ali Pourparsa, A.; Rostami, S.; Abbasi Navid, M.R. Relationship between the variations of blood thyroid hormones concentrations, their percentages and some biochemical parameters during different ages of layer breeder. Glob. Vet. 2011, 6, 459–467. [Google Scholar]
  49. He, M.L.; Borger, C.; Schuster, M.; Hollwich, W.; Krupova, V.; Kursa, J.; Bonabeze, E.; Ranzland, D.; Rambeck, W.W. Carryover of Iodine from Algae to the Products of Pigs and Layng Hens. 6th Symp.; Pig and Poultry Nutrition: Wittenberg, Germany, 2000; pp. 251–253. [Google Scholar]
  50. Travniček, J.; Kroupova, V.; Krotochvil, P.; Krabacova, J. The effect of excessive iodine intake on the histology of the thyroid gland in layer. Vet. Med. 1999, 6, 177–182. [Google Scholar]
  51. Behroozlak, M.; Daneshyar, M.; Farhomand, P. The effect of dietary iodine and its consumption duration on performance, carcass characteristics, meat iodine, thyroid hormones and some blood indices in broiler chickens. J. Anim. Physiol. Anim. Nutr. 2020, 104, 876–885. [Google Scholar] [CrossRef]
  52. Ahmadi, M. The Effect of Different Levels of Rapeseed Meal with and without Enzyme on the Performance and the Serum Level of Triiodothyronine (T3), Thyroxine (T4) and Thyroid Stimulating Hormone (TSH) in Broiler Chickens. Iran. J. Appl. Anim. Sci. 2016, 6, 203–209. [Google Scholar]
  53. Maroufyan, E.; Kermanshahi, H. Effect of Different Levels of Rapeseed Meal Supplemented with Calcium Iodate on Performance, Some Carcass Traits, and Thyroid Hormones of Broiler Chickens. Int. J. Poult. Sci. 2006, 5, 1073–1078. [Google Scholar]
  54. Reinecke, E.P.; Turner, C.W. Seasonal rhythm in the thyroid hormone secretion of the chick. Poult. Sci. 1945, 24, 499–503. [Google Scholar] [CrossRef]
  55. French, E.I.; Hodges, R.D. Fine structural studies on the thyroid gland of the normal domestic fowl. Cell Tissue. Res. 1977, 178, 397–410. [Google Scholar] [CrossRef]
  56. Breit, S.; König, H.E.; Stöger, E. The morphology of the thyroid gland in poultry with special regard to seasonal variations. Anat. Histol. Embryol. 1998, 27, 271–276. [Google Scholar] [CrossRef] [PubMed]
  57. Takashi, Y. Thyroid hormone and seasonal regulation of reproduction. Front. Neuroendocr. 2013, 34, 157–166. [Google Scholar]
  58. Niemiec, T. The Effect of Invertebrate Extracts on Development and Health of Model Animals; SGGW: Warszawa, Poland, 2013. (In Polish) [Google Scholar]
Figure 1. Representative pictures of the thyroid gland from the birds fed with diets of different iodine supplements and levels (HiE Mag 400) (Experiment I).
Animals 13 00158 g001
Figure 2. Representative pictures of the thyroid gland from the birds fed different diets, with different iodine supplements and levels (HiE Mag 400) (Experiment II).
Animals 13 00158 g002
Table 1. Design of the experiments.
Experiment I
Type of iodine supplement
potassium iodide
KI
calcium iodate
Ca(IO3)2
potassium iodate
KIO3
Level of I-supplement mg/kg
151515
Experiment II
Treatments—Diets
CS *CSR **
Type of iodine supplement
potassium iodide
KI
potassium iodate
KIO3
potassium iodide
KI
potassium iodate
KIO3
Level of I-supplement mg/kg
135135135135
* corn–soybean-based mixture; ** corn–soybean–rapeseed-based mixture.
Table 2. Basal composition of the experimental diets in both experiments.
Ingredient, % of DietDiets
Experiment IExperiment II
CSCSR
Corn meal 15.0015.0015.00
Wheat meal 25.8128.4424.09
Barley meal 20.0020.0020.00
Soybean meal solvent extracted 21.5020.1813.23
Rapeseed 00 meal. solvent extracted --10.00
Rapeseed oil 5.204.285.71
Dicalcium phosphate 2.050.4810.435
Chalk 7.258.9318.851
NaCl 0.370.0150.013
DL methionine0.1840.0460.024
L-Lysine 0.1350.1280.148
Vitamin and mineral premix 1 2.502.502.50
Nutritive value of mixtures
  EM, MJ/kg11.6511.6511.65
  Crude protein, g/kg163.50165.00162.00
  Crude fiber, g/kg 33.0036.2628.97
  Ca, g/kg38.8038.8038.90
  P available, g/kg4.304.304.32
  Na, g/kg1.751.701.71
  Methionine, g/kg4.324.304.31
  Lysine, g/kg9.089.008.97
Nutritive recommendations for Hy-Line laying hens
  EM, MJ/kg11.65
  Crude protein, g/kg165.00
  Crude fiber, g/kgto 40.00
  Ca, g/kg 38.80
  P available, g/kg4.30
  Na, g/kg 1.70
  Methionine, g/kg4.30
  Lysine, g/kg 9.00
1 Supplied per kilogram of diet: vitamin A—12,000 IU; vitamin D3—3300 IU; vitamin E—30.0 mg; vitamin K3—3.0 mg; vitamin B1—2.20 mg; vitamin B2—6.60 mg; vitamin B6—3 mg; vitamin B12—27 mcg; pantothenic acid—10.2 mg; nicotinic acid—30 mg; folic acid—0.9 mg; choline—0.315 mg; Mg—113 mg; Zn—72 mg; Co—0.48 mg; Cu—10.0 mg; Fe—60 mg, Se—0.30 mg, I—0.0 mg.
Table 3. Thyroid hormone concentration in hen blood serum (Exp. I and Exp. II).
ItemExperiment IExperiment II
fT3, pmol/LfT4, pmol/LfT3, pmol/LfT4, pmol/L
Treatments
Experiment I
  1 mg I as KI 5.1410.71
  5 mg I as KI 5.4811.47
  1 mg I as Ca(IO3)25.0522.69
  5 mg I as Ca(IO3)25.5411.85
  1 mg I as KIO3 4.649.92
  5 mg I as KIO3 6.4513.82
Experiment II
CS
  1 mg I as KI 8.5111.06
  3 mg I as KI 7.0111.58
  5 mg I as KI 10.149.52
  1 mg I as KIO3 7.938.02
  3 mg I as KIO3 9.0411.36
  5 mg I as KIO3 9.6610.04
CSR
  1 mg I as KI 11.198.55
  3 mg I as KI 9.297.22
  5 mg I as KI 13.297.28
  1 mg I as KIO3 10.9210.32
  3 mg I as KIO3 10.707.59
  5 mg I as KIO3 12.027.77
SEM0.1892.1490.4440.600
p value0.1110.4920.1370.920
Kind of diet
  CS8.71 A10.26
  CSR11.24 B8.12
Iodine source
  KI5.3010.809.909.20
  Ca(IO3)25.2920.13--
  KIO35.5411.3010.059.19
Level of iodine supplement
  1 mg4.94 a15.629.64 Aa9.49
  3 mg--9.01 Ab9.43
  5 mg5.83 b12.5211.28 B8.65
Source of variation, p value
Kind of diet--0.0060.181
Iodine source0.8380.3770.8300.891
Iodine level0.0200.6160.0450.832
Kind of diet × I-source--0.8740.576
Kind of diet × I-level--0.8260.439
I-source × I-level0.2080.3350.3720.880
Kind of diet × I-source × I-level--0.7440.769
Means within column marked using a and b superscripts differ significantly at p < 0.05, means within column marked using A and B superscripts differ significantly at p < 0.01.
Table 4. Morphometric characteristic of the thyroid gland (Exp. I and Exp. II).
ItemExperiment IExperiment II
Follicle Diameter, µmHeight of Follicle Epithelial Cells, µmFollicle Diameter, µmHeight of Follicle Epithelial Cells, µm
Experiment I
  1 mg I as KI71.6 A3.87
  5 mg I as KI 54.2 Bc4.21
  1 mg I as Ca(IO3)272.3 A4.58
  5 mg I as Ca(IO3)253.9 Bc5.17 a
  1 mg I as KIO375.1 Ab3.22 b
  5 mg I as KIO3 59.0 Bc3.31 b
Experiment II
 CS
  1 mg I as KI 72.53.87
  3 mg I as KI 65.2 abce4.58 ABab
  5 mg I as KI 54.2 Ac4.21
  1 mg I as KIO3 87.1 Bde3.22 BCbcd
  3 mg I as KIO3 762.59 Cd
  5 mg I as KIO3 59.1 ACDabc3.31 bcd
 CSR
  1 mg I as KI 88.7 Bd2.90 BC
  3 mg I as KI 81.3 BCDacde3.78 cd
  5 mg I as KI 67.55.17 Aa
  1 mg I as KIO3 84.1 BDde3.09 BCbcd
  3 mg I as KIO3 78.1 abde3.16 BCbcd
  5 mg I as KIO3 57.5 ACb4.43 abc
SEM1.6400.1661.5340.111
p value0.0000.0090.0000.000
Kind of diet
 CS69.0 a3.64
 CSR76.2 b3.76
Iodine source
 KI62.94.0471.64.04 A
 Ca(IO3)263.14.88 A
 KIO367.13.26 B73.73.29 B
Level of iodine supplement
 1 mg72.9 A3.8983.1 A3.43 A
 3 mg 75.23.51
 5 mg59.1 B4.2367.8 B4.24 B
Source of variation, p value
Kind of diet 0.0110.528
Iodine source0.0970.0010.4560.000
Iodine level0.0000.3000.0050.000
Kind of diet × I-source 0.0040.049
Kind of diet × I-level 0.0010.004
I-source × I-level0.0010.8280.0190.083
Kind of diet × I-source × I-level 0.0000.487
Means within column marked with a, b, c, d and e superscripts differ significantly at p < 0.05, means within column marked with A, B, C and D superscripts differ significantly at p < 0.01.
Table 5. Immunoglobulin concentration in hen blood serum (g/L) (Exp. II).
ItemIgAIgMIgG
Treatments
CS
  1 mg I as KI0.3971.39811.99
  3 mg I as KI0.2841.10310.22
  5 mg I as KI0.3671.32611.08
  1 mg I as KIO30.2801.23611.81
  3 mg I as KIO30.4030.94611.67
  5 mg I as KIO30.2840.98511.57
CSR
  1 mg I as KI0.2851.25510.32
  3 mg I as KI0.3491.08013.73
  5 mg I as KI0.2751.4329.71
  1 mg I as KIO30.4531.06512.00
  3 mg I as KIO30.3011.0559.99
  5 mg I as KIO30.3721.14011.93
SEM0.0190.0790.470
p value0.6430.9270.914
Kind of diet
  CS0.3361.16611.39
  CSR0.3391.17111.28
Iodine source
  KI0.3261.26511.17
  KIO30.3491.07111.49
Level of iodine supplement
  1 mg0.3541.23811.53
  3 mg0.3341.04611.40
  5 mg0.3241.22111.07
Source of variation,
p value
  Kind of diet0.9420.7570.811
  Iodine source0.4830.3540.602
  Iodine level0.8570.5890.906
  Kind of diet × I-source0.1710.6750.96
  Kind of diet × I-level0.9350.4100.672
  I-source × I-level0.9390.6390.548
  Kind of diet × I-source × I-level0.0660.8870.254
All mean within columns are statistically insignificant.
Disclaimer/Publisher’s Note: The statements, opinions and data contained in all publications are solely those of the individual author(s) and contributor(s) and not of MDPI and/or the editor(s). MDPI and/or the editor(s) disclaim responsibility for any injury to people or property resulting from any ideas, methods, instructions or products referred to in the content.

