Article

The Candidate Chromosomal Regions Responsible for Milk Yield of Cow: A GWAS Meta-Analysis

by
Lida Taherkhani
1,
Mohammad Hossein Banabazi
2,3,*,
Nasser EmamJomeh-Kashan
1,
Alireza Noshary
4 and
Ikhide Imumorin
5
1
Department of Animal Science, Science and Research Branch, Islamic Azad University, Tehran 1477893855, Iran
2
Department of Biotechnology, Animal Science Research Institute of Iran (ASRI), Agricultural Research, Education & Extension Organization (AREEO), Karaj 3146618361, Iran
3
Department of Animal Breeding and Genetics (HGEN), Center for Veterinary Medicine and Animal Science (VHC), Swedish University of Agricultural Sciences (SLU), 75007 Uppsala, Sweden
4
Department of Animal Science, Karaj Branch, Islamic Azad University, Karaj 3187644511, Iran
5
School of Biological Sciences, Georgia Institute of Technology, Atlanta, GA 30332, USA
*
Author to whom correspondence should be addressed.
Animals 2022, 12(5), 582; https://doi.org/10.3390/ani12050582
Submission received: 30 December 2021 / Revised: 15 February 2022 / Accepted: 22 February 2022 / Published: 25 February 2022
(This article belongs to the Collection Advances in Cattle Breeding, Genetics and Genomics)

Abstract

:

Simple Summary

Milk production is one of the most important economic traits in dairy cattle. Therefore, determining the genomic regions influencing this trait can improve milk yield. In this study, we collected data from 16 articles associated with milk yield genome-wide association studies (GWAS) on different cattle breeds. Based on the information from the analysis and level of significance (p-value < 2.5 × 10⁻⁶), we identified different genomic regions on chromosomes with the highest marker density, markers with the highest effect, genes within or near these regions, chromosomes with the greatest effects on milk yield.

Abstract

Milk yield (MY) is highly heritable and an economically important trait in dairy livestock species. To increase power to detect candidate genomic regions for this trait, we carried out a meta-analysis of genome-wide association studies (GWAS). In the present study, we identified 19 studies in PubMed for the meta-analysis. After review of the studies, 16 studies passed the filters for meta-analysis, and the number of chromosomes, detected markers and their positions, number of animals, and p-values were extracted from these studies and recorded. The final data set based on 16 GWAS studies had 353,698 cows and 3950 markers and was analyzed using METAL software. Our findings revealed 1712 significant (p-value < 2.5 × 10⁻⁶) genomic loci related to MY, with markers associated with MY found on all autosomes and sex chromosomes and the majority of them found on chromosome 14. Furthermore, gene ontology (GO) annotation was used to explore biological functions of the genes associated with MY; therefore, different regions of this chromosome may be suitable as genomic regions for further research into gene expression.

1. Introduction

Milk is an important natural source of nutrients for the growth of newborn mammals. Different methods have been applied to detect genetic factors affecting milk production in dairy cattle, the most recent of which is genome-wide association studies (GWAS). The ultimate goal of GWAS is to identify the dependency between single nucleotide polymorphisms (SNP) and a trait using high-density markers at the genome surface to detect causative mutations that affect the phenotype of a trait [1]. During the last decade, GWAS has become an important source for generating novel hypotheses in the field of genetics. Therefore, GWASs tend to be suitable for detecting common variants associated with specific phenotypes [2].
Using data from GWAS, the meta-analysis technique is used to detect common genomic regions affecting traits by pooling the results of many studies together. Meta-analysis is an essential tool for synthesizing evidence needed to inform clinical decision making and policy. Systematic reviews summarize available literature using specific search parameters followed by critical appraisal and logical synthesis of multiple primary studies [3]. Nowadays, the meta-analysis technique is used in the agricultural and veterinary sciences in order to resolve inconsistencies in the results of scientific sources. Using the meta-analysis technique, which is a systematic and statistical study, data from different studies can be combined to achieve a single conclusion and interpretation. The reason is that individual studies have some limitations regarding the statistical power and reliability of the results. A meta-analysis by combining data and results of different research improves statistical power and accuracy of estimates [4,5]. Meta-analysis is becoming an increasingly important tool in GWAS studies of complex genetic diseases and traits [6]. The aim of this study was to detect the chromosomal regions related to milk yield using meta-analysis of different cow breeds.

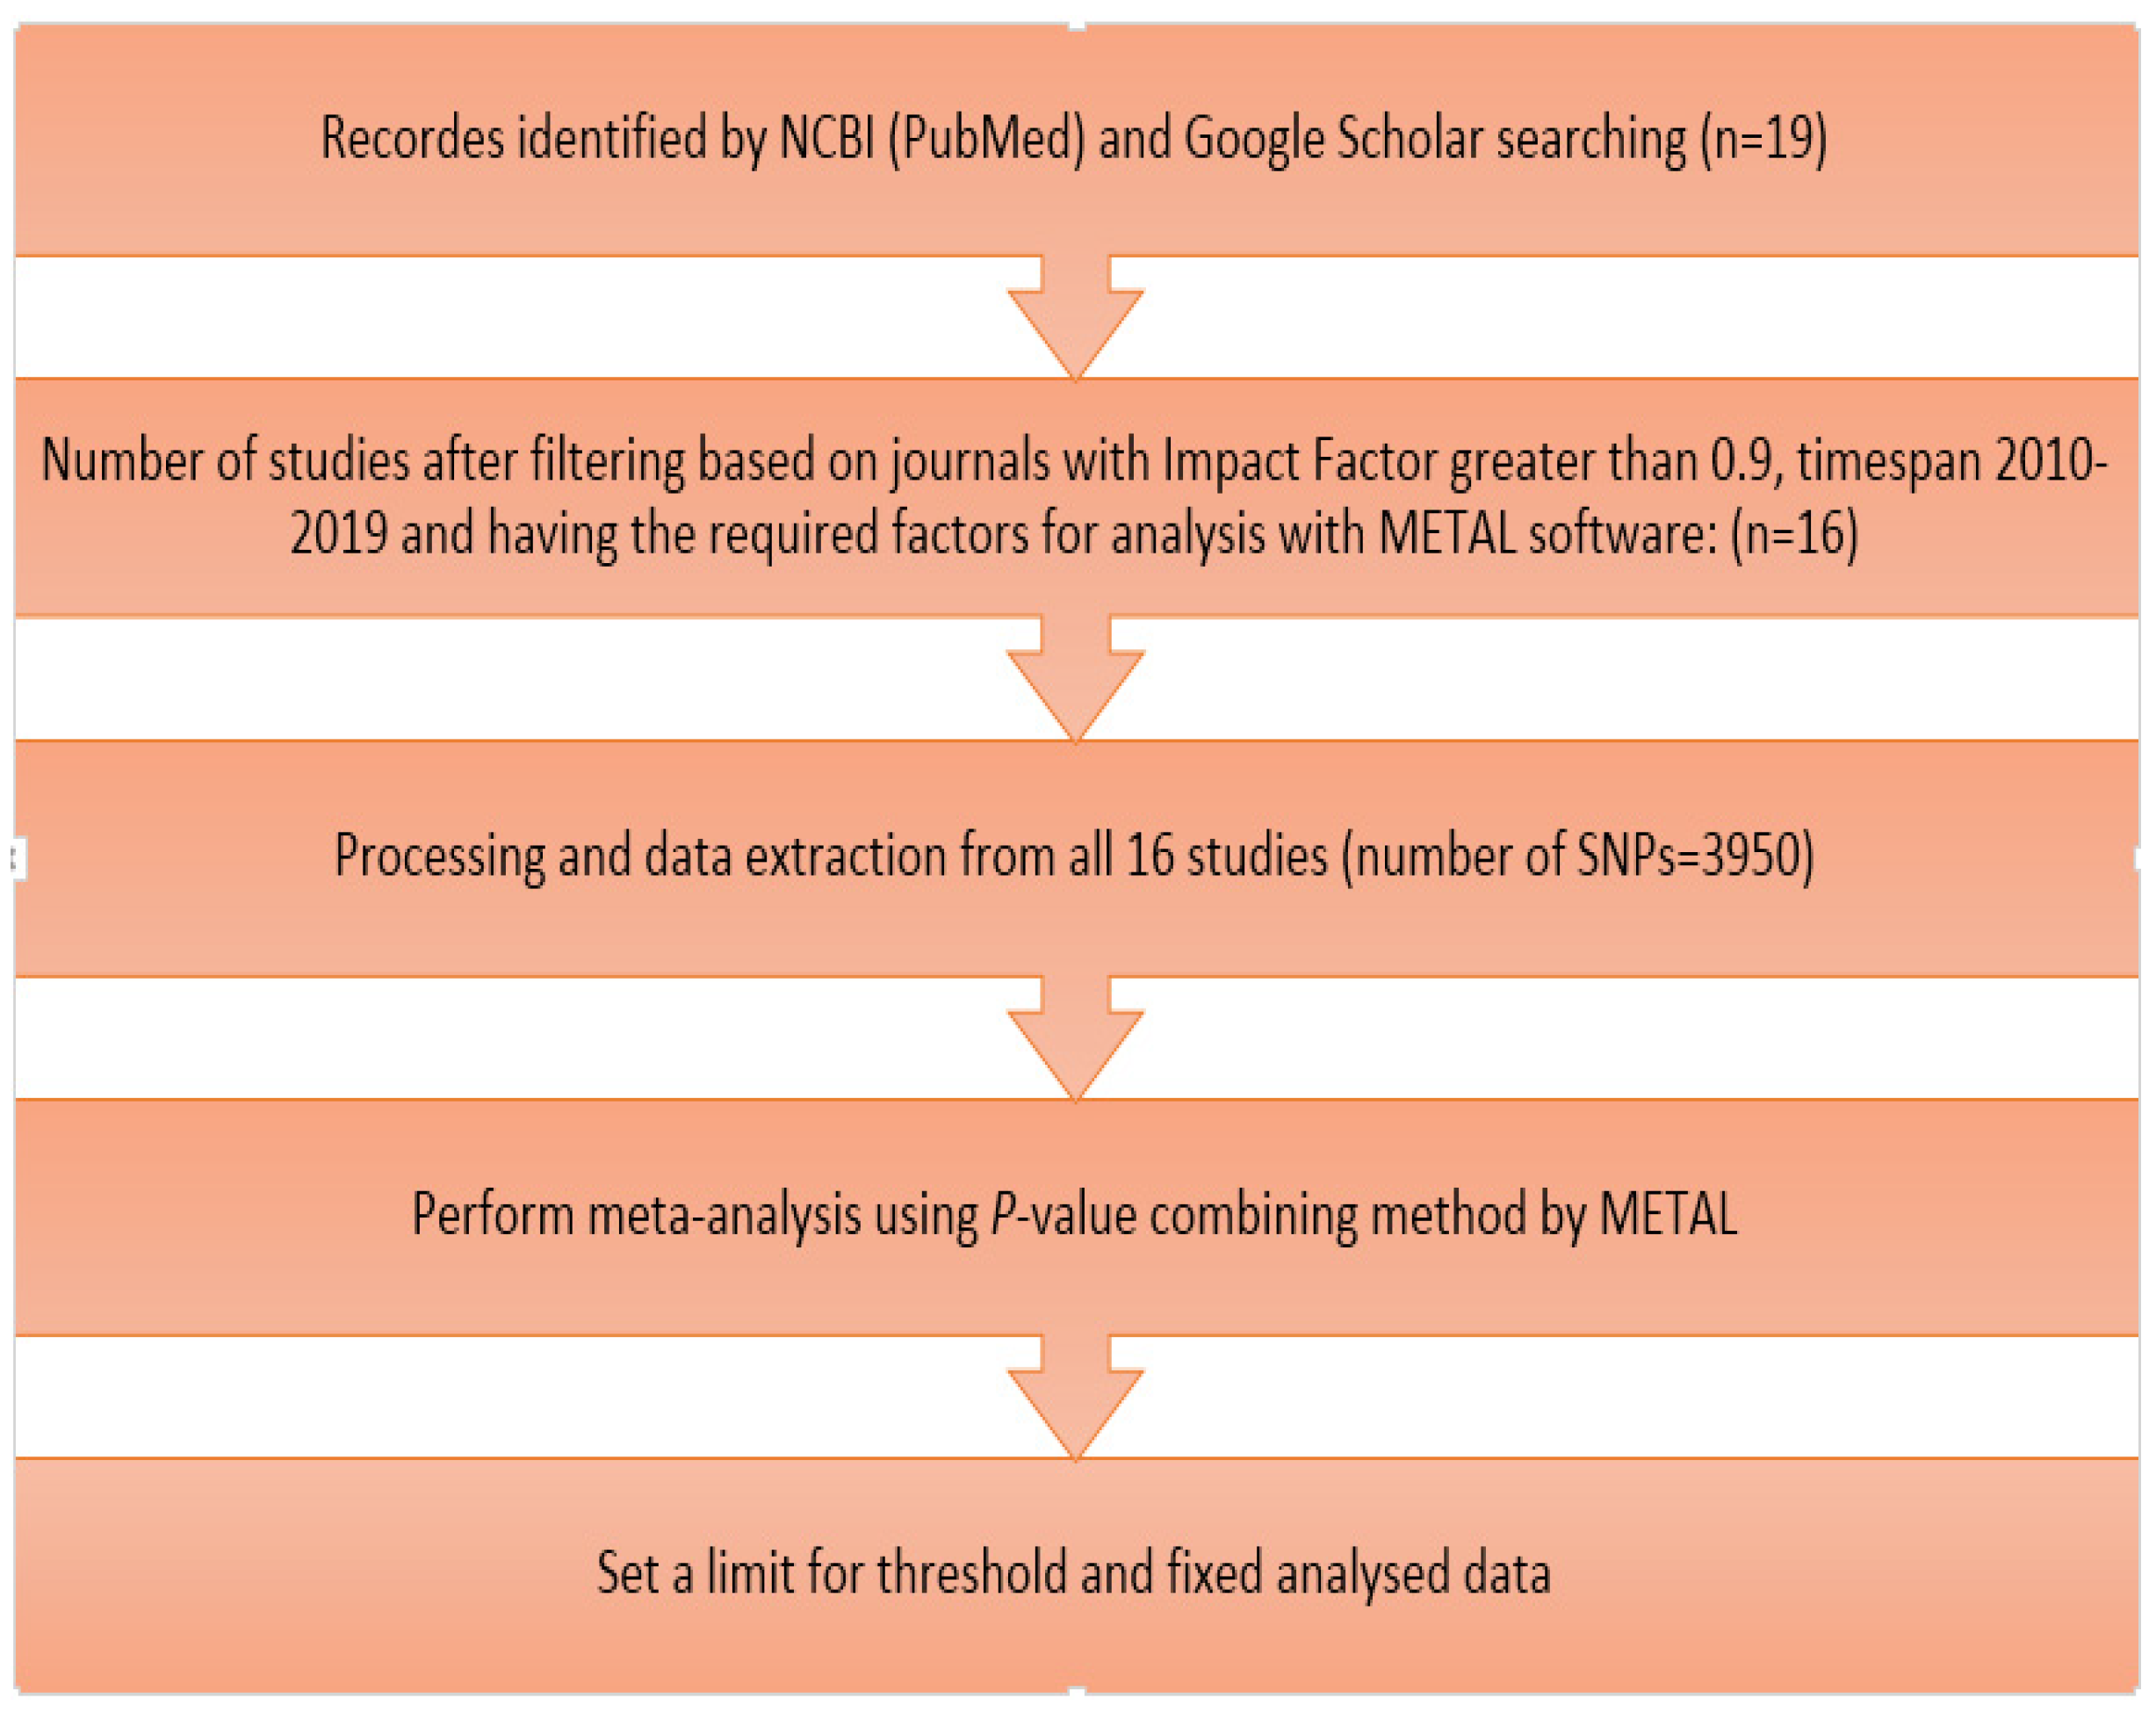
2. Material and Methods

2.1. Data and Literature Review

The review of GWAS studies on cow milk yield regarding the number of chromosomes and SNP positions reveals details of chromosomal regions that affect the trait. In this study, the data from GWAS tests on MY are from Google Scholar (https://scholar.google.ca/, accessed on 12 December 2019) and the National Center for Biotechnology Information site (www.ncbi.nlm.nih.gov, accessed on 27 December 2019) searched (Figure 1). Using different filters including articles in journals with high impact factors (greater than 0.9) and timespan 2010–2019 and also had the required factors for analysis with METAL software, 16 out of 19 studies were used for meta-analysis. The required information such as marker name and the number of their chromosomes, their position on the chromosome, their p-values, and also the number of tested animals of each study was stored in a file. It should be noted that the number of autosomal and sexual SNPs associated with milk yield that were extracted from these 16 articles was 3950.

2.2. Meta-Analysis

The meta-analysis was based on the weighted Z-scores model as implemented in the METAL software [7]. It considers the p-value, direction of effect, and the number of individuals included in each within-population GWAS study [8].
The GWAS meta-analysis showed the effective chromosomes (Figure 2). For the Manhattan plot, a pre-determined genome-wide significance threshold of 2.5 × 10⁻⁶ was calculated with formulae 1 and 2 (α = 0.01).
x = α NO .   SNPs
log x = threshold
Using the Ensembl site (http://ftp.ensembl.org/pub/release-103/gtf/bos_taurus/, accessed on 20 August 2020), the calculated data were checked and the loci of the effective markers and the genes were identified.

2.3. Downstream Analyses
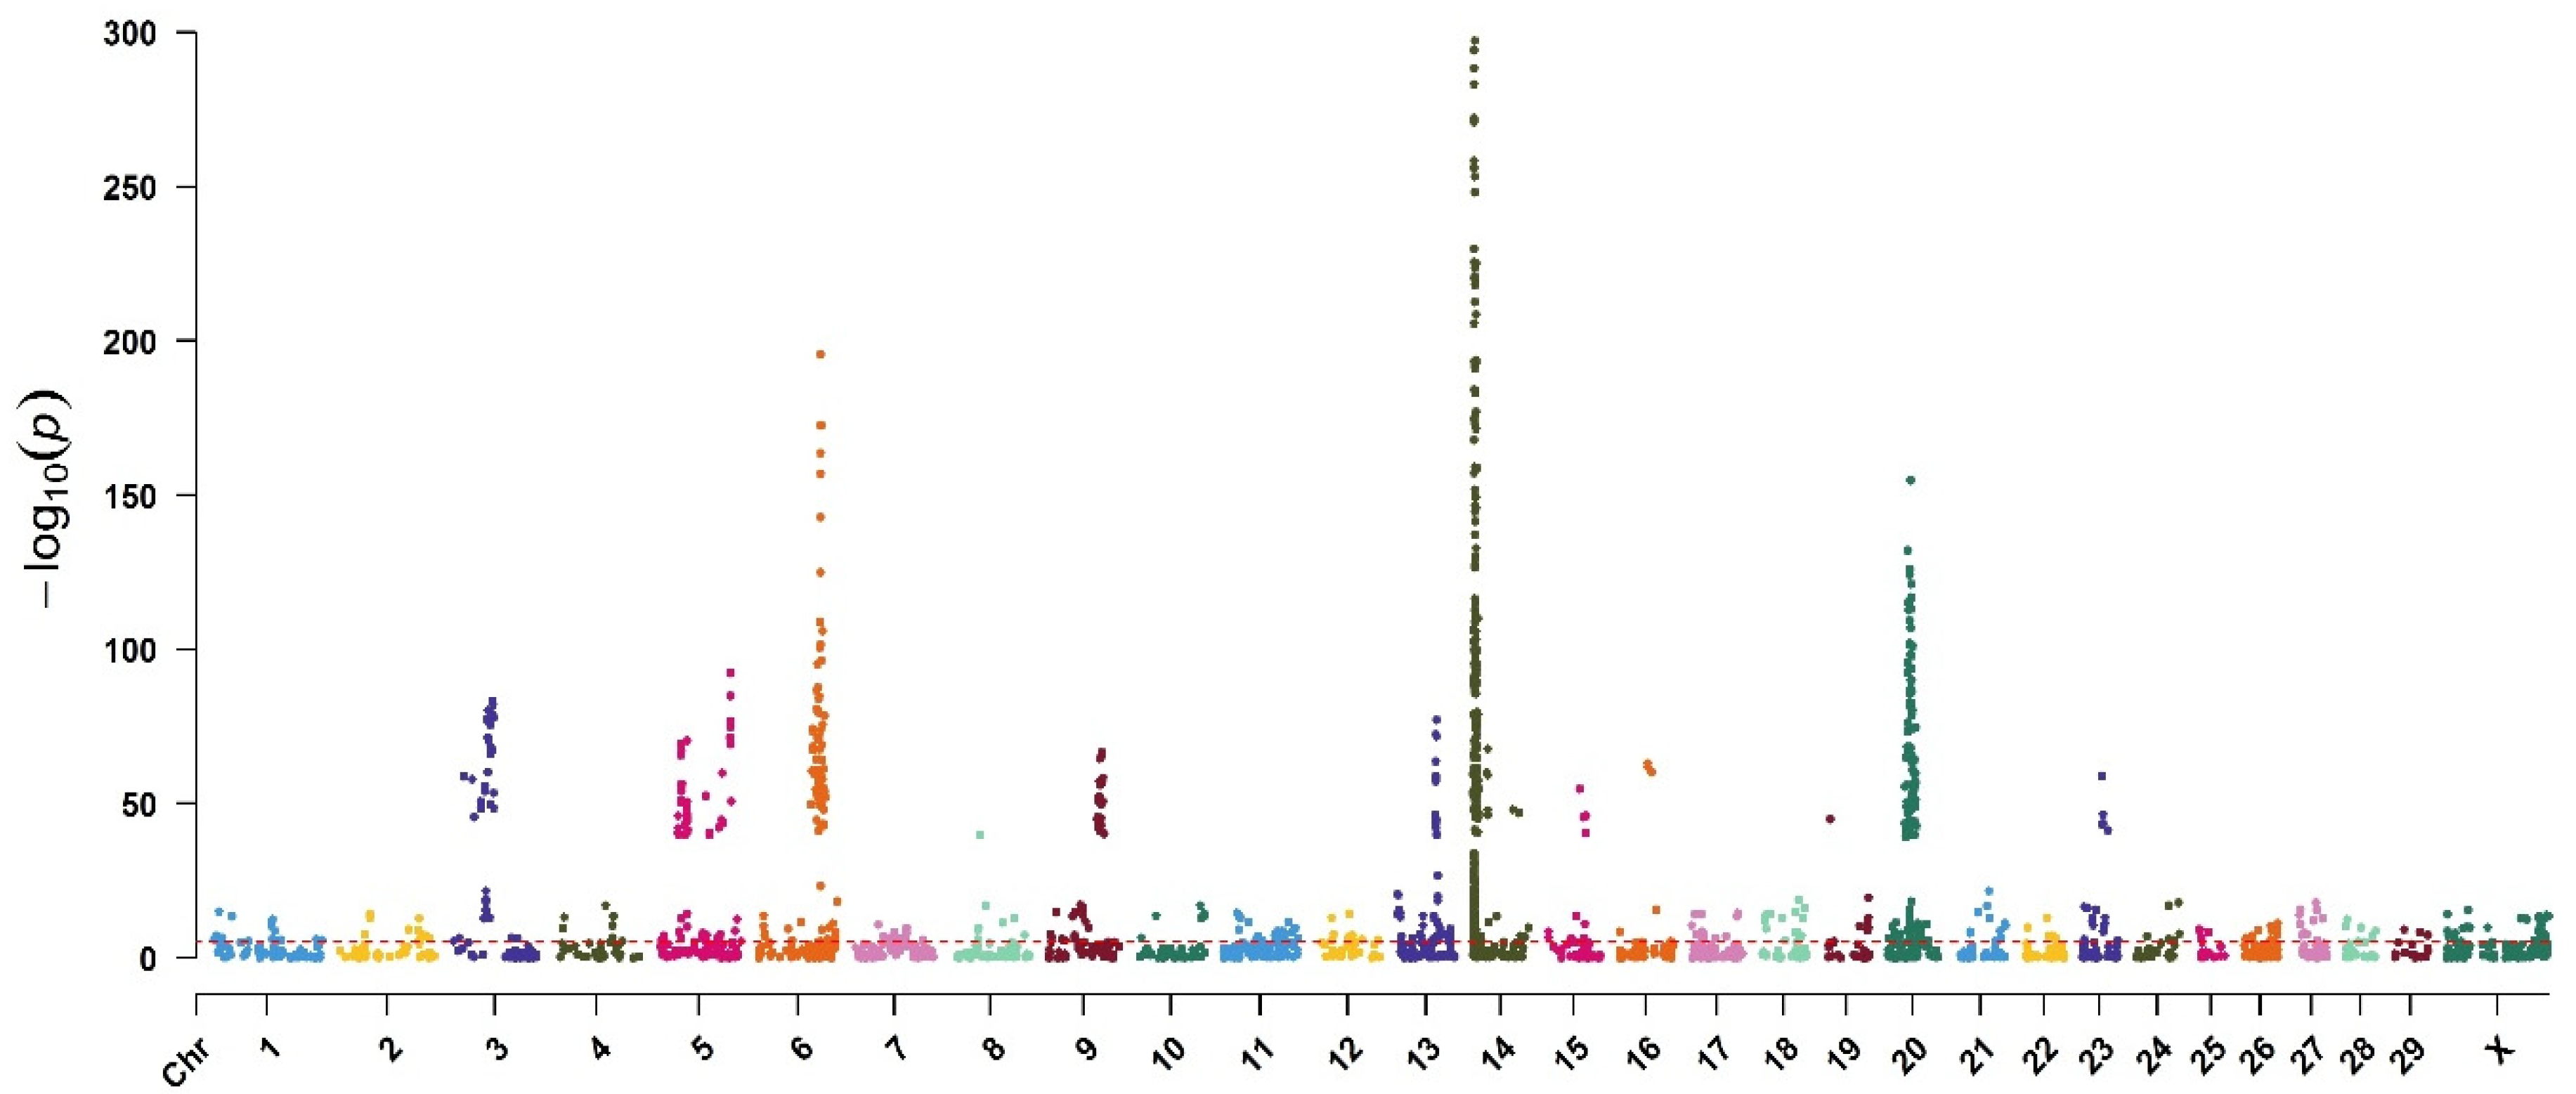
The genes with variants that were significant in the meta-analysis and detected SNPs located on them were used as input for the gene ontology (GO) test. The GO terms (the significance level < 0.05) enrichment analysis with genes found within the top SNPs was performed. Using GO Consortium (https://biit.cs.ut.ee/gprofiler/gost, accessed on 5 February 2021), to investigate the biological processes of genes associated with MY investigated.

3. Results

The number of SNPs affecting the MY with a significance level lower than <2.5 × 10⁻⁶ were 1712 sites located on all chromosomes and mainly on chromosome 14. The GWAS meta-analysis showed the effective chromosomes by the Manhattan plot (Figure 2). The number of effective SNPs on chromosomes 14, 20, 6, and 5 were 950, 224, 87, and 65, respectively (Table 1). The other 386 identified SNPs with significance levels lower than 2.5 × 10⁻⁶ were located on the other 26 sex and autosomal chromosomes. The results showed that fifty-five percent of the effective SNPs related to milk yield were located on chromosome 14.
Results for the top loci by p-value in the meta-analysis, with the most significant SNP per locus, are presented in (Table 2). The significance level of 1712 identified SNPs in the meta-analysis was compared and 5 SNPs of rs109421300, rs135549651, rs109146371, rs109350371, and BovineHD4100003579 had the smallest p-values (Table 2).
The identified SNPs were distributed on 18 genes (regardless of duplicate genes) with the names: DGAT1, ENSBTAG00000015040, RPAP3, ZC3H3, MROH1, MAF1, MAPK15, RHPN1, VPS28, TRAPPC9, ENSBTAT00000065585, ADGRB1, CYHR1, PTK2, PLEC, SCRIB, GML, and FAM135B.
The GO annotation based on biological processes (BP) showed 32 genes involved in biological functions associated with MY. According to the GO term, these candidate genes were found to be enriched in 15 biological processes. All of GO terms for MY-related biological pathways were related to “wound healing”, “metaphase/anaphase transition of meiosis I”, “meiotic chromosome separation”, “cell migration”, “cell motility and locomotion” (Table 3).
The 18 candidate genes for MY resulting from GWAS were associated with the GO terms of PTK2 (wound healing) also in (response to wounding), ENSBTAT00000065585 (wound healing, response to wounding, negative regulation of cellular component movement, intermediate filament cytoskeleton organization, intermediate filament-based process, negative regulation of locomotion, negative regulation of cell migration, negative regulation of cell motility), SCRIB (wound healing, response to wounding, vesicle targeting, neurotransmitter receptor transport postsynaptic membrane to endosome), MAPK15 (vesicle targeting, positive regulation of metaphase/anaphase transition of meiosis I, regulation of metaphase/anaphase transition of meiosis I, positive regulation of meiotic chromosome separation, positive regulation of metaphase/anaphase transition of meiotic cell cycle, negative regulation of cellular component movement, negative regulation of locomotion, negative regulation of cell migration, metaphase/anaphase transition of meiosis I, negative regulation of cell motility), ADGRB1 (negative regulation of cellular component movement, negative regulation of locomotion, negative regulation of cell migration, negative regulation of cell motility), and PLEC (wound healing, response to wounding, intermediate filament cytoskeleton organization, intermediate filament-based process).

4. Discussion

A genome-wide meta-analysis and enrichment analysis for milk yield was conducted according to the results of 16 studies (on 353,698 cows and 3950 SNPs) from all over the world (Table 4). We confirmed substantial contribution of different chromosomal loci associated with MY in cows. Three of the most important SNPs, i.e., rs109421300, rs135549651, and rs109146371, were located on chromosome 14.
These observations support the notion that the suggestive loci identified in this study, have an outstanding effect on MY. Moreover, fifty-five percent or 995 identified SNPs with a significance level lower than the specified level, were located on chromosome 14. Therefore, it can be concluded that chromosome 14 is the most effective chromosome on MY. The description of its different regions adds to the accuracy of this issue.
The study showed that regions 1,489,496 to 5,494,654 of chromosome 14 had the most effective SNPs compared to other regions of this chromosome. This means that all of the top 45 SNPs on chromosome 14 were located in this region. Only 24 SNPs in this region were located on the genes. Given that, the density of markers in some regions, including 1,675,278 to 1,967,325 and 4,336,714 to 4,468,478, was higher than in other regions, so that 13 SNPs from 45 of them were located on these regions and the most influential SNP (p-value: 2.93 × 10−771) in this region was on DGAT1 (Diacylglycerol O-Acyltransferase 1), a protein-coding gene. DGAT1 is an enzyme that catalyzes the synthesis of triglycerides from diglycerides and acyl-coenzyme A [25]. The DGAT1 K232A polymorphism was previously shown to have a significant effect on bovine milk production characteristics (milk yield, protein content, fat content, and fatty acid composition) [25]. The next SNP (p-value: 1.12 × 10−710) was located on the LOC100141215 gene. Therefore, because these regions have the highest density and the greatest effect, it can be said, the regions with the most impact.
In our study, a gene-set enrichment analysis and a group of GO enriched for MY were related to several traits. More accurate results showed the GO_BP: 0,042,060 (wound healing), GO_BP: 0,009,611 (response to wounding), GO_BP: 0,006,903 (vesicle targeting), GO_BP: 1,905,188 (positive regulation of metaphase/anaphase transition of meiosis I), GO_BP: 1,905,186 (regulation of metaphase/anaphase transition of meiosis I), GO_BP: 1,905,134 (positive regulation of meiotic chromosome separation), GO_BP: 1,902,104 (positive regulation of metaphase/anaphase transition of meiotic cell cycle), GO_BP: 0,098,968 (neurotransmitter receptor transport postsynaptic membrane to endosome), GO_BP: 0,051,271 (negative regulation of cellular component movement), GO_BP: 0,045,104 (intermediate filament cytoskeleton organization), GO_BP: 0,045,103 (intermediate filament-based process), GO_BP: 0,040,013 (negative regulation of locomotion), GO_BP: 0,030,336 (negative regulation of cell migration), GO_BP: 1,990,949 (metaphase/anaphase transition of meiosis I), GO_BP: 2,000,146 (negative regulation of cell motility).
In the continuation of this study, for a better understanding of the mechanisms of MY and the genomic regions involved, it was necessary to analyze the candidate regions obtained from the results of this study. After performing downstream analyses and finding the relation between the identified genes and these terms, we investigated the relation between some of them and MY using studies that have been previously conducted.
Wound healing is a localized process that involves inflammation, wound cell migration and mitosis, neovascularization, and regeneration of the extracellular matrix [26]. Milk of the cow, especially low-fat milk, is a rich source of calcium which can play a significant role in the acceleration of wound healing and increment of healing quality [27]. Calcium has an essential role in wound healing; therefore, healing is known as a calcium-dependent process [27].
The metaphase to anaphase transition is a point of no return; the duplicated sister chromatids segregate to the future daughter cells, and any mistake in this process may be deleterious to progeny [28]. The metaphase to anaphase transition is controlled by a ubiquitin-mediated degradation process [28].
Cell migration is a complex process requiring the coordination of numerous inter- and intracellular events, such as cytoskeleton reorganization, matrix remodeling, cell–cell adhesion modulation, and induction of chemoattractants [29]. Cell migration plays an important role in a variety of normal physiological processes. These include embryogenesis, angiogenesis, wound healing, repairing of intestinal mucosal damage, and immune defense [30]. However, in some pathological conditions, such as atherosclerosis or gastrointestinal ulcers, a large area of denudation is commonly found, and an immediate repair by the reestablishment of the intact monolayer of cells is required [31].
Cell motility is the capacity of cells to translocate onto a solid substratum. This behavior is often a hallmark of fibroblastic cells. In epithelial cells, cell motility occurs after the dissociation of a cell from its neighboring cell(s) and after the modification of its position relative to other cells or a solid substrate [32]. Cell motility plays an integral role in many physiologic and pathologic processes, notably organized wound contraction and fibroblast and vascular endothelial cell migration during wound healing, metastatic tumor cell migration, stem cell mobilization and homing, and tissue remodeling [33]. Sufficient information is not available about other terms and their relation to MY and this requires further investigation.
For a better understanding of the mechanisms of milk production, it is suggested that more downstream analysis on the proposed region affecting MY including pathway analysis is carried out. Furthermore, it may be needed to review the contribution of the genes located in that region on the MY variance. For example, DGAT1, which is a major gene for MY, had the highest significant level in this study. Banabazi et al. (2016) have identified SNPs located on the transcribed regions and their 100 K proposed panel performed 2% better than the 700 K panel [34]. It is suggested to check the SNPs located on the candidate region among 1019 loci that they discovered on the transcriptome of chromosome 14 and 24,842 SNPs located on a high-density commercial SNP array (700 K) on the same chromosome. In addition, the comparison between Bos-taurus and Bos-indicus cattle may highlight the importance of the candidate region.

5. Conclusions

The most effective SNPs and genes which affect milk yield are located on chromosome 14, and the regions between 1,489,496 to 5,494,654 have the most effective SNPs in terms of the significance level. Emphasis on the use of these SNPs could justify a large part of the genetic variance in MY. Downstream analyses in these regions also partially demonstrated the mechanism of the effect of genes associated with MY in these regions. Additional analysis can help better understand the mechanism of MY in these regions.

Author Contributions

Conceptualization, M.H.B.; Methodology, L.T. and M.H.B.; Software, L.T.; Validation, M.H.B., N.E.-K., A.N. and I.I.; Formal analysis, M.H.B.; Investigation, L.T.; Resources, M.H.B.; Data curation, L.T. and M.H.B.; Writing—original draft preparation, L.T.; Writing—review & editing, M.H.B., N.E.-K., A.N. and I.I.; Visualization, L.T.; Supervision, M.H.B., N.E.-K., A.N. and I.I.; Project administration, M.H.B., N.E.-K., A.N. and I.I. All authors have read and agreed to the published version of the manuscript.

Funding

This research received no external funding.

Acknowledgments

This research was conducted with the support of Animal Science Research Institute of Karaj, Iran. We would like to thank Morteza Bitaraf Sani from Animal Science Research Department in Yazd, Iran, and also Siavash Salek Ardestani for their technical assistance.

Conflicts of Interest

The authors declare no conflict of interest.

References

  1. Goddard, M.E.; Hayes, B.J. Mapping genes for complex traits in domestic animals and their use in breeding programmes. Nat. Rev. Genet. 2009, 10, 381–391. [Google Scholar] [CrossRef] [PubMed]
  2. Visscher, P.M.; Brown, M.A.; McCarthy, M.I.; Yang, J. Five years of GWAS discovery. Am. J. Hum. Genet. 2012, 90, 7–24. [Google Scholar] [CrossRef] [PubMed] [Green Version]
  3. Gopalakrishnan, S.; Ganeshkumar, P. Systematic reviews and metaanalysis: Understanding the best evidence in primary healthcare. J. Fam. Med. Prim. 2013, 2, 9–14. [Google Scholar]
  4. Ramasamy, A.; Mondry, A.; Holmes, C.C.; Altman, D.G. Key issues in conducting a meta-analysis of gene expression microarray datasets. PLoS Med. 2008, 5, e184. [Google Scholar] [CrossRef]
  5. Sharifi, S.; Pakdel, A.; Ebrahimi, M.; Reecy, J.M.; Fazeli Farsani, S.; Ebrahimie, E. Integration of machine learning and meta-analysis identifies the transcriptomic bio-signature of mastitis disease in cattle. PLoS ONE 2018, 13, e0191227. [Google Scholar] [CrossRef] [PubMed] [Green Version]
  6. De Bakker, P.I.W.; Ferreira, M.A.R.; Jia, X.; Neale, B.M.; Raychaudhuri, S.; Voight, B.F. Practical aspects of imputation-driven meta-analysis of genome-wide association studies. Hum. Mol. Genet. 2008, 17, R122–R128. [Google Scholar] [CrossRef] [Green Version]
  7. Willer, C.J.; Li, Y.; Abecasis, G.R. METAL: Fast and efficient meta-analysis of genomewide association scans. Bioinformatics 2010, 26, 2190–2191. [Google Scholar] [CrossRef]
  8. Van den Berg, I.; Xiang, R.; Jenko, J.; Pausch, H.; Boussaha, M.; Schrooten, C.; Tribout, T.; Gjuvsland, A.B.; Boichard, D.; Nordbø, O.; et al. Meta-analysis for milk fat and protein percentage using imputed sequence variant genotypes in 94,321 cattle from eight cattle breeds. Genet. Sel. Evol. 2020, 52, 37. [Google Scholar] [CrossRef]
  9. El-Halawany, N.; Abdel-Shafy, H.; Shawkya, A.E.M.A.; Abdel-Latif, M.A.; Al-Tohamy, A.F.M.; Abd El-Moneim, O.M. Genome-wide association study for milk production in Egyptian buffalo. Livest. Sci. 2017, 198, 10–16. [Google Scholar] [CrossRef]
  10. Yodklaew, P.; Koonawootrittriron, S.; Elzo, M.A.; Suwanasopee, T.; Laodim, T. Genome-wide association study for lactation characteristics, milkyield and age at first calving in a Thai multibreed dairy cattle population. Agric. Nat. Resour. 2017, 51, 223–230. [Google Scholar]
  11. Jiang, L.; Liu, J.; Sun, D.; Ma, P.; Ding, X.; Yu, Y.; Zhang, Q. Genome wide association studies for milk production traits in chinese holstein population. PLoS ONE 2010, 5, e13661. [Google Scholar] [CrossRef] [PubMed] [Green Version]
  12. Ning, C.; Wang, D.; Zheng, X.; Zhang, Q.; Zhang, S.; Mrode, R.; Liu, J.F. Eigen decomposition expedites longitudinal genome-wide association studies for milk production traits in Chinese Holstein. Genet. Sel. Evol. 2018, 50, 12. [Google Scholar] [CrossRef] [PubMed] [Green Version]
  13. Yue, S.J.; Zhao, Y.Q.; Gu, X.R.; Yin, B.; Jiang, Y.L.; Wang, Z.H.; Shi, K.R. A genome-wide association study suggests new candidate genes for milk production traits in Chinese Holstein cattle. Anim. Genet. 2017, 48, 677–681. [Google Scholar] [CrossRef] [PubMed]
  14. Jiang, L.; Liu, X.; Yang, J.; Wang, H.; Jiang, J.; Liu, L.; He, S.; Ding, X.; Liu, J.; Zhang, Q. Targeted resequencing of GWAS loci reveals novel genetic variants for milk production traits. BMC Genom. 2014, 15, 1105. [Google Scholar] [CrossRef] [PubMed] [Green Version]
  15. Meredith, B.K.; Kearney, F.J.; Finaly, E.K.; Bradly, D.G.; Fahey, A.G.; Berry, D.P.; Lynn, D.J. Genome-wide associations for milk production and somatic cell score in Holstein-Friesian cattle in Ireland. BMC Genet. 2012, 13, 21. [Google Scholar] [CrossRef] [Green Version]
  16. Iso-Touru, T.; Sahana, G.; Guldbrandtsen, B.; Lund, M.S.; Vilkki, J. Genome-wide association analysis of milk yield traits in Nordic Red Cattle using imputed whole genome sequence variants. BMC Genet. 2016, 17, 55. [Google Scholar] [CrossRef] [Green Version]
  17. Fang, L.; Sahana, G.; Su, G.; Yu, Y.; Zhang, S.; Lund, M.S.; Sorensen, P. Integrating sequence-based GWAS and RNA-Seq provides novel insights into the genetic basis of mastitis and milk production in dairy cattle. Sci. Rep. 2017, 7, 45560. [Google Scholar] [CrossRef]
  18. Guo, J.; Jorjani, H.; Carlborg, O. A genome-wide association study using international breeding-evaluation data identifies major loci affecting production traits and stature in the Brown Swiss cattle breed. BMC Genet. 2012, 13, 82. [Google Scholar] [CrossRef] [Green Version]
  19. Deng, T.; Liang, A.; Liang, S.; Ma, X.; Lu, X.; Duan, A.; Pang, C.; Hua, G.; Liu, S.; Campanile, G.; et al. Integrative analysis of transcriptome and GWAS data to identify the hub genes associated with milk yield trait in buffalo. Front. Genet. 2019, 10, 36. [Google Scholar] [CrossRef] [Green Version]
  20. Liu, J.J.; Liang, A.X.; Campanile, G.; Plastow, G.; Zhang, C.; Wang, Z.; Salzano, A.; Gasparrini, B.; Cassandro, M.; Yang, L.G. Genome-wide association studies to identify quantitative trait loci affecting milk production traits in water buffalo. J. Dairy Sci. 2018, 101, 433–444. [Google Scholar] [CrossRef] [Green Version]
  21. Jiang, J.; Ma, L.; Prakapenka, D.; VanRaden, P.M.; Cole, J.B.; Da, Y. A large-scale genome-wide association study in U.S. Holstein cattle. Front. Genet. 2019, 10, 412. [Google Scholar] [CrossRef] [PubMed]
  22. Nayeri, S.; Sargolzaei, M.; Abo-Ismail, M.K.; May, N.; Miller, S.P.; Schenkel, F.; Moore, S.S.; Stothard, P. Genome-wide association for milk production and female fertility traits in Canadian dairy Holstein cattle. BMC Genet. 2016, 17, 75. [Google Scholar] [CrossRef] [PubMed] [Green Version]
  23. Cole, J.B.; Wiggans, G.R.; Ma, L.; Sonstegard, T.S.; Lawlor, T.J., Jr.; Crooker, B.A.; Tassell, C.P.V.; Yang, J.; Wang, S.; Matukumalli, L.K.; et al. Genome-wide association analysis of thirty one production, health, reproduction and body conformation traits in contemporary U.S. Holstein cows. BMC Genom. 2011, 12, 408. [Google Scholar] [CrossRef] [PubMed] [Green Version]
  24. Raven, L.A.; Cocks, B.G.; Hayes, B.J. Multibreed genome wide association can improve precision of mapping causative variants underlying milk production in dairy cattle. BMC Genom. 2014, 15, 62. [Google Scholar] [CrossRef] [Green Version]
  25. Jing, L.; Boeren, S.; Hooijdonk, T.V.; Vervoort, J.; Hettinga, K. Effect of the DGAT1 K232A genotype of dairy cows on the milk metabolome and proteome. J. Dairy Sci. 2015, 98, 3460–3469. [Google Scholar]
  26. Schultz, G.; Rotatori, D.S.; Clark, W. EGF and TGF-α in Wound Healing and Repair. J. Cell. Biochem. 1991, 45, 346–352. [Google Scholar] [CrossRef]
  27. Hemmati, A.A.; Larki-Harchegani, A.; Shabib, S.; Jalali, A.; Rezaei, A.; Housmand, G. Wound healing property of milk in full thickness wound model of rabbit. Int. J. Surg. 2018, 54, 133–140. [Google Scholar] [CrossRef]
  28. Katie, A.; Cohen-Fix, F.; Cohen-Fix, O. The metaphase to anaphase transition A case of productive destruction. Eur. J. Biochem. 1999, 263, 14–19. [Google Scholar]
  29. Friedl, P. Prespecification and plasticity: Shifting mechanisms of cell migration. Cell Biol. 2004, 16, 14–23. [Google Scholar] [CrossRef]
  30. Friedl, P.; Wolf, K. Tumour-cell invasion and migration: Diversity and escape mechanisms. Nat. Rev. Cancer 2003, 3, 362–374. [Google Scholar] [CrossRef]
  31. Yue, P.Y.K.; Leung, E.P.Y.; Mak, N.K.; Wong, R.N.S. A Simplified Method for Quantifying Cell Migration/Wound Healing in 96-Well Plates. J. Biomol. Screen. 2010, 15, 427–433. [Google Scholar] [CrossRef] [PubMed] [Green Version]
  32. Jouanneau, J.; Thiery, J.P. Encyclopedia of Cancer, 2nd ed.; Tumor Cell Motility and Invasion Chapter; Academic Press: Cambridge, MA, USA, 2002; pp. 467–473. [Google Scholar]
  33. Caliari, S.R.; Harley, B.A.C. Comprehensive Biomaterials, Biologically Inspired and Biomolecular Materials chapter. ScienceDirect 2011, 2, 279–302. [Google Scholar]
  34. Banabazi, M.H.; Javaremi, A.N.; Imumorin, I.G.; Ghaderi-Zefrei, M.; Miraei Ashtiani, S.R. Single nucleotide polymorphisms (SNP) on transcriptome of Holstein cows shared with Illumina bovine SNP arrays. Online J. Vet. Res. 2016, 20, 177–182. [Google Scholar]
Figure 1. Flowchart of the meta-analysis of milk yield.
Animals 12 00582 g001
Figure 2. Manhattan plot of the GWAS meta-analysis for milk yield. Red line indicates p = 2.5 × 10⁻⁶.
Animals 12 00582 g002
Table 1. The length of each chromosome and number of effective SNPs on them.
CHR NumberLength (bp)No. SNPs on CHR
1158,337,06715
2137,060,42410
3121,430,40541
4120,829,6996
5121,191,42465
6119,458,73687
7112,638,65912
8113,384,8369
9105,708,25035
10104,305,0166
11107,310,76323
1291,163,1259
1384,2403,5045
1484,648,390950
1585,296,67613
1681,724,6875
1775,158,59613
1866,004,02314
1964,057,45712
2072,042,655224
2171,599,09610
2261,435,8745
2352,530,06217
2462,714,93016
2542,904,17013
2651,681,46411
2745,407,90211
2846,312,5465
2951,505,2243
X148,823,89934
1712
Table 2. The detailed information of top 50 detected SNPs via meta-analysis in milk yield.
CHR NumberSNP NamePositionOverlapped Genesp-Value
14rs1094213001801116DGAT12.93 × 10−771
14rs1355496511967325ENSBTAG000000150401.12 × 10−710
14rs1091463711651311 1.82 × 10−653
14rs1093503712054457 1.90 × 10−637
5BovineHD41000035732784231RPAP33.10 × 10−416
14rs1095580462909929 1.44 × 10−396
14rs1097524391489496 1.17 × 10−366
14rs1101999012524432 4.10 × 10−298
14rs1107062842398876ZC3H36.76 × 10−295
14rs416277642276443 5.13 × 10−289
14rs416297502002873 6.61 × 10−284
14rs1372058091892559MROH16.36 × 10−273
14rs1377879311880378MROH11.44 × 10−272
14rs1331197261868636MROH19.39 × 10−272
14rs1097426072217163 4.47 × 10−259
14rs412569191923292MAF13.28 × 10−257
14rs1103236352239085MAPK159.29 × 10−257
14rs1095292192468020RHPN15.37 × 10−254
14rs1100607852553525 6.91 × 10−249
14rs178707361696470VPS281.86 × 10−230
14rs1108927542117455 2.82 × 10−226
14rs1090862644414829TRAPPC97.94 × 10−226
14rs1101746512754909 3.71 × 10−224
14rs1368918532764862 2.95 × 10−221
14rs1107496532138926ENSBTAT000000655853.89 × 10−221
14rs1104112733640788 1.20 × 10−219
14rs1106269842674264 8.13 × 10−219
14rs290246883297177 2.57 × 10−213
14rs556171604468478TRAPPC93.02 × 10−209
14rs1349744382150825 2.63 × 10−206
6rs11052722488592295 3.23 × 10−196
14rs1101430874767039 1.51 × 10−194
14rs1095301644456595TRAPPC92.40 × 10−194
14rs1377579782164419 6.16 × 10−194
14rs1092255944848750 1.00 × 10−193
14rs1095450183006509ADGRB16.81 × 10−192
14rs1099685151675278CYHR15.37 × 10−185
14rs1102512374068825 1.70 × 10−184
14rs1101853454043743PTK24.90 × 10−184
14rs1110186784336714TRAPPC97.76 × 10−178
14rs1373096623371507 2.57 × 10−176
14rs1352700112084067PLEC2.82 × 10−175
14rs1089927462951045ADGRB17.76 × 10−174
6rs13714746288887995 2.63 × 10−173
6rs11069487589139865 2.75 × 10−173
14rs1100173794364952TRAPPC94.07 × 10−172
14rs416025302194228SCRIB1.66 × 10−168
6rs4276648088891318 2.82 × 10−164
14rs7192091052741434GML8.32 × 10−160
14rs1105019425494654FAM135B1.74 × 10−159
Table 3. Significant biological process associated with genes affecting milk yield.
Term IDTerm Namep-Value (Adj)Gene NameNumber
GO:0042060Wound healing0.033647963ENSBTAT00000065585, PTK2, PLEC, SCRIB4
GO:0009611Response to wounding0.039101239ENSBTAT00000065585, PTK2, PLEC, SCRIB4
GO:0006903Vesicle targeting0.048695181MAPK15, SCRIB2
GO:1905188Positive regulation of metaphase/anaphase transition of meiosis I0.048695181MAPK151
GO:1905186Regulation of metaphase/anaphase transition of meiosis I0.048695181MAPK151
GO:1905134Positive regulation of meiotic chromosome separation0.048695181MAPK151
GO:1902104Positive regulation of metaphase/anaphase transition of meiotic cell cycle0.048695181MAPK151
GO:0098968Neurotransmitter receptor transport postsynaptic membrane to endosome0.048695181SCRIB1
GO:0051271Negative regulation of cellular component movement0.048695181MAPK15, ENSBTAT00000065585, ADGRB13
GO:0045104Intermediate filament cytoskeleton organization0.048695181ENSBTAT00000065585, PLEC2
GO:0045103Intermediate filament-based process0.048695181ENSBTAT00000065585, PLEC2
GO:0040013Negative regulation of locomotion0.048695181MAPK15, ENSBTAT00000065585, ADGRB13
GO:0030336Negative regulation of cell migration0.048695181MAPK15, ENSBTAT00000065585, ADGRB13
GO:1990949Metaphase/anaphase transition of meiosis I0.048695181MAPK151
GO:2000146Negative regulation of cell motility0.048695181MAPK15, ENSBTAT00000065585, ADGRB13
Note: GO enrichment analysis was performed in candidate genes associated with milk yield (p-value < 2.5 × 10−6).
Table 4. Identified SNPs on each continent. Data extracted from scientific literature published from 2010 to 2019.
ContinentStudiesN 1No. SNPs 2Refs.
Africa125020[9]
Asia513,18874[10,11,12,13,14]
Europe522,3841542[15,16,17,18,19]
North America4299,9512309[20,21,22,23]
Australia117,9255[24]
Global16353,6983950
1 N, number of animals tested; 2 no. SNPs, number of detected SNPs on cows in each continent.
Publisher’s Note: MDPI stays neutral with regard to jurisdictional claims in published maps and institutional affiliations.

