
Evaluation of Prolonged Endometrial Inflammation Associated with the Periparturient Metabolic State in Dairy Cows

Abstract
Simple Summary
Abstract
1. Introduction
2. Materials and Methods
2.1. Animals, Housing, and Feeding
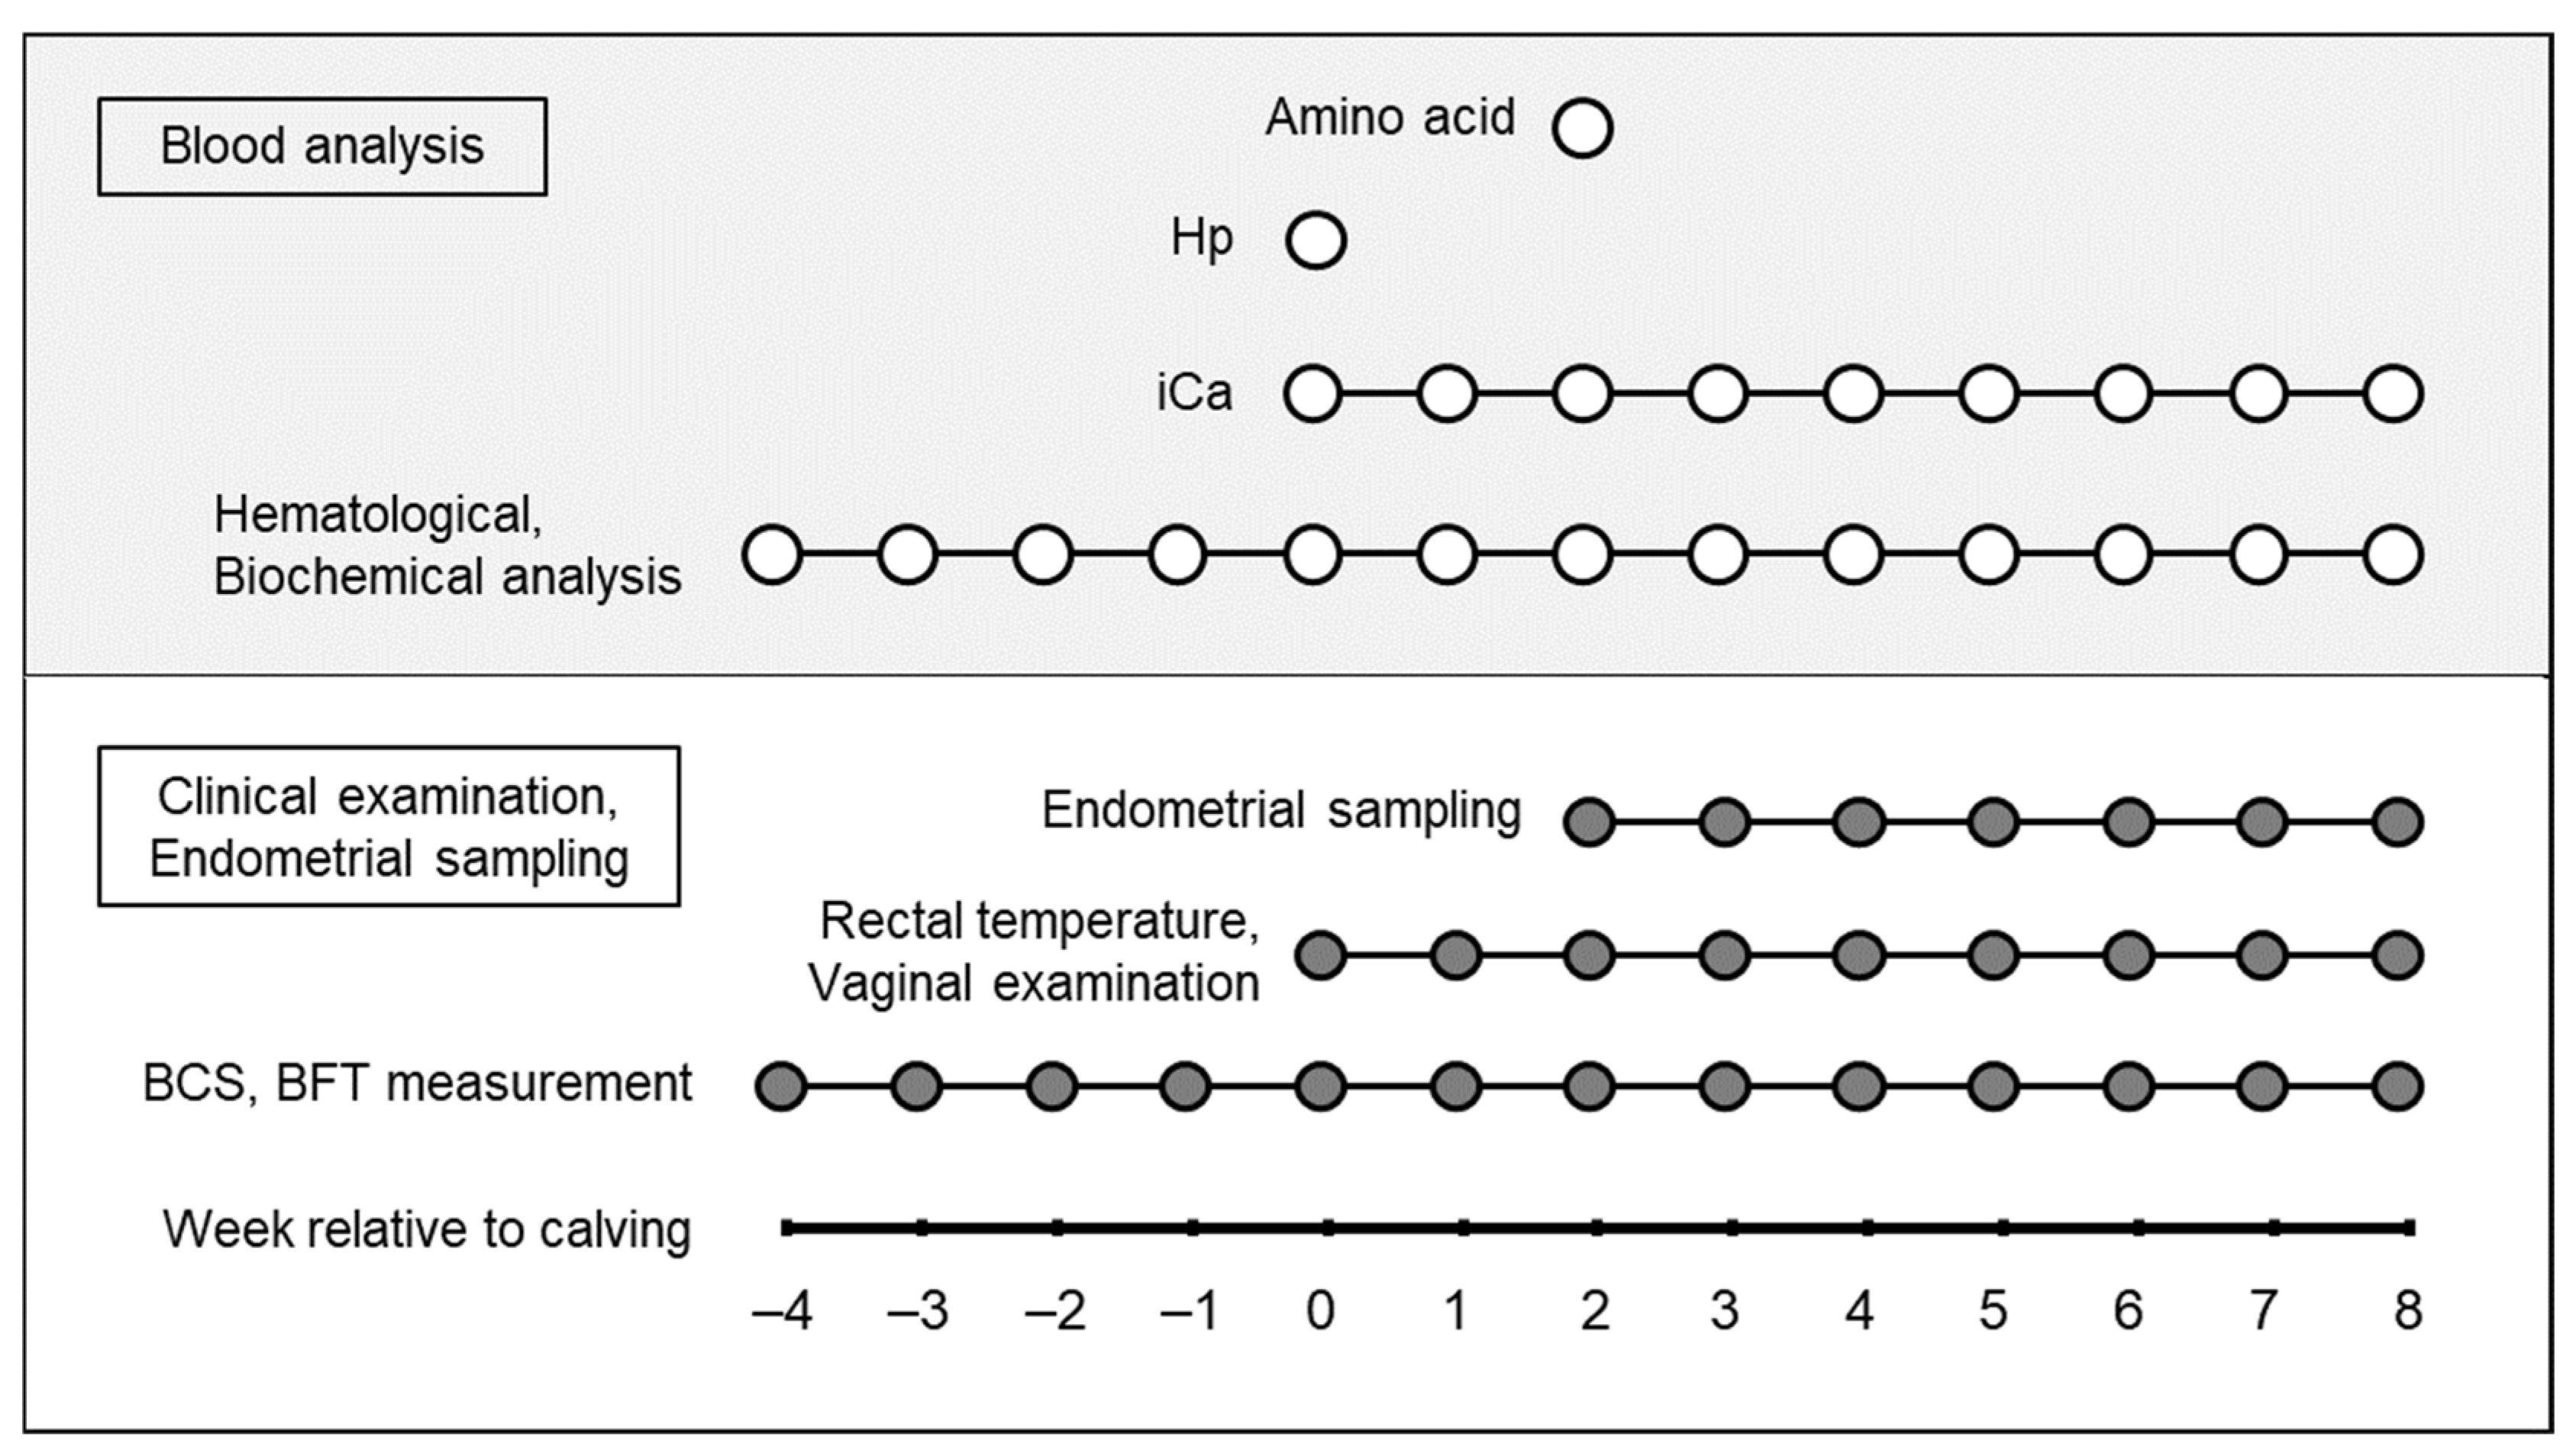
2.2. Study Design
2.3. BCS Measurement
2.4. BFT Measurement
2.5. Rectal Temperature Measurement
2.6. Blood Sampling
2.7. Serum Biochemical Analysis
2.8. Whole Blood Analysis
2.9. Blood Hp Measurement
2.10. Blood Amino Acid Measurement
2.11. Evaluation of Endometrial Inflammation
2.12. Vaginal Examination
2.13. Daily Milk Production
2.14. Statistical Analysis
3. Results
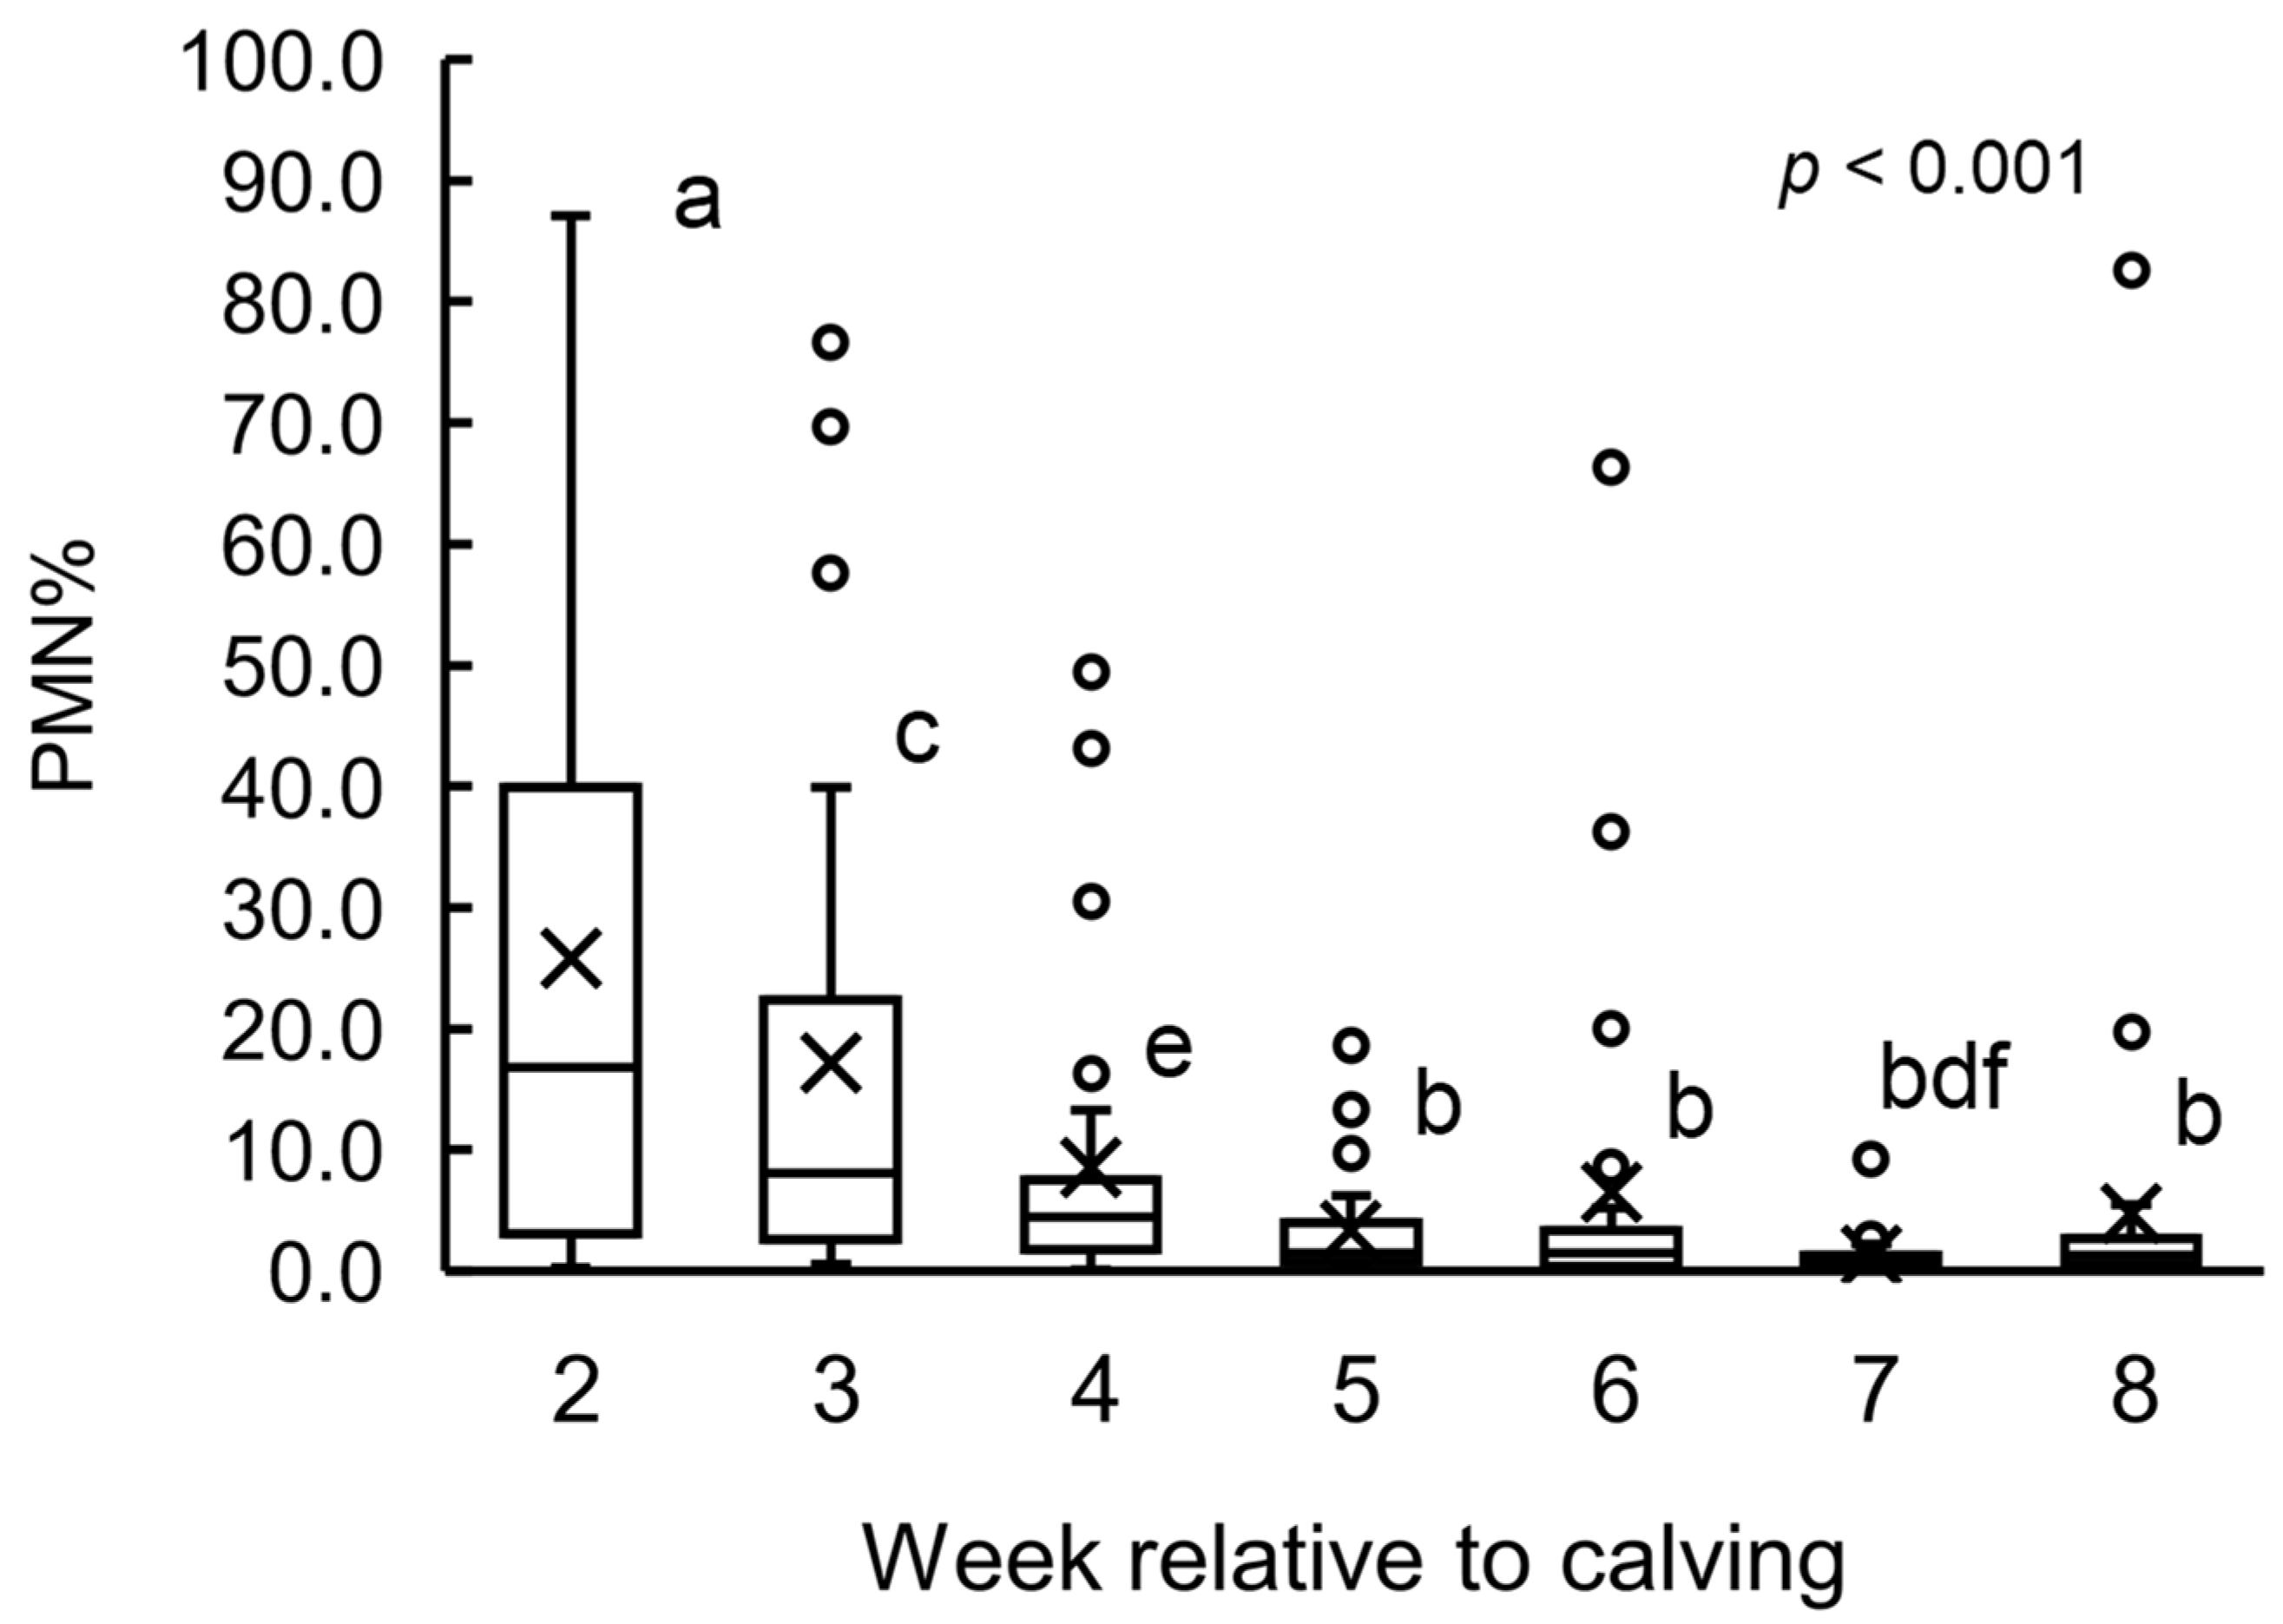
3.1. PMN% Change
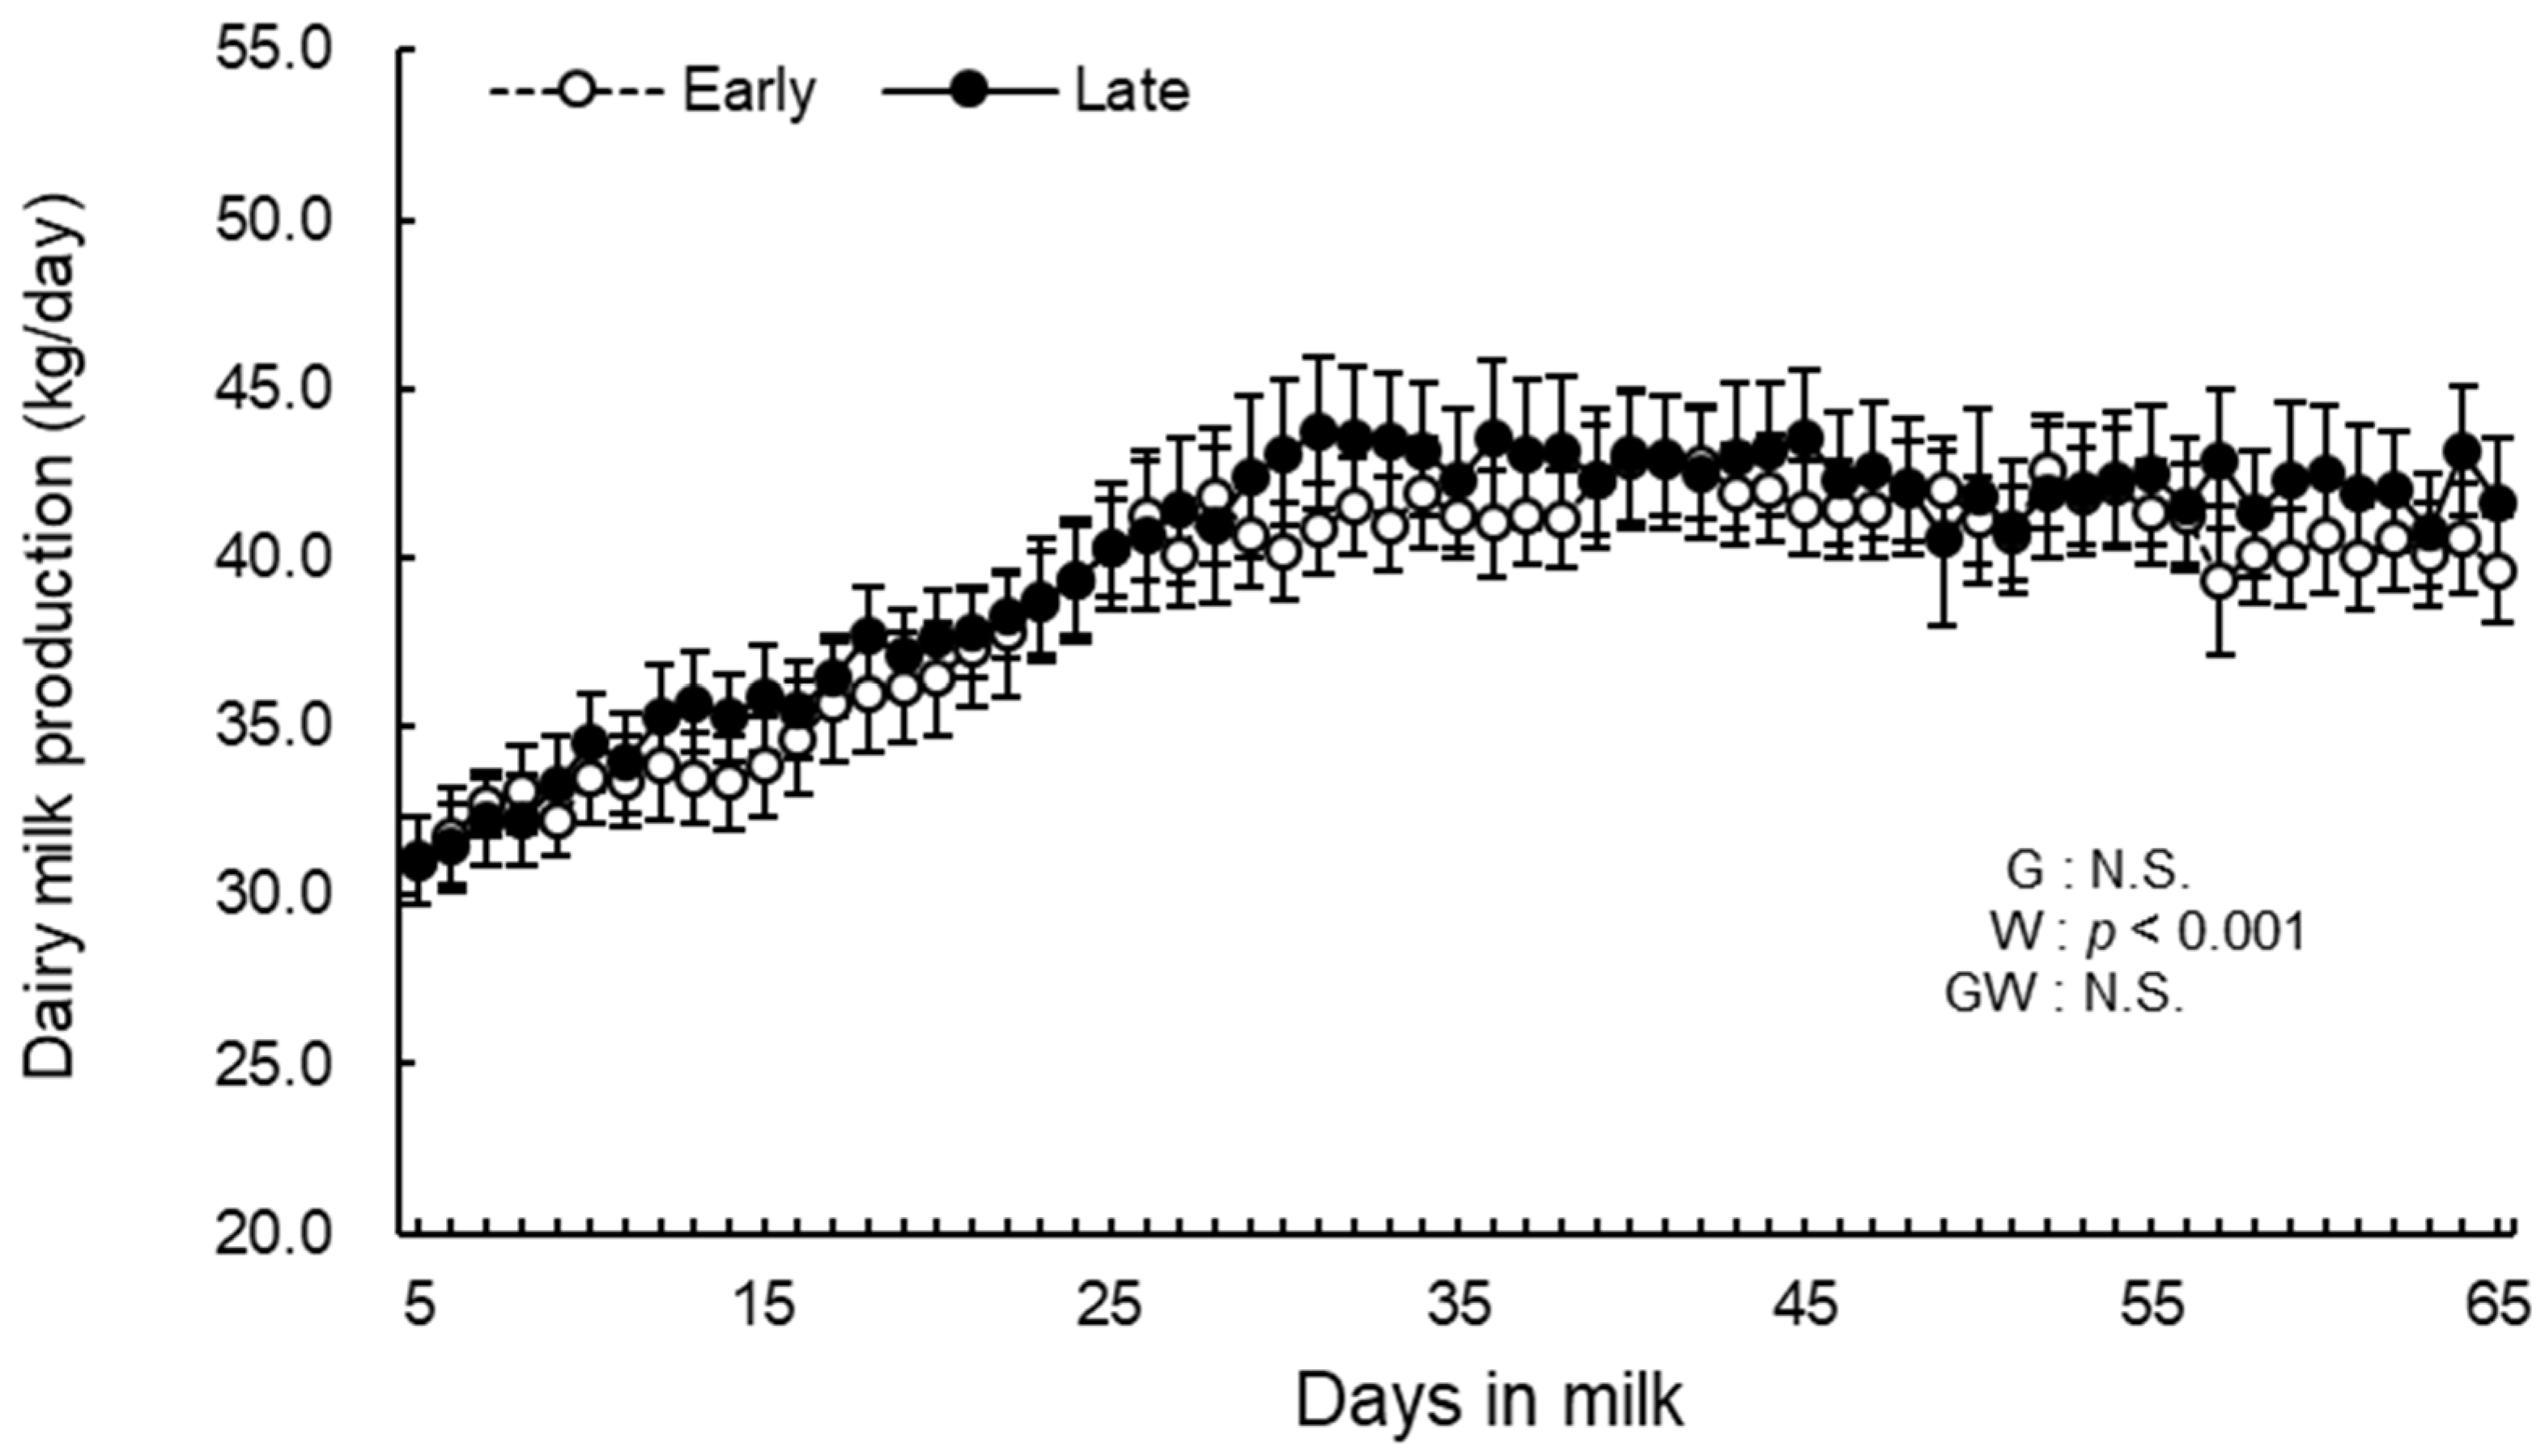
3.2. Daily Milk Production
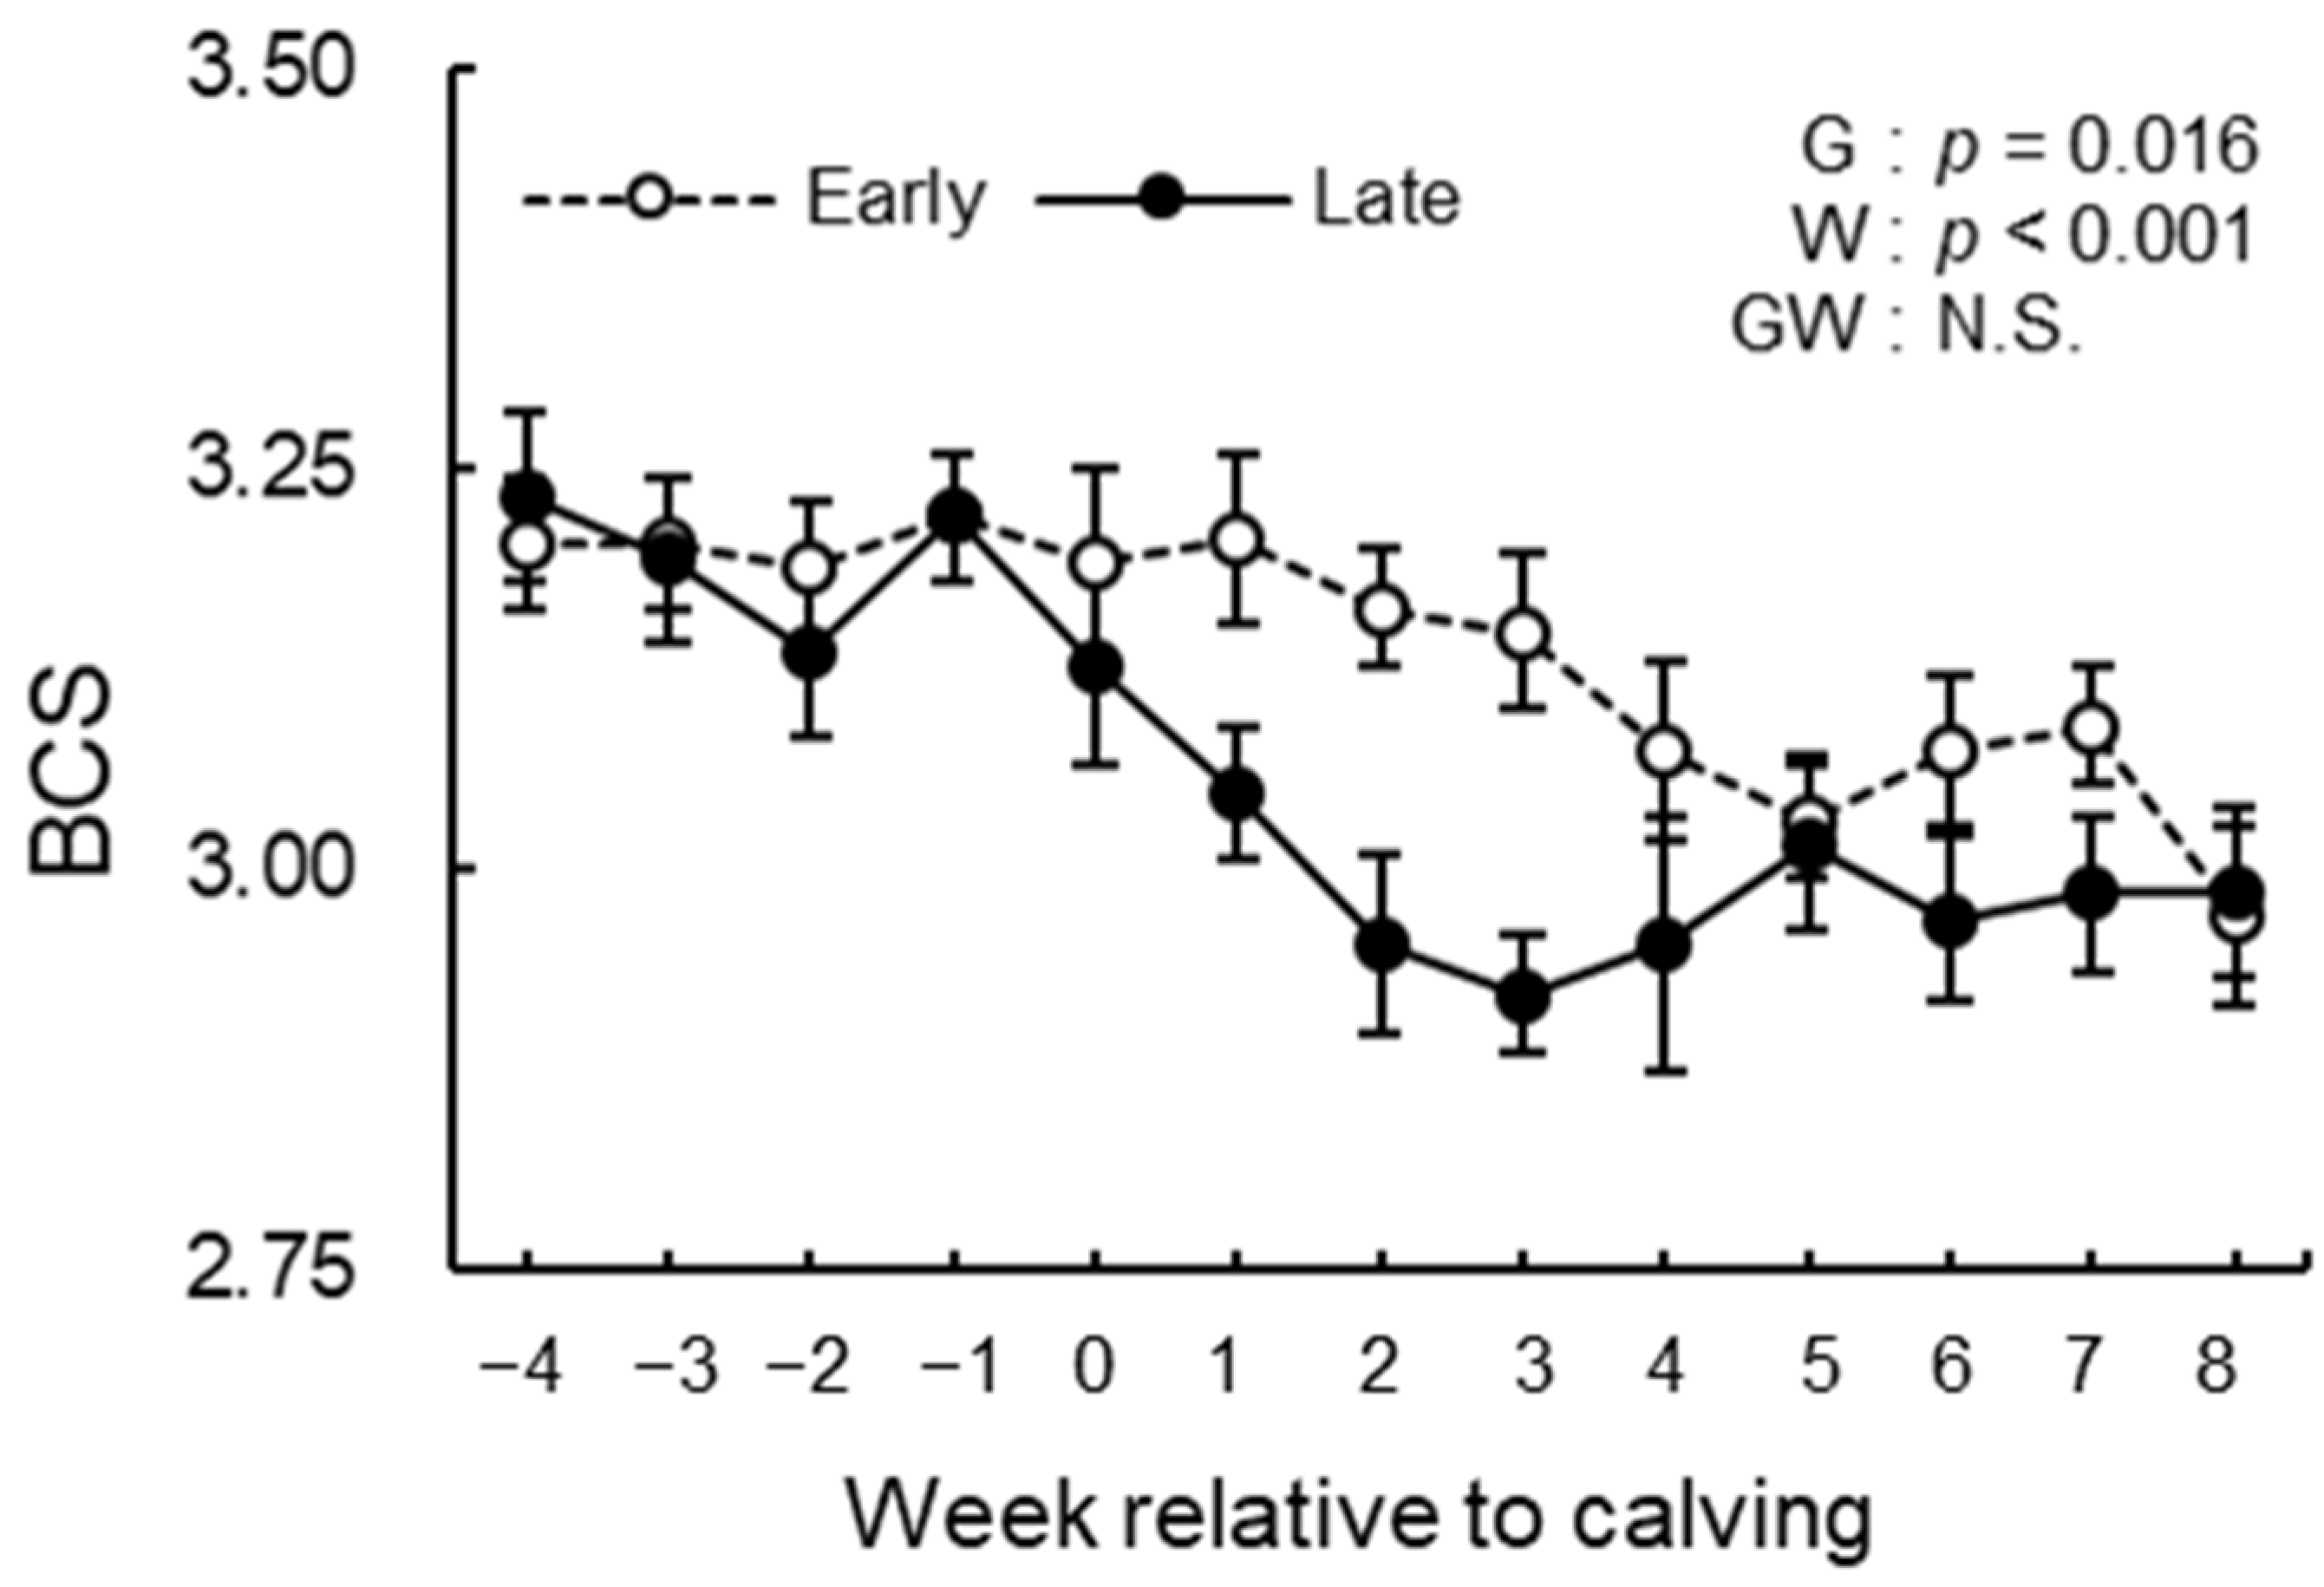
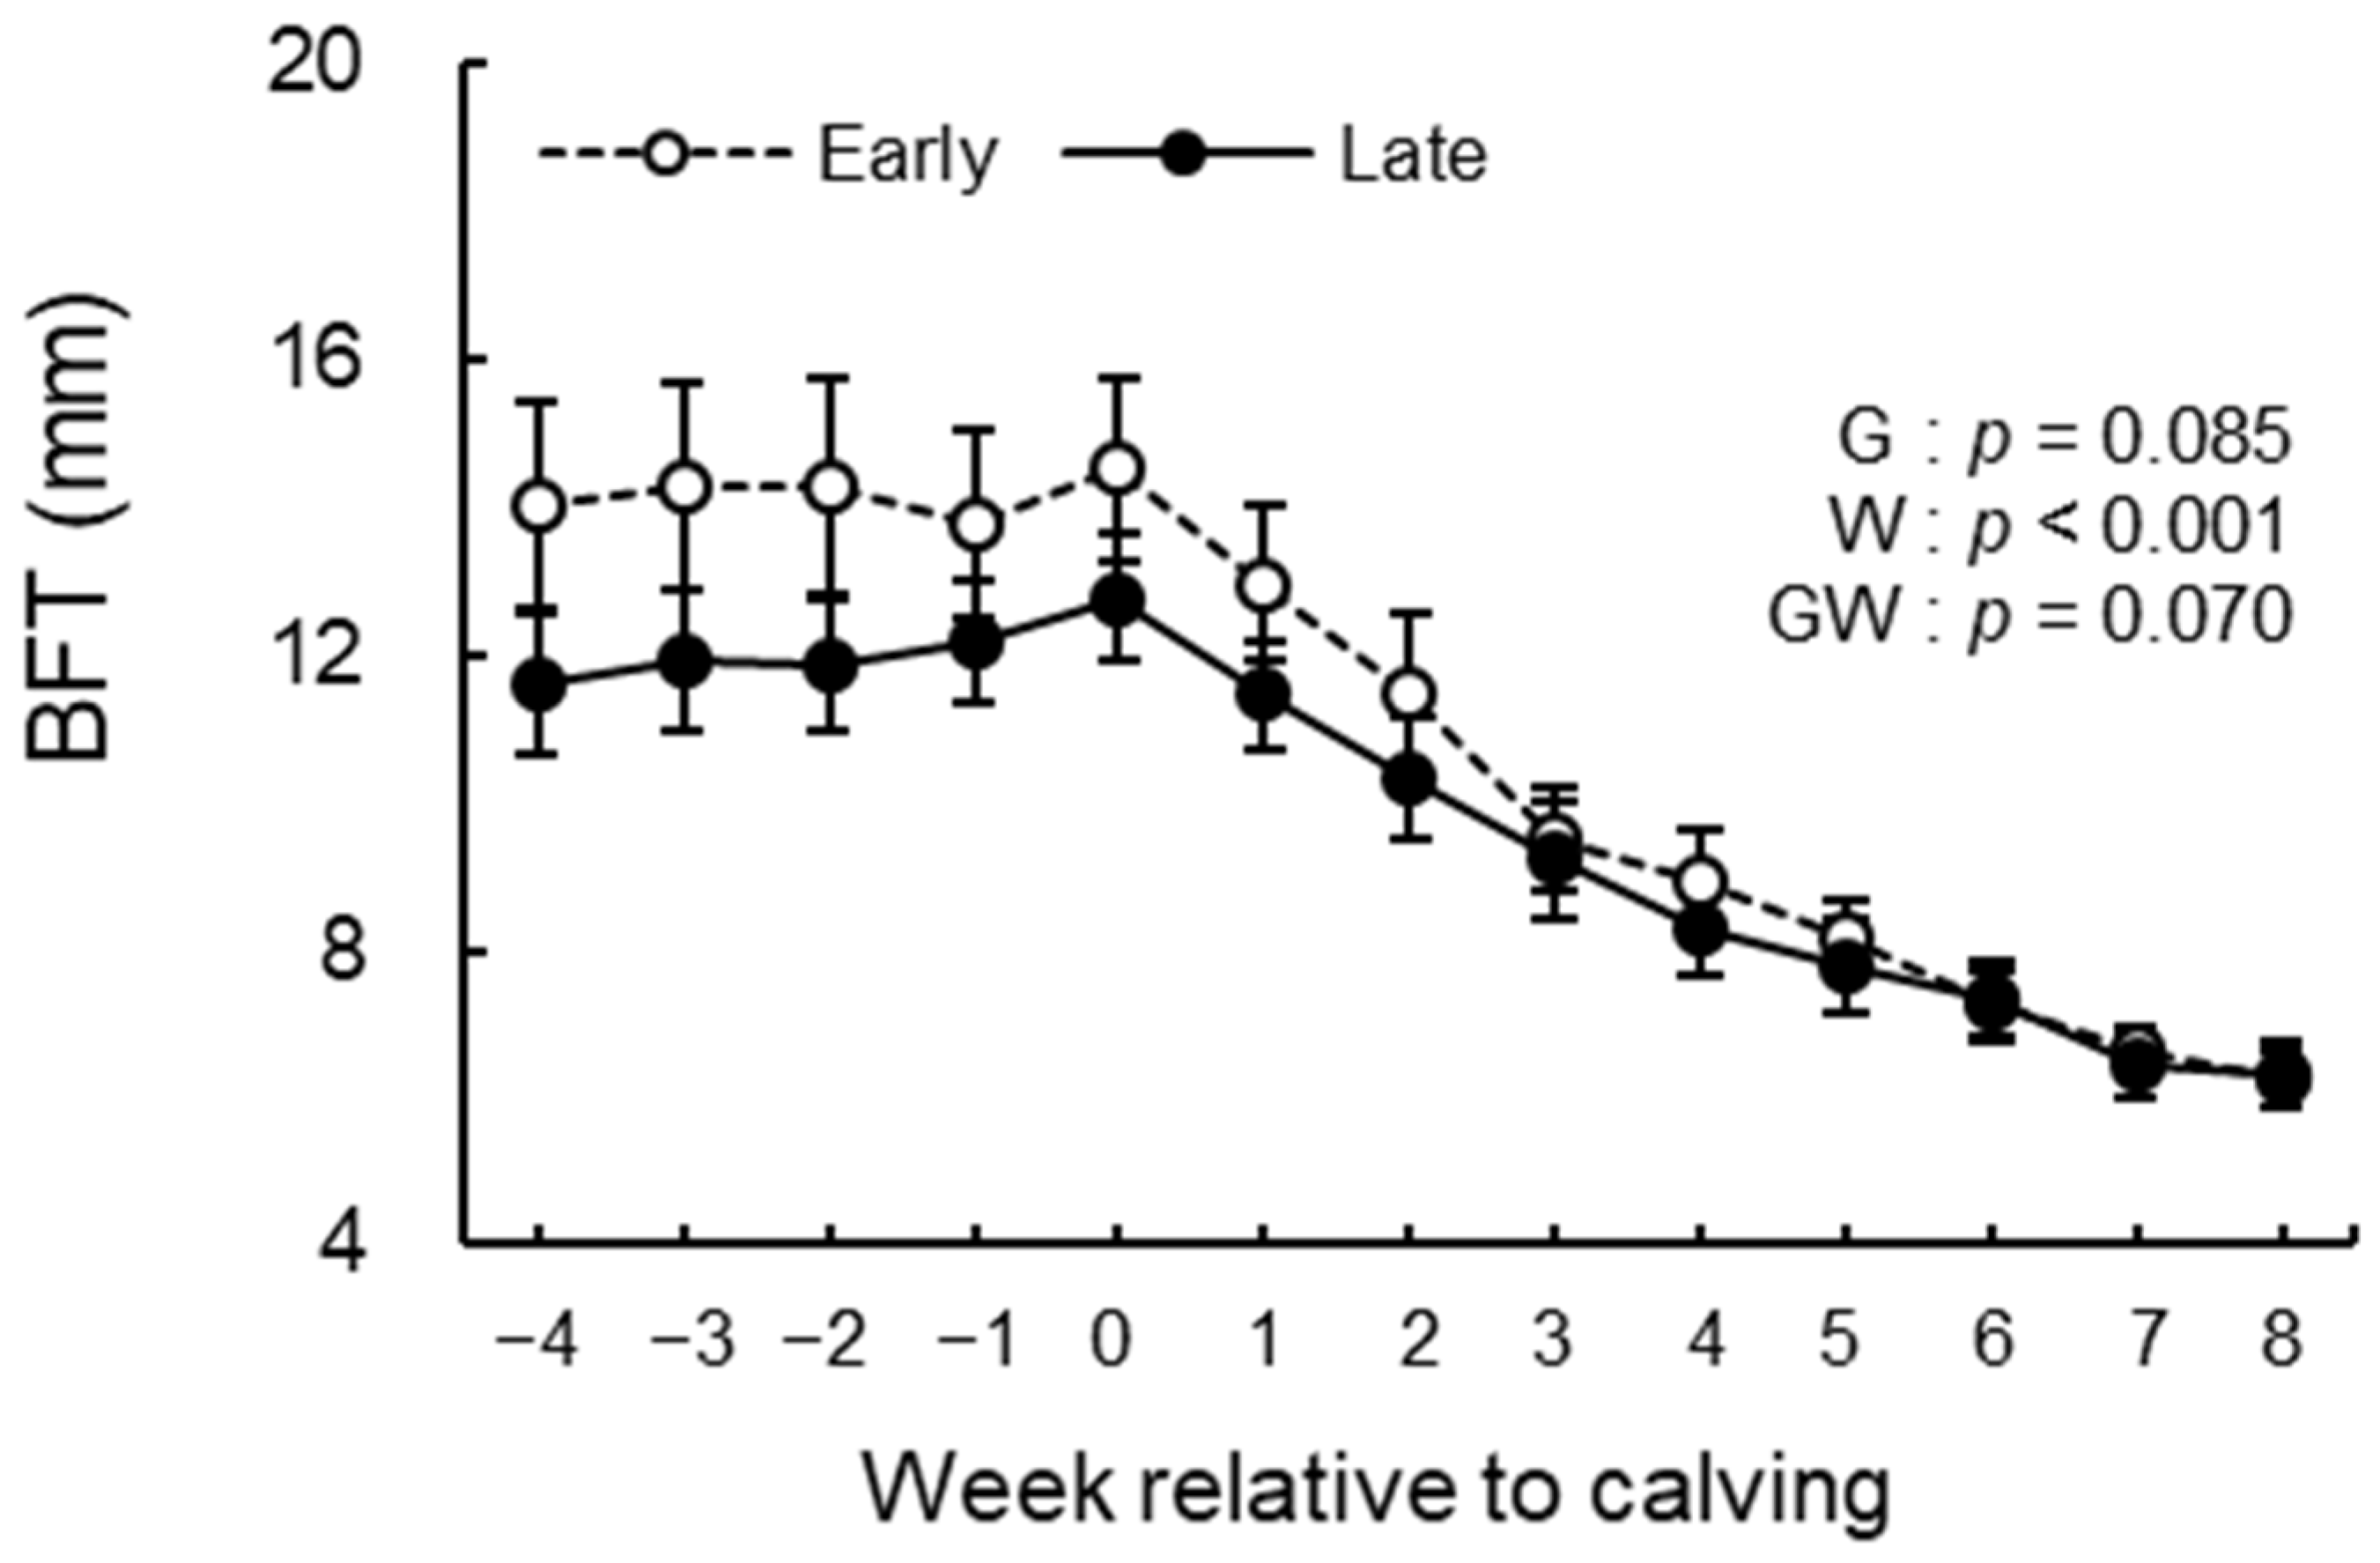
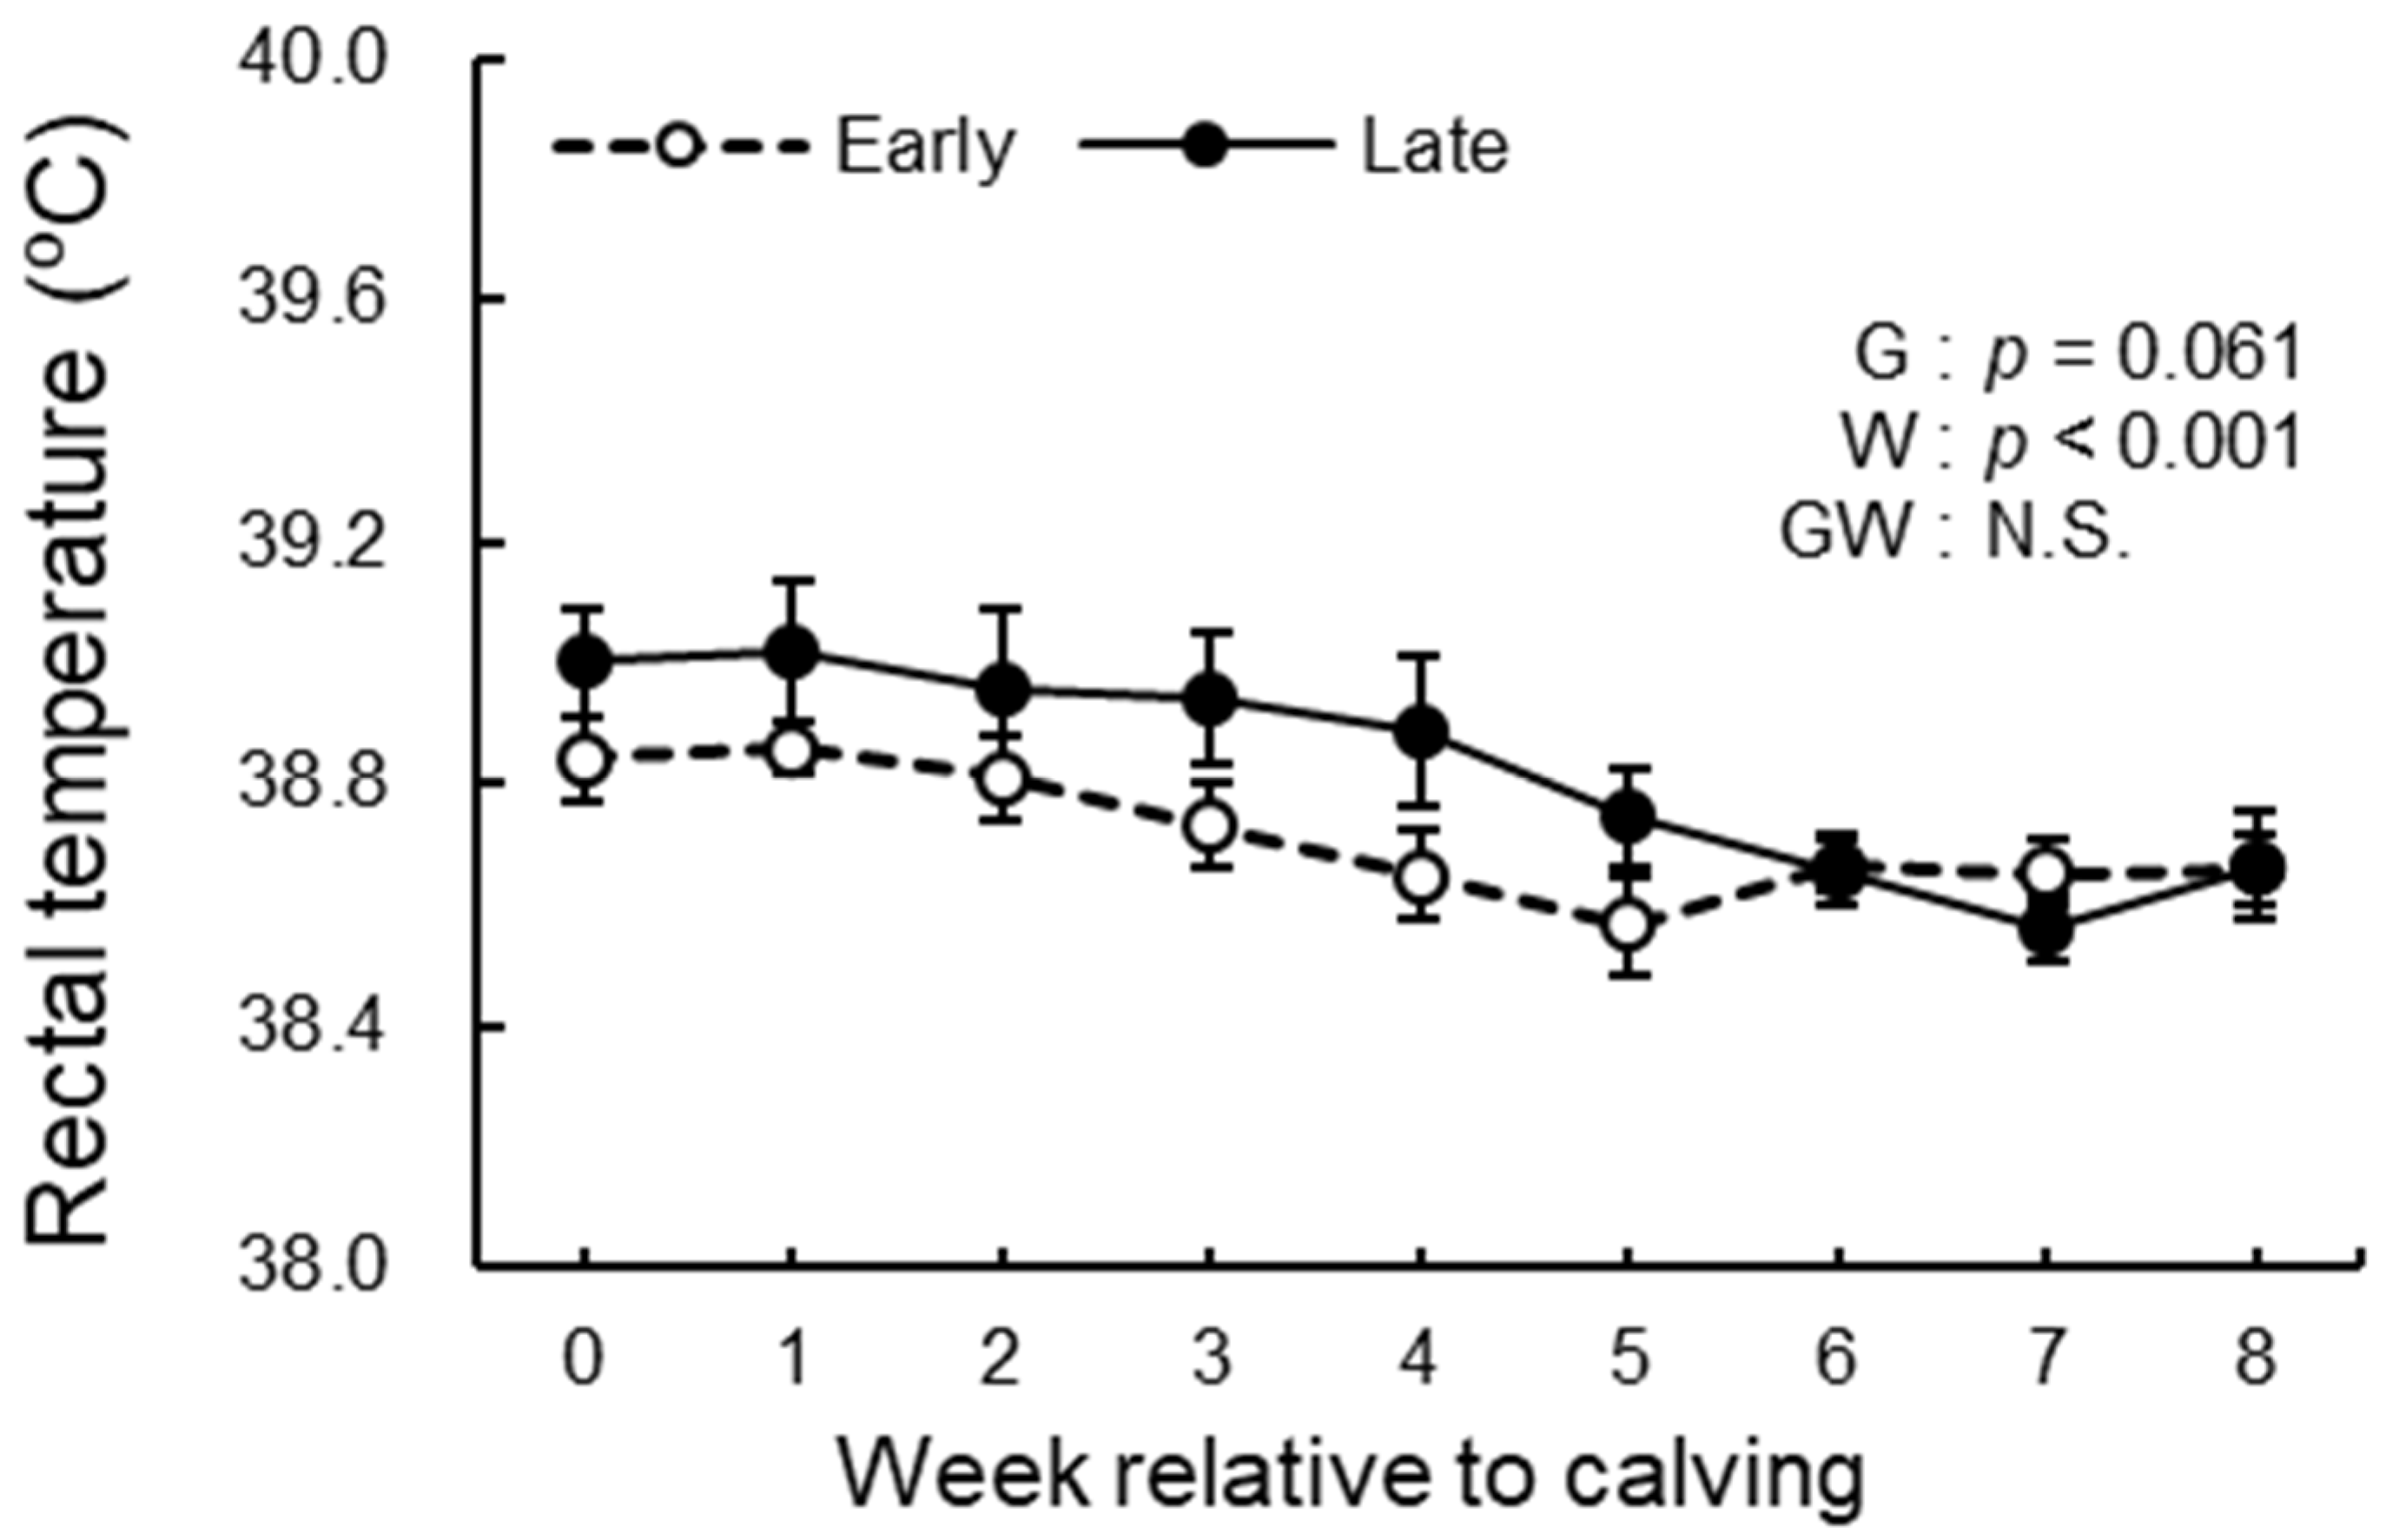
3.3. BCS, BFT, and Rectal Temperature Analysis
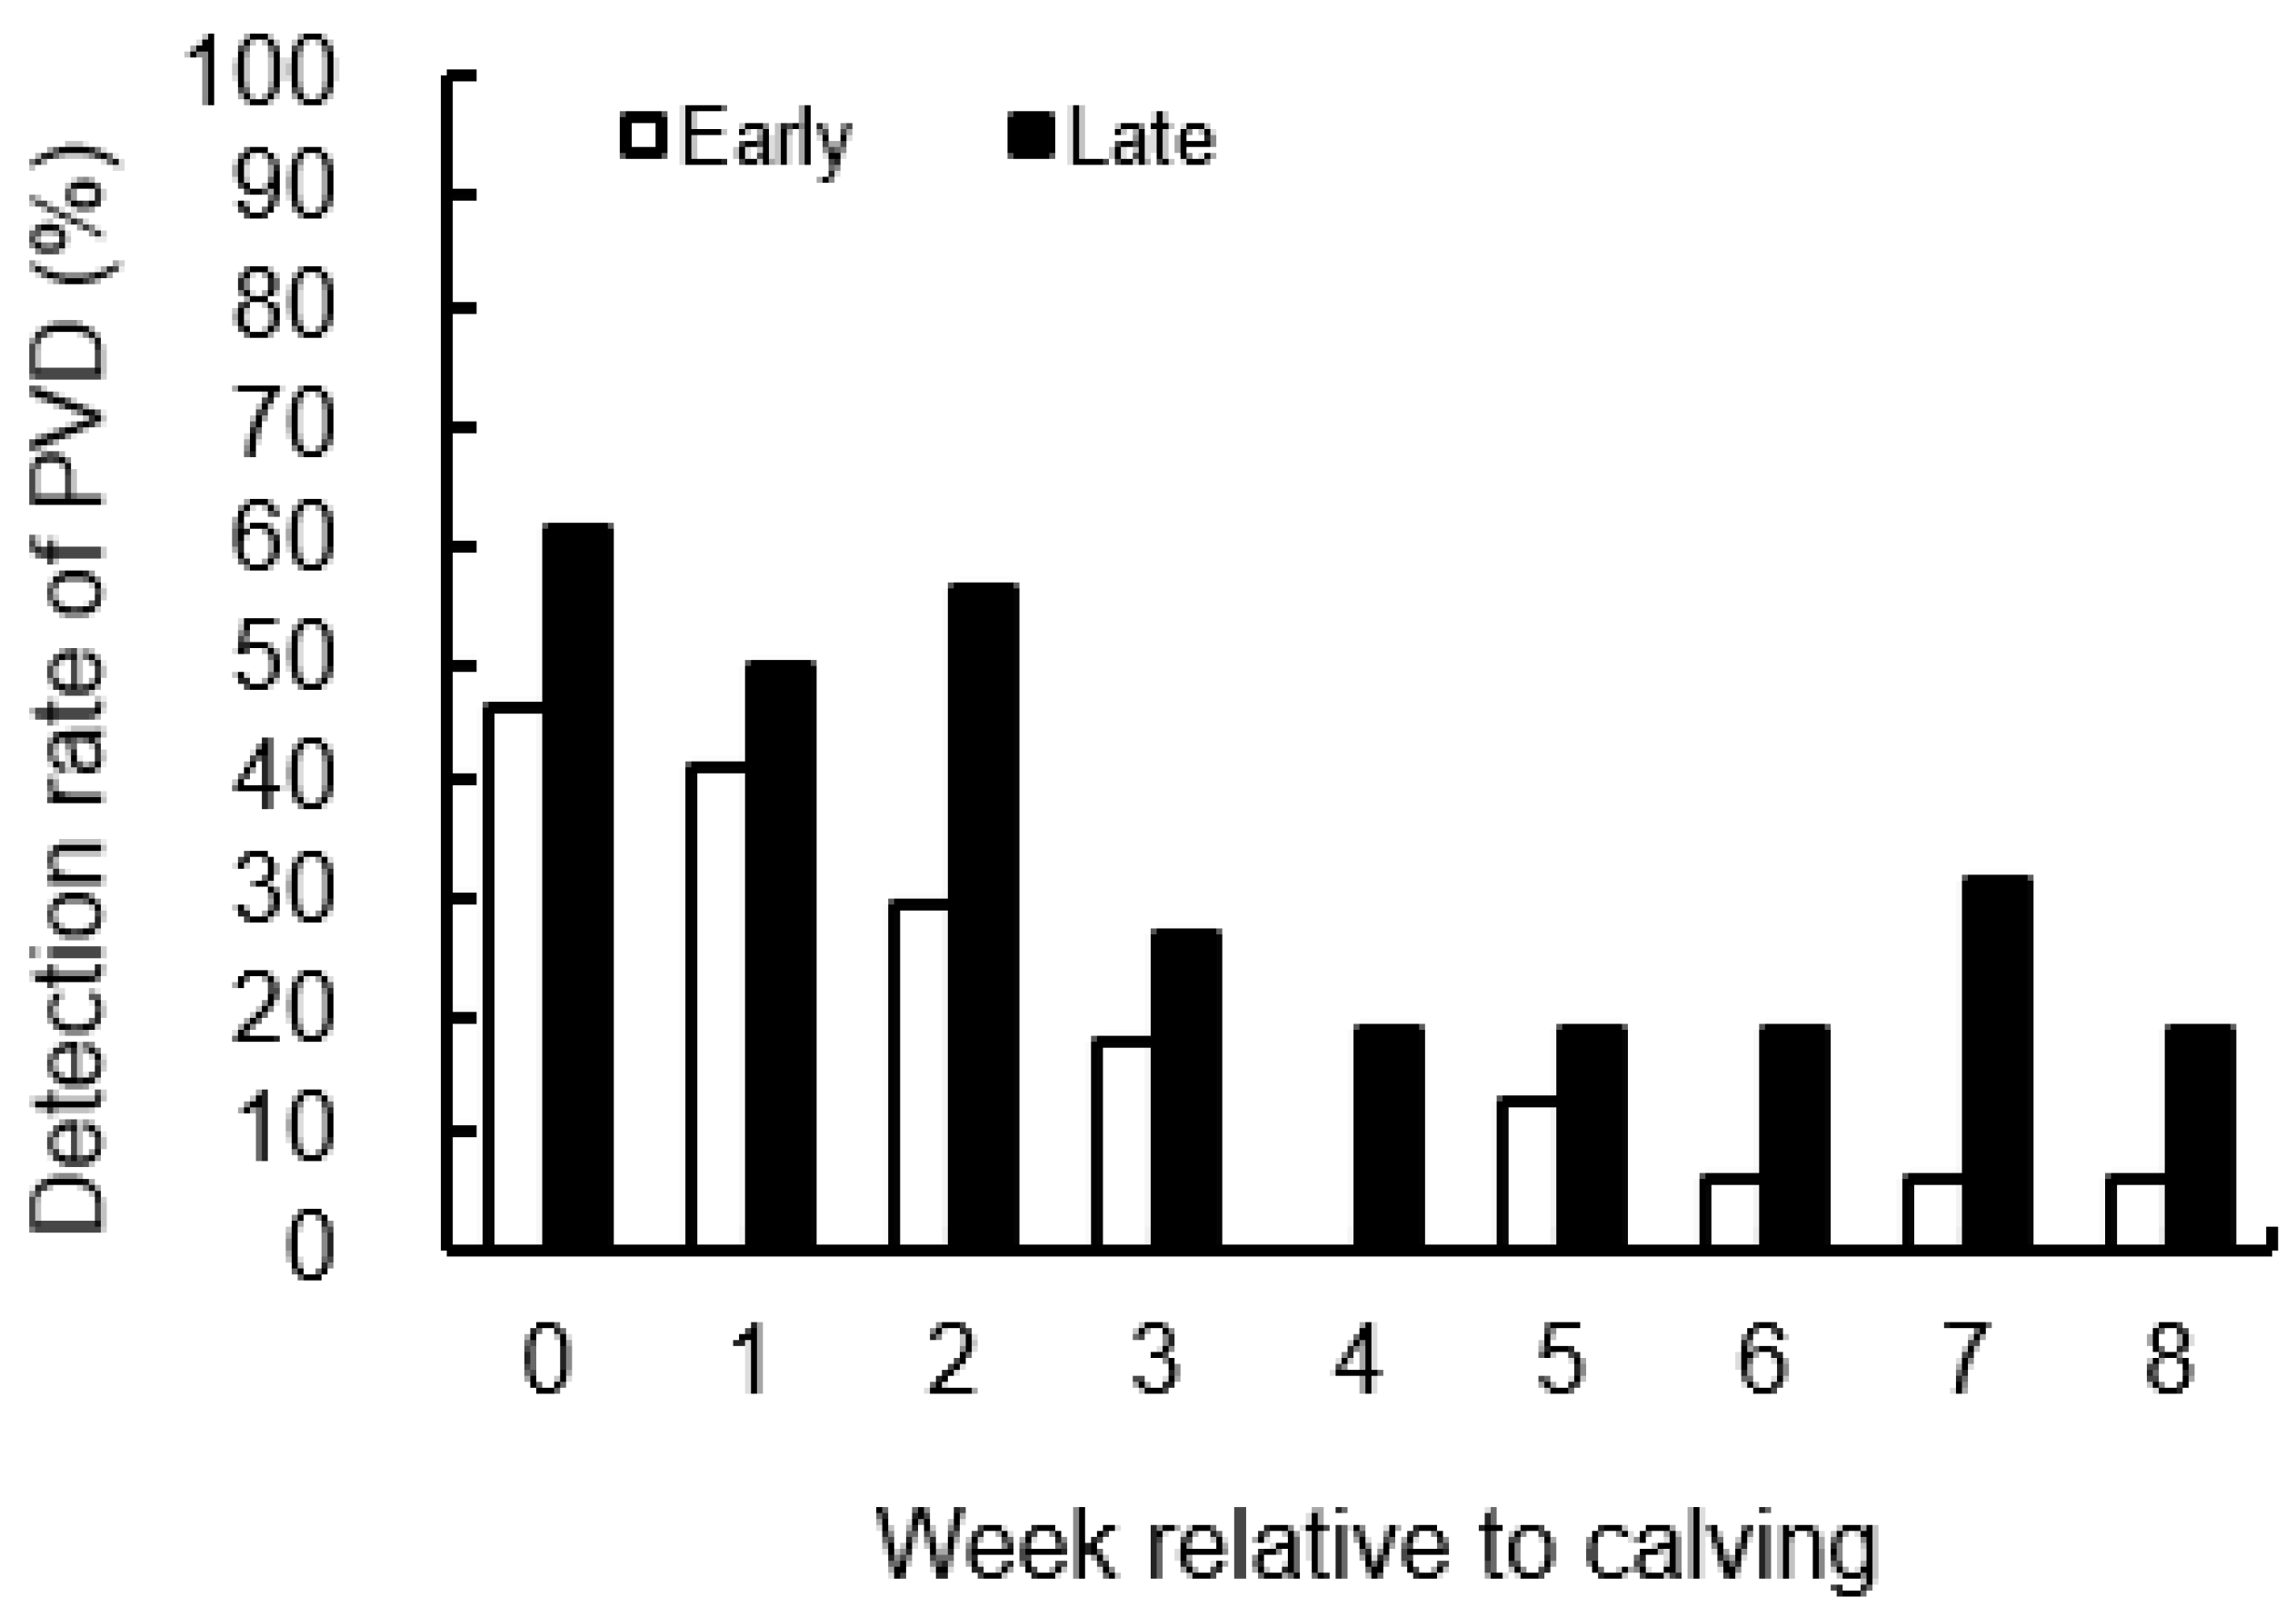
3.4. Detection Rate of PVD
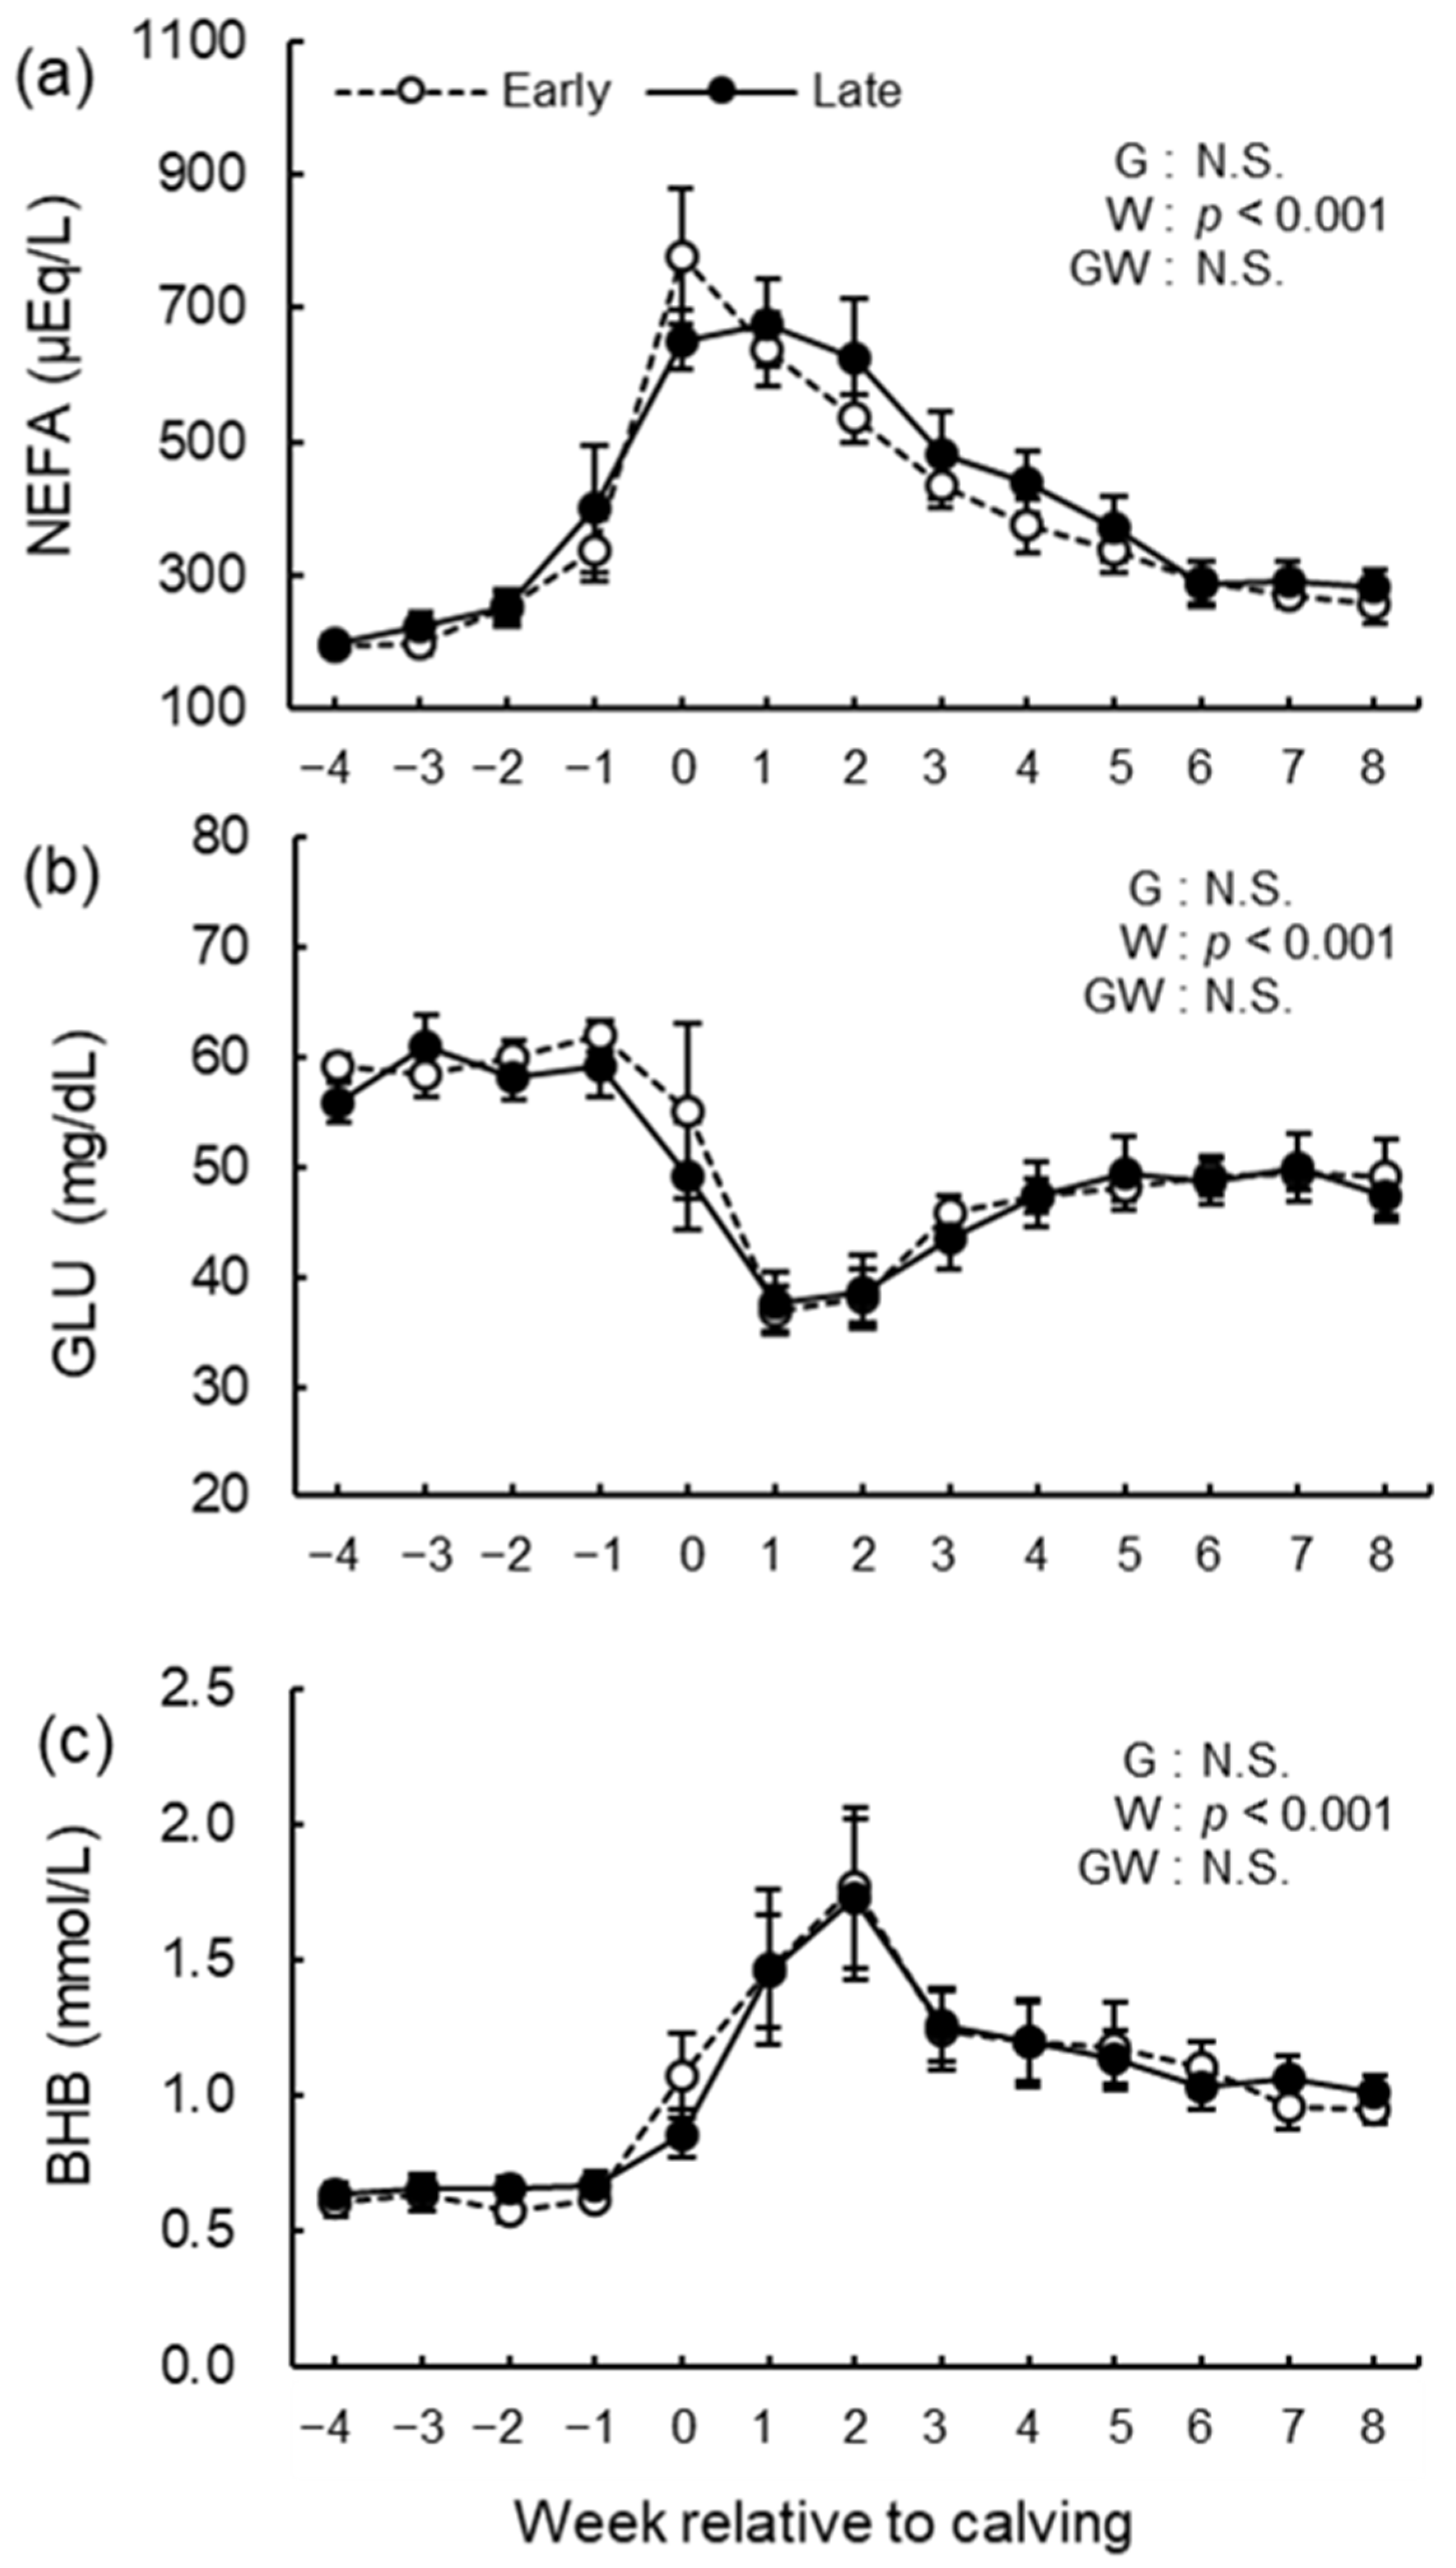
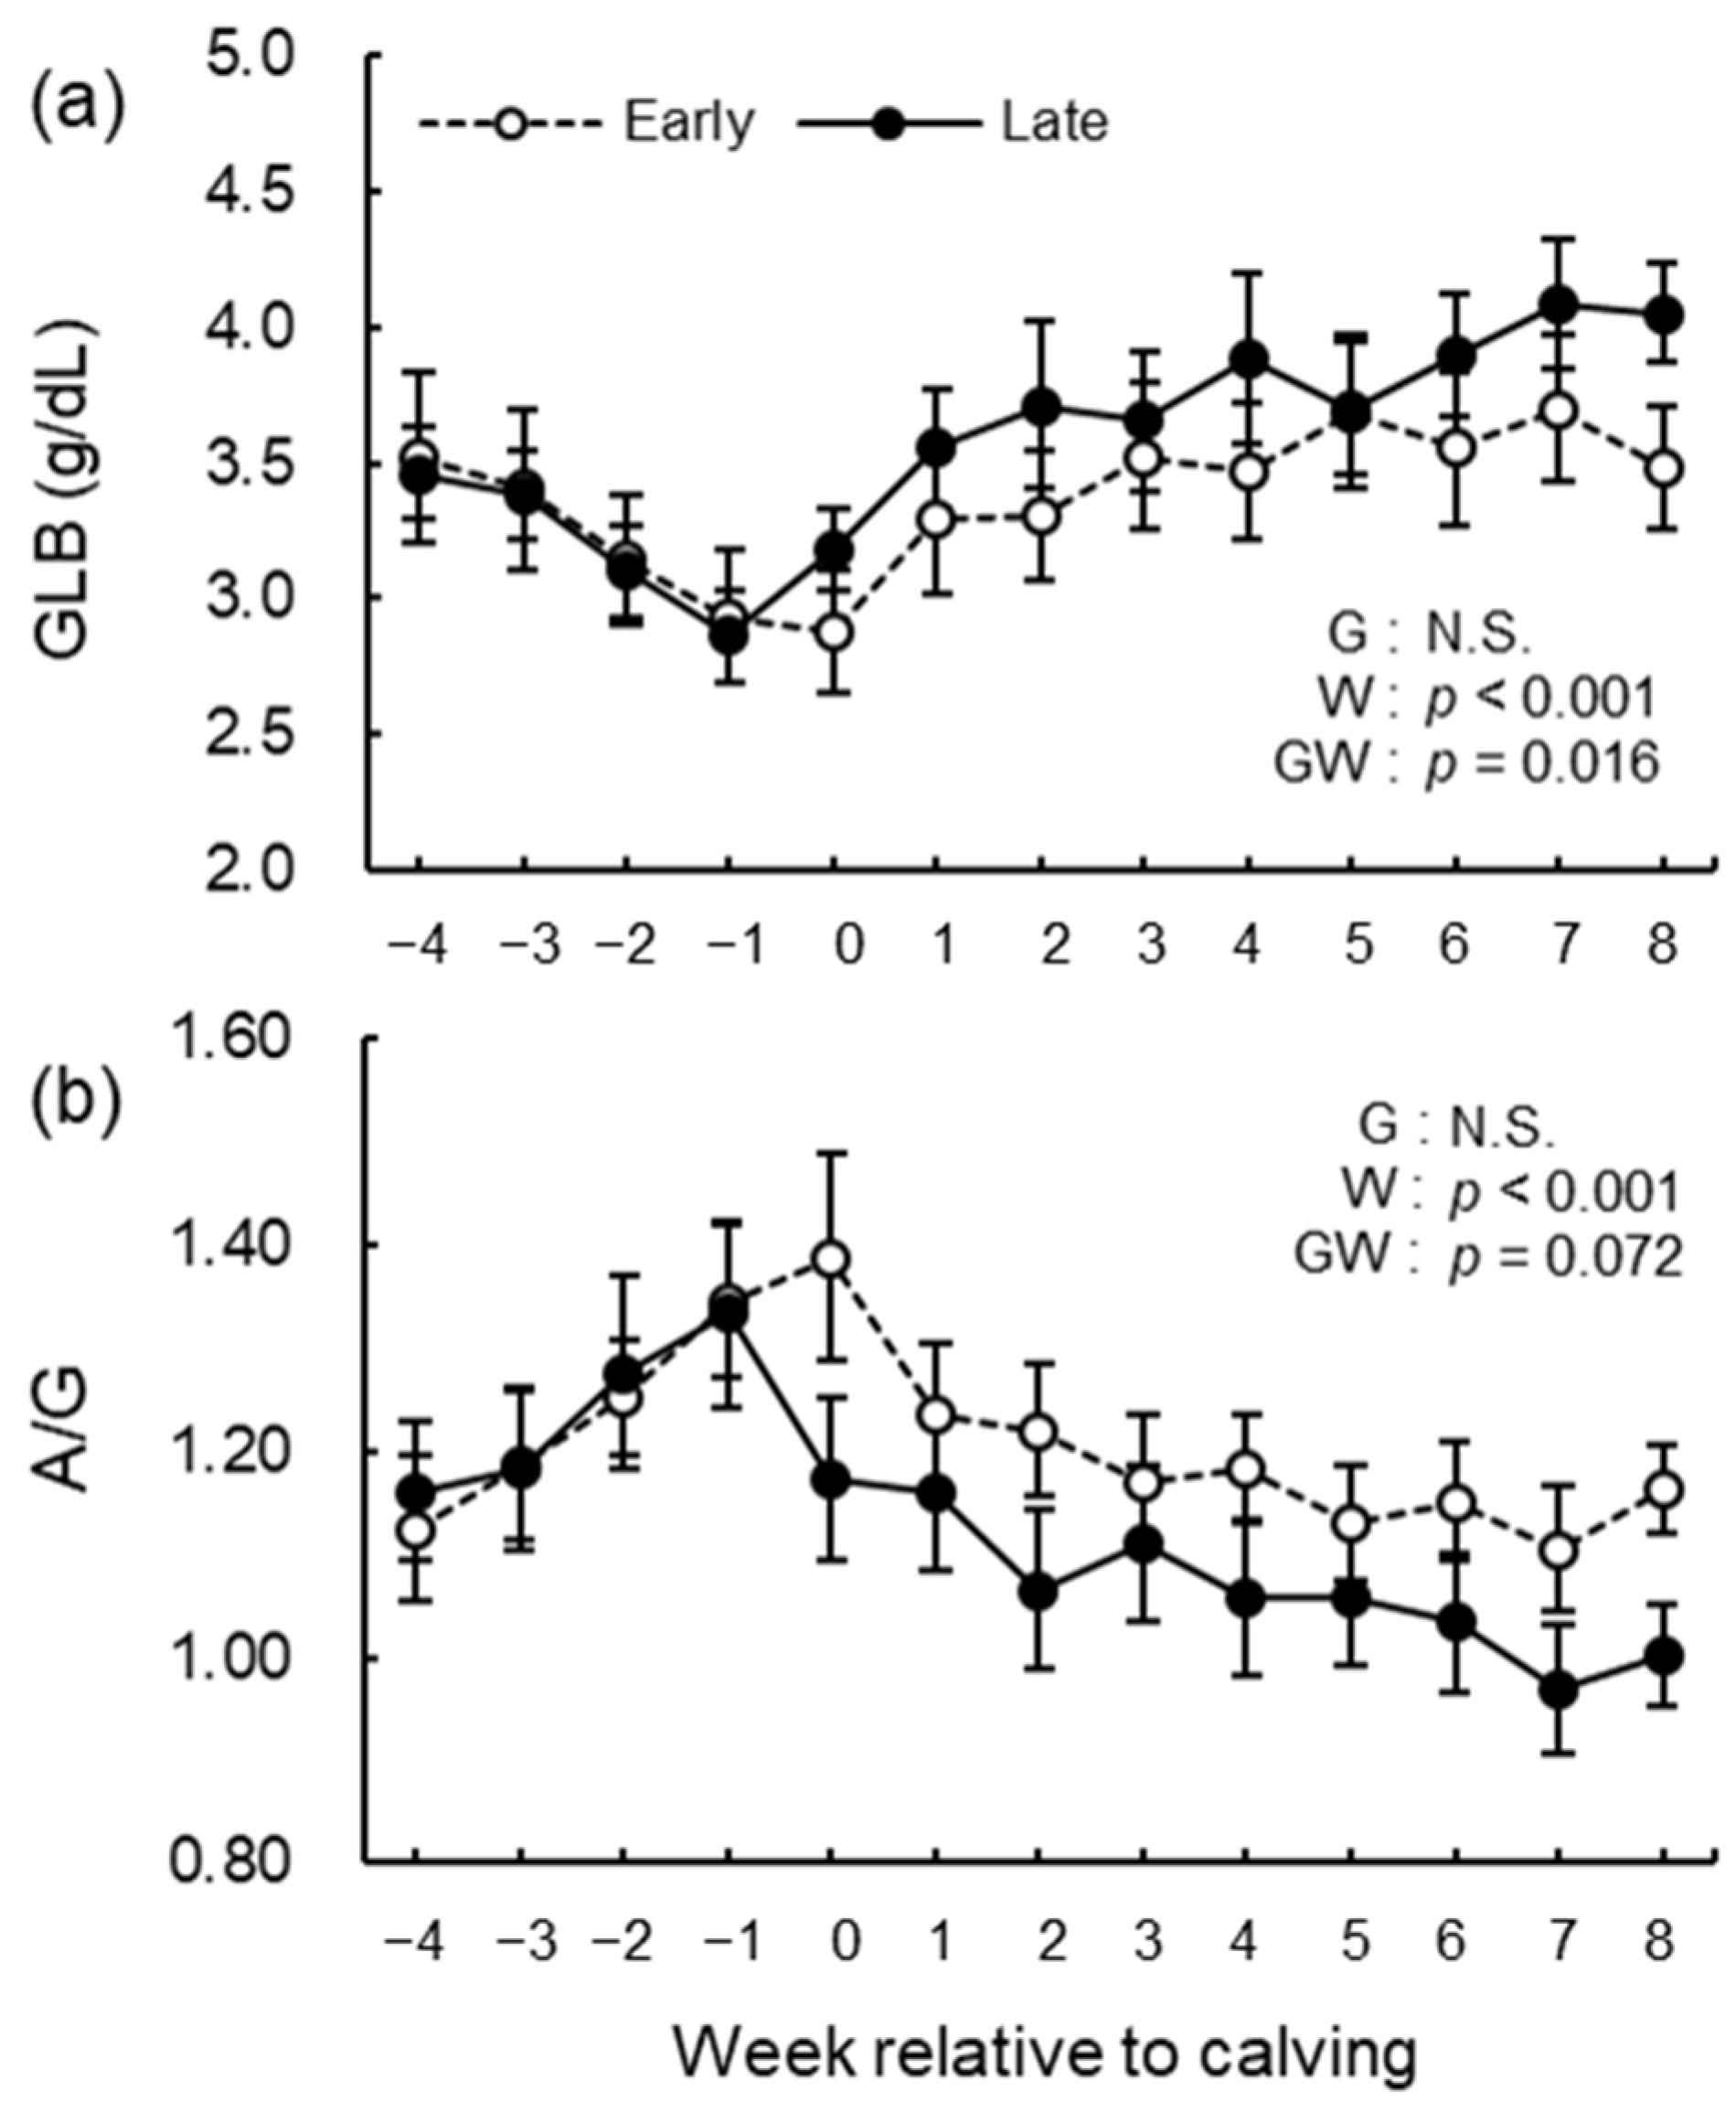
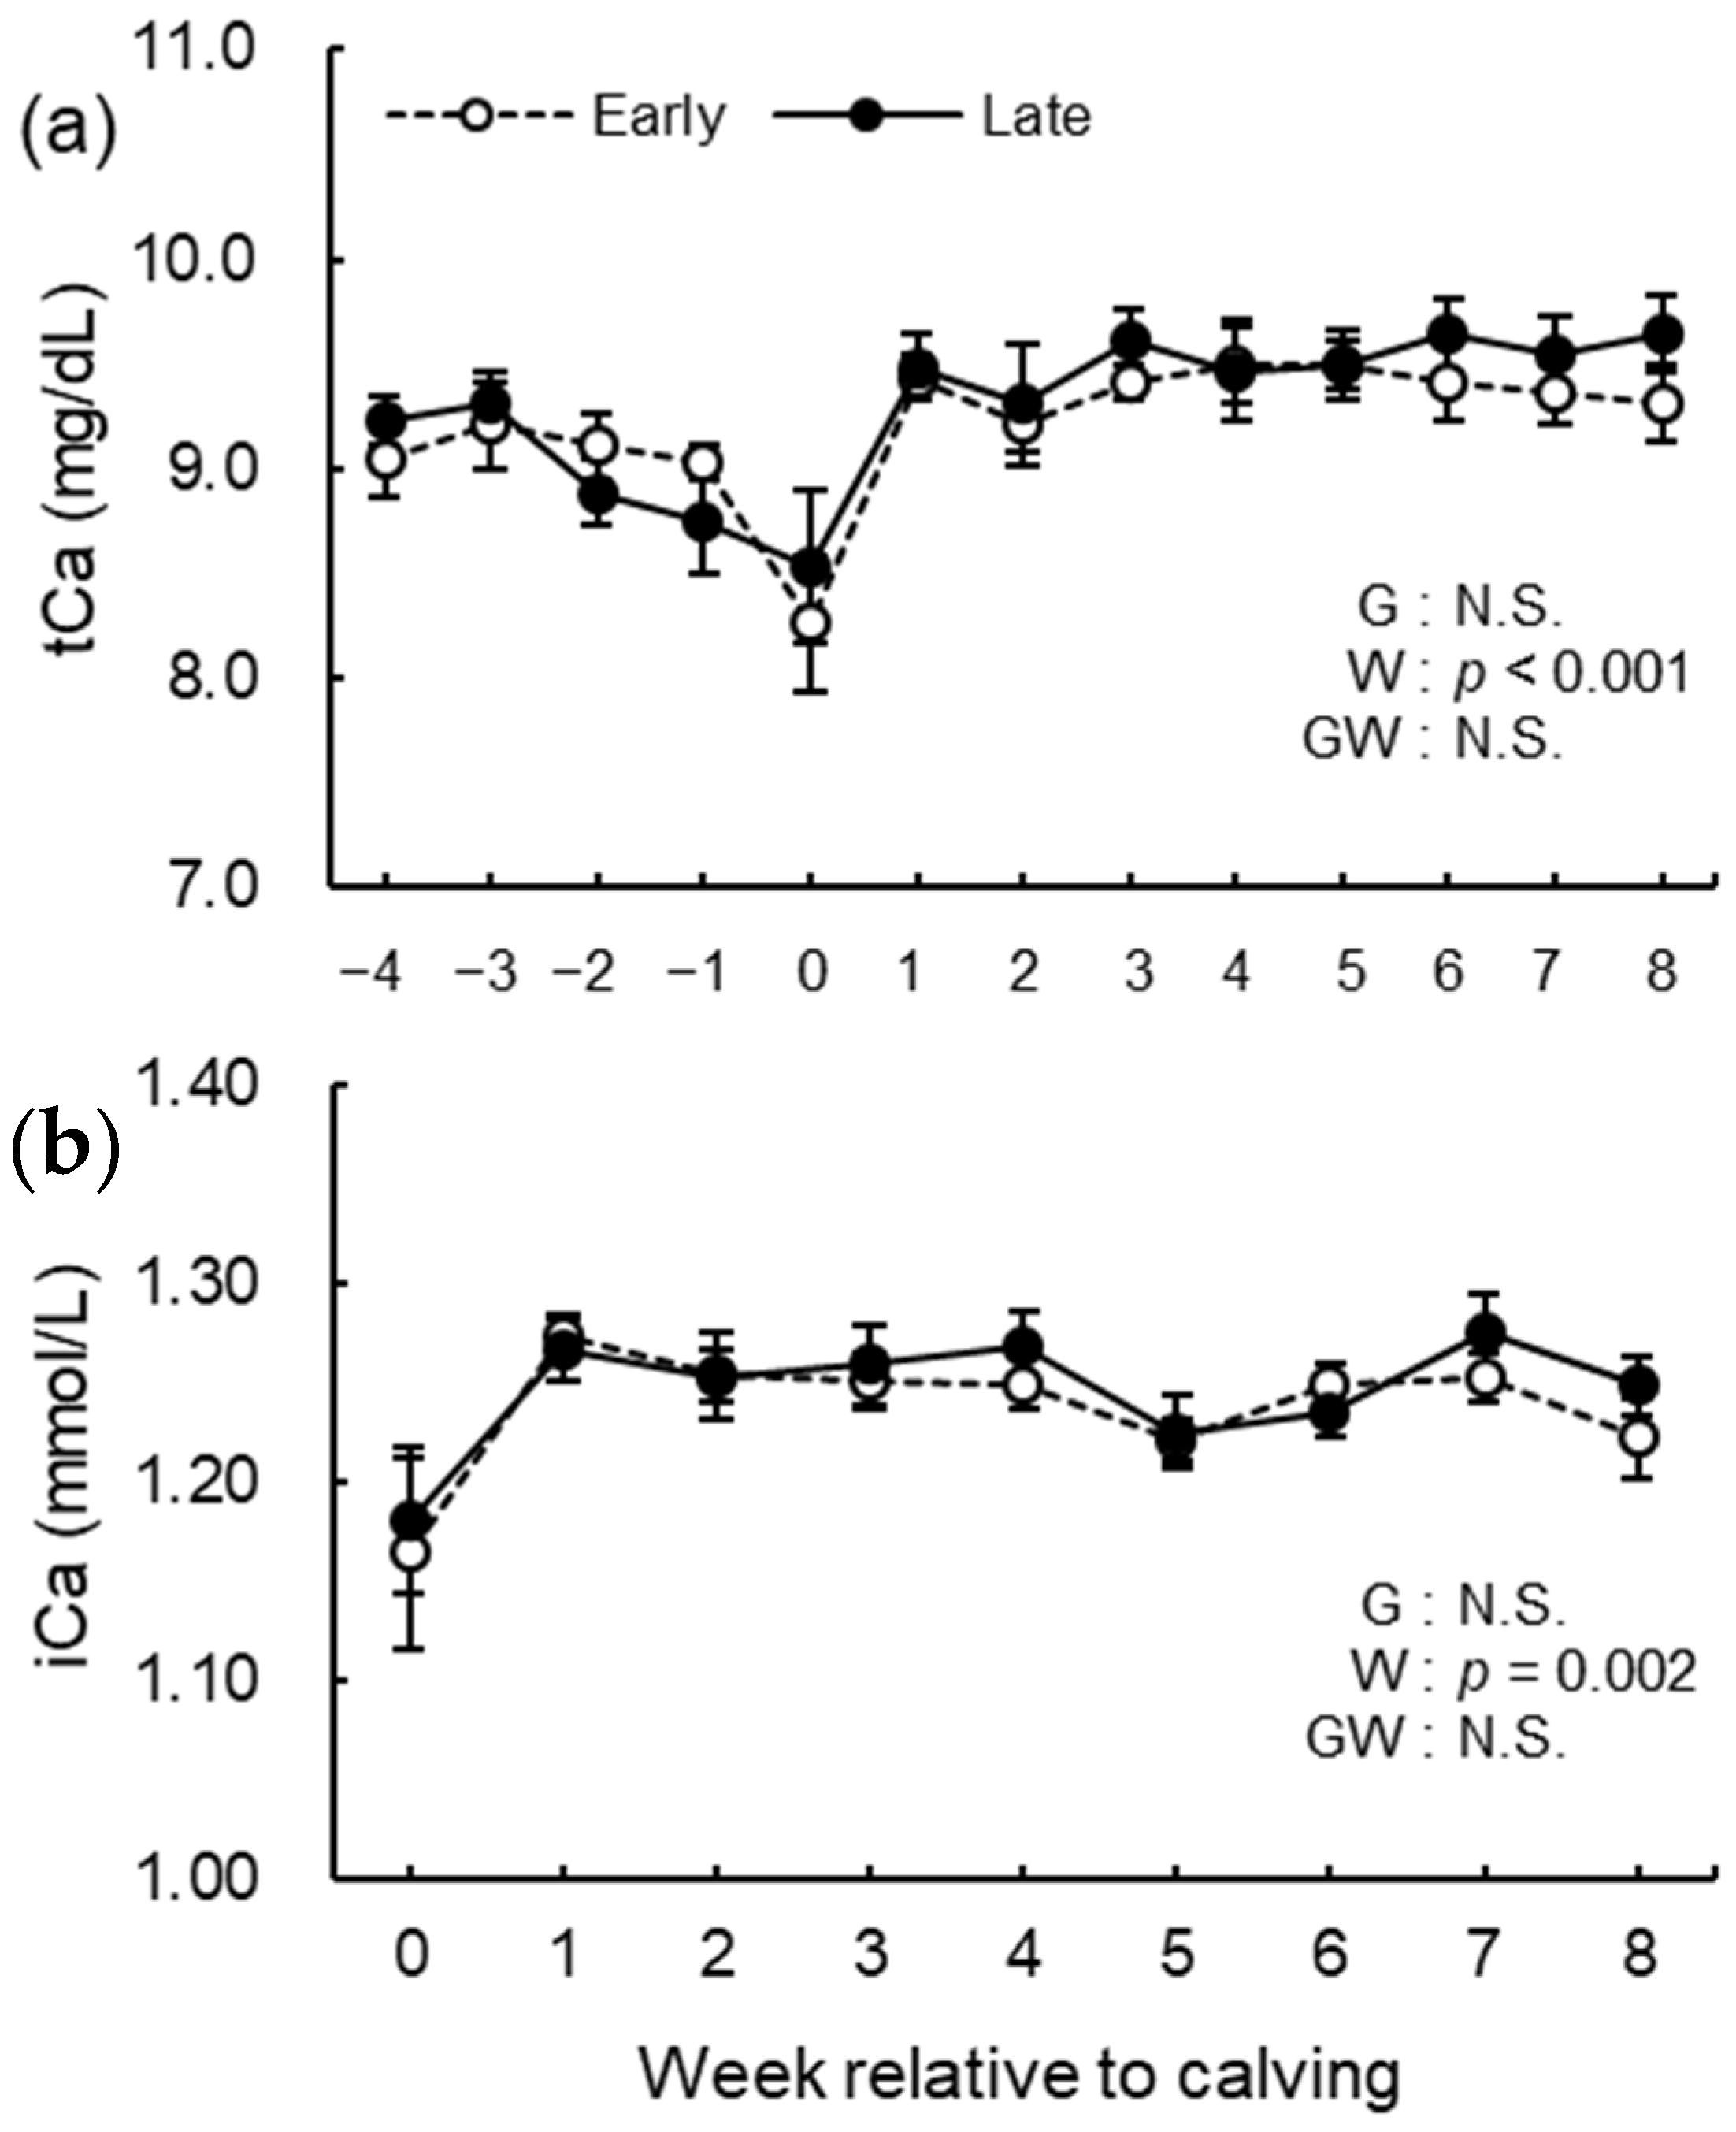
3.5. Blood Biochemical Analysis
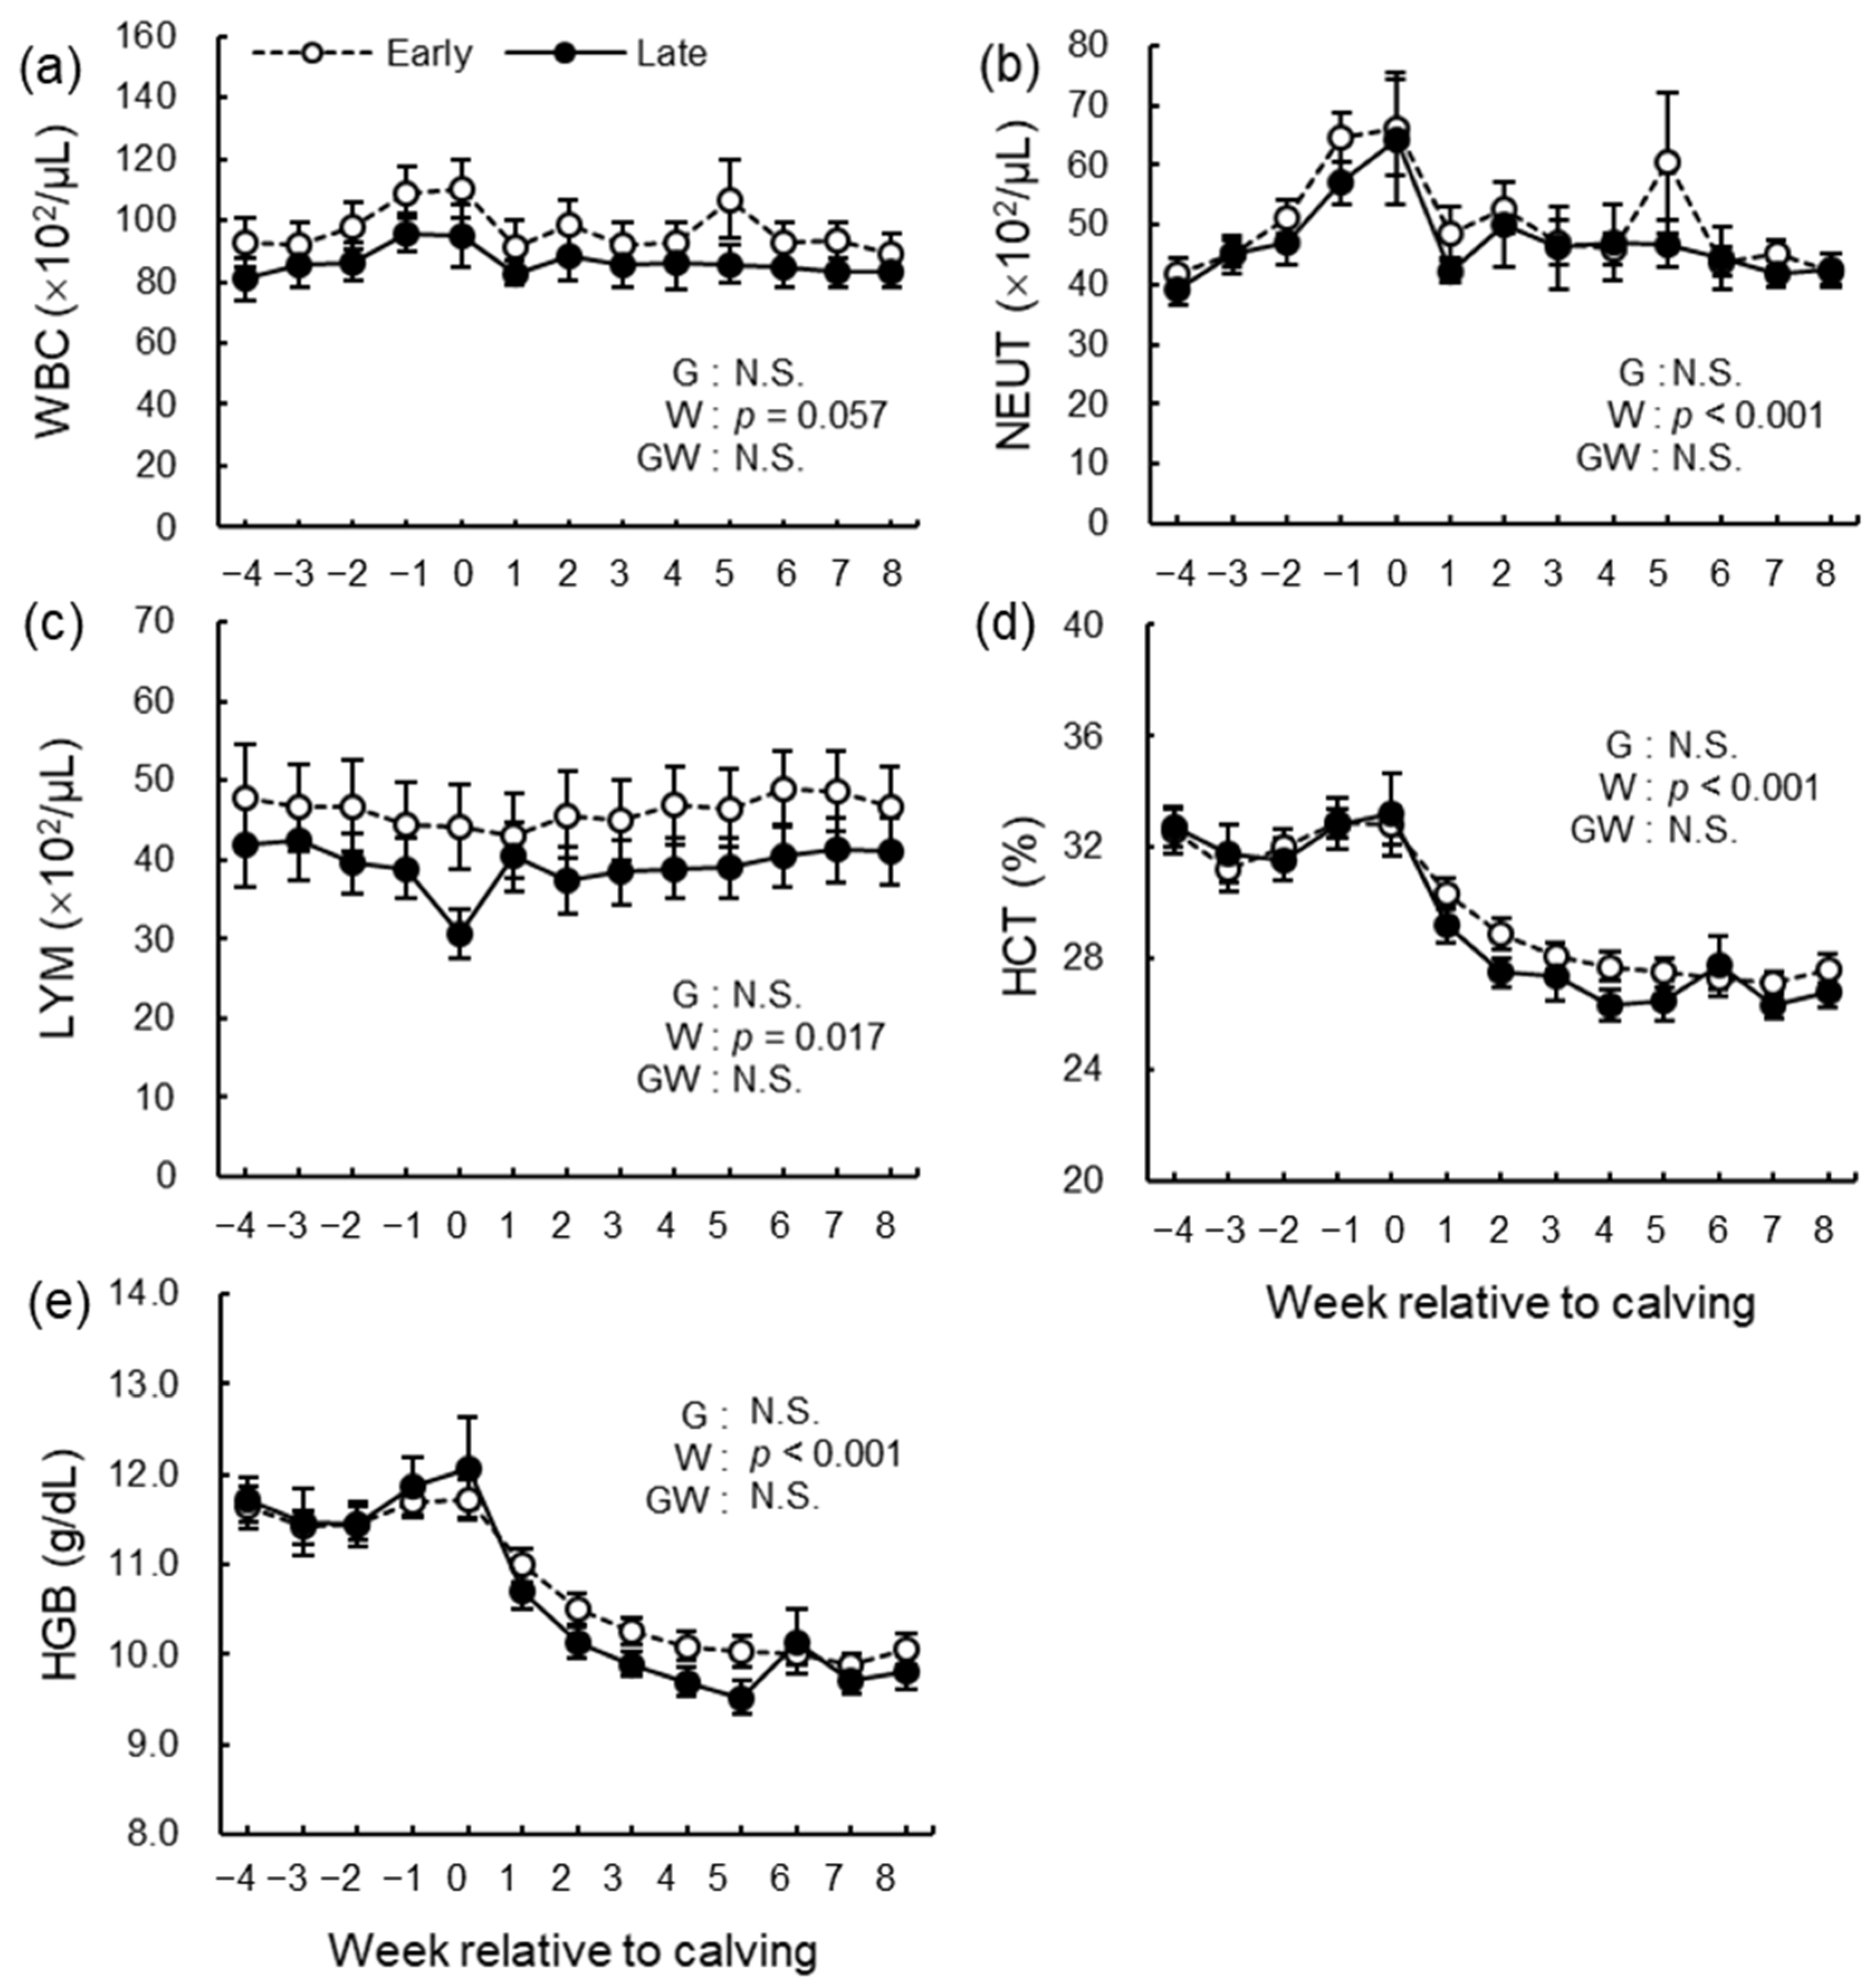
3.6. Hematological Analysis
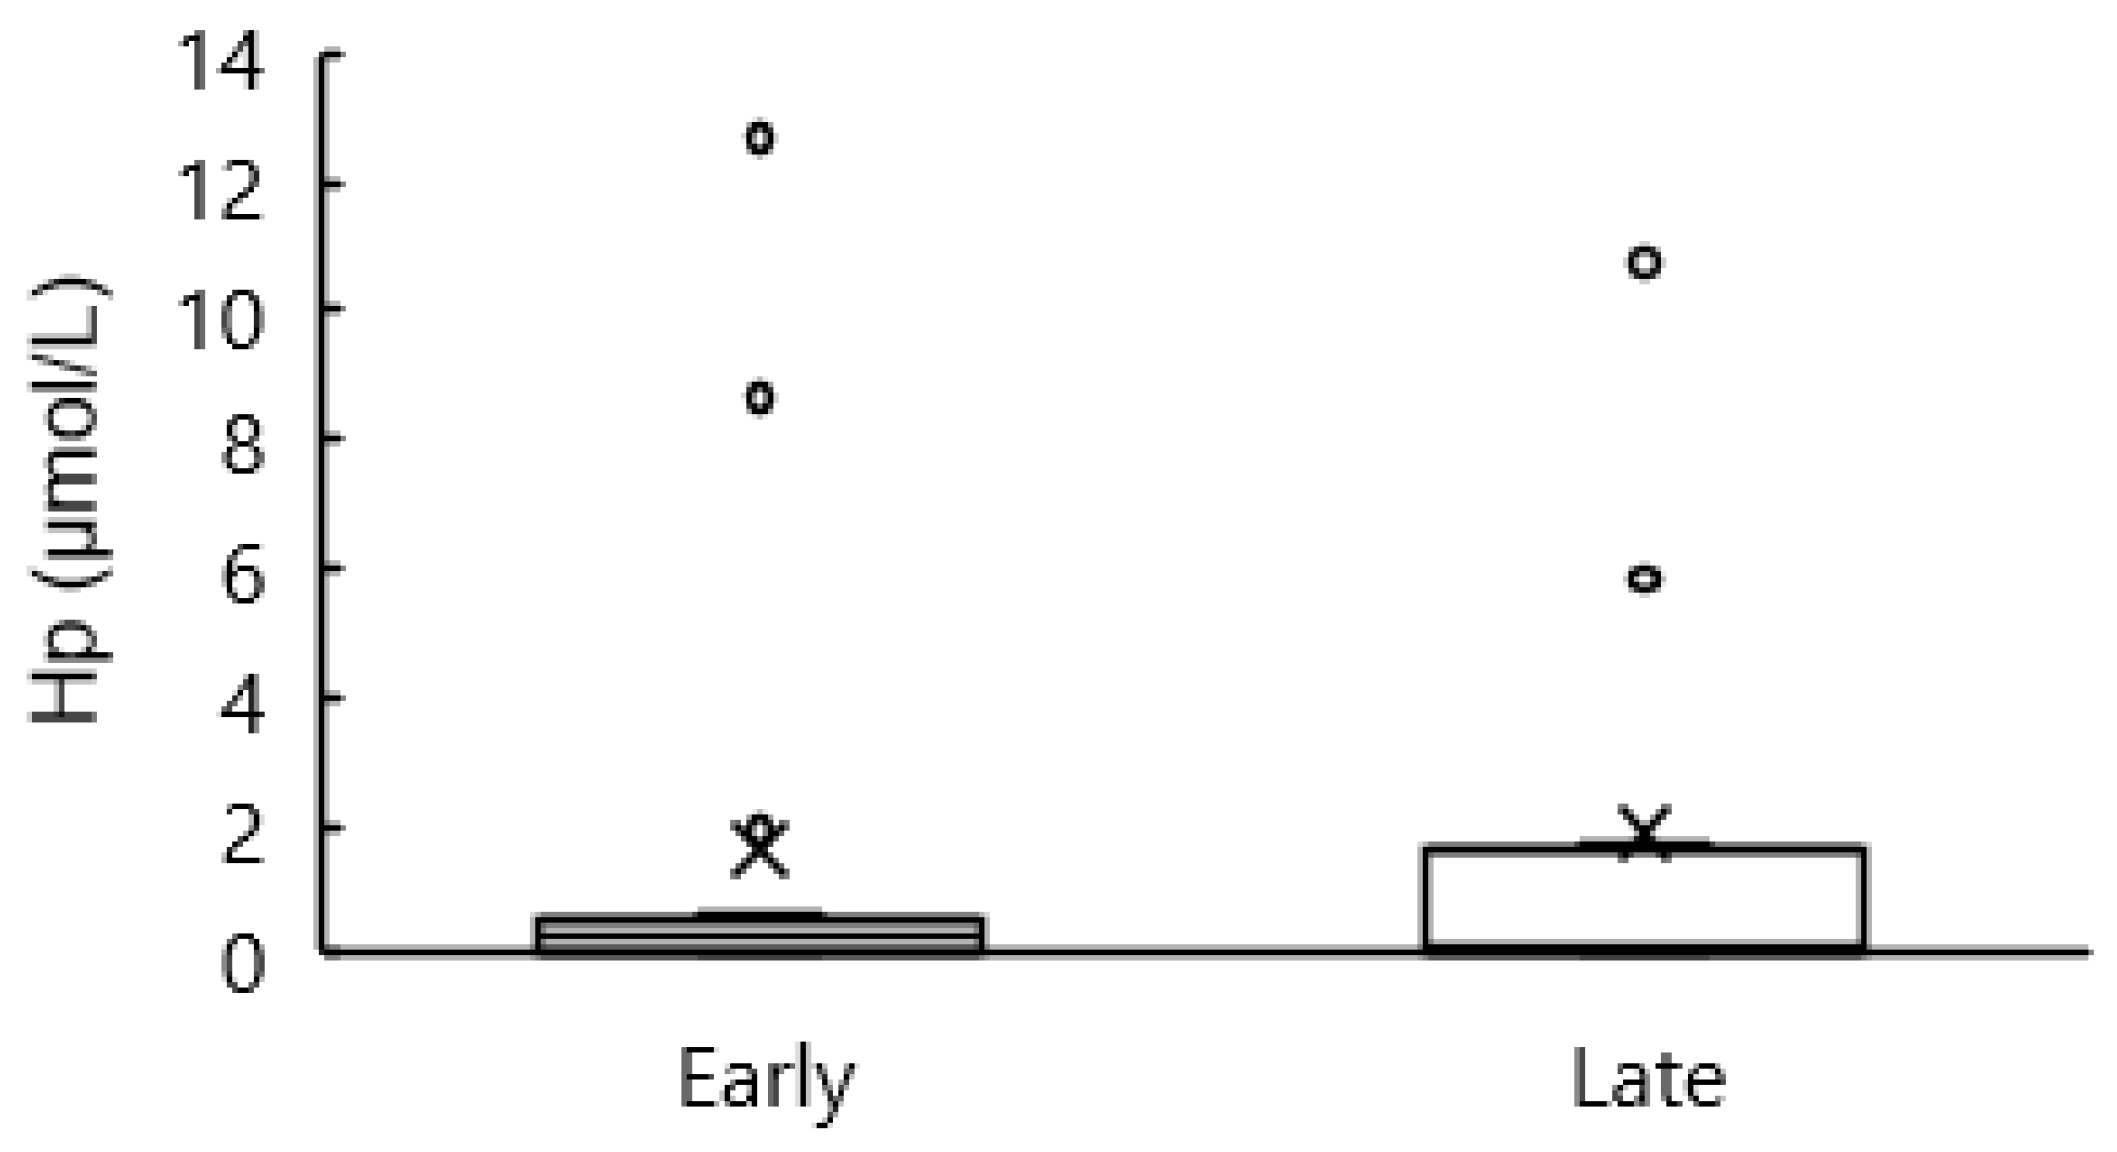
3.7. Blood Hp
3.8. Blood Amino Acids
4. Discussion
5. Conclusions
Author Contributions
Funding
Institutional Review Board Statement
Informed Consent Statement
Data Availability Statement
Acknowledgments
Conflicts of Interest
References
- LeBlanc, S.J.; Duffield, T.F.; Leslie, K.E.; Bateman, K.G.; Keefe, G.P.; Walton, J.S.; Johnson, W.H. Defining and diagnosing postpartum clinical endometritis and its impact on reproductive performance in dairy cows. J. Dairy Sci. 2002, 85, 2223–2236. [Google Scholar] [CrossRef] [PubMed]
- Kim, I.H.; Kang, H.G. Risk factors for postpartum endometritis and the effect of endometritis on reproductive performance in dairy cows in Korea. J. Reprod. Dev. 2003, 49, 485–491. [Google Scholar] [CrossRef] [PubMed]
- Manríquez, D.; Velez, J.; Pinedo, P.J. Incidence and risk factors for reproductive disorders in organic certified dairies. J. Dairy Sci. 2020, 103, 10797–10808. [Google Scholar] [CrossRef] [PubMed]
- Kasimanickam, R.; Duffield, T.F.; Foster, R.A.; Gartley, C.J.; Leslie, K.E.; Walton, J.S.; Johnson, W.H. Endometrial cytology and ultrasonography for the detection of subclinical endometritis in postpartum dairy cows. Theriogenology 2004, 62, 9–23. [Google Scholar] [CrossRef]
- Burke, C.R.; Meier, S.; McDougall, S.; Compton, C.; Mitchell, M.; Roche, J.R. Relationships between endometritis and metabolic state during the transition period in pasture-grazed dairy cows. J. Dairy Sci. 2010, 93, 5363–5373. [Google Scholar] [CrossRef]
- Cheong, S.H.; Nydam, D.V.; Galvão, K.N.; Crosier, B.M.; Gilbert, R.O. Cow-level and herd-level risk factors for subclinical endometritis in lactating Holstein cows. J. Dairy Sci. 2011, 94, 762–770. [Google Scholar] [CrossRef]
- Dubuc, J.; Duffield, T.F.; Leslie, K.E.; Walton, J.S.; LeBlanc, S.J. Risk factors for postpartum uterine diseases in dairy cows. J. Dairy Sci. 2010, 93, 5764–5771. [Google Scholar] [CrossRef]
- Bogado Pascottini, O.; LeBlanc, S.J. Metabolic markers for purulent vaginal discharge and subclinical endometritis in dairy cows. Theriogenology 2020, 155, 43–48. [Google Scholar] [CrossRef]
- Kusaka, H.; Hasegawa, R.; Nishimoto, N.; Kawahata, M.; Miura, H.; Kikuchi, M.; Sakaguchi, M. Comparison of diagnostic methods for uterine health in dairy cattle on different days postpartum. Vet. Rec. 2020, 186, 91. [Google Scholar] [CrossRef]
- Galvão, K.N.; Flaminio, M.J.B.F.; Brittin, S.B.; Sper, R.; Fraga, M.; Caixeta, L.; Ricci, A.; Guard, C.L.; Butler, W.R.; Gilbert, R.O. Association between uterine disease and indicators of neutrophil and systemic energy status in lactating holstein cows. J. Dairy Sci. 2010, 93, 2926–2937. [Google Scholar] [CrossRef]
- Andrew, S.M.; Waldo, D.R.; Erdman, R.A. Direct analysis of body composition of dairy cows at threephysiological stages. J. Dairy Sci. 1994, 77, 3022–3033. [Google Scholar] [CrossRef] [PubMed]
- Andrew, S.M.; Erdman, R.A.; Waldo, D.R. Prediction of body composition of dairy cows at three physiological stages from deuterlum oxide and urea dilutlon. J. Dairy Sci. 1995, 78, 1083–1095. [Google Scholar] [CrossRef] [PubMed]
- Van Knegsel, A.T.; van den Brand, M.H.; Dijkstra, J.; Kemp, B. Effects of dietary energy source on energy balance, metabolites and reproduction variables in dairy cows in early lactation. Theriogenology 2007, 68, S274–S280. [Google Scholar] [CrossRef]
- Van der Drift, S.G.; Houweling, A.M.; Schonewille, J.T.; Tielens, A.G.M.; Jorritsma, R. Protein and fat mobilization and associations with serum β-hydroxybutyrate concentrations in dairy cows. J. Dairy Sci. 2012, 95, 4911–4920. [Google Scholar] [CrossRef] [PubMed]
- Johnson, P.; Perry, S.V. Biological activity and the 3-methylhistidine content of actine and myosin. Biochem. J. 1970, 119, 293–298. [Google Scholar] [CrossRef] [PubMed]
- Young, V.R.; Alexis, S.D.; Baliga, B.S.; Munro, H.N.; Muecke, W. Metabolism of administered 3-methylhistidine: Lack of muscle transfer ribonucleic acid charging and quantitative excretion as 3-methylhistidine and its ñ-acetyl derivative. J. Biol. Chem. 1972, 247, 3592–3600. [Google Scholar] [CrossRef] [PubMed]
- Ferguson, J.D.; Galligana, D.T.; Thomsen, N. Principal descriptors of body condition score in Holstein cows. J. Dairy Sci. 1994, 77, 2695–2703. [Google Scholar] [CrossRef]
- Sheldon, I.M.; Cronin, J.; Goetze, L.; Donofrio, G.; Schuberth, H.J. Defining postpartum uterine disease and the mechanisms of infection and immunity in the female reproductive tract in cattle. Biol. Reprod. 2009, 81, 1025–1032. [Google Scholar] [CrossRef]
- Kanda, Y. Investigation of the freely available easy-to-use software ‘EZR’ for medical statistics. Bone Marrow Transpl. 2013, 48, 452–458. [Google Scholar] [CrossRef]
- Dadarwal, D.; González-Cano, P.; Dickinson, R.; Griebel, P.; Palmer, C. Characterization of cytokine gene expression in uterine cytobrush samples of non-endometritic versus endometritic postpartum dairy cows. Theriogenology 2019, 126, 128–139. [Google Scholar] [CrossRef]
- Madoz, L.V.; Giuliodori, M.J.; Jaureguiberry, M.; Plöntzke, J.; Drillich, M.; de la Sota, R.L. The relationship between endometrial cytology during estrous cycle and cutoff points for the diagnosis of subclinical endometritis in grazing dairy cows. J. Dairy Sci. 2013, 96, 4333–4339. [Google Scholar] [CrossRef] [PubMed]
- Barlund, C.S.; Carruthers, T.D.; Waldner, C.L.; Palmer, C.W. A comparison of diagnostic techniques for postpartum endometritis in dairy cattle. Theriogenology 2008, 69, 714–723. [Google Scholar] [CrossRef] [PubMed]
- Denis-Robichaud, J.; Dubuc, J. Determination of optimal diagnostic criteria for purulent vaginal discharge and cytological endometritis in dairy cows. J. Dairy Sci. 2015, 98, 6848–6855. [Google Scholar] [CrossRef] [PubMed]
- Pires, J.A.; Delavaud, C.; Faulconnier, Y.; Pomiès, D.; Chilliard, Y. Effects of body condition score at calving on indicators of fat and protein mobilization of periparturient Holstein-Friesian cows. J. Dairy Sci. 2013, 96, 6423–6439. [Google Scholar] [CrossRef]
- Lin, S.Y.; Chen, W.Y.; Lee, F.Y.; Huang, C.J.; Sheu, W.H. Activation of ubiquitin-proteasome pathway is involved in skeletal muscle wasting in a rat model with biliary cirrhosis: Potential role of TNF-α. Am. J. Physiol. Endocrinol. Metab. 2005, 288, E493–E501. [Google Scholar] [CrossRef]
- Sishi, B.J.; Engelbrecht, A.M. Tumor necrosis factor alpha (TNF-α) inactivates the PI3-kinase/PKB pathway and induces atrophy and apoptosis in L6 myotubes. Cytokine 2011, 54, 173–184. [Google Scholar] [CrossRef]
- Drackley, J.K.; Wallace, R.L.; Graugnard, D.; Vasquez, J.; Richards, B.F.; Loor, J.J. Visceral adipose tissue mass in nonlactating dairy cows fed diets differing in energy density. J. Dairy Sci. 2014, 97, 3420–3430. [Google Scholar] [CrossRef]
- Schröder, U.J.; Staufenbiel, R. Invited review: Methods to determine body fat reserves in the dairy cow with special regard to ultrasonographic measurement of backfat thickness. J. Dairy Sci. 2006, 89, 1–14. [Google Scholar] [CrossRef]
- Marczuk, J.; Brodzki, P.; Brodzki, A.; Kurek, Ł. The concentration of free amino acids in blood serum of dairy cows with primary ketosis. Pol. J. Vet. Sci. 2018, 21, 149–156. [Google Scholar] [CrossRef]
- Li, Y.; Xu, C.; Xia, C.; Zhang, H.; Sun, L.; Gao, Y. Plasma metabolic profiling of dairy cows affected with clinical ketosis using LC/MS technology. Vet. Q. 2014, 34, 152–158. [Google Scholar] [CrossRef]
- Zhang, Y.; Proenca, R.; Maffei, M.; Barone, M.L.; Leopold, L.; Friedman, J.M. Positional cloning of the mouse obese gene and its human homologue. Nature 1994, 372, 425–432. [Google Scholar] [CrossRef] [PubMed]
- Saucillo, D.C.; Gerriets, V.A.; Sheng, J.; Rathmell, J.C.; Maciver, N.J. Leptin metabolically licenses T cells for activation to link nutrition and immunity. J. Immunol. 2014, 192, 136–144. [Google Scholar] [CrossRef] [PubMed]
- Martinez, N.; Sinedino, L.D.; Bisinotto, R.S.; Ribeiro, E.S.; Gomes, G.C.; Lima, F.S.; Greco, L.F.; Risco, C.A.; Galvão, K.N.; Taylor-Rodriguez, D.; et al. Effect of induced subclinical hypocalcemia on physiological responses and neutrophil function in dairy cows. J. Dairy Sci. 2014, 97, 874–887. [Google Scholar] [CrossRef] [PubMed]
- Heppelmann, M.; Krach, K.; Krueger, L.; Benz, P.; Herzog, L.; Piechotta, M.; Hoedemaker, M.; Bollwein, H. The effect of metritis and subclinical hypocalcemia on uterine involution in dairy cows evaluated by sonomicrometry. J. Reprod. Dev. 2015, 61, 565–569. [Google Scholar] [CrossRef] [PubMed]


| Amino Acid 2. | Early | Late |
|---|---|---|
| Leu | 148.7 ± 6.1 | 133.9 ± 7.4 |
| Lys | 73.5 ± 3.4 | 68.7 ± 3.5 |
| Ala | 200.6± 12.3 | 203.8 ± 16.6 |
| Arg | 57.1 ± 2.9 | 62.5 ± 7.1 |
| Asn | 39.4 ± 1.8 | 38.3 ± 1.8 |
| Asp | 5.5 ± 0.5 | 5.2 ± 0.3 |
| Gln | 194.9 ± 6.6 | 204.9 ± 7.3 |
| Glu | 54.5 ± 1.7 | 52.2 ± 2.3 |
| Gly | 448.9 ± 18.3 | 477.8 ± 35.3 |
| His | 46.9 ± 2.2 | 50.1 ± 2.6 |
| Met | 19.6 ± 1.2 | 18.6 ± 1.2 |
| Orn | 24.1 ± 1.4 | 24.2 ± 1.3 |
| Pro | 75.0 ± 2.6 | 74.2 ± 4.3 |
| Ser | 79.7 ± 5.1 | 79.0 ± 5.3 |
| Thr | 69.4 ± 5.6 | 62.4 ± 6.2 |
| Val | 252.9 ± 10.9 | 236.1 ± 12.2 |
| Ile | 157.9 ± 9.5 | 145.5 ± 9.4 |
| Phe | 49.5 ± 1.4 | 47.5 ± 1.7 |
| Trp | 35.1 ± 1.7 | 31.1 ± 2.3 |
| Tyr | 42.6 ± 2.0 | 38.7 ± 2.7 |
| 1-MH | 10.4 ± 0.6 A | 12.3 ± 0.8 B |
| 3-MH | 7.9 ± 0.6 a | 10.4 ± 1.0 b |
| α-AAA | 2.8 ± 0.4 | 2.9 ± 0.4 |
| α-ABA | 31.7 ± 2.3 | 33.7 ± 3.1 |
| Car | 8.9 ± 0.6 | 9.3 ± 1.1 |
| Cit | 59.2 ± 2.3 | 66.4 ± 3.8 |
| Tau | 36.2 ± 2.2 | 40.4 ± 4.2 |
| Fischer ratio | 5.7 ± 0.4 | 5.5 ± 0.5 |
Publisher’s Note: MDPI stays neutral with regard to jurisdictional claims in published maps and institutional affiliations. |
© 2022 by the authors. Licensee MDPI, Basel, Switzerland. This article is an open access article distributed under the terms and conditions of the Creative Commons Attribution (CC BY) license (https://creativecommons.org/licenses/by/4.0/).
Share and Cite
Sato, R.; Koyama, S.; Yasukawa, M.; Inoue, T.; Matsumura, T.; Kanazawa, A.; Nozue, Y.; Wada, Y.; Yoshimura, I.; Hagita, Y.; et al. Evaluation of Prolonged Endometrial Inflammation Associated with the Periparturient Metabolic State in Dairy Cows. Animals 2022, 12, 3401. https://doi.org/10.3390/ani12233401
Sato R, Koyama S, Yasukawa M, Inoue T, Matsumura T, Kanazawa A, Nozue Y, Wada Y, Yoshimura I, Hagita Y, et al. Evaluation of Prolonged Endometrial Inflammation Associated with the Periparturient Metabolic State in Dairy Cows. Animals. 2022; 12(23):3401. https://doi.org/10.3390/ani12233401
Chicago/Turabian StyleSato, Rena, Saku Koyama, Miya Yasukawa, Takuma Inoue, Tomochika Matsumura, Asuka Kanazawa, Yukari Nozue, Yuriko Wada, Itaru Yoshimura, Yujiro Hagita, and et al. 2022. "Evaluation of Prolonged Endometrial Inflammation Associated with the Periparturient Metabolic State in Dairy Cows" Animals 12, no. 23: 3401. https://doi.org/10.3390/ani12233401
APA StyleSato, R., Koyama, S., Yasukawa, M., Inoue, T., Matsumura, T., Kanazawa, A., Nozue, Y., Wada, Y., Yoshimura, I., Hagita, Y., Mizutani, H., Tajima, T., Ajito, T., & Miura, R. (2022). Evaluation of Prolonged Endometrial Inflammation Associated with the Periparturient Metabolic State in Dairy Cows. Animals, 12(23), 3401. https://doi.org/10.3390/ani12233401