
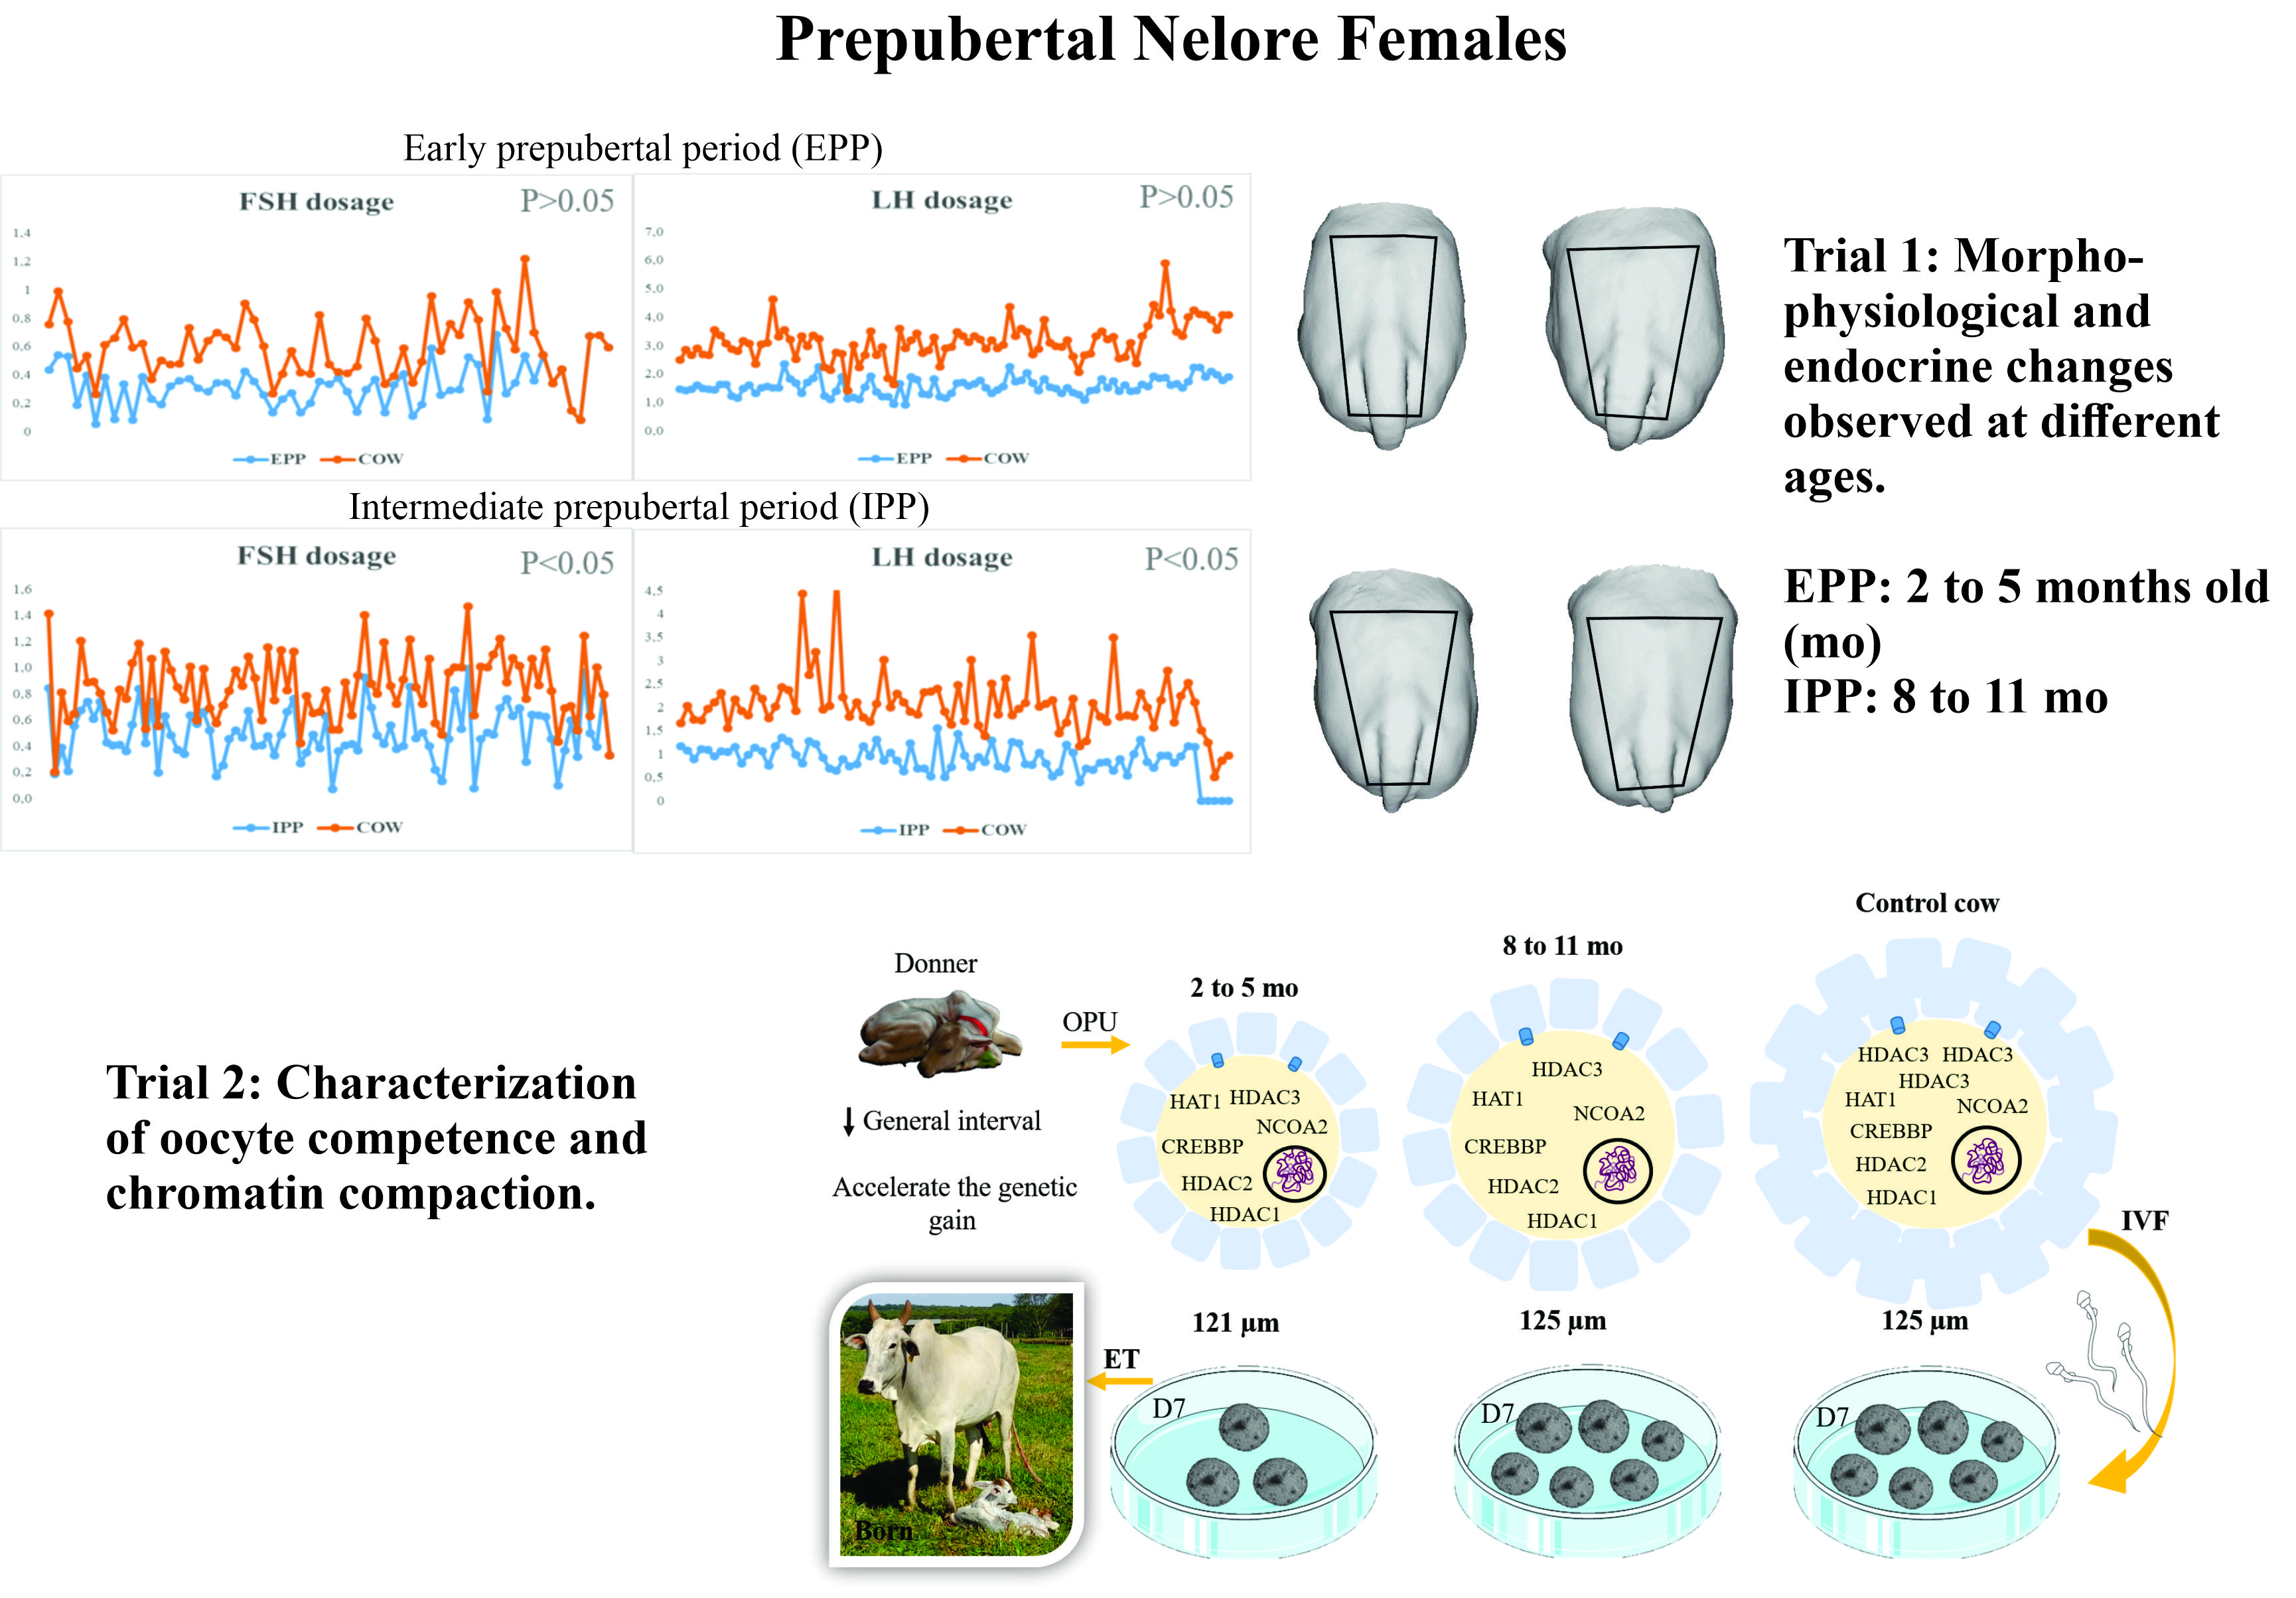
Dynamics of the Reproductive Changes and Acquisition of Oocyte Competence in Nelore (Bos taurus indicus) Calves during the Early and Intermediate Prepubertal Periods

 , , ,
, , ,  , , , and
Abstract
Simple Summary
Abstract

1. Introduction
2. Materials and Methods
2.1. Animals and Location
2.2. Experimental Design
2.2.1. Trial 1
2.2.2. Trial 2
2.3. Ultrasonographic Evaluations
2.4. Blood Samples and Hormonal Measurements
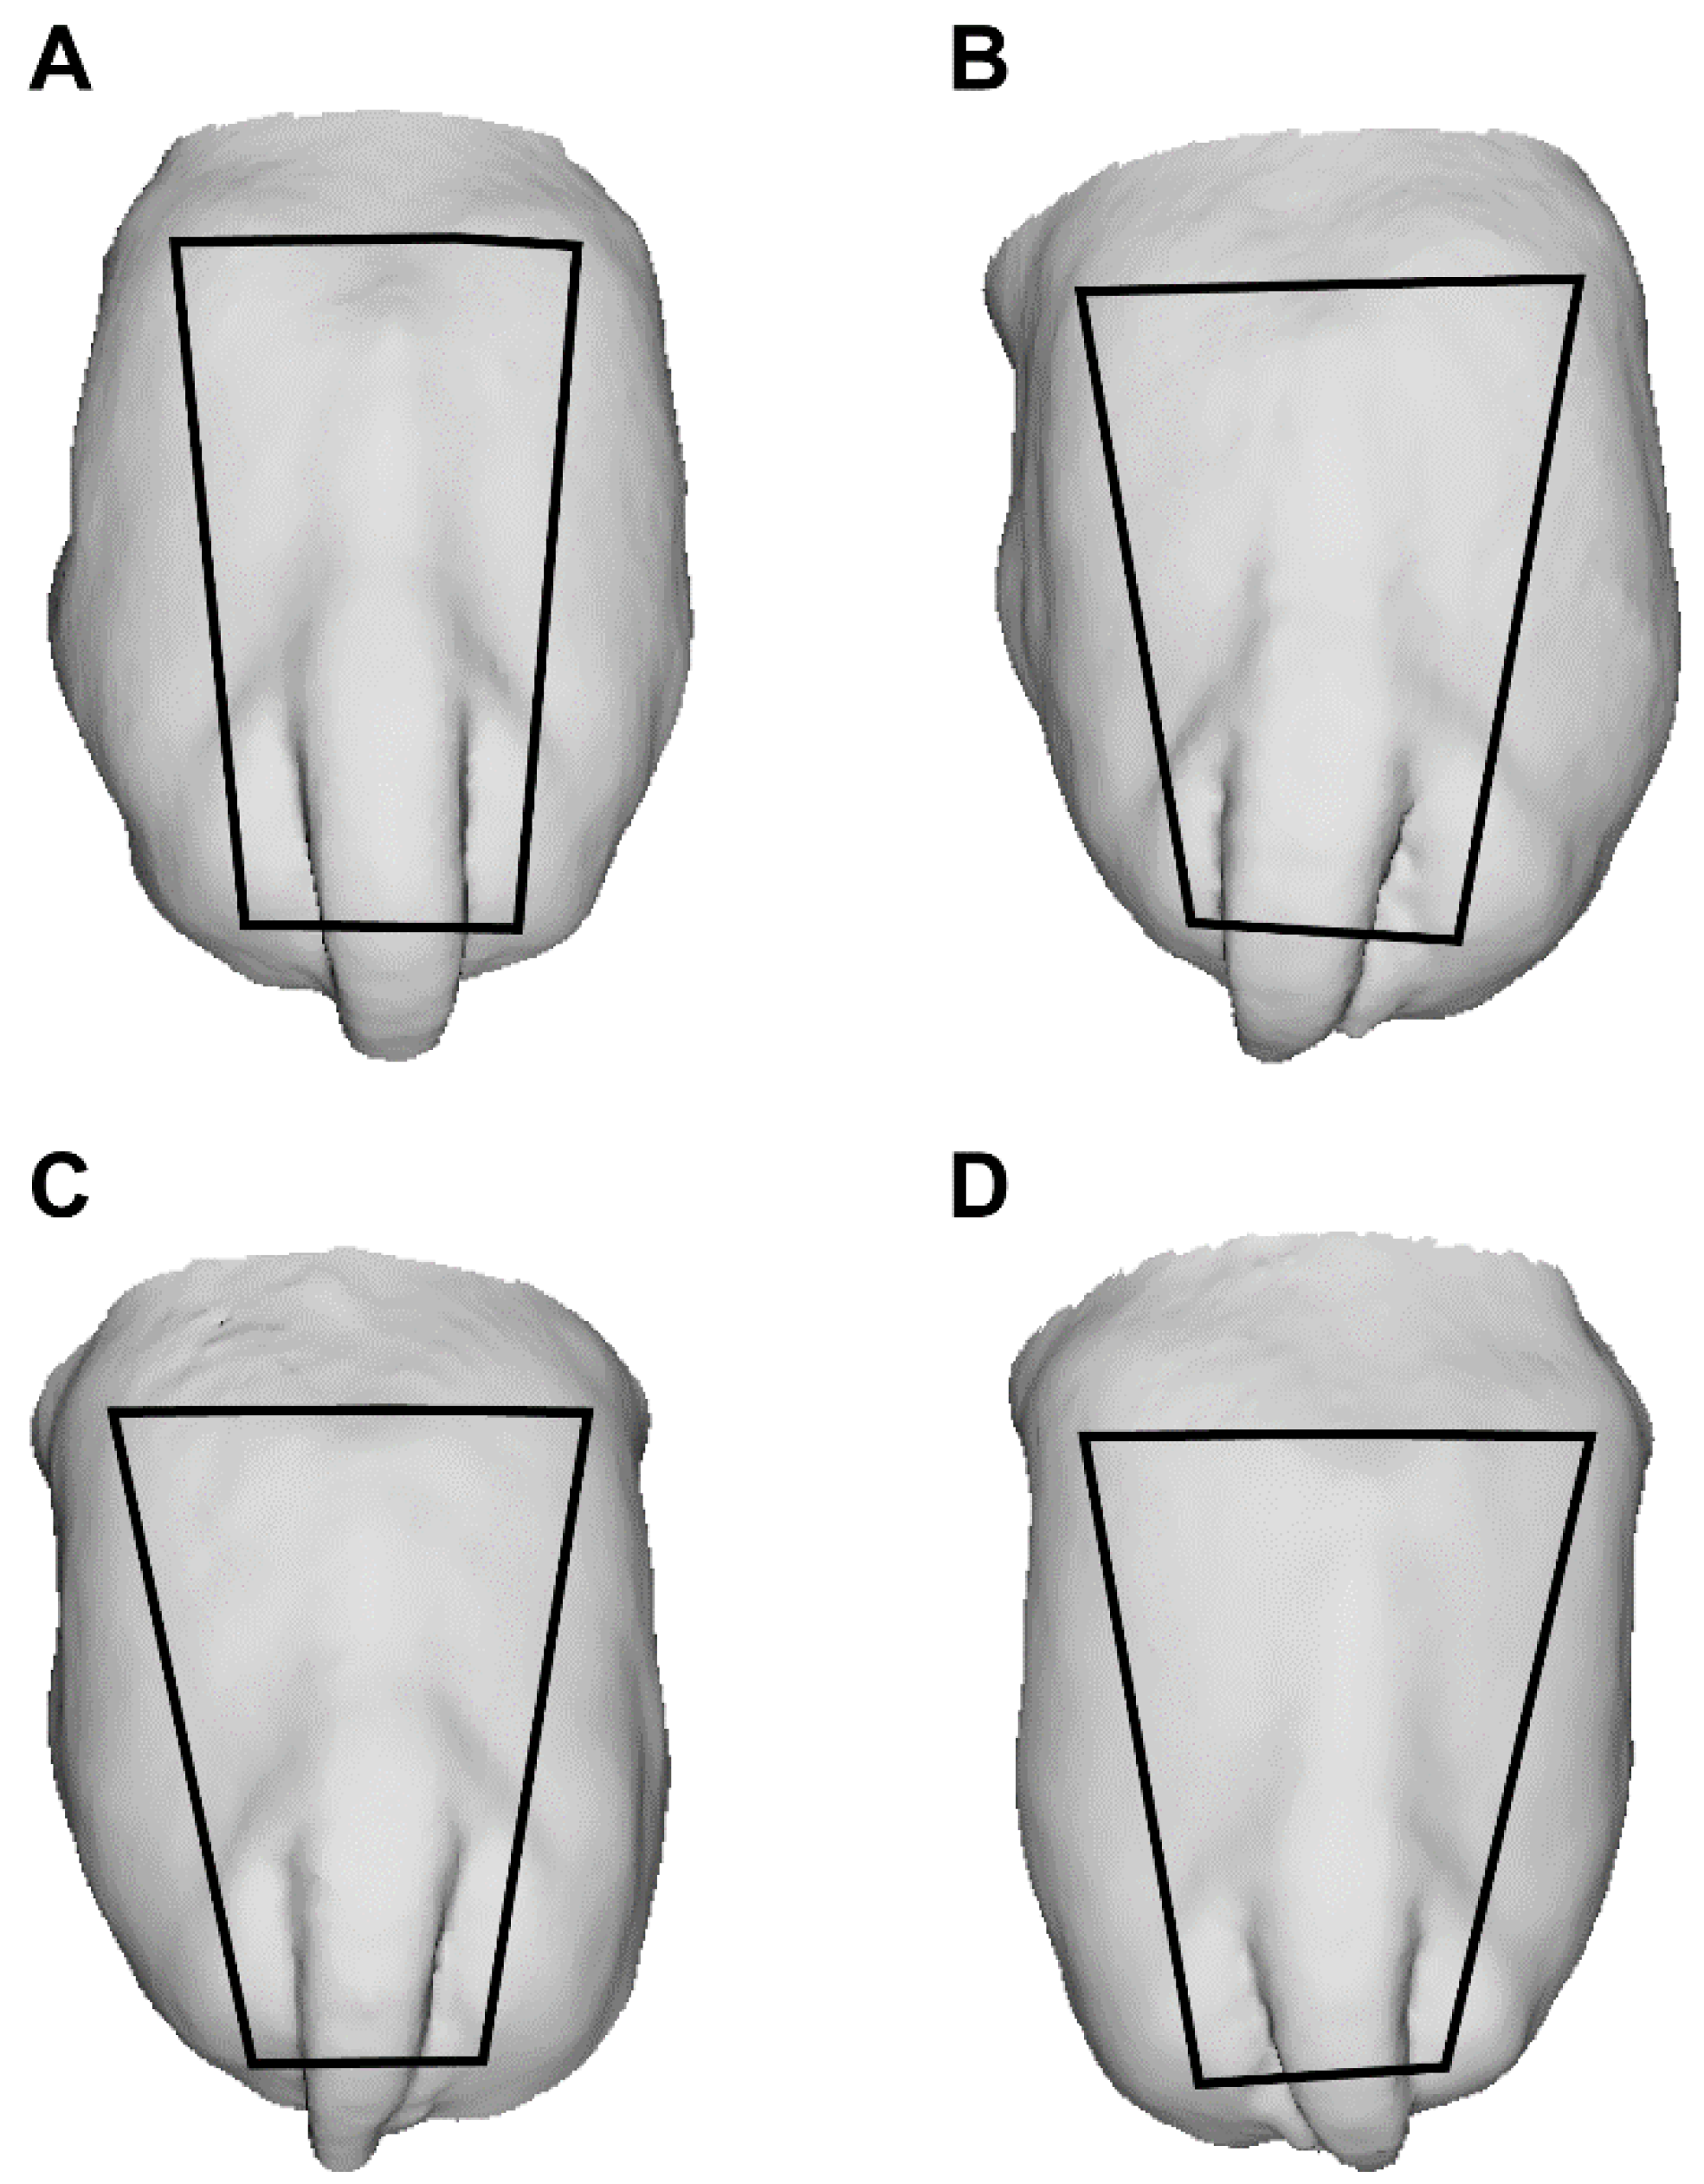
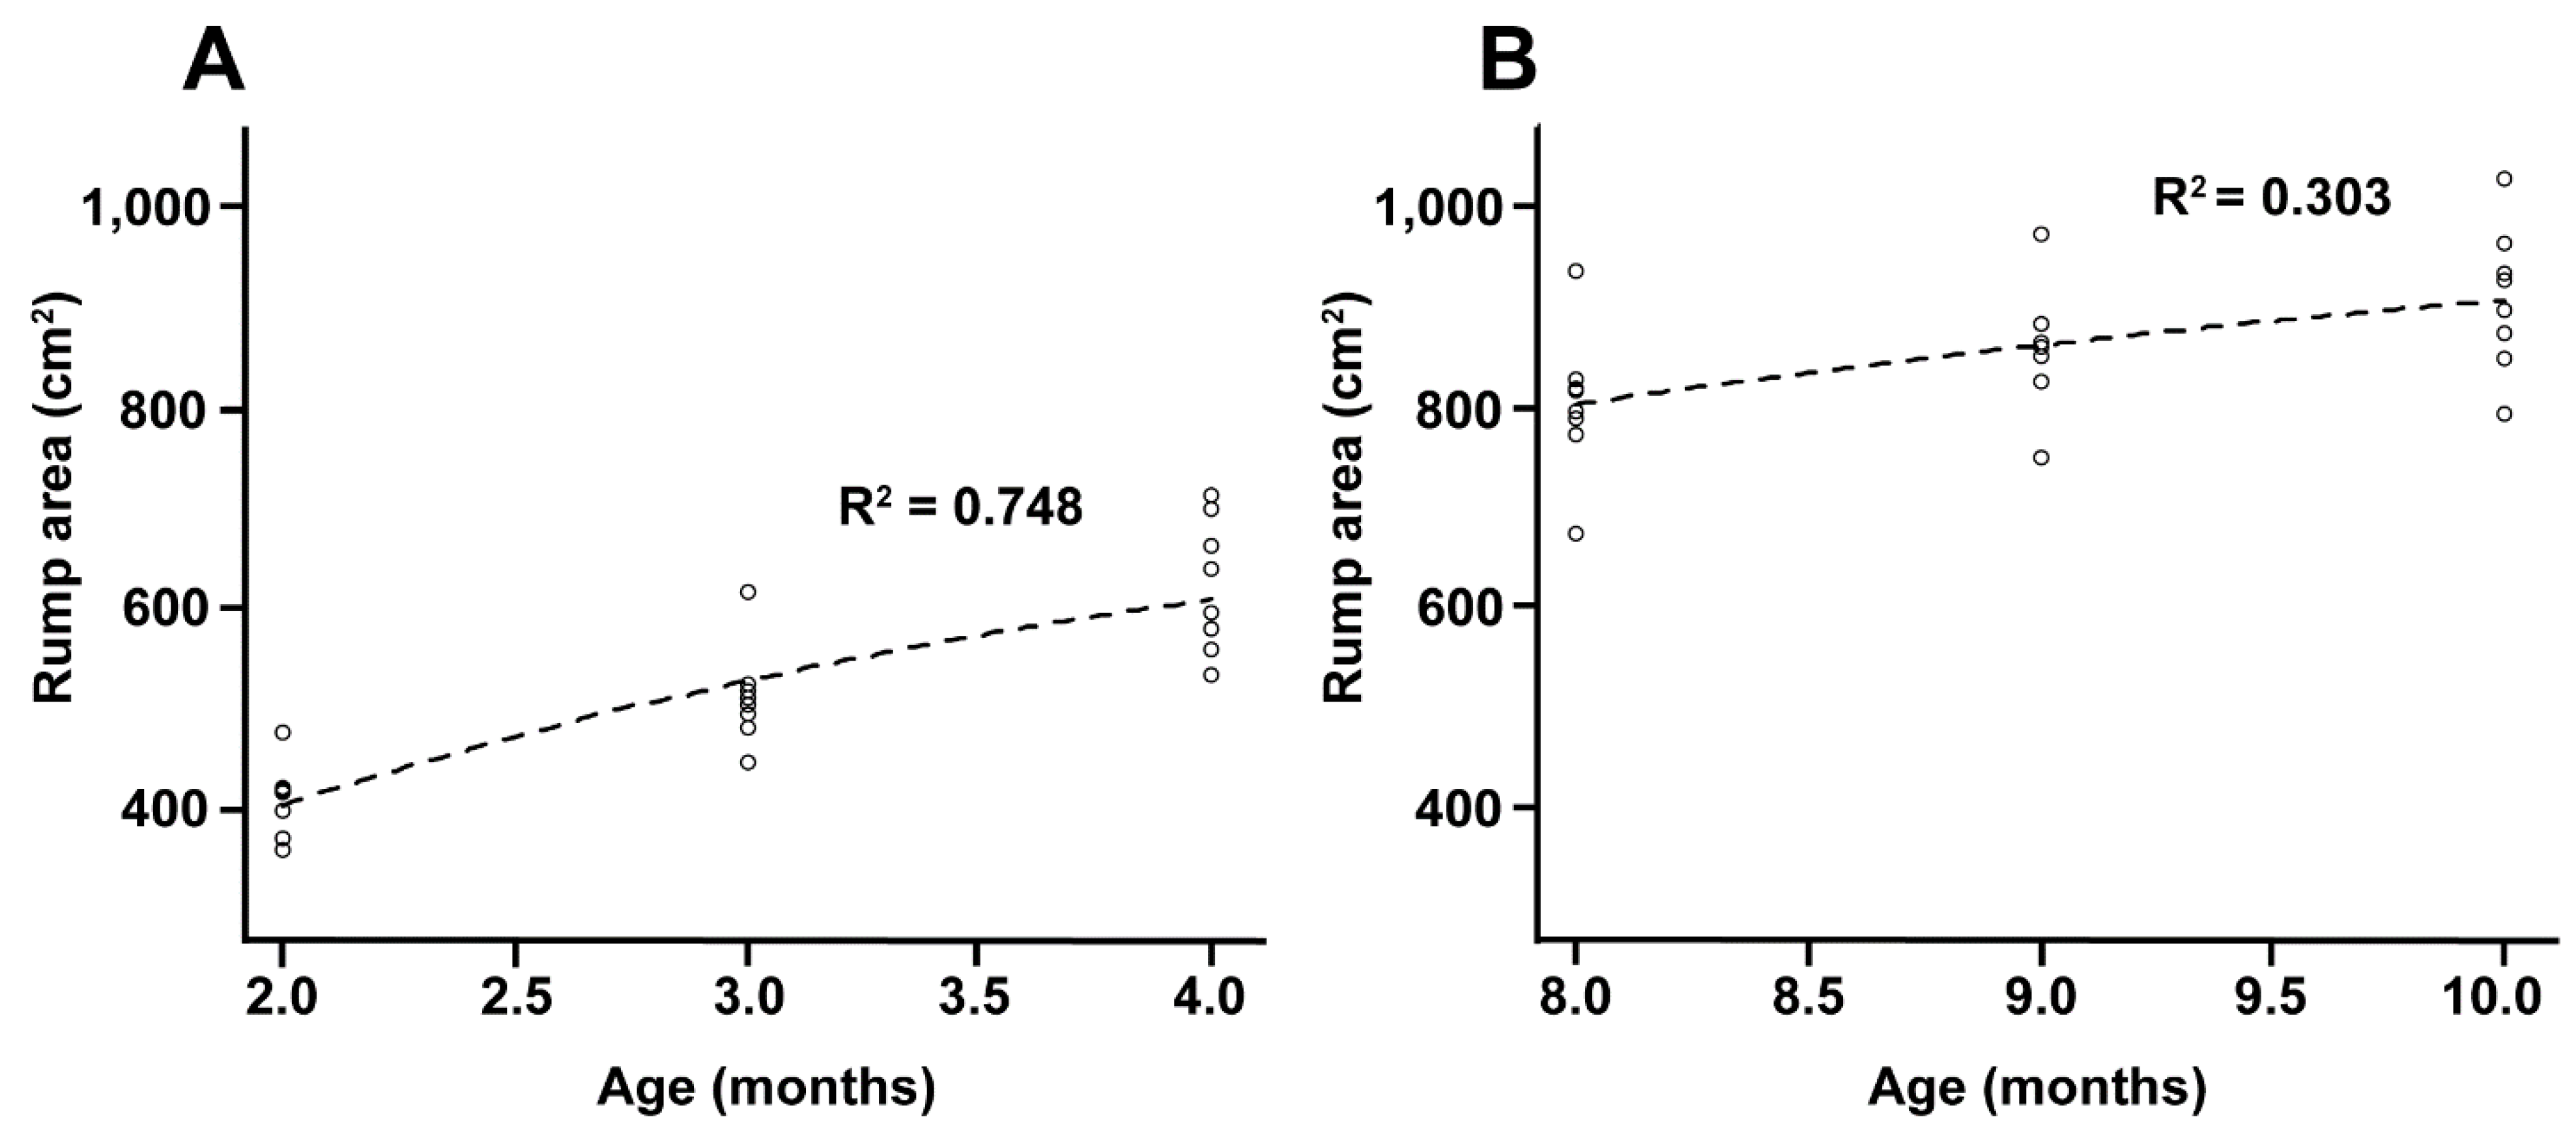
2.5. Rump Biometric Data
2.6. Oocyte Recovery
2.7. Morphology and Oocyte Diameter Analysis
2.8. In Vitro Embryo Production (IVEP)
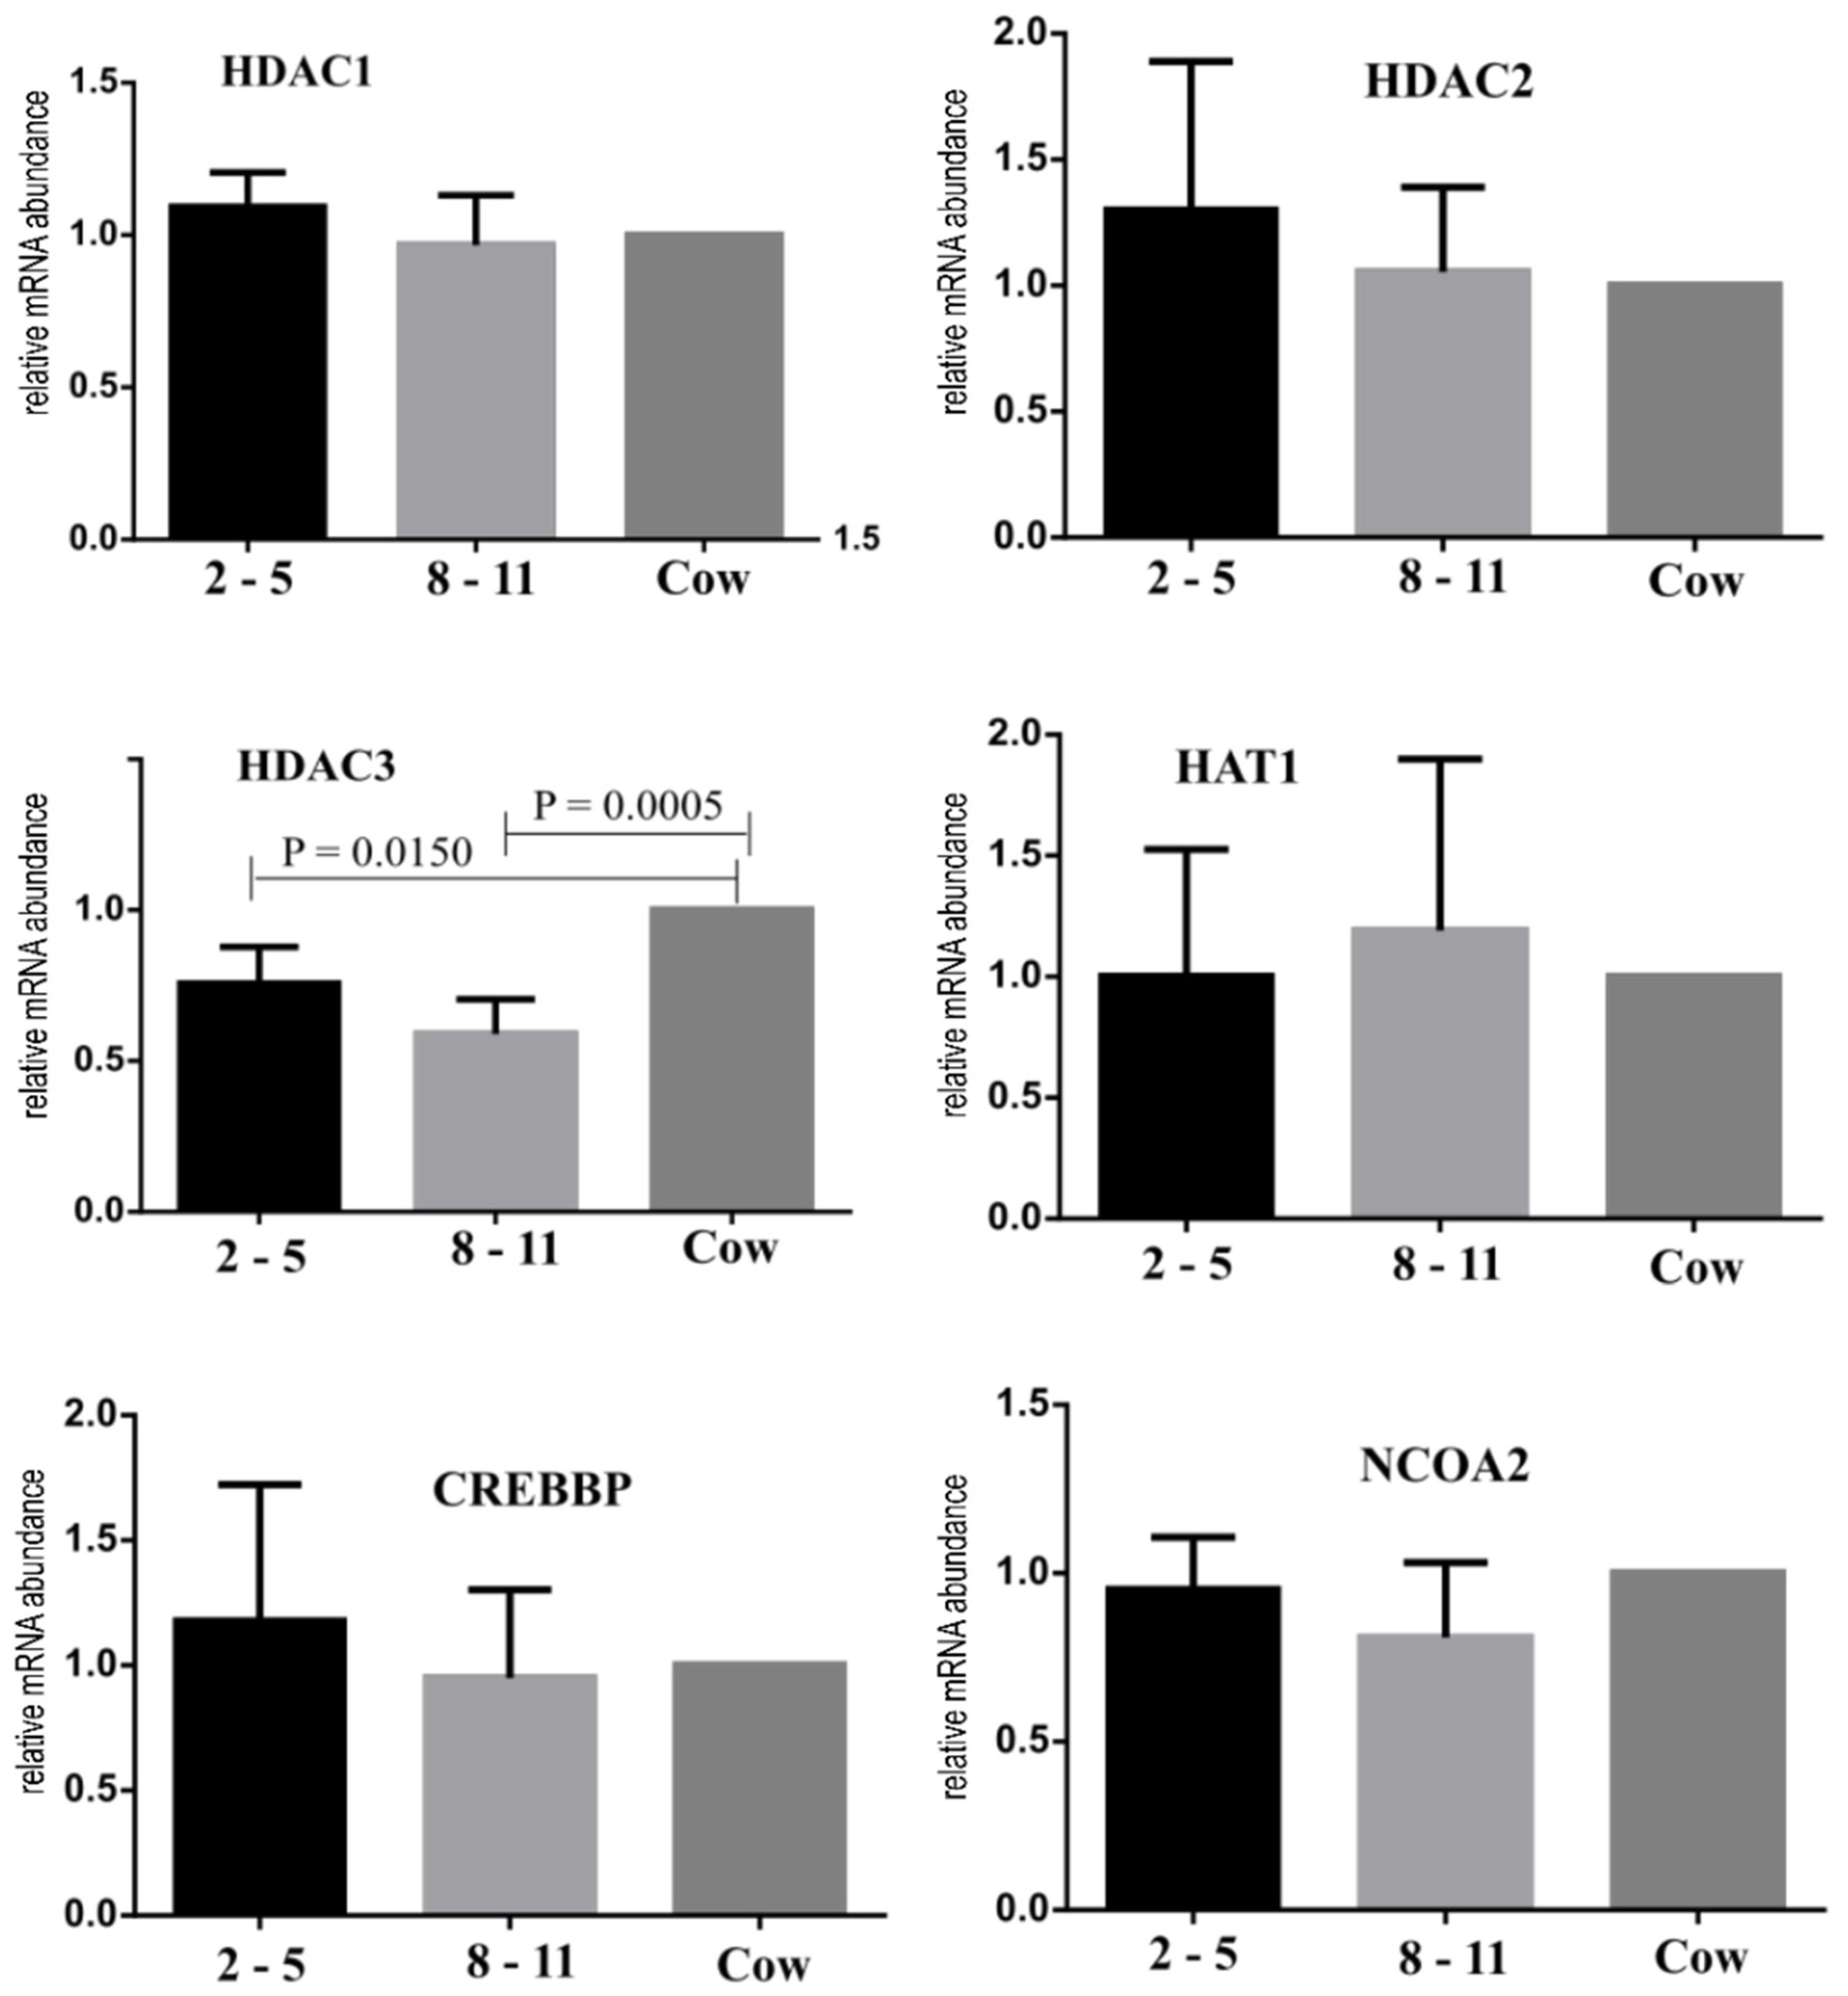
2.9. RNA Extraction, Complementary DNA (cDNA) Synthesis and Real-Time PCR (qPCR)
2.10. Statistical Analysis
3. Results
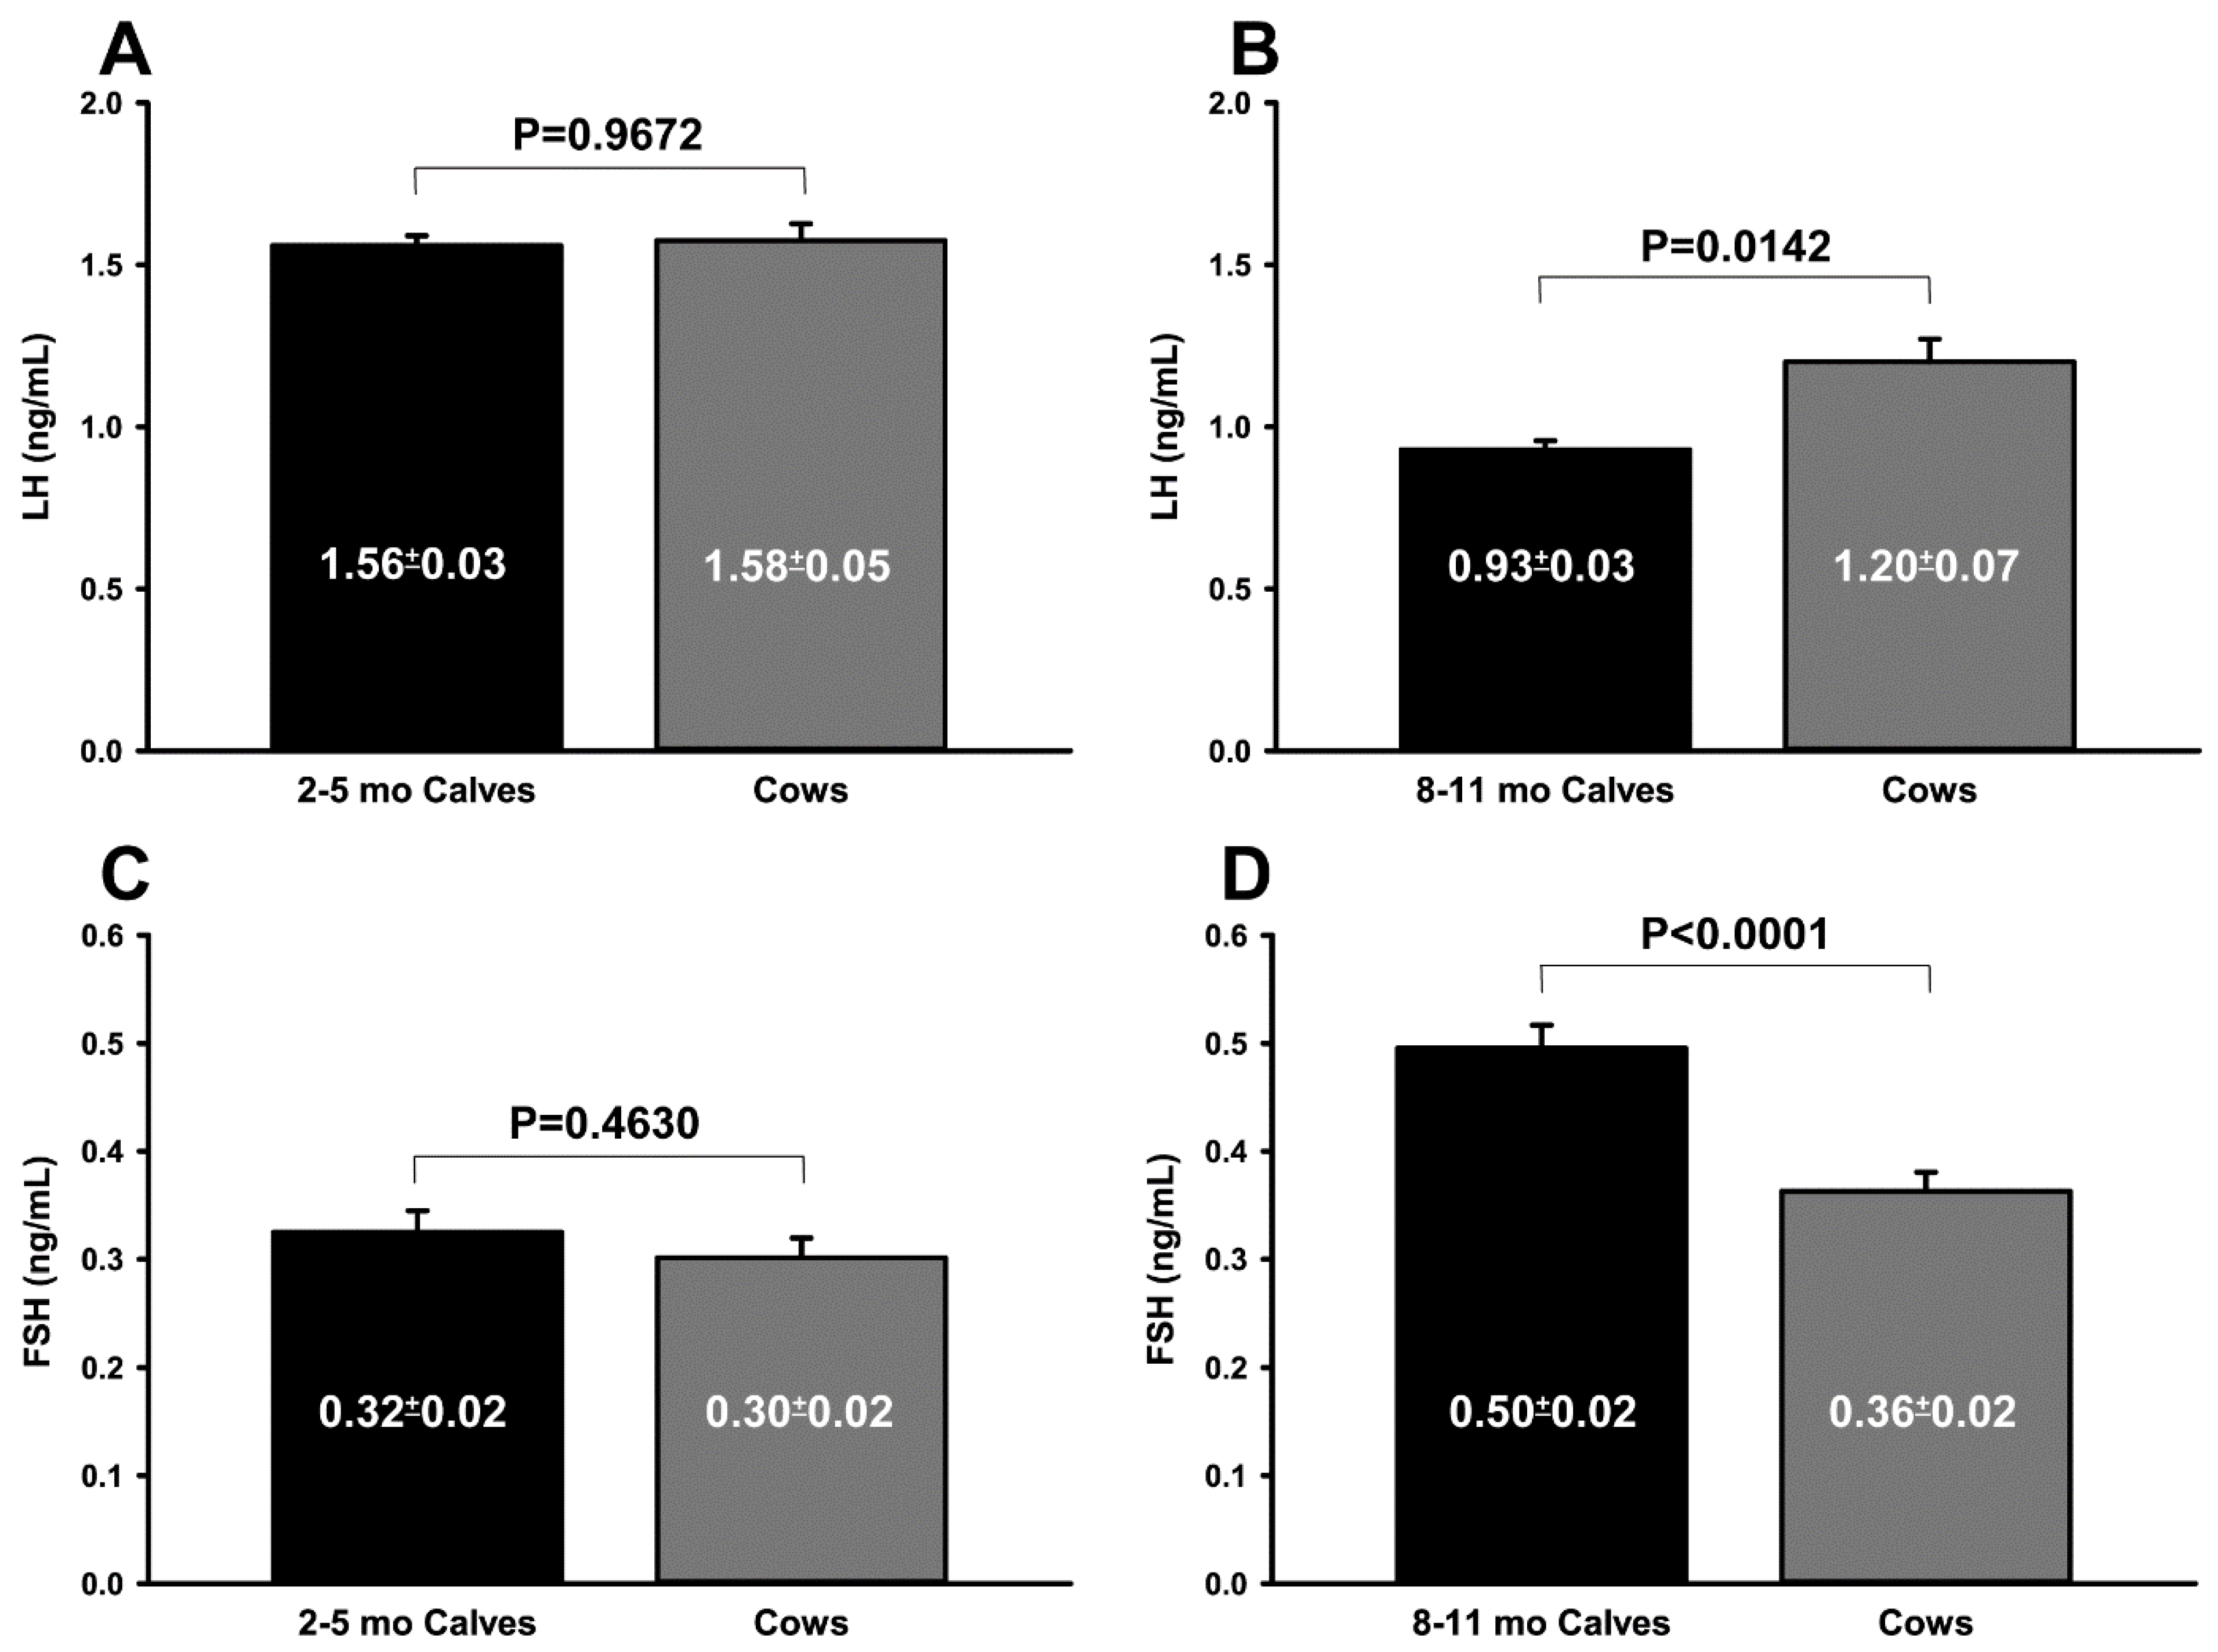
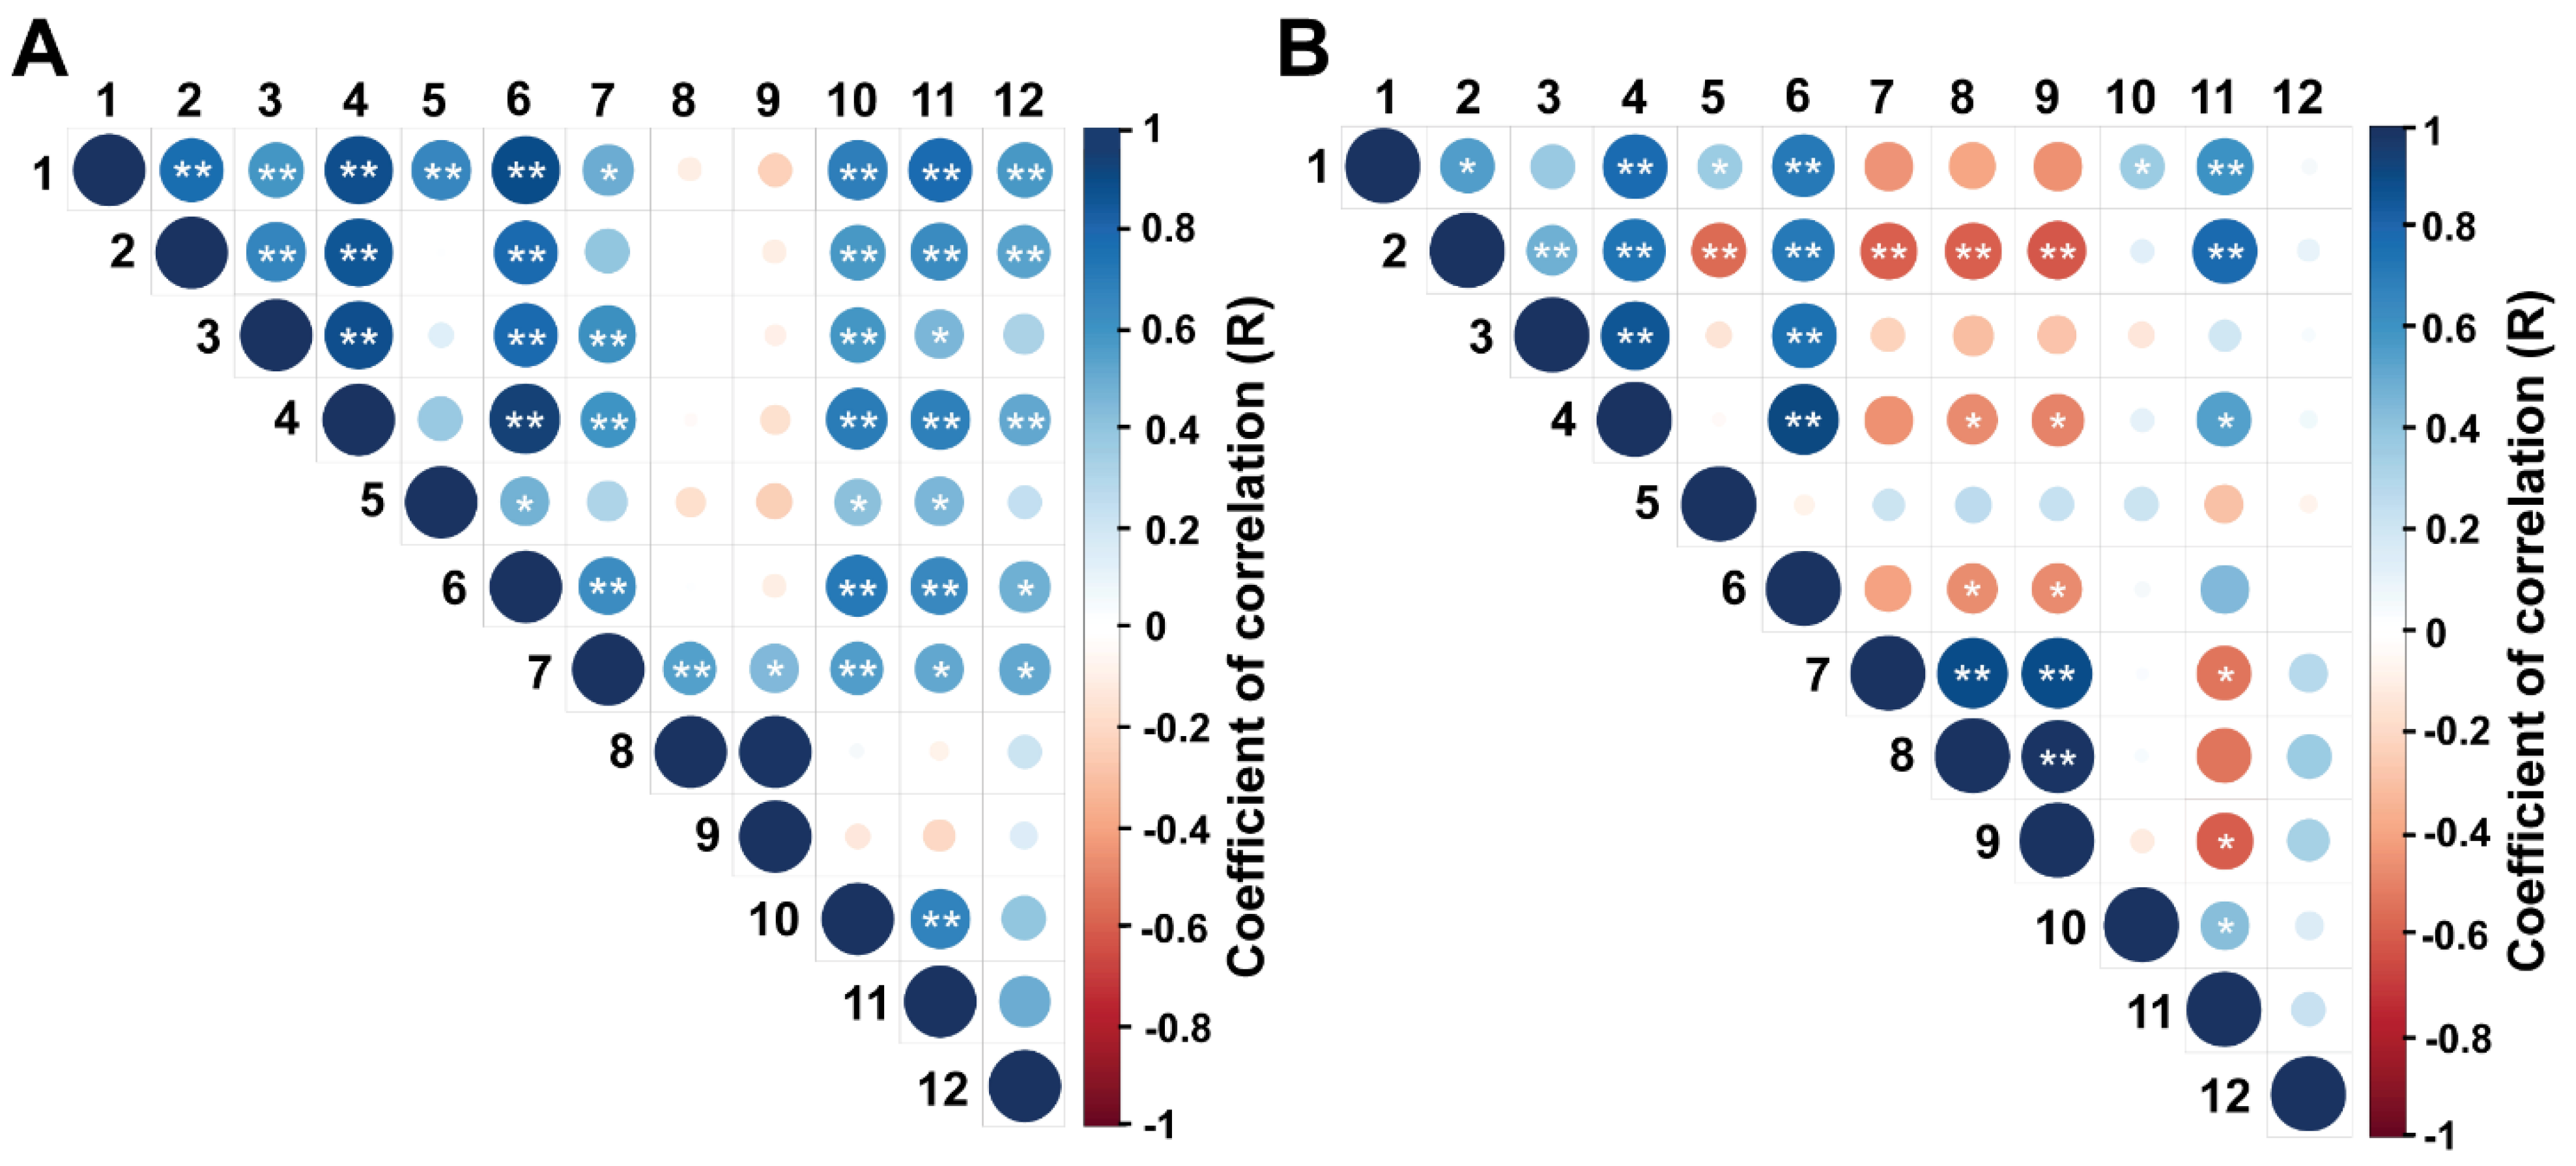
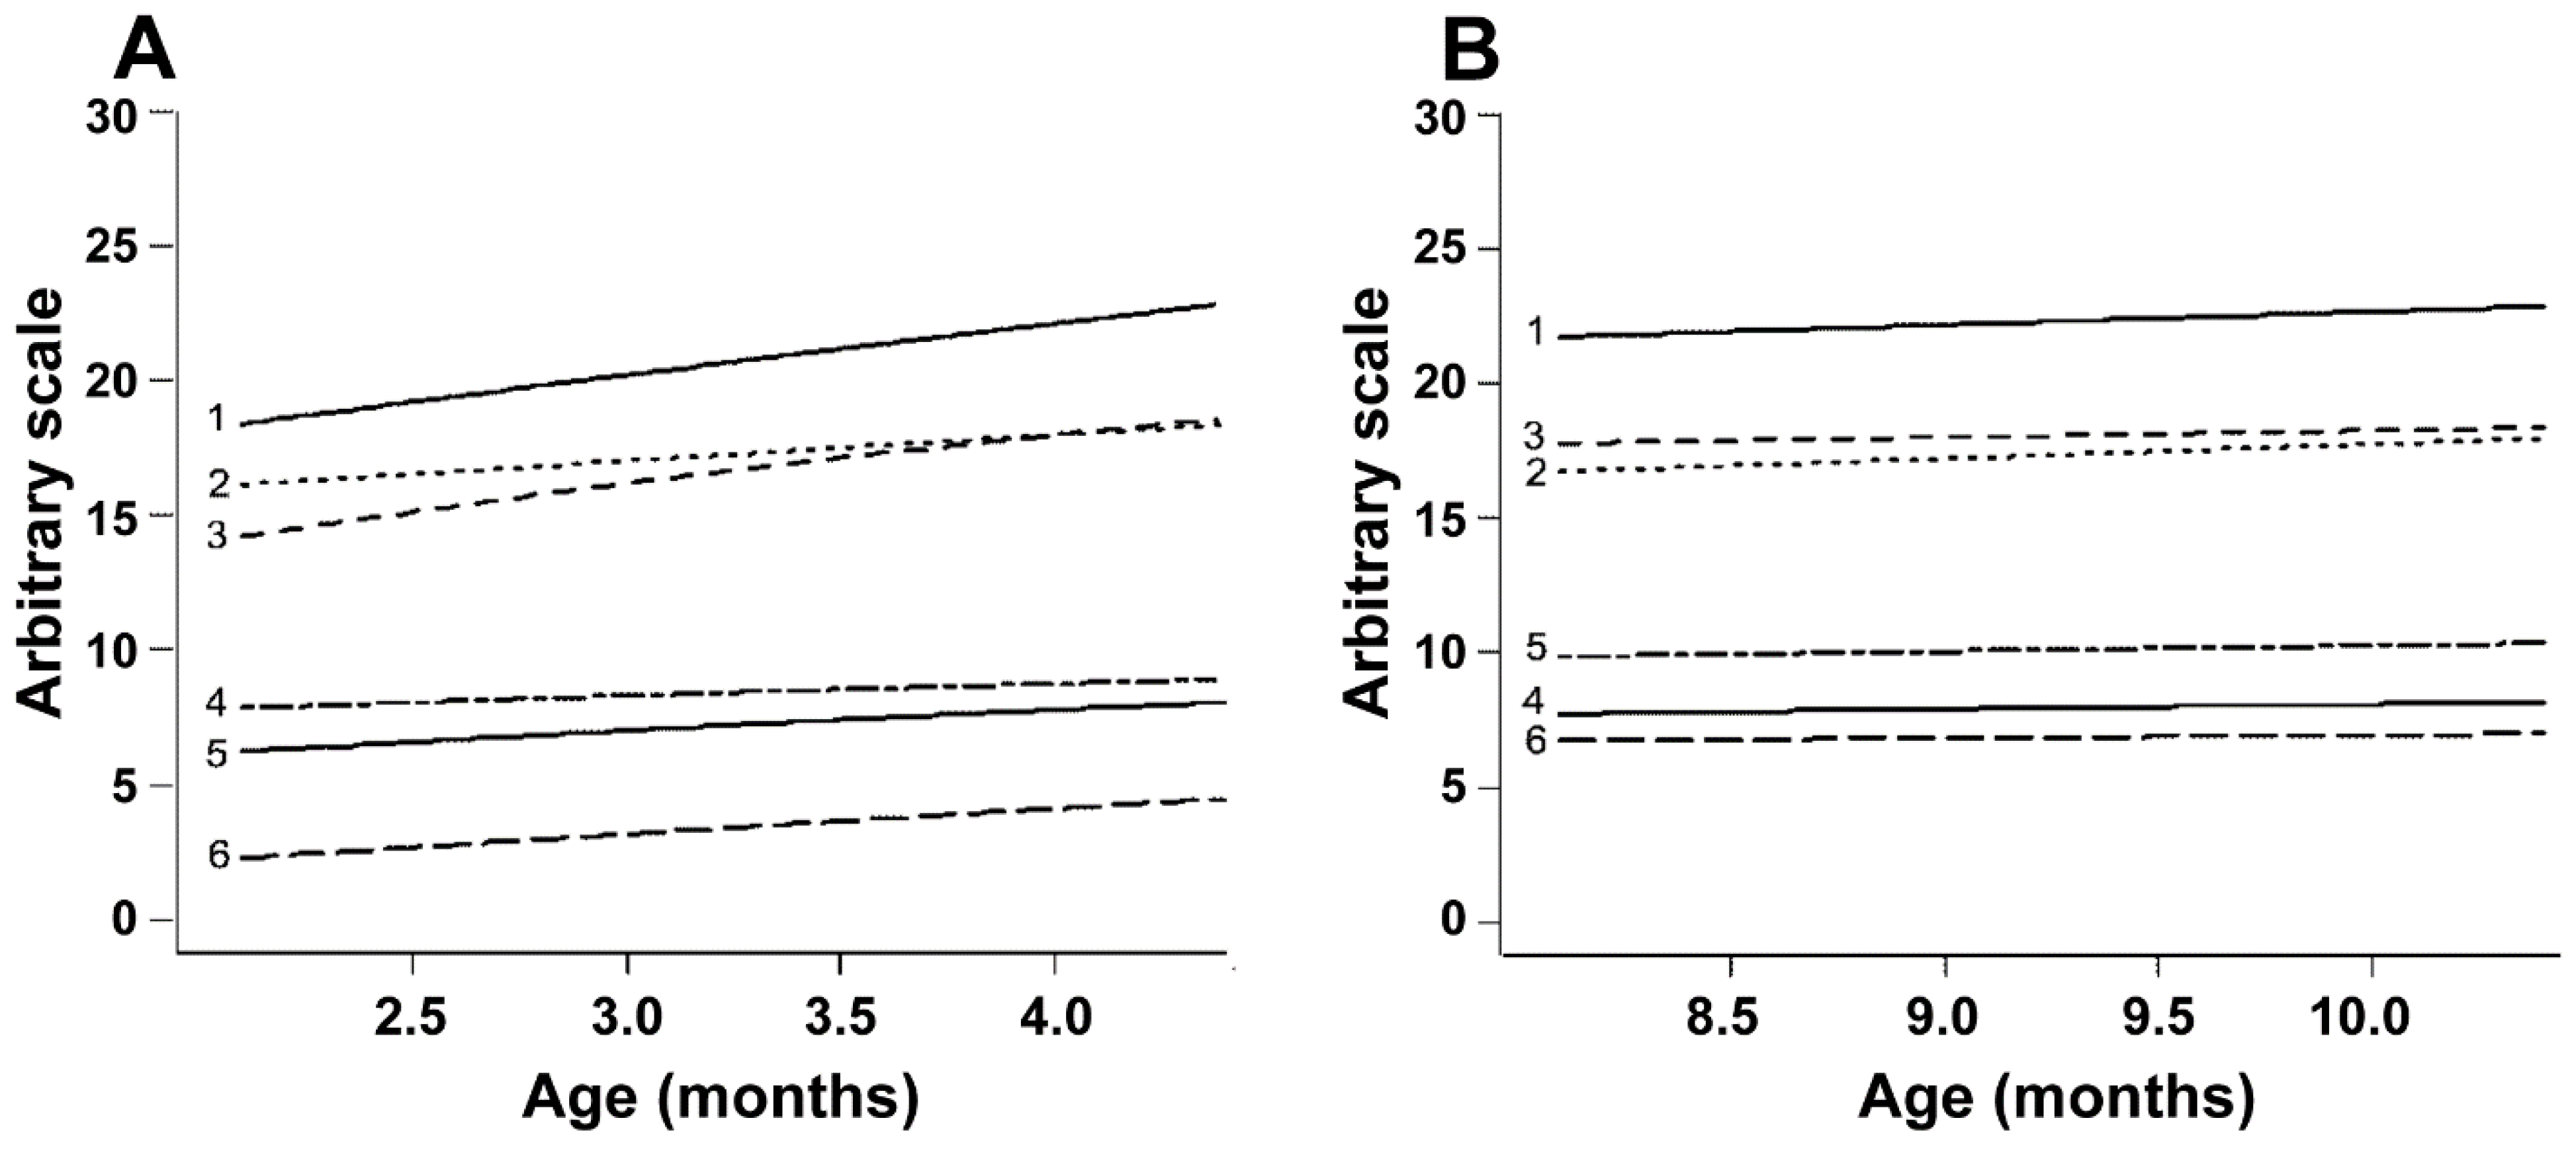
3.1. Trial 1
3.2. Trial 2
4. Discussion
5. Conclusions
Author Contributions
Funding
Institutional Review Board Statement
Informed Consent Statement
Data Availability Statement
Acknowledgments
Conflicts of Interest
References
- Rawlings, N.C.; Evans, A.C.O.; Honaramooz, A.; Bartlewski, P.M. Antral follicle growth and endocrine changes in prepubertal cattle, sheep and goats. Anim. Reprod. Sci. 2003, 78, 259–270. [Google Scholar] [CrossRef]
- Hernandez-Medrano, J.H.; Campbell, B.K.; Webb, R. Nutritional Influences on Folliculogenesis. Reprod. Domest. Anim. 2012, 47, 274–282. [Google Scholar] [CrossRef]
- Kuiri-Hänninen, T.; Sankilampi, U.; Dunkel, L. Activation of the Hypothalamic-Pituitary-Gonadal Axis in Infancy: Minipuberty. Horm. Res. Paediatr. 2014, 82, 73–80. [Google Scholar] [CrossRef]
- Torres-Rovira, L.; Succu, S.; Pasciu, V.; Manca, M.E.; Gonzalez-Bulnes, A.; Leoni, G.G.; Pennino, M.G.; Spezzigu, A.; Gallus, M.; Dattena, M.; et al. Postnatal pituitary and follicular activation: A revisited hypothesis in a sheep model. Reproduction 2016, 151, 215–225. [Google Scholar] [CrossRef]
- Connelly, K.J.; Larson, E.A.; Marks, D.L.; Klein, R.F. Neonatal estrogen exposure results in biphasic age-dependent effects on the skeletal development of male mice. Endocrinology 2015, 156, 193–202. [Google Scholar] [CrossRef][Green Version]
- Smith, M.F.; Geisert, R.D.; Parrish, J.J. Reproduction in domestic ruminants during the past 50 yr: Discovery to application. J. Anim. Sci. 2018, 96, 2952–2970. [Google Scholar] [CrossRef]
- Oursler, M.J.; Cortese, C.; Keeting, P.; Anderson, M.A.; Bonde, S.K.; Riggs, B.L.; Spelsberg, T.C. Modulation of Transforming Growth Factor-βProduction in Normal Human Osteoblast-Like Cells by 17β-Estradiol and Parathyroid Hormone. Endocrinology 1991, 129, 3313–3320. [Google Scholar] [CrossRef]
- Michael, H.; Härkönen, P.L.; Väänänen, H.K.; Hentunen, T.A. Estrogen and Testosterone Use Different Cellular Pathways to Inhibit Osteoclastogenesis and Bone Resorption. J. Bone Miner. Res. 2005, 20, 2224–2232. [Google Scholar] [CrossRef]
- Viana, J.H.M. 2020 Statistics of embryo production and transfer in domestic farm animals: World embryo industry grows despite the Pandemic. Embryo Technol. Newsl. 2021, 39, 4. [Google Scholar]
- Brogliatti, G.M.; Adams, G.P. Ultrasound-guided transvaginal oocyte collection in prepubertal calves. Theriogenology 1996, 45, 1163–1176. [Google Scholar] [CrossRef]
- Jiang, J.; Ma, L.; Prakapenka, D.; VanRaden, P.M.; Cole, J.B.; Da, Y. A Large-Scale Genome-Wide Association Study in U.S. Holstein Cattle. Front. Genet. 2019, 10, 412. [Google Scholar] [CrossRef]
- Monteiro, F.M.; Mercadante, M.E.Z.; Barros, C.M.; Satrapa, R.A.; Silva, J.A.V.; Oliveira, L.Z.; Saraiva, N.Z.; Oliveira, C.S.; Garcia, J.M. Reproductive tract development and puberty in two lines of Nellore heifers selected for postweaning weight. Theriogenology 2013, 80, 10–17. [Google Scholar] [CrossRef]
- Abeni, F.; Petrera, F.; Le Cozler, Y. Effects of feeding treatment on growth rates, metabolic profiles and age at puberty, and their relationships in dairy heifers. Animal 2019, 13, 1020–1029. [Google Scholar] [CrossRef]
- Oropeza, A.; Wrenzycki, C.; Herrmann, D.; Hadeler, K.-G.; Niemann, H. Improvement of the Developmental Capacity of Oocytes from Prepubertal Cattle by Intraovarian Insulin-Like Growth Factor-I Application. Biol. Reprod. 2004, 70, 1634–1643. [Google Scholar] [CrossRef]
- Batista, E.O.S.; Guerreiro, B.M.; Freitas, B.G.; Silva, J.C.B.; Vieira, L.M.; Ferreira, R.M.; Rezende, R.; Basso, A.; Lopes, R.; Rennó, F.; et al. Plasma anti-Müllerian hormone as a predictive endocrine marker to select Bos taurus (Holstein) and Bos indicus (Nelore) calves for in vitro embryo production. Domest. Anim. Endocrinol. 2016, 54, 1–9. [Google Scholar] [CrossRef]
- Currin, L.; Michalovic, L.; Bellefleur, A.-M.; Gutierrez, K.; Glanzner, W.G.; Schuermann, Y.; Bohrer, R.; Dicks, N.; da Rosa, P.R.; De Cesaro, M.P.; et al. The effect of age and length of gonadotropin stimulation on the in vitro embryo development of Holstein calf oocytes. Theriogenology 2017, 104, 87–93. [Google Scholar] [CrossRef]
- Baldassarre, H.; Currin, L.; Michalovic, L.; Bellefleur, A.-M.; Gutierrez, K.; Mondadori, R.G.; Glanzner, W.G.; Schuermann, Y.; Bohrer, R.C.; Dicks, N.; et al. Interval of gonadotropin administration for in vitro embryo production from oocytes collected from Holstein calves between 2 and 6 months of age by repeated laparoscopy. Theriogenology 2018, 116, 64–70. [Google Scholar] [CrossRef]
- Guerreiro, B.M.; Batista, E.O.S.; Vieira, L.M.; Sá Filho, M.F.S.; Rodrigues, C.A.; Netto, A.C.; Silveira, C.; Bayeux, B.; Dias, E.; Monteiro, F.; et al. Plasma anti-mullerian hormone: An endocrine marker for in vitro embryo production from Bos taurus and Bos indicus donors. Domest. Anim. Endocrinol. 2014, 49, 96–104. [Google Scholar] [CrossRef]
- Presicce, G.A.; Jiang, S.; Simkin, M.; Zhang, L.; Looney, C.R.; Godke, R.A.; Yang, X. Age and Hormonal Dependence of Acquisition of Oocyte Competence for Embryogenesis in Prepubertal Calves. Biol. Reprod. 1997, 56, 386–392. [Google Scholar] [CrossRef]
- Salamone, D.F.; Damiani, P.; Fissore, R.A.; Robl, J.M.; Duby, R.T. Biochemical and Developmental Evidence That Ooplasmic Maturation of Prepubertal Bovine Oocytes Is Compromised. Biol. Reprod. 2001, 64, 1761–1768. [Google Scholar] [CrossRef]
- Aston, K.I.; Li, G.-P.; Hicks, B.A.; Sessions, B.R.; Pate, B.J.; Hammon, D.S.; Bunch, T.D.; White, K.L. The developmental competence of bovine nuclear transfer embryos derived from cow versus heifer cytoplasts. Anim. Reprod. Sci. 2006, 95, 234–243. [Google Scholar] [CrossRef] [PubMed]
- Ptak, G.; Matsukawa, K.; Palmieri, C.; Della Salda, L.; Scapolo, P.A.; Loi, P. Developmental and functional evidence of nuclear immaturity in prepubertal oocytes. Hum. Reprod. 2006, 21, 2228–2237. [Google Scholar] [CrossRef] [PubMed]
- Dorji; Ohkubo, Y.; Miyoshi, K.; Yoshida, M. Gene Expression Differences in Oocytes Derived From Adult and Prepubertal Japanese Black Cattle during In Vitro Maturation. Reprod. Domest. Anim. 2011, 47, 392–402. [Google Scholar] [CrossRef] [PubMed]
- Duan, J.; Zhu, L.; Dong, H.; Zheng, X.; Jiang, Z.; Chen, J.; Tian, X.C. Analysis of mRNA abundance for histone variants, histone- and DNA-modifiers in bovine in vivo and in vitro oocytes and embryos. Sci. Rep. 2019, 9, 1217. [Google Scholar] [CrossRef] [PubMed]
- Racedo, S.E.; Wrenzycki, C.; Lepikhov, K.; Salamone, D.; Walter, J.; Niemann, H. Epigenetic modifications and related mRNA expression during bovine oocyte in vitro maturation. Reprod. Fertil. Dev. 2009, 21, 738–748. [Google Scholar] [CrossRef]
- Petyim, S.; Bage, R.; Forsberg, M.; Rodriguez-Martinez, H.; Larsson, B. Effects of Repeated Follicular Punctures on Ovarian Morphology and Endocrine Parameters in Dairy Heifers. J. Veter- Med. Ser. A 2001, 48, 449–463. [Google Scholar] [CrossRef]
- Viana, J.H.; Palhao, M.P.; Siqueira, L.G.; Fonseca, J.F.; Camargo, L.S. Ovarian follicular dynamics, follicle deviation, and oocyte yield in Gyr breed (Bos indicus) cows undergoing repeated ovum pick-up. Theriogenology 2010, 73, 966–972. [Google Scholar] [CrossRef]
- Nogueira, G.P. Puberty in South American Bos indicus (Zebu) cattle. Anim. Reprod. Sci. 2004, 82–83, 361–372. [Google Scholar] [CrossRef]
- Bolt, D.J.; Scott, V.; Kiracofe, G.H. Plasma LH and FSH after estradiol, norgestomet and Gn-RH treatment in ovariectomized beef heifers. Anim. Reprod. Sci. 1990, 23, 263–271. [Google Scholar] [CrossRef]
- Seneda, M.M.; Esper, C.R.; Garcia, J.M.; Andrade, E.R.; Binelli, M.; Oliveira, J.A.; Nascimento, A.B. Efficacy of linear and convex transducers for ultrasound-guided transvaginal follicle aspiration. Theriogenology 2002, 59, 1435–1440. [Google Scholar] [CrossRef]
- Stojkovic, M.; Machado, S.A.; Stojkovic, P.; Zakhartchenko, V.; Hutzler, P.; Gonçalves, P.B.; Wolf, E. Mitochondrial Distribution and Adenosine Triphosphate Content of Bovine Oocytes Before and After In Vitro Maturation: Correlation with Morphological Criteria and Developmental Capacity After In Vitro Fertilization and Culture1. Biol. Reprod. 2001, 64, 904–909. [Google Scholar] [CrossRef] [PubMed]
- Zacarias, T.A.; Kawamoto, T.S.; Júnior, J.R.S.; Guimarães, A.L.S.; Franco, M.M.; Figueiredo, R.A. Hormonal stimulation in 4 to 7 months old Nelore (Bos taurus indicus) females improved ovarian follicular responses but not the in vitro embryo production. Theriogenology 2018, 118, 130–136. [Google Scholar] [CrossRef] [PubMed]
- Pfaffl, M.W. A new mathematical model for relative quantification in real-time RT-PCR. Nucleic Acids Res. 2001, 29, e45. [Google Scholar] [CrossRef] [PubMed]
- Wall, E.; White, I.M.S.; Coffey, M.P.; Brotherstone, S. The Relationship Between Fertility, Rump Angle, and Selected Type Information in Holstein-Friesian Cows. J. Dairy Sci. 2005, 88, 1521–1528. [Google Scholar] [CrossRef]
- Holm, D.E.; Webb, E.C.; Thompson, P.N. A new application of pelvis area data as culling tool to aid in the management of dystocia in heifers. J. Anim. Sci. 2014, 92, 2296–2303. [Google Scholar] [CrossRef]
- Holm, D.E.; Nielen, M.; Jorritsma, R.; Irons, P.C.; Thompson, P.N. Ultrasonographic reproductive tract measures and pelvis measures as predictors of pregnancy failure and anestrus in restricted bred beef heifers. Theriogenology 2015, 85, 495–501. [Google Scholar] [CrossRef]
- Viana, J.H.M.; Hinduja, S.; Bártolo, P.J.S. Estimation of biometric parameters from cattle rump using free-hand scanning and a 3D data processing algorithm. Virtual Phys. Prototyp. 2016, 11, 167–172. [Google Scholar] [CrossRef]
- Ireland, J.J.; Smith, G.W.; Scheetz, D.; Jimenez-Krassel, F.; Folger, J.K.; Mossa, F.; Lonergan, P.; Evans, A.C.O. Does size matter in females? An overview of the impact of the high variation in the ovarian reserve on ovarian function and fertility, utility of anti-Müllerian hormone as a diagnostic marker for fertility and causes of variation in the ovarian reserve in cattle. Reprod. Fertil. Dev. 2011, 23, 1–14. [Google Scholar] [CrossRef]
- Morotti, F.; Santos, G.M.G.; Júnior, C.K.; Silva-Santos, K.C.; Roso, V.M.; Seneda, M.M. Correlation between phenotype, genotype and antral follicle population in beef heifers. Theriogenology 2016, 91, 21–26. [Google Scholar] [CrossRef]
- Kinder, J.E.; Bergfeld, E.G.; Wehrman, M.E.; Peters, K.E.; Kojima, F.N. Endocrine basis for puberty in heifers and ewes. Biosci. Proc. 2019, 3, RDRRDR30. [Google Scholar] [CrossRef]
- Mauras, N.; Rogol, A.D.; Haymond, M.W.; Veldhuis, J.D. Sex Steroids, Growth Hormone, Insulin-Like Growth Factor-1: Neuroendocrine and Metabolic Regulation in Puberty. Horm. Res. 1996, 45, 74–80. [Google Scholar] [CrossRef] [PubMed]
- Ginther, O.J.; Bergfelt, D.R.; Kulick, L.J.; Kot, K. Selection of the dominant follicle in cattle: Establishment of follicle deviation in less than 8 hours through depression of fsh concentrations. Theriogenology 1999, 52, 1079–1093. [Google Scholar] [CrossRef]
- Bessa, I.R.; Nishimura, R.C.; Franco, M.M.; Dode, M.A.N. Transcription Profile of Candidate Genes for the Acquisition of Competence During Oocyte Growth in Cattle. Reprod. Domest. Anim. 2013, 48, 781–789. [Google Scholar] [CrossRef]
- Ma, P.; Schultz, R.M. Histone Deacetylase 2 (HDAC2) Regulates Chromosome Segregation and Kinetochore Function via H4K16 Deacetylation during Oocyte Maturation in Mouse. PLoS Genet. 2013, 9, e1003377. [Google Scholar] [CrossRef] [PubMed]
- Zhang, L.; Hou, X.; Ma, R.; Moley, K.; Schedi, T.; Wang, Q. Sirt2 functions in spindle organization and chromosome alignment in mouse oocyte meiosis. FASEB J. 2013, 28, 1435–1445. [Google Scholar] [CrossRef] [PubMed]
- Wang, Z.; Zhao, T.; Zhang, P.; Zhang, S.; Guan, J.; Ma, X.; Yin, Y.; Zhang, J.; Tang, B.; Li, Z. Histone Deacetylase 1 Down-Regulation on Developmental Capability and Histone Acetylation in Bovine Oocytes and Parthenogenetic Embryos. Reprod. Domest. Anim. 2011, 46, 1022–1028. [Google Scholar] [CrossRef]
- Wehrend, A.; Meinecke, B. Kinetics of meiotic progression, M-phase promoting factor (MPF) and mitogen-activated protein kinase (MAP kinase) activities during in vitro maturation of porcine and bovine oocytes: Species specific differences in the length of the meiotic stages. Anim. Reprod. Sci. 2001, 66, 175–184. [Google Scholar] [CrossRef]
- Lodde, V.; Modina, S.; Galbusera, C.; Franciosi, F.; Luciano, A.M. Large-scale chromatin remodeling in germinal vesicle bovine oocytes: Interplay with gap junction functionality and developmental competence. Mol. Reprod. Dev. 2006, 74, 740–749. [Google Scholar] [CrossRef]
- Luciano, A.M.; Lodde, V.; Franciosi, F.; Tessaro, I.; Corbani, D.; Modina, S.C. Large-scale chromatin morpho-functional changes during mammalian oocyte growth and differentiation. Eur. J. Histochem. 2012, 56, 37. [Google Scholar] [CrossRef]
- Hosoe, M.; Kaneyama, K.; Ushizawa, K.; Hayashi, K.-G.; Takahashi, T. Quantitative analysis of bone morphogenetic protein 15 (BMP15) and growth differentiation factor 9 (GDF9) gene expression in calf and adult bovine ovaries. Reprod. Biol. Endocrinol. 2011, 9, 33. [Google Scholar] [CrossRef]
- Romar, R.; De Santis, T.; Papillier, P.; Perreau, C.; Thelie, A.; Dell’Aquila, M.; Mermillod, P.; Dalbiès-Tran, R. Expression of Maternal Transcripts During Bovine Oocyte In Vitro Maturation is Affected by Donor Age. Reprod. Domest. Anim. 2011, 46, e23–e30. [Google Scholar] [CrossRef] [PubMed]
- Armstrong, D.T.; Holm, P.; Irvine, B.; Petersen, B.A.; Stubbings, R.B.; McLean, D.; Stevens, G.; Seamark, R. Pregnancies and live birth from in vitro fertilization of calf oocytes collected by laparoscopic follicular aspiration. Theriogenology 1992, 38, 667–678. [Google Scholar] [CrossRef]
- Khatir, H.; Lonergan, P.; Touzé, J.-L.; Mermillod, P. The characterization of bovine embryos obtained from prepubertal calf oocytes and their viability after non surgical embryo transfer. Theriogenology 1998, 50, 1201–1210. [Google Scholar] [CrossRef]


| Gene | Sequence | Fragment Size (pb) | Annealing Temperature (°C) | GenBank |
|---|---|---|---|---|
| GAPDH | F: GGC GTG AAC CAC GAG AAG TAT AA | 119 | 60 | NM_001034034.2 |
| R: 5′ CCC TCC ACG ATG CCA AAG T 3′ | ||||
| ACTB | F: GGC ACC CAG CAC AAT GAA GAT CAA | 134 | 60 | NM_173979.3 |
| R: 5′ ATC GTA CTC CTG CTT GCT GAT CCA 3 | ||||
| CREBBP | F: GTT CTC CAC TAC GAC ATC ATC | 150 | 60 | NM_001164022.1 |
| R: CTT GTT GAC TCG GTC TTC C | ||||
| NCOA2 | F: CCT GGG ATG GAC ATG ATT AAG | 125 | 60 | XM_027561151.1 |
| R: TGG GTC GAA ACG AAG AGA | ||||
| HAT1 | F: AAT TGA GAG ACT TTG TGC TTG TGA | 392 | 60 | NM_001034347.1 |
| R: TTC AAT GAC ACG TCG ATA ATC TTC | ||||
| HDAC1 | F: ATC GGT TAG GTT GCT TCA ATC TG | 188 | 60 | NM_001037444.2 |
| R: GTT GTA TGG AAG CTC ATT AGG GA | ||||
| HDAC3 | F: GAA GAG GCC ATT AGT GAA GAG | 227 | 60 | NM_001206243.1 |
| R: TCA GTC CTG TCG TAG GTT AG | ||||
| HDAC2 | F: TTC CTG GAA CAG GAG ACT TA | 194 | 60 | NM_001075146.1 |
| R: ATC ACC AGA TAG GGA GTC TG |
| Endpoint | Animal Category | p Value | |
|---|---|---|---|
| 2 to 5 months | Cow | ||
| Ovarian diameter (mm) | 16.5 ± 2.4 | 25.1 ± 2.4 | <0.0001 |
| Antral follicle count (n) | 20.7 ± 6.7 | 28.3 ± 7.4 | <0.0001 |
| Number of follicles > 4 mm | 3.4 ± 1.6 | 6.0 ± 3.8 | <0.0001 |
| Diameter of the largest follicle (mm) | 7.2 ± 1.5 | 10.1 ± 2.6 | <0.0001 |
| Uterine diameter (mm) | 8.4 ± 1.0 | 12.8 ± 1.8 | <0.0001 |
| Mean rump area (cm2) | 514.2 ± 101.4 | 1684.2 ± 185.8 | <0.0001 |
| Endpoint | Animal Category | p Value | |
|---|---|---|---|
| 8 to 11 months | Cow | ||
| Ovarian diameter (mm) | 18.1 ± 2.1 | 24.1 ± 2.6 | <0.0001 |
| Antral follicle count (n) | 22.0 ± 8.9 | 26.4 ± 7.7 | 0.0001 |
| Number of follicles > 4 mm | 4.9 ± 2.2 | 4.8 ± 2.2 | 0.9583 |
| Diameter of the largest follicle (mm) | 7.9 ± 1.3 | 9.6 ± 2.3 | <0.0001 |
| Uterine diameter (mm) | 10.1 ± 1.0 | 12.5 ± 1.3 | <0.0001 |
| Mean rump area (cm2) | 856.72 ± 79.1 | 1684.2 ± 185.8 | <0.0001 |
| Endpoint | Prepubertal Period | p Value | |
|---|---|---|---|
| 2 to 5 months | 8 to 11 months | ||
| Ovarian diameter (mm) | 16.5 ± 2.4 | 18.1 ± 2.1 | <0.0001 |
| Antral follicle count (n) | 20.7 ± 6.7 | 22.0 ± 8.9 | 0.5412 |
| Number of follicles > 4 mm | 3.4 ± 1.6 | 4.9 ± 2.2 | <0.0001 |
| Diameter of the largest follicle (mm) | 7.2 ± 1.5 | 7.9 ± 1.3 | 0.0001 |
| Uterine diameter (mm) | 8.4 ± 1.0 | 10.1 ± 1.0 | <0.0001 |
| Average body weight | 118.8 ± 22.9 | 227.0 ± 18.7 | <0.0001 |
| Mean rump area (cm2) | 619.5 ± 131.5 | 967.0 ± 56.25 | <0.0001 |
| Endpoint | Age Group | |||||
|---|---|---|---|---|---|---|
| 2 to 5 months | 8 to 11 months | |||||
| SQ | F | p-Value | SQ | F | p Value | |
| Ovary diameter (mm) | −238.9 | 74.6 | <0.001 | −4.3 | 0.9 | 0.3 |
| AFC (n) | −244.0 | 5.6 | 0.02 | −16.3 | 0.1 | 0.6 |
| Follicles ≤ 4.0 mm (n) | −61.1 | 1.3 | 0.26 | −19.8 | 0.2 | 0.6 |
| Follicles > 4.0 mm (n) | −60.1 | 28.4 | <0.001 | −0.9 | 0.2 | 0.6 |
| Largest follicle (mm) | −42.3 | 24.5 | <0.001 | −2.4 | 1.5 | 0.2 |
| Uterine diameter (mm) | −15.2 | 17.5 | <0.001 | −2.9 | 2.6 | 0.1 |
| Group | Oocyte Diameter (mean ± SD, n) | Oocyte Quality Grade (n, %) | |||
|---|---|---|---|---|---|
| GI | GII | GIII | GIV | ||
| Calves, 2 to 5 mo | 121.3 ± 7.5 b (85) | 9 (1.7) b | 134 (25.0) a | 262 (49.0) a | 130 (24.3) b |
| Calves, 8 to 11 mo | 124.8 ± 8.5 a (78) | 16 (4.1) b | 49 (12.6) b | 173 (44.5) a | 151 (38.9) a |
| Control cows | 126.0 ± 7.5 a (99) | 115 (12.9) a | 279 (31.2) a | 269 (30.1) b | 230 (25.7) ab |
| Group | N | Cleaved n (%) | Blastocyst D6 n (%) | Blastocyst D7 n (%) |
|---|---|---|---|---|
| Control cows | 247 | 214 (86.6) | 122 (49.4) a | 177 (71.6) a |
| Calves, 2 to 5 mo | 171 | 121 (70.8) | 27 (15.8) b | 53 (31.0) b |
| Group | N | Cleaved n (%) | Blastocyst D6 n (%) | Blastocyst D7 n (%) |
|---|---|---|---|---|
| Control cows | 270 | 193 (71.5) | 90 (33.3) | 130 (48.1) |
| Calves, 8 to 11 mo | 119 | 89 (74.8) | 22 (18.5) | 50 (42.0) |
| Category | D6/Control (%) | D7/Control (%) |
|---|---|---|
| 2 to 5 mo | 31.04 | 43.78 a |
| 8 to 11 mo | 59.63 | 78.77 b |
Publisher’s Note: MDPI stays neutral with regard to jurisdictional claims in published maps and institutional affiliations. |
© 2022 by the authors. Licensee MDPI, Basel, Switzerland. This article is an open access article distributed under the terms and conditions of the Creative Commons Attribution (CC BY) license (https://creativecommons.org/licenses/by/4.0/).
Share and Cite
Kawamoto, T.S.; Viana, J.H.M.; Pontelo, T.P.; Franco, M.M.; de Faria, O.A.C.; Fidelis, A.A.G.; Vargas, L.N.; Figueiredo, R.A. Dynamics of the Reproductive Changes and Acquisition of Oocyte Competence in Nelore (Bos taurus indicus) Calves during the Early and Intermediate Prepubertal Periods. Animals 2022, 12, 2137. https://doi.org/10.3390/ani12162137
Kawamoto TS, Viana JHM, Pontelo TP, Franco MM, de Faria OAC, Fidelis AAG, Vargas LN, Figueiredo RA. Dynamics of the Reproductive Changes and Acquisition of Oocyte Competence in Nelore (Bos taurus indicus) Calves during the Early and Intermediate Prepubertal Periods. Animals. 2022; 12(16):2137. https://doi.org/10.3390/ani12162137
Chicago/Turabian StyleKawamoto, Taynan Stonoga, João Henrique Moreira Viana, Thais Preisser Pontelo, Maurício Machaim Franco, Otávio Augusto Costa de Faria, Andrei Antonioni Guedes Fidelis, Luna Nascimento Vargas, and Ricardo Alamino Figueiredo. 2022. "Dynamics of the Reproductive Changes and Acquisition of Oocyte Competence in Nelore (Bos taurus indicus) Calves during the Early and Intermediate Prepubertal Periods" Animals 12, no. 16: 2137. https://doi.org/10.3390/ani12162137
APA StyleKawamoto, T. S., Viana, J. H. M., Pontelo, T. P., Franco, M. M., de Faria, O. A. C., Fidelis, A. A. G., Vargas, L. N., & Figueiredo, R. A. (2022). Dynamics of the Reproductive Changes and Acquisition of Oocyte Competence in Nelore (Bos taurus indicus) Calves during the Early and Intermediate Prepubertal Periods. Animals, 12(16), 2137. https://doi.org/10.3390/ani12162137