
Sound Visualization Demonstrates Velopharyngeal Coupling and Complex Spectral Variability in Asian Elephants


Abstract
:Simple Summary
Abstract

1. Introduction
1.1. The Function of the Vocal Tract in Mammals
1.2. Call Emission and Information Coding in Elephant Laryngeal Calls
2. Materials and Methods
2.1. Study Subjects and Housing
2.2. Acoustic Camera and Audio and Video Recordings
2.3. Recording Context
2.4. Acoustic Camera Analysis
2.5. Acoustic Data Analysis

| Acoustic Parameter | Description |
|---|---|
| Duration in s | Time from the onset until the end of the vocalization measured from the spectrogram. |
| Mean Fundamental Frequency (F0) | Mean of fundamental frequency values of 60 points spaced evenly across the tracked contour. |
| Frequency Variability Index (FVI) [75] | Calculated variable that represents the magnitude of frequency modulation across a call computed by dividing the variance in frequency by the square of the average frequency of a call and then multiplying the value by 10. |
| Inflection Factor (IF) | Percentage of points along the fundamental frequency’s contour showing a reversal in slope. |
| Jitter Factor (JF) [75] | Calculated variable that represents a weighted measure of the amount of frequency modulation by calculating the sum of the absolute value of the difference between two sequential frequencies divided by the mean frequency. The sum result is then divided by the total number of points measured minus 1 and the final value is obtained by multiplying it by 100. |
| Dominant Frequency (DF) in Hz | Frequency with the highest amplitude peak in the power spectrum. |
| Wiener Entropy | Measurement of tonality defined as the ratio of a power spectrum’s geometric mean to its arithmetic mean, expressed on a log scale. Lower values relate to higher tonality. |
| Quartile 25 (Q25) | Parameter characterizing the spectral energy distribution, i.e., the frequency value where 25% of the total energy is located below this value. |
| Quartile 50 (Q50) | Parameter characterizing the spectral energy distribution, i.e., the frequency value where 50% of the total energy is located below this value. |
| Quartile 75 (Q70) | Parameter characterizing the spectral energy distribution, i.e., the frequency value where 75% of the total energy is located below this value. |
| Spectral Centroid Frequency (SCF) | Weighted average frequency where the weights are the normalized energy of each frequency component. |
2.6. Statistical Analysis
3. Results
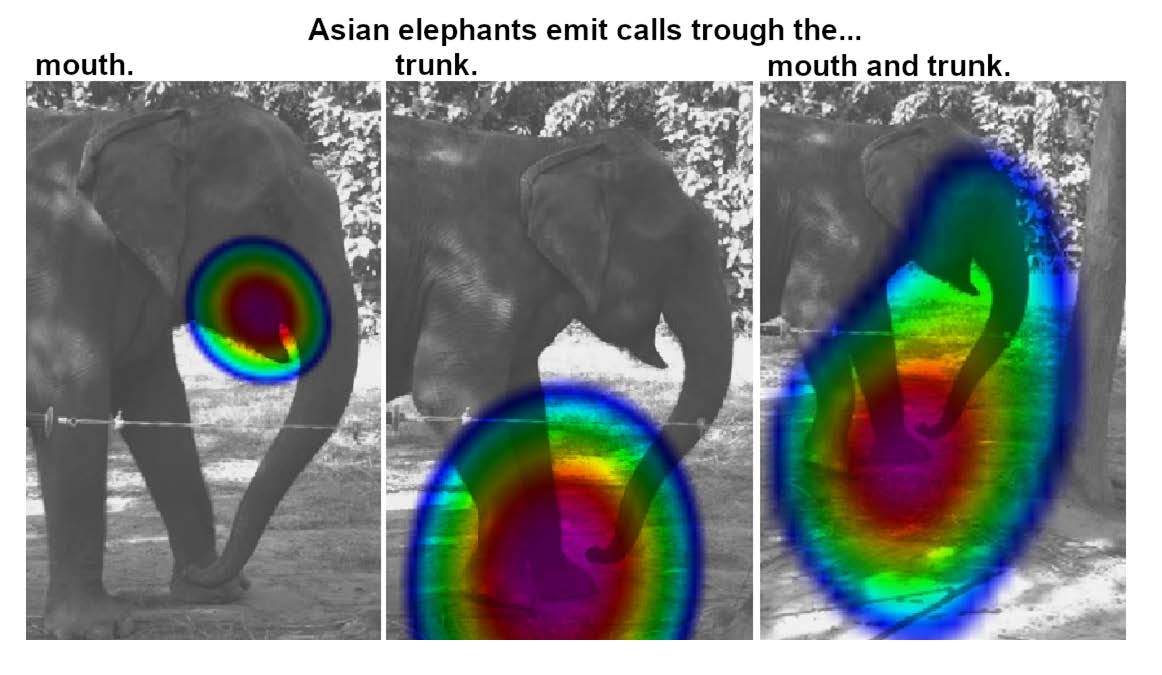
3.1. Sound Emission
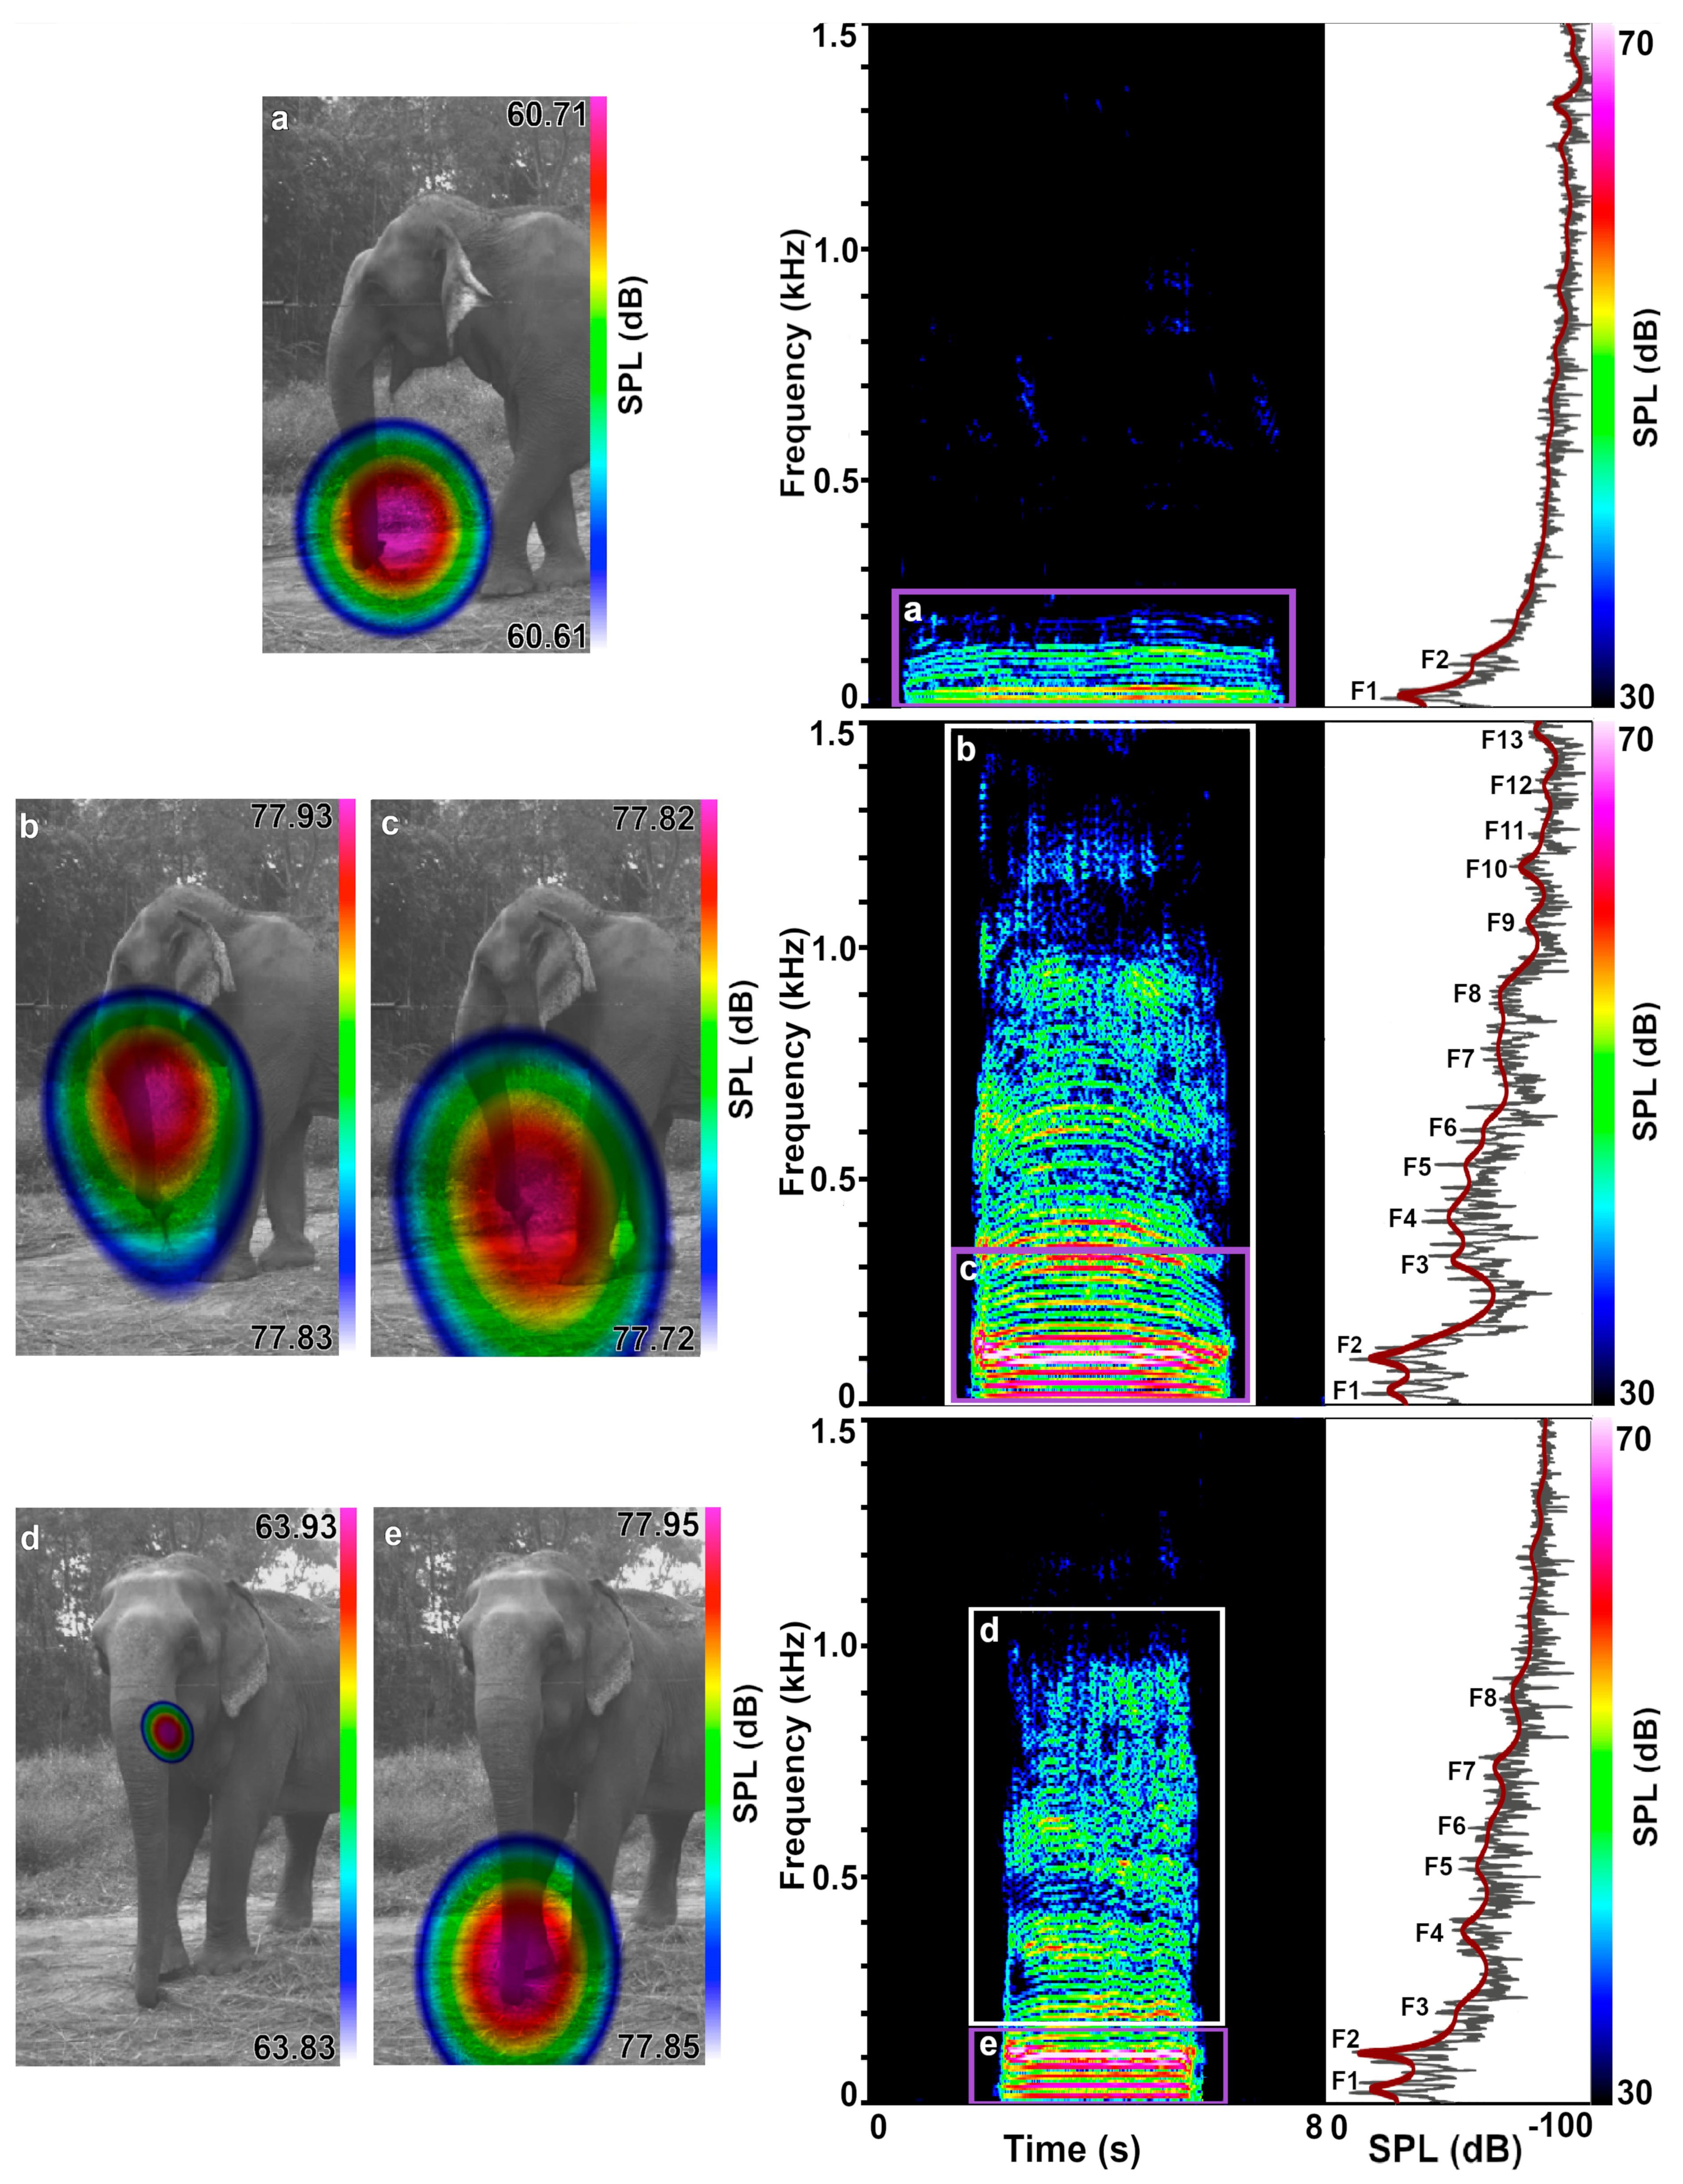
3.2. Acoustic Data Analysis
4. Discussion
4.1. Velopharyngeal Coupling and Complex Formant Patterns
4.2. Rumble Sound Production Mechanisms in African and Asian Elephants
4.3. Potential Functions of the Various Rumble-Production Types
5. Conclusions
Supplementary Materials
Author Contributions
Funding
Institutional Review Board Statement
Informed Consent Statement
Data Availability Statement
Acknowledgments
Conflicts of Interest
References
- Titze, I.R. Principles of Voice Production (Second Printing); National Center for Voice and Speech: Iowa City, IA, USA, 2000. [Google Scholar]
- Fitch, W. Production of vocalizations in mammals. Vis. Commun. 2006, 3, 145. [Google Scholar]
- Pretorius, Y.; de Boer, W.F.; Kortekaas, K.; van Wijngaarden, M.; Grant, R.C.; Kohi, E.M.; Mwakiwa, E.; Slotow, R.; Prins, H.H.T. Why elephant have trunks and giraffe long tongues: How plants shape large herbivore mouth morphology. Acta Zool. 2016, 97, 246–254. [Google Scholar] [CrossRef]
- Schulz, A.K.; Ning Wu, J.; Ha, S.Y.S.; Kim, G.; Braccini Slade, S.; Rivera, S.; Reidenberg, J.S.; Hu, D.L. Suction feeding by elephants. J. R. Soc. Interface 2021, 18, 20210215. [Google Scholar] [CrossRef] [PubMed]
- Dagenais, P.; Hensman, S.; Haechler, V.; Milinkovitch, M.C. Elephants evolved strategies reducing the biomechanical complexity of their trunk. Curr. Biol. 2021, 31, 4727–4737. [Google Scholar] [CrossRef] [PubMed]
- Poole, J.H. Behavioral contexts of elephant acoustic communication. In The Amboseli Elephants: A Long-Term Perspective on a Long-Lived Mammal; The University of Chicago: Chicago, IL, USA, 2011; pp. 125–161. [Google Scholar]
- Bates, L.A.; Sayialel, K.N.; Njiraini, N.W.; Poole, J.H.; Moss, C.J.; Byrne, R.W. African elephants have expectations about the locations of out-of-sight family members. Biol. Lett. 2008, 4, 34–36. [Google Scholar] [CrossRef]
- Purkart, L.; Tuff, J.M.; Shah, M.; Kaufmann, L.V.; Altringer, C.; Maier, E.; Schneeweiß, U.; Tunckol, E.; Eigen, L.; Holtze, S.; et al. Trigeminal ganglion and sensory nerves suggest tactile specialization of elephants. Curr. Biol. 2022, 32, 904–910.e903. [Google Scholar] [CrossRef]
- Schulte, B.A.; LaDue, C.A. The Chemical Ecology of Elephants: 21st Century Additions to Our Understanding and Future Outlooks. Animals 2021, 11, 2860. [Google Scholar] [CrossRef]
- Stoeger, A.S.; de Silva, S. African and Asian Elephant Vocal Communication: A Cross-Species Comparison. In Biocommunication of Animals; Witzany, G., Ed.; Springer: Dordrecht, The Netherlands, 2014; pp. 21–39. [Google Scholar]
- Pardo, M.A.; Poole, J.H.; Stoeger, A.S.; Wrege, P.H.; O’Connell-Rodwell, C.E.; Padmalal, U.K.; de Silva, S. Differences in combinatorial calls among the 3 elephant species cannot be explained by phylogeny. Behav. Ecol. 2019, 30, 809–820. [Google Scholar] [CrossRef]
- Poole, J.H.; Tyack, P.L.; Stoeger-Horwath, A.S.; Watwood, S. Elephants are capable of vocal learning. Nature 2005, 434, 455–456. [Google Scholar] [CrossRef]
- Stoeger, A.S.; Mietchen, D.; Oh, S.; de Silva, S.; Herbst, C.T.; Kwon, S.; Fitch, W.T. An Asian elephant imitates human speech. Curr. Biol. 2012, 22, 2144–2148. [Google Scholar] [CrossRef]
- Poole, J.; Granli, P. The Elephant Ethogram: A library of African elephant behaviour. Pachyderm 2021, 62, 105–111. [Google Scholar]
- Fuchs, E.; Beeck, V.C.; Baotic, A.; Stoeger, A.S. Acoustic structure and information content of trumpets in female Asian elephants (Elephas maximus). PLoS ONE 2021, 16, e0260284. [Google Scholar] [CrossRef] [PubMed]
- Stoeger, A.S.; Baotic, A.; Heilmann, G. Vocal Creativity in Elephant Sound Production. Biology 2021, 10, 750. [Google Scholar] [CrossRef]
- Herbst, C.T.; Stoeger, A.S.; Frey, R.; Lohscheller, J.; Titze, I.R.; Gumpenberger, M.; Fitch, W.T. How low can you go? Physical production mechanism of elephant infrasonic vocalizations. Science 2012, 337, 595–599. [Google Scholar] [CrossRef] [PubMed]
- Poole, J.H.; Payne, K.; Langbauer, W.R.; Moss, C.J. The social contexts of some very low frequency calls of African elephants. Behav. Ecol. Sociobiol. 1988, 22, 385–392. [Google Scholar] [CrossRef]
- Soltis, J. Vocal communication in African elephants (Loxodonta africana). Zoo Biol. 2010, 29, 192–209. [Google Scholar] [CrossRef]
- Archie, E.A.; Moss, C.J.; Alberts, S.C. The ties that bind: Genetic relatedness predicts the fission and fusion of social groups in wild African elephants. Proc. Biol. Sci. 2006, 273, 513–522. [Google Scholar] [CrossRef] [PubMed]
- Nandini, S.; Keerthipriya, P.; Vidya, T.N.C. Group size differences may mask underlying similarities in social structure: A comparison of female elephant societies. Behav. Ecol. 2017, 29, 145–159. [Google Scholar] [CrossRef]
- Turkalo, A.K.; Wrege, P.H.; Wittemyer, G. Long-Term Monitoring of Dzanga Bai Forest Elephants: Forest Clearing Use Patterns. PLoS ONE 2013, 8, e85154. [Google Scholar] [CrossRef]
- Stoeger, A.S.; Heilmann, G.; Zeppelzauer, M.; Ganswindt, A.; Hensman, S.; Charlton, B.D. Visualizing sound emission of elephant vocalizations: Evidence for two rumble production types. PLoS ONE 2012, 7, e48907. [Google Scholar] [CrossRef]
- Fant, G. Acoustic Theory of Speech Production; Mouton & Co.: The Hague, The Netherlands, 1960. [Google Scholar]
- Fitch, W.T. The evolution of speech: A comparative review. Trends Cogn. Sci. 2000, 4, 258–267. [Google Scholar] [CrossRef]
- Taylor, A.M.; Charlton, B.D.; Reby, D. Vocal production by terrestrial mammals: Source, filter, and function. In Vertebrate Sound Production and Acoustic Communication; Suthers, R.A., Fitch, W.T., Fay, R.R., Popper, A.N., Eds.; Springer: Berlin/Heidelberg, Germany, 2016; pp. 229–259. [Google Scholar]
- Tecumseh Fitch, W. The Phonetic Potential of Nonhuman Vocal Tracts: Comparative Cineradiographic Observations of Vocalizing Animals. Phonetica 2000, 57, 205–218. [Google Scholar] [CrossRef] [PubMed]
- Styler, W. On the acoustical features of vowel nasality in English and French. J. Acoust. Soc. Am. 2017, 142, 2469–2482. [Google Scholar] [CrossRef] [PubMed]
- Carignan, C. Using ultrasound and nasalance to separate oral and nasal contributions to formant frequencies of nasalized vowels. J. Acoust. Soc. Am. 2018, 143, 2588–2601. [Google Scholar] [CrossRef] [PubMed]
- Fitch, W.T. Comparative vocal production and the evolution of speech: Reinterpreting the descent of the larynx. In The Transition to Language; Wray, A., Ed.; Oxford University Press: Oxford, UK, 2002; pp. 21–45. [Google Scholar]
- Boë, L.-J.; Sawallis, T.R.; Fagot, J.; Badin, P.; Barbier, G.; Captier, G.; Ménard, L.; Heim, J.-L.; Schwartz, J.-L. Which way to the dawn of speech?: Reanalyzing half a century of debates and data in light of speech science. Sci. Adv. 2019, 5, eaaw3916. [Google Scholar] [CrossRef] [PubMed]
- Hauser, M.D. Articulatory and social factors influence the acoustic structure of rhesus monkey vocalizations: A learned mode of production? J. Acoust. Soc. Am. 1992, 91, 2175–2179. [Google Scholar] [CrossRef]
- Riede, T.; Zuberbuhler, K. The relationship between acoustic structure and semantic information in Diana monkey alarm vocalization. J. Acoust. Soc. Am. 2003, 114, 1132–1142. [Google Scholar] [CrossRef]
- Sanvito, S.; Galimberti, F.; Miller, E.H. Vocal signalling of male southern elephant seals is honest but imprecise. Anim. Behav. 2007, 73, 287–299. [Google Scholar] [CrossRef]
- Charlton, B.D.; Reby, D.; McComb, K. Female perception of size-related formant shifts in red deer, Cervus elaphus. Anim. Behav. 2007, 74, 707–714. [Google Scholar] [CrossRef]
- Carignan, C. An acoustic and articulatory examination of the “oral” in “nasal”: The oral articulations of French nasal vowels are not arbitrary. J. Phon. 2014, 46, 23–33. [Google Scholar] [CrossRef]
- Fitch, W.T. Vocal tract length and formant frequency dispersion correlate with body size in rhesus macaques. J. Acoust. Soc. Am. 1997, 102, 1213–1222. [Google Scholar] [CrossRef] [PubMed]
- Reby, D.; McComb, K. Anatomical constraints generate honesty: Acoustic cues to age and weight in the roars of red deer stags. Anim. Behav. 2003, 65, 519–530. [Google Scholar] [CrossRef]
- Volodin, I.A.; Lapshina, E.N.; Volodina, E.V.; Frey, R.; Soldatova, N.V. Nasal and Oral Calls in Juvenile Goitred Gazelles (Gazella subgutturosa) and their Potential to Encode Sex and Identity. Ethology 2011, 117, 294–308. [Google Scholar] [CrossRef]
- Volodin, I.A.; Sibiryakova, O.V.; Kokshunova, L.E.; Frey, R.; Volodina, E.V. Nasal and oral calls in mother and young trunk-nosed saiga antelopes, Saiga tatarica. Bioacoustics 2014, 23, 79–98. [Google Scholar] [CrossRef]
- Sibiryakova, O.V.; Volodin, I.A.; Matrosova, V.A.; Volodina, E.V.; Garcia, A.J.; Gallego, L.; Landete-Castillejos, T. The power of oral and nasal calls to discriminate individual mothers and offspring in red deer, Cervus elaphus. Front. Zool. 2015, 12, 2. [Google Scholar] [CrossRef] [PubMed]
- Sèbe, F.; Duboscq, J.; Aubin, T.; Ligout, S.; Poindron, P. Early vocal recognition of mother by lambs: Contribution of low- and high-frequency vocalizations. Anim. Behav. 2010, 79, 1055–1066. [Google Scholar] [CrossRef]
- Gamba, M.; Friard, O.; Giacoma, C. Vocal Tract Morphology Determines Species-Specific Features in Vocal Signals of Lemurs (Eulemur). Int. J. Primatol. 2012, 33, 1453–1466. [Google Scholar] [CrossRef]
- Charlton, B.D.; Pisanski, K.; Raine, J.; Reby, D. Coding of Static Information in Terrestrial Mammal Vocal Signals. In Coding Strategies in Vertebrate Acoustic Communication; Aubin, T., Mathevon, N., Eds.; Springer International Publishing: Cham, Switzerland, 2020; pp. 115–136. [Google Scholar]
- Charlton, B.D.; Reby, D. The evolution of acoustic size exaggeration in terrestrial mammals. Nat. Commun. 2016, 7, 12739. [Google Scholar] [CrossRef]
- Hauser, M.; Ybarra, M.S. The role of lip configuration in monkey vocalizations: Experiments using xylocaine as a nerve block. Brain Lang. 1994, 46, 232–244. [Google Scholar] [CrossRef]
- Fitch, W.T.; Reby, D. The descended larynx is not uniquely human. Proc. Biol. Sci. 2001, 268, 1669–1675. [Google Scholar] [CrossRef]
- Koda, H.; Murai, T.; Tuuga, A.; Goossens, B.; Nathan, S.K.S.S.; Stark, D.J.; Ramirez, D.A.R.; Sha, J.C.M.; Osman, I.; Sipangkui, R.; et al. Nasalization by Nasalis larvatus: Larger noses audiovisually advertise conspecifics in proboscis monkeys. Sci. Adv. 2018, 4, eaaq0250. [Google Scholar] [CrossRef] [PubMed]
- Frey, R.; Volodin, I.; Volodina, E. A nose that roars: Anatomical specializations and behavioural features of rutting male saiga. J. Anat. 2007, 211, 717–736. [Google Scholar] [CrossRef] [PubMed]
- Briefer, E.F. Coding for ‘Dynamic’information: Vocal expression of emotional arousal and valence in non-human animals. In Coding Strategies in Vertebrate Acoustic Communication; Aubin, T., Mathevon, N., Eds.; Springer International Publishing: Cham, Switzerland, 2020; pp. 137–162. [Google Scholar]
- Townsend, S.W.; Charlton, B.D.; Manser, M.B. Acoustic cues to identity and predator context in meerkat barks. Anim. Behav. 2014, 94, 143–149. [Google Scholar] [CrossRef]
- Soltis, J.; King, L.E.; Douglas-Hamilton, I.; Vollrath, F.; Savage, A. African elephant alarm calls distinguish between threats from humans and bees. PLoS ONE 2014, 9, e89403. [Google Scholar] [CrossRef]
- Langbauer, W., Jr. Elephant communication. Zoo Biol. 2000, 19, 425–445. [Google Scholar] [CrossRef]
- Leong, K.M.; Ortolani, A.; Burks, K.D.; Mellen, J.D.; Savage, A. Quantifying Acoustic and Temporal Characteristics of Vocalizations for a Group of Captive African Elephantsloxodonta Africana. Bioacoustics 2003, 13, 213–231. [Google Scholar] [CrossRef]
- Wood, J.D.; McCowan, B.; Langbauer, W.R.; Viljoen, J.J.; Hart, L.A. Classification of African Elephantloxodonta Africanarumbles Using Acoustic Parameters and Cluster Analysis. Bioacoustics 2005, 15, 143–161. [Google Scholar] [CrossRef]
- McComb, K.; Reby, D.; Baker, L.; Moss, C.; Sayialel, S. Long-distance communication of acoustic cues to social identity in African elephants. Anim. Behav. 2003, 65, 317–329. [Google Scholar] [CrossRef]
- Stoeger, A.S.; Baotic, A. Male African elephants discriminate and prefer vocalizations of unfamiliar females. Sci. Rep. 2017, 7, 46414. [Google Scholar] [CrossRef]
- Baotic, A.; Stoeger, A.S. Sexual dimorphism in African elephant social rumbles. PLoS ONE 2017, 12, e0177411. [Google Scholar] [CrossRef]
- Stoeger, A.S.; Baotic, A. Information content and acoustic structure of male African elephant social rumbles. Sci. Rep. 2016, 6, 27585. [Google Scholar] [CrossRef] [PubMed]
- Soltis, J.; Leong, K.; Savage, A. African elephant vocal communication II: Rumble variation reflects the individual identity and emotional state of callers. Anim. Behav. 2005, 70, 589–599. [Google Scholar] [CrossRef]
- Soltis, J.; Blowers, T.E.; Savage, A. Measuring positive and negative affect in the voiced sounds of African elephants (Loxodonta africana). J. Acoust. Soc. Am. 2011, 129, 1059–1066. [Google Scholar] [CrossRef]
- Wesolek, C.M.; Soltis, J.; Leighty, K.A.; Savage, A. Infant African Elephant Rumble Vocalizations Vary According to Social Interactions with Adult Females. Bioacoustics 2009, 18, 227–239. [Google Scholar] [CrossRef]
- Payne, K.B.; Langbauer, W.R.; Thomas, E.M. Infrasonic calls of the Asian elephant (Elephas maximus). Behav. Ecol. Sociobiol. 1986, 18, 297–301. [Google Scholar] [CrossRef]
- Nair, S.; Balakrishnan, R.; Seelamantula, C.S.; Sukumar, R. Vocalizations of wild Asian elephants (Elephas maximus): Structural classification and social context. J. Acoust. Soc. Am. 2009, 126, 2768–2778. [Google Scholar] [CrossRef]
- de Silva, S. Acoustic communication in the Asian elephant, Elephas maximus maximus. Behaviour 2010, 147, 825–852. [Google Scholar] [CrossRef]
- Sharma, N.; Prakash, S.V.; Kohshima, S.; Sukumar, R. Asian elephants modulate their vocalizations when disturbed. Anim. Behav. 2020, 160, 99–111. [Google Scholar] [CrossRef]
- Beeck, V.C.; Heilmann, G.; Kerscher, M.; Stoeger, A.S. A novel theory of Asian elephant high-frequency squeak production. BMC Biol. 2021, 19, 121. [Google Scholar] [CrossRef] [PubMed]
- Olson, D.E.A. Ethogram of elephant behaviors. In Elephant Husbandry Resource Guide; Olson, D., Ed.; Allen Press: Lawrence, KS, USA, 2004. [Google Scholar]
- Plotnik, J.M.; de Waal, F.B. Asian elephants (Elephas maximus) reassure others in distress. PeerJ 2014, 2, e278. [Google Scholar] [CrossRef] [PubMed]
- Zala, S.M.; Reitschmidt, D.; Noll, A.; Balazs, P.; Penn, D.J. Automatic mouse ultrasound detector (A-MUD): A new tool for processing rodent vocalizations. PLoS ONE 2017, 12, e0181200. [Google Scholar] [CrossRef] [PubMed]
- Stoeger, A.S.; Zeppelzauer, M.; Baotic, A. Age-group estimation in free-ranging African elephants based on acoustic cues of low-frequency rumbles. Bioacoustics 2014, 23, 231–246. [Google Scholar] [CrossRef] [PubMed]
- Team, R.C. R: A language and environment for statistical computing. In R Foundation for Statistics; The R Project for Statistical Computing: Vienna, Austria, 2020. [Google Scholar]
- Anikin, A. Soundgen: An open-source tool for synthesizing nonverbal vocalizations. Behav. Res. Methods 2019, 51, 778–792. [Google Scholar] [CrossRef] [PubMed]
- Sikes, S.K. Natural History of the African Elephant; Weidenfield & Nicolson: London, UK, 1971. [Google Scholar]
- Mitani, J.C.; Brandt, K.L. Social factors influence the acoustic variability in the long-distance calls of male chimpanzees. Ethology 1994, 96, 233–252. [Google Scholar] [CrossRef]
- Tabachnick, B.; Fidell, L. Using Multivariate Statistics, 6th ed.; Pearson: Boston, MA, USA, 2013. [Google Scholar]
- Jackson, M.T.-T.; Espy-Wilson, C.; Boyce, S.E. Verifying a vocal tract model with a closed side-branch. J. Acoust. Soc. Am. 2001, 109, 2983–2987. [Google Scholar] [CrossRef]
- Reby, D.; Wyman, M.T.; Frey, R.; Charlton, B.D.; Dalmont, J.P.; Gilbert, J. Vocal tract modelling in fallow deer: Are male groans nasalized? J. Exp. Biol. 2018, 221, 179416. [Google Scholar] [CrossRef]
- Stevens, K.N. Acoustic Phonetics; MIT Press: Cambridge, MA, USA, 2000; Volume 30. [Google Scholar]
- Gilbert, J.; Dalmont, J.-P.; Potier, R.; Reby, D. Is Nonlinear Propagation Responsible for the Brassiness of Elephant Trumpet Calls? Acta Acust. united Acust. 2014, 100, 734–738. [Google Scholar] [CrossRef]
- Shoshani, J.; Tassy, P. Advances in proboscidean taxonomy & classification, anatomy & physiology, and ecology & behavior. Quat. Int. 2005, 126–128, 5–20. [Google Scholar] [CrossRef]
- Fabre, B.; Gilbert, J.; Hirschberg, A.; Pelorson, X. Aeroacoustics of Musical Instruments. Annu. Rev. Fluid Mech. 2012, 44, 1–25. [Google Scholar] [CrossRef]
- Titze, I.R.; Palaparthi, A.; Cox, K.; Stark, A.; Maxfield, L.; Manternach, B. Vocalization with semi-occluded airways is favorable for optimizing sound production. PLoS Comput. Biol. 2021, 17, e1008744. [Google Scholar] [CrossRef]
- Soltis, J.; Leighty, K.A.; Wesolek, C.M.; Savage, A. The expression of affect in African elephant (Loxodonta africana) rumble vocalizations. J. Comp. Psychol. 2009, 123, 222–225. [Google Scholar] [CrossRef]
- King, L.E.; Soltis, J.; Douglas-Hamilton, I.; Savage, A.; Vollrath, F. Bee threat elicits alarm call in African elephants. PLoS ONE 2010, 5, e10346. [Google Scholar] [CrossRef] [PubMed]
- Heffner, R.S.; Heffner, H.E. Hearing in the elephant (Elephas maximus): Absolute sensitivity, frequency discrimination, and sound localization. J. Comp. Physiol. Psychol. 1982, 96, 926. [Google Scholar] [CrossRef] [PubMed]
- Monson, B.B.; Rock, J.; Schulz, A.; Hoffman, E.; Buss, E. Ecological cocktail party listening reveals the utility of extended high-frequency hearing. Hear. Res. 2019, 381, 107773. [Google Scholar] [CrossRef] [PubMed]
- Cherry, E.C. Some Experiments on the Recognition of Speech, with One and with Two Ears. J. Acoust. Soc. Am. 1953, 25, 975–979. [Google Scholar] [CrossRef]
- Ey, E.; Fischer, J. The “Acoustic Adaptation Hypothesis”—A Review of the Evidence from Birds, Anurans and Mammals. Bioacoustics 2009, 19, 21–48. [Google Scholar] [CrossRef]
- Morton, E.S. Ecological Sources of Selection on Avian Sounds. Am. Nat. 1975, 109, 17–34. [Google Scholar] [CrossRef]
- Baotic, A.; Garcia, M.; Boeckle, M.; Stoeger, A. Field Propagation Experiments of Male African Savanna Elephant Rumbles: A Focus on the Transmission of Formant Frequencies. Animals 2018, 8, 167. [Google Scholar] [CrossRef]
- O’Connell-Rodwell, C.E.; Wood, J.D.; Kinzley, C.; Rodwell, T.C.; Poole, J.H.; Puria, S. Wild African elephants (Loxodonta africana) discriminate between familiar and unfamiliar conspecific seismic alarm calls. J. Acoust. Soc. Am. 2007, 122, 823–830. [Google Scholar] [CrossRef] [PubMed]


| Call Types and Emission | |||||||
|---|---|---|---|---|---|---|---|
| Subject Names | Age (Years) | Shoulder Height (m) | Rumble Nasal | Rumble Oral and Nasal | Rumble Oral | Roar Oral | Sum |
| Champa | 41 | 2.40 | 24 | 9 | 10 | 10 | 53 |
| Chan Chun | 45 | 2.47 | 5 | 0 | 0 | 0 | 5 |
| Dhibya | 48 | 2.50 | 11 | 0 | 16 | 0 | 27 |
| Dipendra | 60 | 2.43 | 28 | 2 | 2 | 0 | 32 |
| Hira | 45 | 2.55 | 6 | 9 | 0 | 4 | 19 |
| Pawan | 55 | 2.41 | 36 | 4 | 0 | 0 | 40 |
| Raj | 42 | 2.49 | 2 | 1 | 14 | 0 | 17 |
| Saraswati | 27 | 2.40 | 1 | 0 | 0 | 0 | 1 |
| Sunder | 46 | 2.41 | 7 | 2 | 0 | 0 | 9 |
| Sum | 120 | 27 | 42 | 14 | 203 | ||
| Rumble Nasal | Rumble Oral and Nasal | Rumble Oral | Roar Oral | Sum | |
|---|---|---|---|---|---|
| Arousal | 18 | 0 | 0 | 0 | 18 |
| Command | 17 | 2 | 5 | 0 | 24 |
| Contact | 26 | 15 | 6 | 5 | 52 |
| Greeting | 59 | 10 | 31 | 9 | 109 |
| Sum | 120 | 27 | 42 | 14 | 203 |
| Rumble Nasal | Rumble Oral and Nasal | Rumble Oral | Roar Oral | |
|---|---|---|---|---|
| Closed | 65 | 3 | 8 | 0 |
| Slightly open | 19 | 13 | 8 | 3 |
| Wide open | 6 | 9 | 12 | 9 |
| Chewing | 14 | 0 | 5 | 0 |
| Unknown | 16 | 2 | 9 | 2 |
| Rumble Nasal | Rumble Oral and Nasal | Rumble Oral | Roar Oral | |||||||||
|---|---|---|---|---|---|---|---|---|---|---|---|---|
| Parameters | N | Median | Mean ± SD | N | Median | Mean ± SD | N | Median | Mean ± SD | N | Median | Mean ± SD |
| Duration in s | 120 | 5.25 | 5.93 ± 3.42 | 27 | 3.94 | 4.12 ± 1.74 | 42 | 7.36 | 7.753 ± 3.86 | 14 | 1.28 | 1.42 ± 0.79 |
| SPL in dB | 72 | 51.7 | 51.57 ± 5.05 | 24 | 74 | 73.5 ± 11.28 | 27 | 65.2 | 62.159 ± 11.524 | 12 | 88.7 | 88.7 ± 5.87 |
| Mean F0 | 75 | 14.96 | 14.98 ± 3.87 | 21 | 21.78 | 22.39 ± 3.37 | 37 | 15.78 | 15.594 ± 3.634 | 11 | 172.4 | 170.93 ± 45.41 |
| FVI | 75 | 0.06 | 0.074 ± 0.05 | 21 | 0.12 | 0.12 ± 0.07 | 37 | 0.06 | 0.074 ± 0.068 | 11 | 0.04 | - |
| IF | 75 | 0.39 | 0.39 ± 0.11 | 21 | 0.27 | 0.28 ± 0.12 | 37 | 0.35 | 0.33 ± 0.11 | 11 | 0.17 | - |
| JF | 75 | 3.05 | 3.28 ± 1.08 | 21 | 3.16 | 3.27 ± 0.92 | 37 | 2.7 | 2.74 ± 1.09 | 11 | 2.07 | - |
| DF in Hz | 64 | 16.6 | 16.22 ± 3.55 | 20 | 97.81 | 69.99 ± 43.61 | 27 | 18.55 | 25.643 ± 23.51 | 14 | 378.29 | 505.52 ± 392.27 |
| Spectral | ||||||||||||
| Wiener Entropy | 66 | 0.17 | 0.23 ±0.13 | 21 | 0.21 | 0.25± 0.11 | 29 | 0.20 | 0.23± 0.09 | 15 | 0.47 | 0.45 ± 0.13 |
| Q25 in Hz | 66 | 13.68 | 20.80± 53.34 | 21 | 42.10 | 53.93± 28.46 | 29 | 27.36 | 30.93± 12.21 | 15 | 300.00 | 278.36± 111.92 |
| Q50 in Hz | 66 | 34.73 | 53.52± 82.40 | 21 | 92.63 | 102.46± 48.84 | 29 | 63.15 | 70.54± 27.87 | 15 | 408.42 | 388.93± 138.15 |
| Q 75 in Hz | 66 | 84.73 | 142.68± 129.58 | 21 | 134.73 | 185.67± 105.94 | 29 | 140.00 | 173.92± 99.84 | 15 | 510.52 | 529.67± 112.71 |
| SPF in Hz | 66 | 93.74 | 121.29± 79.97 | 21 | 133.44 | 157.93±58.24 | 29 | 148.06 | 149.83± 44.92 | 15 | 421.55 | 417.90± 95.06 |
| Formant | ||||||||||||
| F1 in Hz | 61 | 21.48 | 21.12 ± 2.71 | 19 | 33.2 | 33.51 ± 4.48 | 28 | 26.86 | 28.39 ± 6.58 | 13 | 157.47 | 188.38 ± 89.26 |
| F2 in Hz | 34 | 103.25 | 103.34 ± 8.96 | 18 | 110.84 | 110.03 ± 6.82 | 19 | 105.47 | 101.26 ± 14.12 | 13 | 405.03 | 438.91 ± 99.84 |
| F3 in Hz | 0 | 0 | 0 | 17 | 242.19 | 260.28 ± 56.47 | 16 | 240.23 | 259.32 ± 83.66 | 13 | 631.71 | 692.63 ± 161.82 |
| F4 in Hz | 0 | 0 | 0 | 17 | 437.5 | 408.72 ± 75.59 | 14 | 464.36 | 440.64 ± 79.13 | 13 | 869.04 | 936.07 ± 200.37 |
| F5 in Hz | 0 | 0 | 0 | 16 | 598.14 | 583.26 ± 125.44 | 13 | 545.9 | 577.96 ± 117.67 | 13 | 1097.53 | 1244.10 ± 335.26 |
| F6 in Hz | 0 | 0 | 0 | 16 | 750.49 | 755.17 ± 187.56 | 12 | 704.59 | 694.59 ± 144.73 | 13 | 1314.15 | 1467.41 ± 389.24 |
| F7 in Hz | 0 | 0 | 0 | 15 | 889.65 | 908.2 ± 196.67 | 12 | 814.45 | 823.24 ± 176.55 | 13 | 1644.11 | 1719.8 ± 410.19 |
| F8 in Hz | 0 | 0 | 0 | 14 | 960.94 | 1030.41 ± 229.54 | 9 | 878.91 | 899.31 ± 160.21 | 13 | 1881.59 | 1949.07 ± 439.4 |
| F9 in Hz | 0 | 0 | 0 | 14 | 1145.51 | 1162.25 ± 243.24 | 6 | 1021.6 | 1033.32 ± 155.65 | 13 | 2139.03 | 2270.22 ± 540.77 |
| F10 in Hz | 0 | 0 | 0 | 13 | 1244.14 | 1293.17 ± 289.66 | 6 | 1127.93 | 1167.91 ± 199.95 | 13 | 2315.92 | 2533.59 ± 555.53 |
| ΔF1–F10 in Hz | 34 | - | 81.11 ± 9.42 | 18 | - | 148.99 ± 40.02 | 19 | - | 127.61 ± 36.38 | 14 | - | 258.95 ± 66.65 |
| ΔF1–F2 in Hz | 34 | - | 81.11 ± 9.42 | 18 | - | 76.66 ± 4.56 | 19 | - | 70.73 ± 12.91 | 14 | - | 249.73 ± 56.82 |
| ΔF–F10 in Hz | 0 | - | 0 | 17 | - | 160.96 ± 53.85 | 14 | - | 144.93 ± 31.99 | 14 | - | 261.33 ± 71.15 |
| VTL | ||||||||||||
| ΔF1–F10 in cm | 34 | - | 218.76 ± 26.99 | 18 | - | 126.6 ± 38.13 | 19 | - | 151.46 ± 58.11 | 14 | - | 70.88 ± 14.27 |
| ΔF1–F2 in cm | 34 | - | 218.76 ± 26.99 | 18 | - | 229.08 ± 14.26 | 19 | - | 255.57 ± 47.83 | 14 | - | 73.11 ± 14.92 |
| ΔF3–F10 in cm | 0 | - | 0 | 17 | - | 119.46 ± 36.13 | 14 | - | 126.02 ± 26.19 | 14 | - | 70.77 ± 15.7 |
Publisher’s Note: MDPI stays neutral with regard to jurisdictional claims in published maps and institutional affiliations. |
© 2022 by the authors. Licensee MDPI, Basel, Switzerland. This article is an open access article distributed under the terms and conditions of the Creative Commons Attribution (CC BY) license (https://creativecommons.org/licenses/by/4.0/).
Share and Cite
Beeck, V.C.; Heilmann, G.; Kerscher, M.; Stoeger, A.S. Sound Visualization Demonstrates Velopharyngeal Coupling and Complex Spectral Variability in Asian Elephants. Animals 2022, 12, 2119. https://doi.org/10.3390/ani12162119
Beeck VC, Heilmann G, Kerscher M, Stoeger AS. Sound Visualization Demonstrates Velopharyngeal Coupling and Complex Spectral Variability in Asian Elephants. Animals. 2022; 12(16):2119. https://doi.org/10.3390/ani12162119
Chicago/Turabian StyleBeeck, Veronika C., Gunnar Heilmann, Michael Kerscher, and Angela S. Stoeger. 2022. "Sound Visualization Demonstrates Velopharyngeal Coupling and Complex Spectral Variability in Asian Elephants" Animals 12, no. 16: 2119. https://doi.org/10.3390/ani12162119
APA StyleBeeck, V. C., Heilmann, G., Kerscher, M., & Stoeger, A. S. (2022). Sound Visualization Demonstrates Velopharyngeal Coupling and Complex Spectral Variability in Asian Elephants. Animals, 12(16), 2119. https://doi.org/10.3390/ani12162119