
Genome-Wide Association Study for Lactation Performance in the Early and Peak Stages of Lactation in Holstein Dairy Cows


Abstract
:Simple Summary
Abstract
1. Introduction
2. Materials and Methods
Animals and Phenotype
3. Genome-Wide Association Study
4. Gene Prospection
5. Results
6. Discussion
7. Conclusions
Author Contributions
Funding
Institutional Review Board Statement
Informed Consent Statement
Data Availability Statement
Acknowledgments
Conflicts of Interest
References
- Lund, M.S.; Sorensen, P.; Madsen, P.; Jaffrézic, F. Detection and modelling of time-dependent QTL in animal populations. Genet. Sel. Evol. 2008, 40, 177–194. [Google Scholar] [CrossRef]
- Oliveira, H.; Cant, J.; Brito, L.; Feitosa, F.; Chud, T.; Fonseca, P.; Jamrozik, J.; Silva, F.; Lourenco, D.; Schenkel, F. Genome-wide association for milk production traits and somatic cell score in different lactation stages of Ayrshire, Holstein, and Jersey dairy cattle. J. Dairy Sci. 2019, 102, 8159–8174. [Google Scholar] [CrossRef]
- Khatkar, M.S.; Nicholas, F.W.; Collins, A.R.; Zenger, K.R.; Cavanagh, J.A.; Barris, W.; Schnabel, R.D.; Taylor, J.F.; Raadsma, H.W. Extent of genome-wide linkage disequilibrium in Australian Holstein-Friesian cattle based on a high-density SNP panel. BMC Genom. 2008, 9, 187. [Google Scholar] [CrossRef] [Green Version]
- Goddard, M.E.; Hayes, B.J. Mapping genes for complex traits in domestic animals and their use in breeding programmes. Nat. Rev. Genet. 2009, 10, 381–391. [Google Scholar] [CrossRef]
- Jiang, L.; Liu, J.; Sun, D.; Ma, P.; Ding, X.; Yu, Y.; Zhang, Q. Genome wide association studies for milk production traits in Chinese Holstein population. PLoS ONE 2010, 5, e13661. [Google Scholar] [CrossRef] [Green Version]
- Cole, J.B.; Wiggans, G.R.; Ma, L.; Sonstegard, T.S.; Lawlor, T.J.; Crooker, B.A.; Van Tassell, C.P.; Yang, J.; Wang, S.; Matukumalli, L.K. Genome-wide association analysis of thirty one production, health, reproduction and body conformation traits in contemporary US Holstein cows. BMC Genom. 2011, 12, 408. [Google Scholar] [CrossRef] [Green Version]
- Meredith, B.K.; Kearney, F.J.; Finlay, E.K.; Bradley, D.G.; Fahey, A.G.; Berry, D.P.; Lynn, D.J. Genome-wide associations for milk production and somatic cell score in Holstein-Friesian cattle in Ireland. BMC Genet. 2012, 13, 21. [Google Scholar] [CrossRef] [Green Version]
- Iso-Touru, T.; Sahana, G.; Guldbrandtsen, B.; Lund, M.; Vilkki, J. Genome-wide association analysis of milk yield traits in Nordic Red Cattle using imputed whole genome sequence variants. BMC Genet. 2016, 17, 55. [Google Scholar] [CrossRef] [Green Version]
- Nayeri, S.; Sargolzaei, M.; Abo-Ismail, M.K.; May, N.; Miller, S.P.; Schenkel, F.; Moore, S.S.; Stothard, P. Genome-wide association for milk production and female fertility traits in Canadian dairy Holstein cattle. BMC Genet. 2016, 17, 75. [Google Scholar] [CrossRef] [Green Version]
- Schaeffer, L. Random Regression Models; University of Guelph: Guelph, Canada, 2016; Available online: http://animalbiosciences.uoguelph.ca/~lrs/BOOKS/rrmbook.pdf (accessed on 20 October 2016).
- Bignardi, A.B.; El Faro, L.; Cardoso, V.L.; Machado, P.F.; de Albuquerque, L.G. Random regression models to estimate test-day milk yield genetic parameters Holstein cows in Southeastern Brazil. Livest. Sci. 2009, 123, 1–7. [Google Scholar] [CrossRef]
- Singh, A.; Singh, A.; Singh, M.; Prakash, V.; Ambhore, G.; Sahoo, S.; Dash, S. Estimation of genetic parameters for first lactation monthly test-day milk yields using random regression test day model in Karan fries cattle. Asian-Australas. J. Anim. Sci. 2016, 29, 775. [Google Scholar] [CrossRef]
- Atashi, H.; Salavati, M.; De Koster, J.; Ehrlich, J.; Crowe, M.; Opsomer, G.; GplusE Consortium; Hostens, M. Genome-wide association for milk production and lactation curve parameters in Holstein dairy cows. J. Anim. Breed. Genet. 2020, 137, 292–304. [Google Scholar] [CrossRef]
- Ning, C.; Wang, D.; Zheng, X.; Zhang, Q.; Zhang, S.; Mrode, R.; Liu, J.-F. Eigen decomposition expedites longitudinal genome-wide association studies for milk production traits in Chinese Holstein. Genet. Sel. Evol. 2018, 50, 12. [Google Scholar] [CrossRef] [PubMed] [Green Version]
- Atashi, H.; Wilmot, H.; Vanderick, S.; Hubin, X.; Gengler, N. Genome-wide association study for milk production traits in Dual-Purpose Belgian Blue cows. Livest. Sci. 2022, 256, 104831. [Google Scholar] [CrossRef]
- Yan, M.-J.; Humphreys, J.; Holden, N.M. An evaluation of life cycle assessment of European milk production. J. Environ. Manag. 2011, 92, 372–379. [Google Scholar] [CrossRef]
- Zhang, L.; Gengler, N.; Dehareng, F.; Colinet, F.; Froidmont, E.; Soyeurt, H. Can we observe expected behaviors at large and individual scales for feed efficiency-related traits predicted partly from milk mid-infrared spectra? Animals 2020, 10, 873. [Google Scholar] [CrossRef] [PubMed]
- Purcell, S.; Neale, B.; Todd-Brown, K.; Thomas, L.; Ferreira, M.A.; Bender, D.; Maller, J.; Sklar, P.; De Bakker, P.I.; Daly, M.J. PLINK: A tool set for whole-genome association and population-based linkage analyses. Am. J. Hum. Genet. 2007, 81, 559–575. [Google Scholar] [CrossRef] [PubMed] [Green Version]
- Tetens, J.; Thaller, G.; Krattenmacher, N. Genetic and genomic dissection of dry matter intake at different lactation stages in primiparous Holstein cows. J. Dairy Sci. 2014, 97, 520–531. [Google Scholar] [CrossRef] [Green Version]
- Zhou, X.; Stephens, M. Genome-wide efficient mixed-model analysis for association studies. Nat. Genet. 2012, 44, 821–824. [Google Scholar] [CrossRef] [Green Version]
- Gelman, A.; Hill, J.; Yajima, M. Why we (usually) don’t have to worry about multiple comparisons. J. Res. Educ. Eff. 2012, 5, 189–211. [Google Scholar] [CrossRef] [Green Version]
- Lander, E.; Kruglyak, L. Genetic dissection of complex traits: Guidelines for interpreting and reporting linkage results. Nat. Genet. 1995, 11, 241–247. [Google Scholar] [CrossRef] [PubMed]
- Verardo, L.; Silva, F.; Varona, L.; Resende, M.; Bastiaansen, J.; Lopes, P.; Guimarães, S. Bayesian GWAS and network analysis revealed new candidate genes for number of teats in pigs. J. Appl. Genet. 2015, 56, 123–132. [Google Scholar] [CrossRef] [PubMed] [Green Version]
- Kinsella, R.J.; Kähäri, A.; Haider, S.; Zamora, J.; Proctor, G.; Spudich, G.; Almeida-King, J.; Staines, D.; Derwent, P.; Kerhornou, A. Ensembl BioMarts: A hub for data retrieval across taxonomic space. Database 2011, 2011, bar030. [Google Scholar] [CrossRef] [PubMed]
- Chen, H.; Zhang, L.; Li, X.; Li, X.; Sun, G.; Yuan, X.; Lei, L.; Liu, J.; Yin, L.; Deng, Q. Adiponectin activates the AMPK signaling pathway to regulate lipid metabolism in bovine hepatocytes. J. Steroid Biochem. Mol. Biol. 2013, 138, 445–454. [Google Scholar] [CrossRef]
- Kuleshov, M.V.; Jones, M.R.; Rouillard, A.D.; Fernandez, N.F.; Duan, Q.; Wang, Z.; Koplev, S.; Jenkins, S.L.; Jagodnik, K.M.; Lachmann, A. Enrichr: A comprehensive gene set enrichment analysis web server 2016 update. Nucleic Acids Res. 2016, 44, W90–W97. [Google Scholar] [CrossRef] [Green Version]
- Connor, E.E.; Siferd, S.; Elsasser, T.H.; Evock-Clover, C.M.; Van Tassell, C.P.; Sonstegard, T.S.; Fernandes, V.M.; Capuco, A.V. Effects of increased milking frequency on gene expression in the bovine mammary gland. BMC Genom. 2008, 9, 362. [Google Scholar] [CrossRef]
- Flori, L.; Fritz, S.; Jaffrézic, F.; Boussaha, M.; Gut, I.; Heath, S.; Foulley, J.-L.; Gautier, M. The genome response to artificial selection: A case study in dairy cattle. PLoS ONE 2009, 4, e6595. [Google Scholar] [CrossRef] [Green Version]
- Jiang, J.; Ma, L.; Prakapenka, D.; VanRaden, P.M.; Cole, J.B.; Da, Y. A large-scale genome-wide association study in US Holstein cattle. Front. Genet. 2019, 10, 412. [Google Scholar] [CrossRef]
- Hardie, L.; VandeHaar, M.; Tempelman, R.; Weigel, K.; Armentano, L.; Wiggans, G.; Veerkamp, R.; de Haas, Y.; Coffey, M.; Connor, E. The genetic and biological basis of feed efficiency in mid-lactation Holstein dairy cows. J. Dairy Sci. 2017, 100, 9061–9075. [Google Scholar] [CrossRef] [Green Version]
- Rajala-Schultz, P.; Gröhn, Y.; McCulloch, C.; Guard, C. Effects of clinical mastitis on milk yield in dairy cows. J. Dairy Sci. 1999, 82, 1213–1220. [Google Scholar] [CrossRef]
- Souza, F.; Blagitz, M.; Batista, C.; Takano, P.; Gargano, R.; Diniz, S.; Silva, M.; Ferronatto, J.; Santos, K.; Heinemann, M. Immune response in nonspecific mastitis: What can it tell us? J. Dairy Sci. 2020, 103, 5376–5386. [Google Scholar] [CrossRef] [PubMed]
- Braz, C.U.; Rowan, T.N.; Schnabel, R.D.; Decker, J.E. Genome-wide association analyses identify genotype-by-environment interactions of growth traits in Simmental cattle. Sci. Rep. 2021, 11, 13335. [Google Scholar] [CrossRef] [PubMed]
- Liu, S.; Ye, T.; Li, Z.; Li, J.; Jamil, A.M.; Zhou, Y.; Hua, G.; Liang, A.; Deng, T.; Yang, L. Identifying hub genes for heat tolerance in water buffalo (Bubalus bubalis) using transcriptome data. Front. Genet. 2019, 10, 209. [Google Scholar] [CrossRef] [PubMed] [Green Version]
- Abdollahi-Arpanahi, R.; Carvalho, M.R.; Ribeiro, E.S.; Peñagaricano, F. Association of lipid-related genes implicated in conceptus elongation with female fertility traits in dairy cattle. J. Dairy Sci. 2019, 102, 10020–10029. [Google Scholar] [CrossRef]
- Wang, H.; Misztal, I.; Aguilar, I.; Legarra, A.; Fernando, R.L.; Vitezica, Z.; Okimoto, R.; Wing, T.; Hawken, R.; Muir, W.M. Genome-wide association mapping including phenotypes from relatives without genotypes in a single-step (ssGWAS) for 6-week body weight in broiler chickens. Front. Genet. 2014, 5, 134. [Google Scholar] [CrossRef] [Green Version]
- Carreño, L.O.D.; da Conceição Pessoa, M.; Espigolan, R.; Takada, L.; Bresolin, T.; Cavani, L.; Baldi, F.; Carvalheiro, R.; De Albuquerque, L.G.; Da Fonseca, R. Genome association study for visual scores in Nellore cattle measured at weaning. BMC Genom. 2019, 20, 150. [Google Scholar] [CrossRef] [Green Version]
- Buzanskas, M.E.; Grossi, D.d.A.; Ventura, R.V.; Schenkel, F.S.; Chud, T.C.S.; Stafuzza, N.B.; Rola, L.D.; Meirelles, S.L.C.; Mokry, F.B.; Mudadu, M.d.A. Candidate genes for male and female reproductive traits in Canchim beef cattle. J. Anim. Sci. Biotechnol. 2017, 8, 67. [Google Scholar] [CrossRef] [Green Version]
- Yodklaew, P.; Koonawootrittriron, S.; Elzo, M.A.; Suwanasopee, T.; Laodim, T. Genome-wide association study for lactation characteristics, milk yield and age at first calving in a Thai multibreed dairy cattle population. Agric. Nat. Resour. 2017, 51, 223–230. [Google Scholar] [CrossRef]
- Chen, S.-Y.; Oliveira, H.R.; Schenkel, F.S.; Pedrosa, V.B.; Melka, M.G.; Brito, L.F. Using imputed whole-genome sequence variants to uncover candidate mutations and genes affecting milking speed and temperament in Holstein cattle. J. Dairy Sci. 2020, 103, 10383–10398. [Google Scholar] [CrossRef]
- Cai, Z.; Guldbrandtsen, B.; Lund, M.S.; Sahana, G. Prioritizing candidate genes post-GWAS using multiple sources of data for mastitis resistance in dairy cattle. BMC Genom. 2018, 19, 656. [Google Scholar] [CrossRef]
- Kour, A.; Deb, S.M.; Nayee, N.; Raina, V.S.; Yadav, V.; Niranjan, S.K. Understanding the genomic architecture of clinical mastitis in Bos indicus. 3 Biotech 2021, 11, 466. [Google Scholar] [CrossRef] [PubMed]
- Galliou, J.M.; Kiser, J.N.; Oliver, K.F.; Seabury, C.M.; Moraes, J.G.; Burns, G.W.; Spencer, T.E.; Dalton, J.; Neibergs, H.L. Identification of loci and pathways associated with heifer conception rate in US Holsteins. Genes 2020, 11, 767. [Google Scholar] [CrossRef] [PubMed]

| EARLY | PEAK | |||
|---|---|---|---|---|
| Trait 2 | Mean | SD | Mean | SD |
| Daily milk yield (kg) | 35.2 | 5.57 | 39.61 | 6.97 |
| Daily FPCM yield (kg) 3 | 37.3 | 6.27 | 38.67 | 6.25 |
| Daily FCM yield (kg) 4 | 37.7 | 6.34 | 39.44 | 6.20 |
| Daily ECM yield (kg) 5 | 40.2 | 6.77 | 41.41 | 6.69 |
| Daily fat yield (kg) | 1.58 | 0.30 | 1.58 | 0.26 |
| Daily protein yield (kg) | 1.20 | 0.23 | 1.18 | 0.24 |
| Daily fat percentage (%) | 4.51 | 0.56 | 4.10 | 0.51 |
| Daily protein percentage (%) | 3.43 | 0.31 | 3.01 | 0.22 |
| Trait | Lactation Stage | SNP 2 | BTA 3 | Position 4 | p5 | 100 kb Flanking Genes 6 |
|---|---|---|---|---|---|---|
| Daily milk yield (kg) | EARLY | - | - | - | - | - |
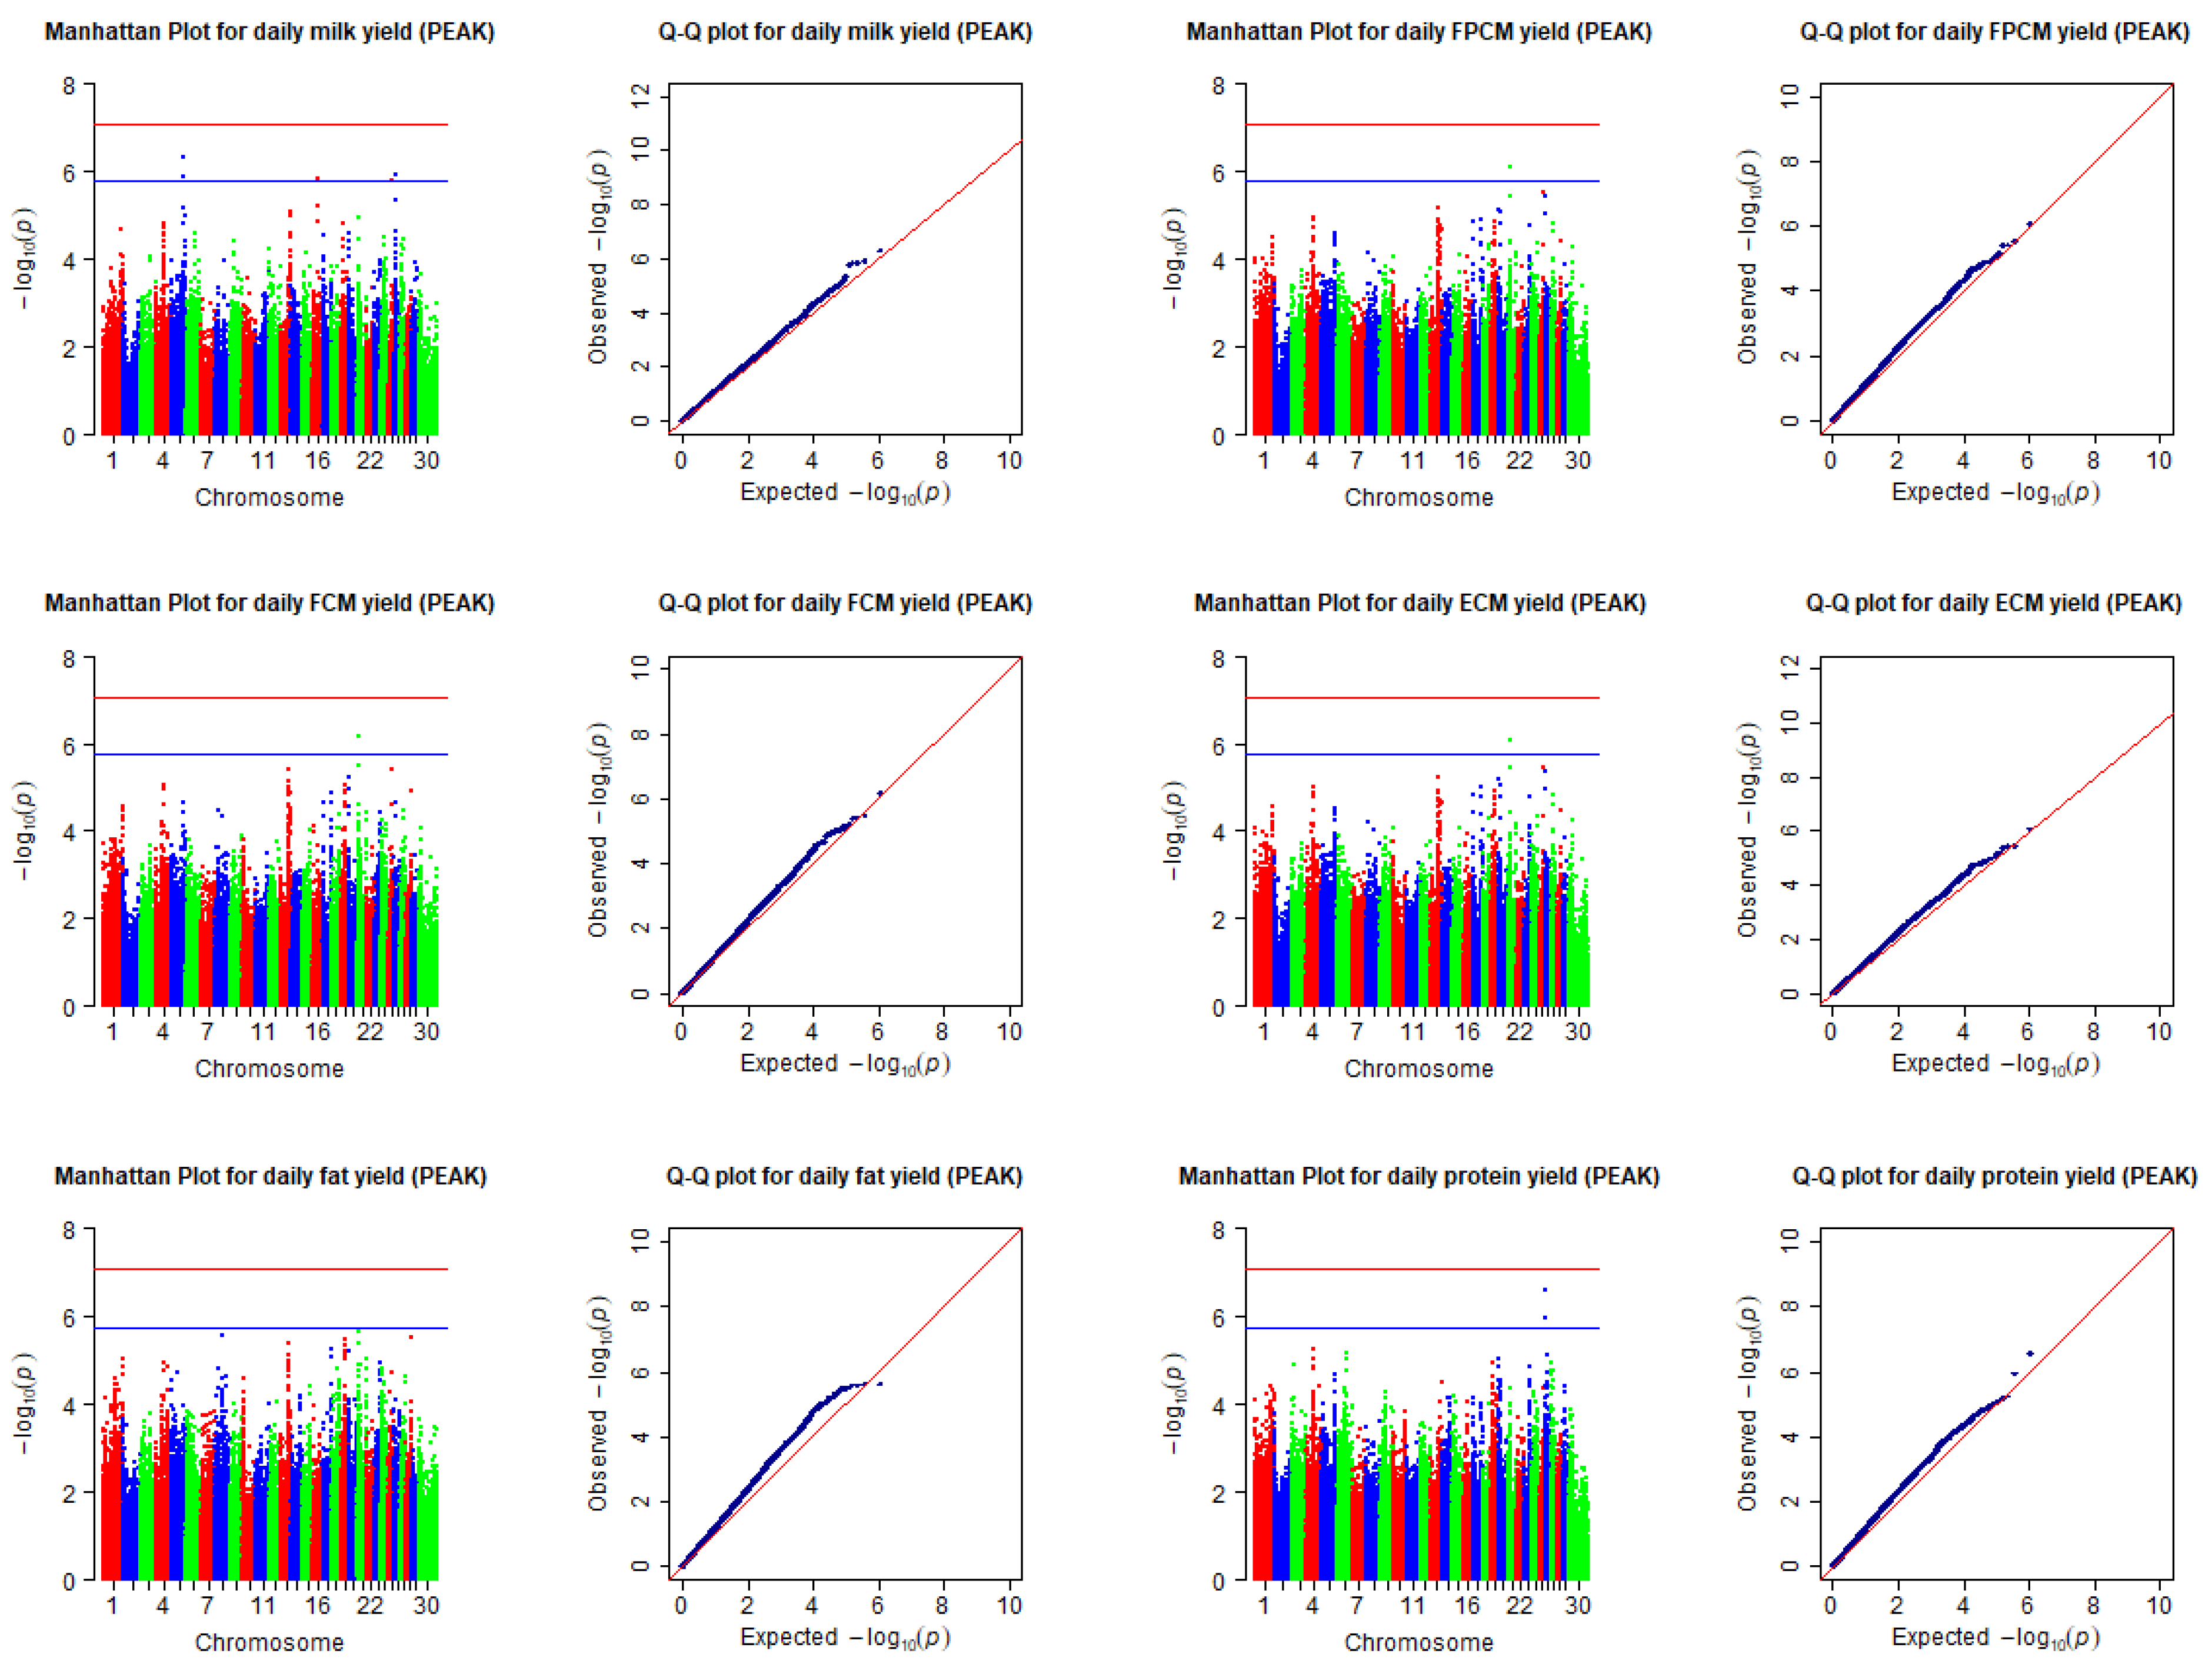
| Daily milk yield (kg) | PEAK | BovineHD0500029986 | 5 | 104728767 | 1.43 × 10⁻⁶ | LOC100297751, VWF, ANO2 |
| BovineHD0500029987 | 5 | 104731396 | 5.00 × 10⁻⁷ | LOC100297751, VWF, ANO2 | ||
| BovineHD1600010600 | 16 | 37008841 | 1.48 × 10⁻⁶ | XCL2, LOC104974416, XCL1 | ||
| BovineHD2600003772 | 26 | 14775291 | 1.24 × 10⁻⁶ | LOC104976766, MYOF | ||
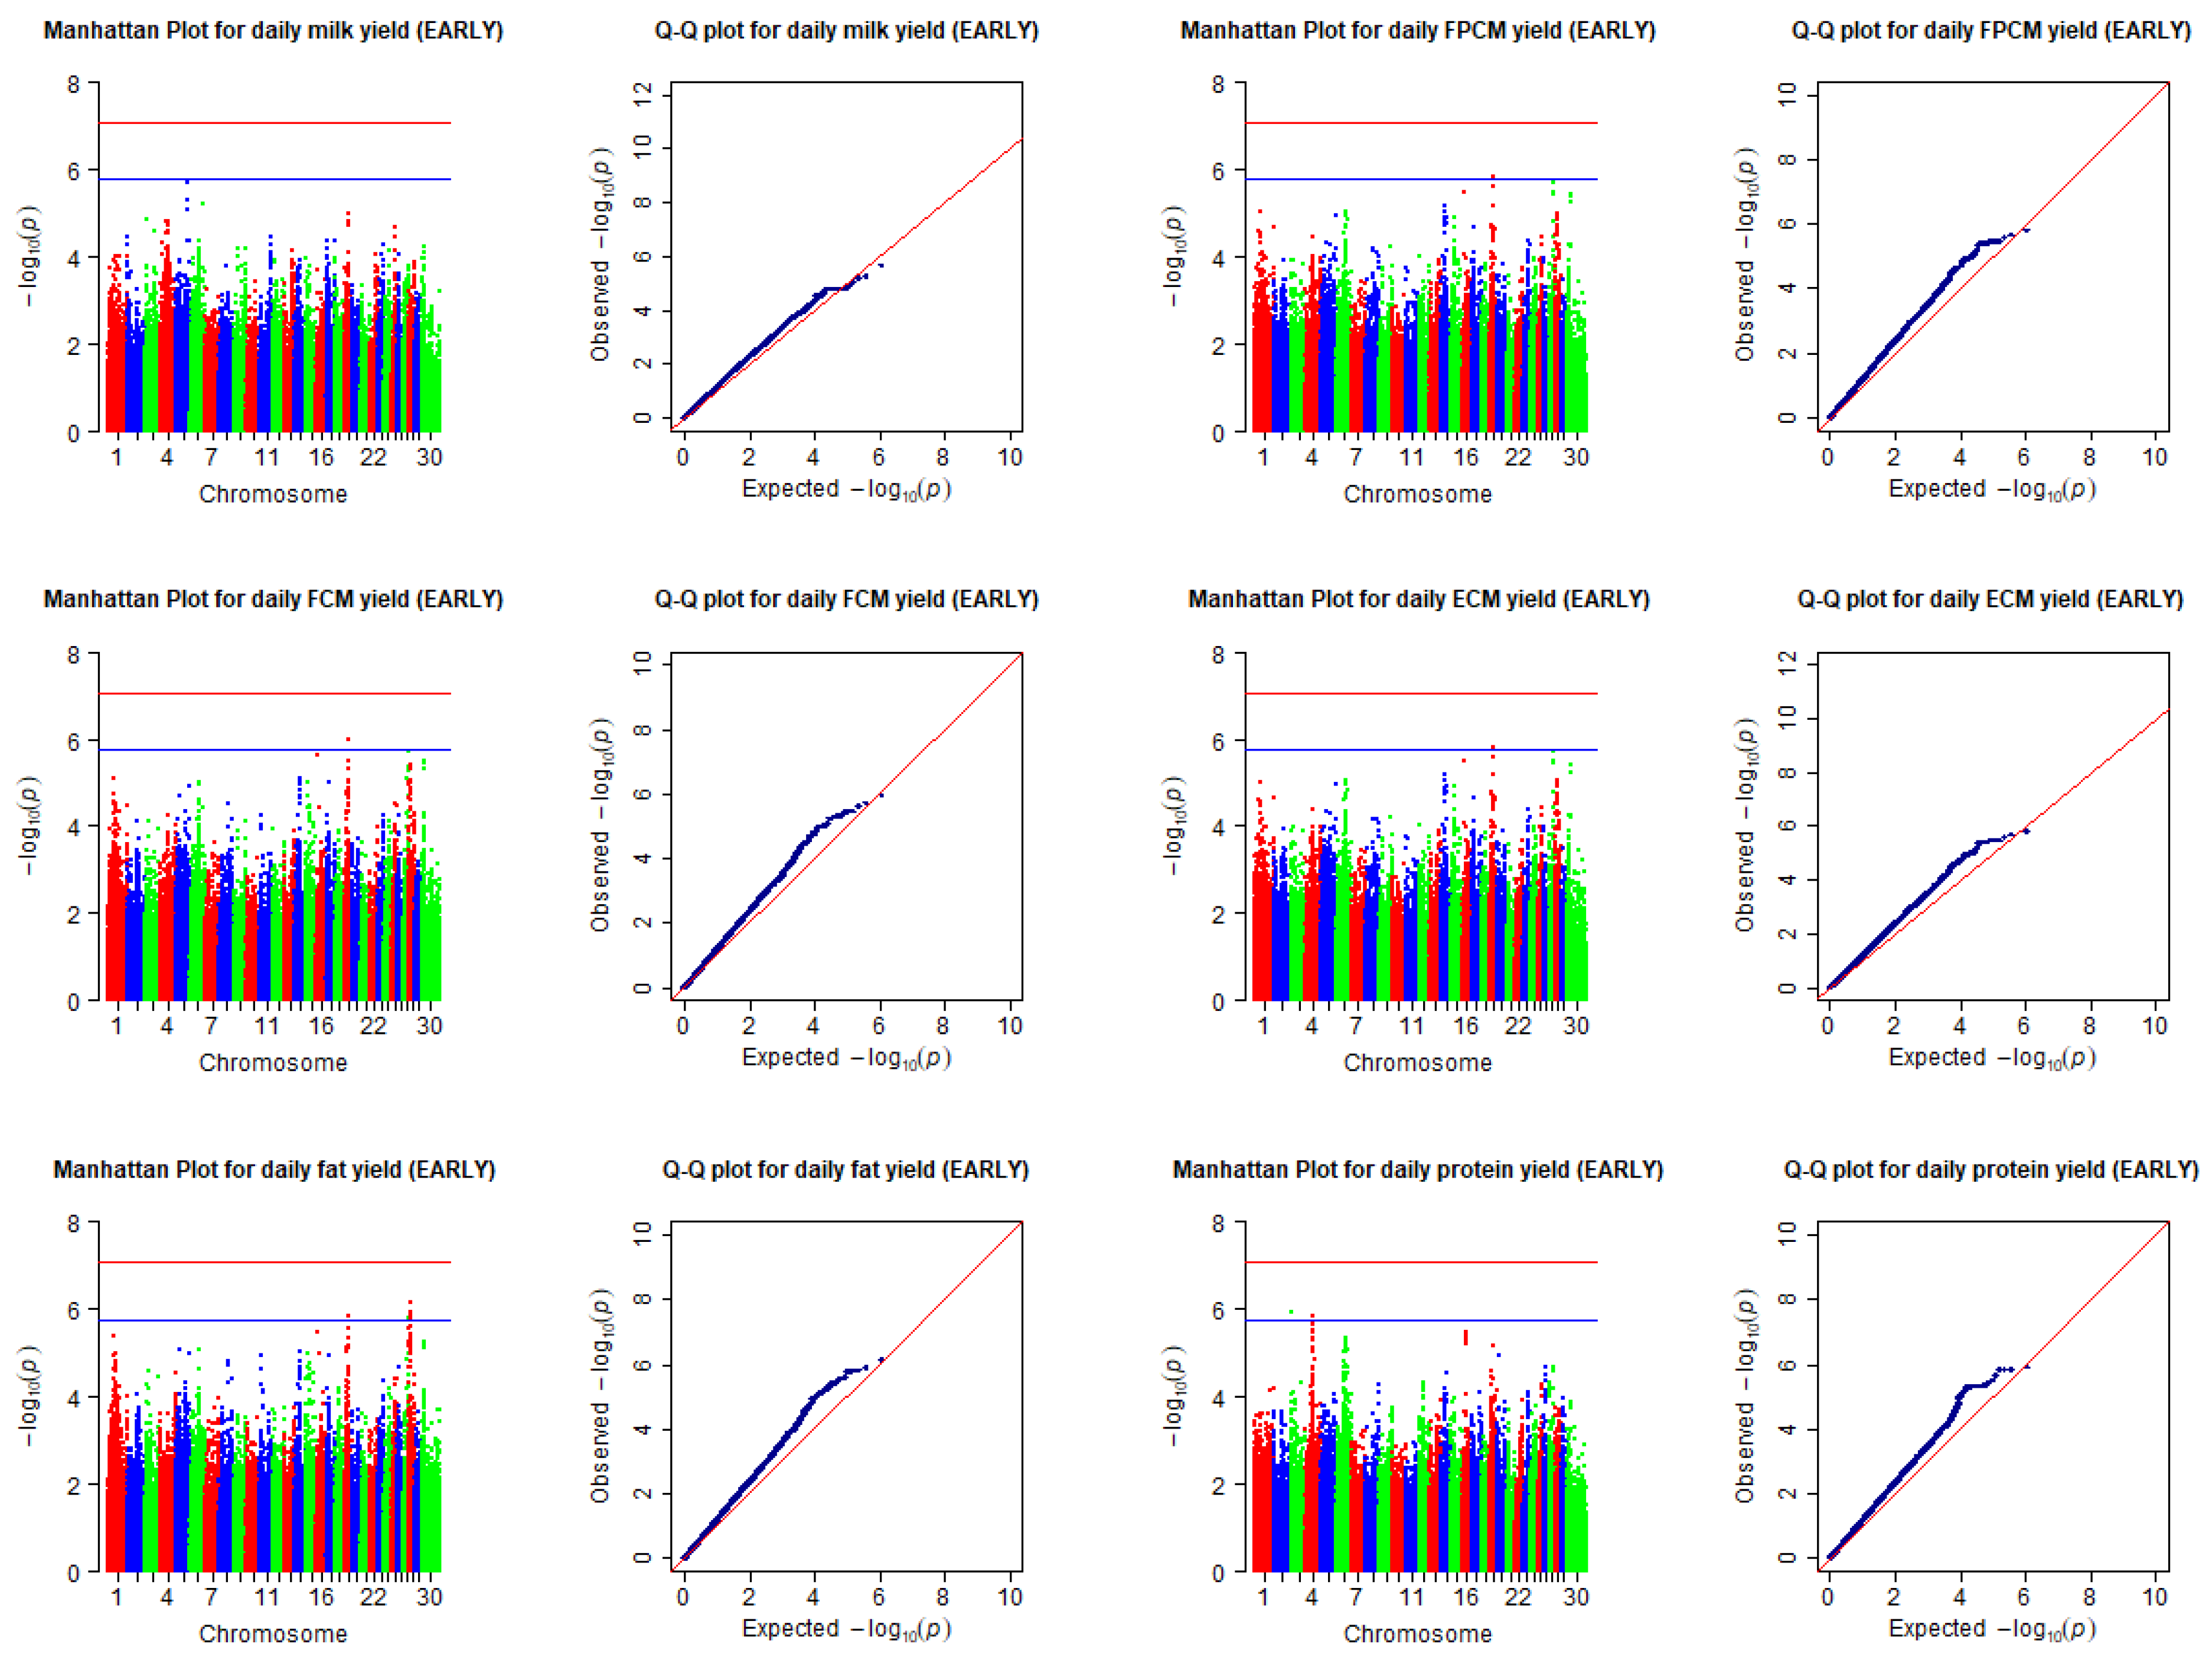
| Daily FPCM yield (kg) 7 | EARLY | BovineHD1900010590 | 19 | 36576999 | 1.53 × 10⁻⁶ | LOC101902244, LOC104975057, LOC512899, WFIKKN2, LUC7L3 |
| Daily FPCM yield (kg) | PEAK | BovineHD2100004343 | 21 | 15903999 | 8.25 × 10⁻⁷ | LOC104975331 |
| Daily FCM yield (kg) 8 | EARLY | BovineHD1900010590 | 19 | 36576999 | 1.07 × 10⁻⁶ | LOC101902244, LOC104975057, LOC512899, WFIKKN2, LUC7L3 |
| Daily FCM yield (kg) | PEAK | BovineHD2100004343 | 21 | 15903999 | 6.71 × 10⁻⁷ | LOC104975331 |
| Daily ECM yield (kg) 9 | EARLY | BovineHD1900010590 | 19 | 36576999 | 1.57 × 10⁻⁶ | LOC101902244, LOC104975057, LOC512899, WFIKKN2, LUC7L3 |
| Daily ECM yield (kg) | PEAK | BovineHD2100004343 | 21 | 15903999 | 8.20 × 10⁻⁷ | LOC104975331 |
| Daily fat yield (kg) | EARLY | BovineHD1900009968 | 19 | 33866094 | 1.50 × 10⁻⁶ | LOC100296637, LOC101907886, LOC104975044, UBB, PIGL, TRPV2, CENPV |
| BovineHD2700010009 | 27 | 35283307 | 1.62 × 10⁻⁶ | LOC104976121, ZMAT4 | ||
| BovineHD2800003727 | 28 | 12969171 | 1.58 × 10⁻⁶ | LOC101905153, LOC104970905, ZNF37A, LOC104970929, ZNF33B | ||
| BovineHD2800003728 | 28 | 12970103 | 1.24 × 10⁻⁶ | LOC101905153, LOC104970905, ZNF37A, LOC104970929, ZNF33B | ||
| BovineHD2800003739 | 28 | 12999108 | 1.51 × 10⁻⁶ | LOC101905153, LOC104970905, ZNF37A, LOC104970929, ZNF33B | ||
| BovineHD2800003747 | 28 | 13037081 | 6.93 × 10⁻⁷ | LOC101905153, LOC104970905, ZNF37A, LOC104970929, ZNF33B | ||
| Daily fat yield (kg) | PEAK | - | - | - | - | - |
| Daily protein yield (kg) | EARLY | BovineHD0300002517 | 3 | 7761414 | 1.16 × 10⁻⁶ | ATF6 |
| BovineHD0400016455 | 4 | 60555650 | 1.40 × 10⁻⁶ | ELMO1 | ||
| BovineHD0400016458 | 4 | 60561187 | 1.40 × 10⁻⁶ | ELMO1 | ||
| BovineHD0400016461 | 4 | 60566765 | 1.44 × 10⁻⁶ | ELMO1 | ||
| Daily protein yield (kg) | PEAK | BovineHD2600003771 | 26 | 14773836 | 1.12 × 10⁻⁶ | LOC104976766, MYOF |
| BovineHD2600003772 | 26 | 14775291 | 2.62 × 10⁻⁷ | LOC104976766, MYOF |
| EARLY | PEAK | |||
|---|---|---|---|---|
| Trait | GO Term Description | Genes | GO Term Description | Genes |
| MY 2 | Positive regulation of T cell chemotaxis (GO:0010820) Regulation of T cell chemotaxis (GO:0010819) Positive regulation of T cell migration (GO:2000406) | VWF, XCL1, XCL2 | ||
| FCMY 3 FPCMY 4 ECMY 5 | Negative regulation of cellular response to transforming growth factor beta stimulus (GO:1903845) Negative regulation of transforming growth factor beta receptor signaling pathway (GO:0030512) Transforming growth factor beta receptor signaling pathway (GO:0007179) | WFIKKN2, LUC7L3 | ||
| FY 6 | Establishment of mitochondrion localization, microtubule mediated (GO:0034643) Regulation of intrinsic apoptotic signaling pathway by p53 class mediator (GO:1902253) | PIGL, TRPV2, CENPV | ||
| PY 7 | Positive regulation of transcription from RNA polymerase II promoter in response to stress (GO:0036003) Positive of transcription from RNA polymerase II promoter in response to endoplasmic reticulum stress (GO:1990440) | ATF6, ELMO1 | ||
Publisher’s Note: MDPI stays neutral with regard to jurisdictional claims in published maps and institutional affiliations. |
© 2022 by the authors. Licensee MDPI, Basel, Switzerland. This article is an open access article distributed under the terms and conditions of the Creative Commons Attribution (CC BY) license (https://creativecommons.org/licenses/by/4.0/).
Share and Cite
Zare, M.; Atashi, H.; Hostens, M. Genome-Wide Association Study for Lactation Performance in the Early and Peak Stages of Lactation in Holstein Dairy Cows. Animals 2022, 12, 1541. https://doi.org/10.3390/ani12121541
Zare M, Atashi H, Hostens M. Genome-Wide Association Study for Lactation Performance in the Early and Peak Stages of Lactation in Holstein Dairy Cows. Animals. 2022; 12(12):1541. https://doi.org/10.3390/ani12121541
Chicago/Turabian StyleZare, Mahsa, Hadi Atashi, and Miel Hostens. 2022. "Genome-Wide Association Study for Lactation Performance in the Early and Peak Stages of Lactation in Holstein Dairy Cows" Animals 12, no. 12: 1541. https://doi.org/10.3390/ani12121541
APA StyleZare, M., Atashi, H., & Hostens, M. (2022). Genome-Wide Association Study for Lactation Performance in the Early and Peak Stages of Lactation in Holstein Dairy Cows. Animals, 12(12), 1541. https://doi.org/10.3390/ani12121541