Article

Dominant Components of the Giant Panda Seminal Plasma Metabolome, Characterized by 1H-NMR Spectroscopy

1
College of Food Science and Technology, Southwest Minzu University, Chengdu 610041, China
2
College of Resources, Sichuan Agricultural University, Chengdu 611130, China
3
Key Laboratory of State Forestry and Grassland Administration on Conservation Biology of Rare Animals in the Giant Panda National Park, The China Conservation and Research Center for the Giant Panda, Dujiangyan 611800, China
4
Department of Agricultural and Food Sciences, University of Bologna, 47521 Cesena, Italy
*
Authors to whom correspondence should be addressed.
Animals 2022, 12(12), 1536; https://doi.org/10.3390/ani12121536
Submission received: 19 May 2022 / Revised: 9 June 2022 / Accepted: 11 June 2022 / Published: 14 June 2022
(This article belongs to the Special Issue Sperm Quality and Fertility of Livestock Animals)

Abstract

:

Simple Summary

As China’s flagship animal, the giant panda (Ailuropoda melanoleuca) attracts much attention due to its small population and low natural reproductive rate. Therefore, artificial insemination has become the leading practical approach in the captive breeding programs of giant pandas worldwide. Seminal plasma acts as a medium between spermatozoa and the external stimuli, and its characteristics have been directly linked to fertility in both artificial insemination and natural fertilization. The current work, for the first time, attempts to characterize, by proton magnetic resonance spectroscopy (1H-NMR), the metabolome of healthy giant panda seminal plasma. A total of 35 molecules were quantified, with distinct age-related trends highlighted by a multivariate analysis, and the concentrations of 2,3-butanediol were significantly different between individuals younger than 8 years and older than 13 years. In addition, isopropanol’s concentration was significantly linked to estrus stages. Besides, the variations in the metabolome’s profile with storage time were also evaluated. This study may serve as a reference for research wishing to shed light on the biological mechanisms affecting giant panda sperm’s overall quality and may ultimately lead to novel approaches to giant panda artificial insemination.

Abstract

As an assisted breeding technique, artificial insemination has become the main effective practical approach in the captive breeding programs of giant panda worldwide. The composition of seminal plasma plays an important role in the success of breeding. The present work is the first attempt to characterize, by proton magnetic resonance spectroscopy (1H-NMR), the metabolome of healthy giant panda seminal plasma. A total of 35 molecules were quantified, with the concentration of 2,3-butanediol being significantly different between individuals younger than 8 years and older than 13 years, and other distinct age-related trends were highlighted by a multivariate analysis. Isopropanol’s concentration was significantly linked to estrus stages. Besides, the variations in the metabolome’s profile during storage were also evaluated. This study may serve as a reference for further research wishing to shed light on the biological mechanisms affecting giant panda sperm’s overall quality and may ultimately lead to novel approaches to giant panda artificial insemination.

1. Introduction

As the flagship animal of China, the giant panda (Ailuropoda melanoleuca) is one of the most endangered mammals on earth, which is attributed to its small population and limited reproductive rate [1]. Female giant pandas are in estrus for only a few days each year, so less than 10 percent of giant panda males mate, and less than 30 percent of females conceive naturally [2,3]. Therefore, artificial insemination has become the main practical approach in the captive breeding programs of giant pandas worldwide since it was first attempted in the 1970s [4,5,6].
To maximize the success rate of the procedure, the spermatozoa number, motility, and morphology have been widely evaluated [2,7,8]. As seminal plasma acts as a medium between spermatozoa and the external stimuli, its characteristics have also been directly linked to fertility [9]. Recent advances in high-throughput techniques (GC-MS (gas chromatography-mass spectrometry), LC-MS (liquid chromatograph-mass spectrometry), and 1H-NMR (proton magnetic resonance spectroscopy)) have shed light on the role played by its metabolome, the ensemble of its low-weight molecules. Metabolomics, the study of the metabolome, has therefore become a valuable tool for studying humans’ and other mammals’ seminal plasma [10,11,12]. For instance, Jayaraman et al. successfully distinguished different forms of male infertility through an NMR-based metabolomic approach and identified lysine as a potential biomarker for the detection and diagnosis of idiopathic infertility [12]. Mumcu et al. found potential biomarkers of infertility by studying the metabolome of seminal plasma in patients with idiopathic oligoasthenoteratozoospermia [13].
In humans and in any other animal, the age of the donor has been reported to be a key factor for seminal plasma perturbations, so the relationships between seminal plasma characteristics and age have been widely investigated. For instance, Fosse et al. found that older men exhibit a high pro-inflammatory seminal plasma profile and determine unexplained recurrent pregnancy losses [14]. Vince et al., studying bulls during cold and warm periods of the year, found age-related differences in the antioxidant profiles of their seminal plasma [15]. Such findings agree with those of Sicy et al., who assessed the seminal plasma oxidant/antioxidant status of Arab stallions of different ages [16]. In rams, Souza et al. found that the total protein concentration in the seminal plasma significantly increased during the first 28 weeks of life [17]. In Arabian horses, Ahmed et al. noticed significant age-related effects on seminal plasma’s biochemical constituents, namely, glycerylphosphorylcholine, ergothioneine, and total protein concentrations [18].
Interestingly, the estrus stages of the female giant panda have been found to affect male giant panda semen quality, both directly and indirectly. Tsutsui et al. found that male giant panda semen volume, sperm count, and testis volume markedly differed from 90 days before estrus until 66 days after estrus when a female giant panda was housed nearby. From this observation, they inferred that spermatogenesis was active in this male panda from approximately 3 months before estrus to 2 months after estrus in the adjacent female [3]. In addition, Palmer et al. reported that testes morphometry, fecal androgen excretion, seminal quality, and the panda’s overall behavior clearly demonstrated reproductive seasonality in the male giant panda [19].
Cryopreservation is considered to be the main form of sperm preservation and is widely used for artificial insemination. It is known that plasma characteristics may be altered during storage with consequences on spermatozoa motility [20]. However, most of the works on the topic have focused on the effects of dilution or removal, the most common practice prior to cryopreservation in most mammalian species [21]. Lower attention has been paid to the detailed study of the effects of storage time on the metabolome of seminal plasma.
The above works suggest that advances in the procedures for the artificial insemination of giant pandas may come from the study of the seminal plasma metabolome, which is the object of the present work. With the purpose of providing reliable quantitative information, an untargeted approach based on 1H-NMR was used by taking advantage of the high reproducibility of this analytical platform [22]. As the samples we were able to collect had been frozen and donated from animals covering all life stages of the giant panda, we had the opportunity to obtain preliminary information on how age, the estrus stages of the female giant panda, and storage time could influence the molecular profile of male giant panda seminal plasma. These findings may serve as a starting point for further research shedding light on the biological mechanisms impacting giant panda sperm’s overall quality and ultimately lead to novel approaches to giant panda artificial insemination.

2. Materials and Methods

2.1. Sample Collection

All samples were kindly provided, regardless of the purpose of this study, during the procedures for artificial insemination and cryogenic storage that are routinely conducted at the China Conservation and Research Center for the Giant Panda by selecting for metabolomics investigation an aliquot of sperm stored for insemination. Sperm freezing medium (TEST-yolk buffer with glycerol and gentamicin) and sperm refrigeration medium (TEST-yolk buffer with gentamicin) were added immediately after sample collection. Semen collection was achieved with the panda in dorsal recumbency. Prior to electroejaculation, feces were manually removed from the rectum, and the penis and surrounding area were washed with warm water. A 4.2 cm diameter, 20 cm long probe was used with three l cm circular electrodes. The probe was placed in the rectum to a depth of 15–20 cm. Electrostimulations were performed with a 110 V, 60 Hz machine with a 220 V, 50 Hz transformer. A range of 5–12 stimulations with 2–8 V (a maximum of 200 mA) over a 3–5 s period was repeated to achieve ejaculation. Semen was collected into a plastic container and immediately frozen with liquid nitrogen. All the samples were shipped to a laboratory in less than 2 h with ice immediately after collection. Samples collections were performed from 2010 to 2019 and stored at −80 °C until analysis.

2.2. 1H-NMR Analysis

Following Zhu et al. [23], an NMR analysis solution was created. It contained a 10 mmol/L NMR spectra chemical-shift reference in D2O, namely, 3-(trimethylsilyl)-propionic-2,2,3,3-d4 acid sodium salt (TSP), set at pH 7.00 ± 0.02 through 1 mmol/L phosphate buffer. Besides, 10 μL of 2 mmol/L NaN3 was added to the above liquid in order to avoid microbial proliferation.
Immediately before 1H-NMR analysis, seminal plasma samples were thawed and centrifuged for 15 min at 18,630 g at 4 °C. Finally, 300 μL of supernatant was mixed with 300 μL of bi-distilled water and 100 μL of NMR analysis solution for 1H-NMR analysis.
The 1H-NMR spectra were obtained by means of an AVANCE III spectrometer (Bruker, Chengdu, China) operating at a frequency of 800.30 MHz at 298 K and equipped with the software Topspin 3.5. Following Zhu et al. [24], the signals from broad resonances originating from macromolecules were suppressed by a CPMG filter composed of 400 echoes with a τ of 400 μs and a 180° pulse of 30.48 μs, for a total filter of 332 ms. The HOD residual signal was suppressed by means of presaturation. This was performed by employing the cpmgpr1d sequence, part of the standard pulse sequence library. Each spectrum was acquired by summing 64 transients using 64 K data points over a 16,025.64 Hz spectral window with an acquisition time of 2.025 s.
The spectra phase was manually adjusted in Topspin, while the subsequent adjustments were performed in R computational language by means of a script that was developed in-house [25]. After the residual water signal removal, the 1H-NMR spectra were baseline-corrected through peak detection, in accordance with the “rolling ball” principle [26] implemented in the R package named baseline [27]. The chemical shift and multiplicity of signals allowed the molecules’ annotation by taking advantage of the Chenomx software library (ver. 8.3, Chenomx Inc., Edmonton, AB, Canada).
In order to remove the potential confounding factor of dilution [28], the ratio between the area of TSP signal and the total spectrum intensity of each sample was calculated. This allowed us to estimate the median unspecific change in metabolites caused by water and to select the sample characterized by the mostly representative dilution. The molecules were quantified in this sample by employing the added TSP as an internal standard, while any other sample was then normalized by means of probabilistic quotient normalization [28], which was set up to exclude spectra portions ascribed to water and glycerol. The integration of the signals was performed for each molecule by means of rectangular integration.

2.3. Statistical Analysis

The statistical analysis was conducted in R computational language and online data analysis platform MetaboAnalyst 5.0 (https://www.metaboanalyst.ca, accessed on 1 March 2022). Prior to the univariate analyses, the distribution of the concentrations of the molecules was brought to normality according to Box and Cox [29]. To demonstrate perturbations caused to single molecules by the effects considered, t-tests were applied with a significance limit of p < 0.05. To demonstrate perturbations encompassing the metabolome’s profile in its entirety, robust principal component analysis (rPCA) models [30] and heatmaps were employed. The outcome of each rPCA model was constituted by a scoreplot, the projection of the samples in the PC space. This allowed us to highlight the underlying structure of the data. Besides, we calculated Pearson’s correlation plot, relating the concentration of each variable to its importance over each component of the model.

3. Results

3.1. Characterization of Samples

Samples from 15 healthy captive giant pandas were obtained (Table 1). According to Zhu et al. and Wei et al. [31,32], all the giant pandas were considered to be divided into three groups according to mating age. On average, wild giant pandas come to estrus at 7.5 years and mating age starts at 8.5 years, while captive giant pandas come to estrus earlier than wild ones. In addition, captive giant pandas are considered to be adults when their age is between 5.5 and 20. Therefore, adult phase I comprised animals younger than 8 years of age, adult phase II comprised those between 8 and 12 years of age, and adult phase III comprised animals older than 13. The estrus of the giant panda begins from March to May, so the samples collected in February and March were considered pre-estrus (PRE), those collected in April were considered middle-estrus (MID), and those collected in May and June were considered post-estrus (POS). Focusing on cryogenic storage time, all the samples were considered to pertain to the long storage group when stored for more than 6 years, while they were considered as pertaining to the short storage group otherwise.

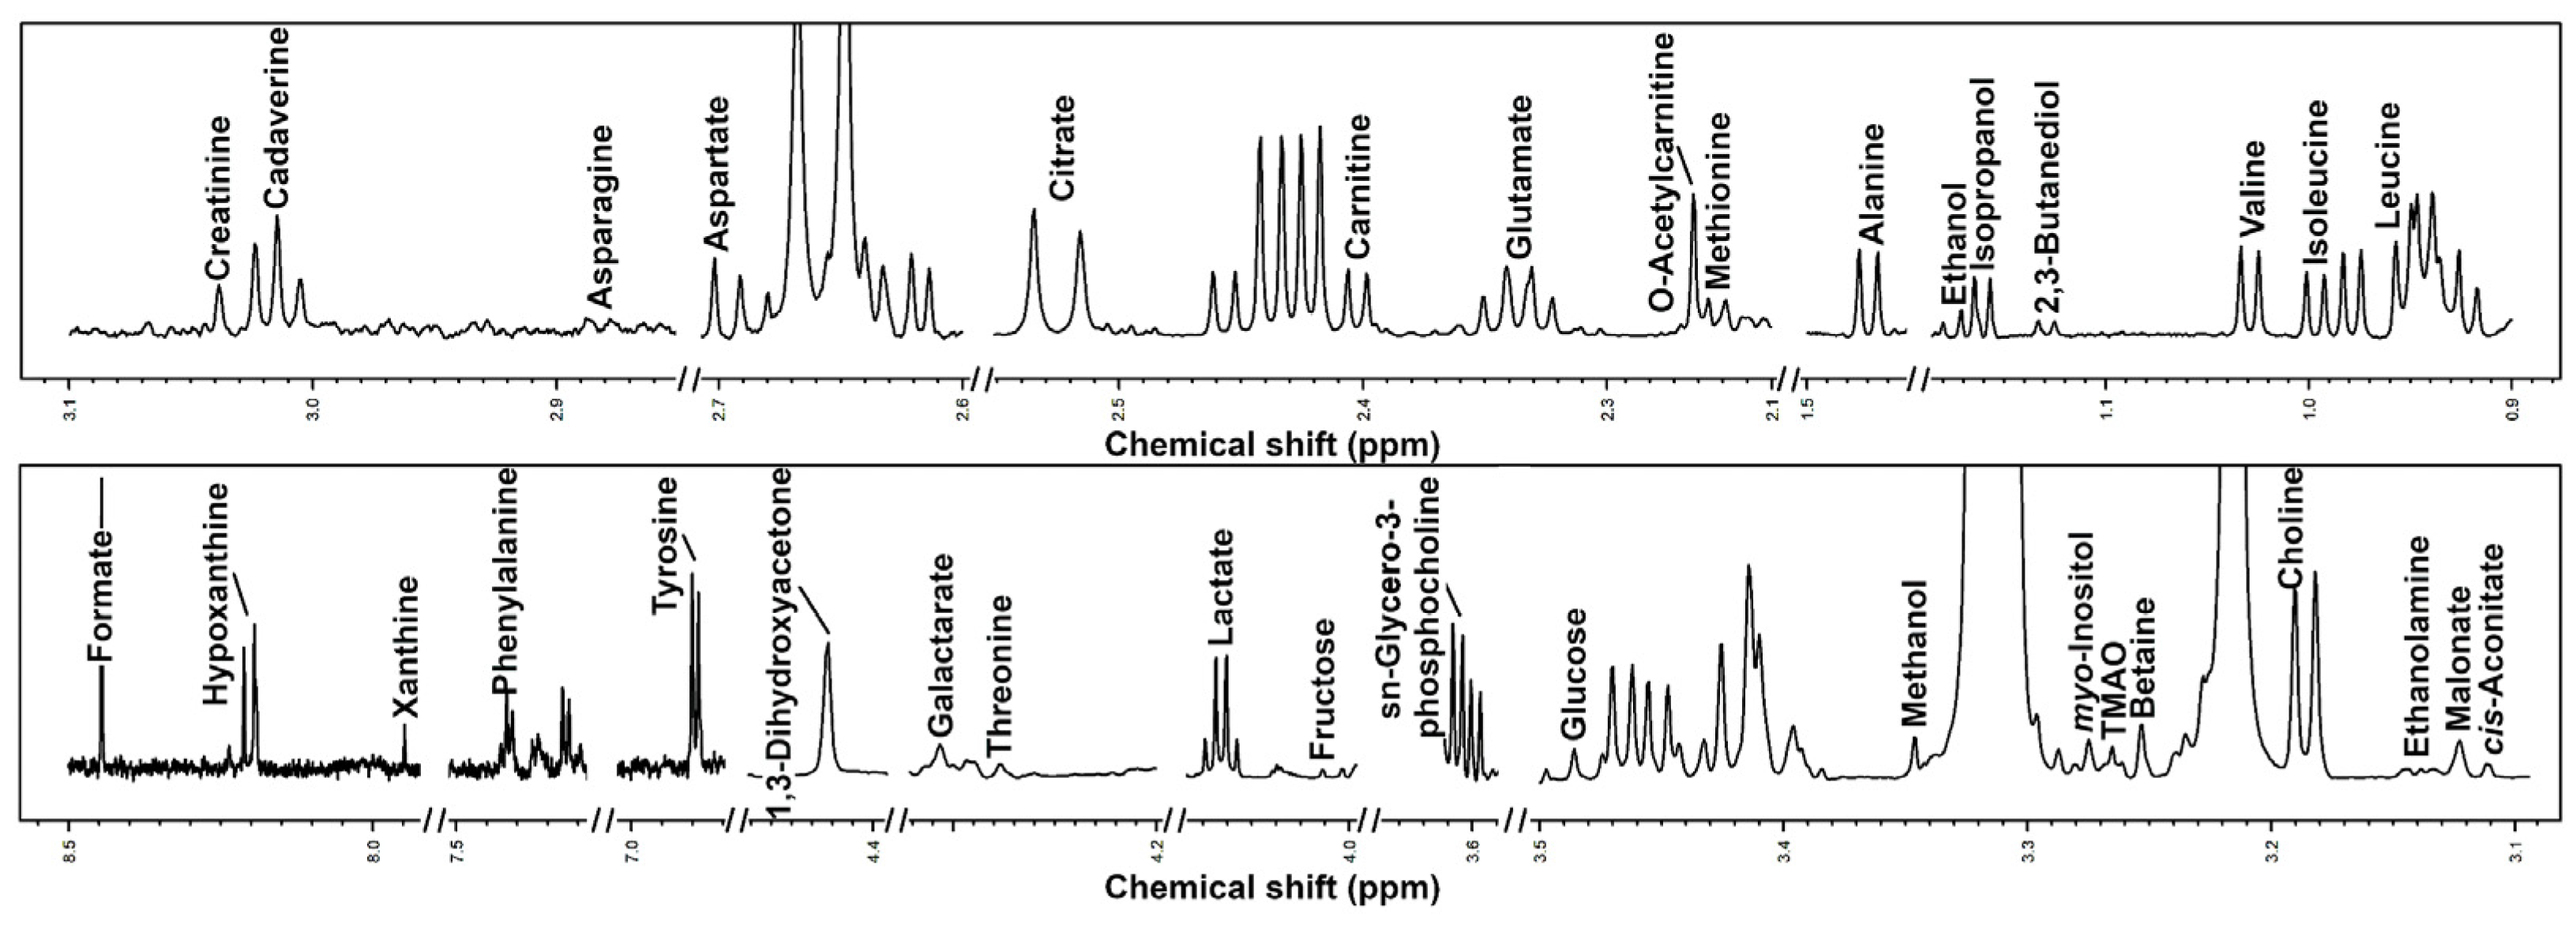
3.2. Characterization of Semen Plasma Metabolome of Giant Panda

In giant panda seminal plasma samples, we were able to characterize 35 metabolites. The details of the characterization by 1H-NMR are visually represented in Figure 1 through a typical 1H-NMR spectrum of the collected samples. The complete list of molecules and their concentrations is reported in the Table 2.
The characterized molecules mainly pertained to the classes of carbohydrates and derivatives, organic acids and derivatives, amino acids, peptides and derivatives, and nucleosides, nucleotides, and analogues. The relative abundances of those classes in the samples from the three panda’s groups can be visually inspected in Figure 2. The overall relative concentrations of amino acids, peptides, and derivatives showed increasing trends with age, specifically, 24.76%, 27.22%, and 29.06% in three groups, respectively. On the contrary, the contents of organic acids and derivatives were negatively related to age, namely, 38.93%, 38.75%, and 36.22%, respectively. Among the quantified molecules, the concentrations of sn-glycerol-3-phosphocholine, lactate, citrate, and carnitine were the most represented in each group.

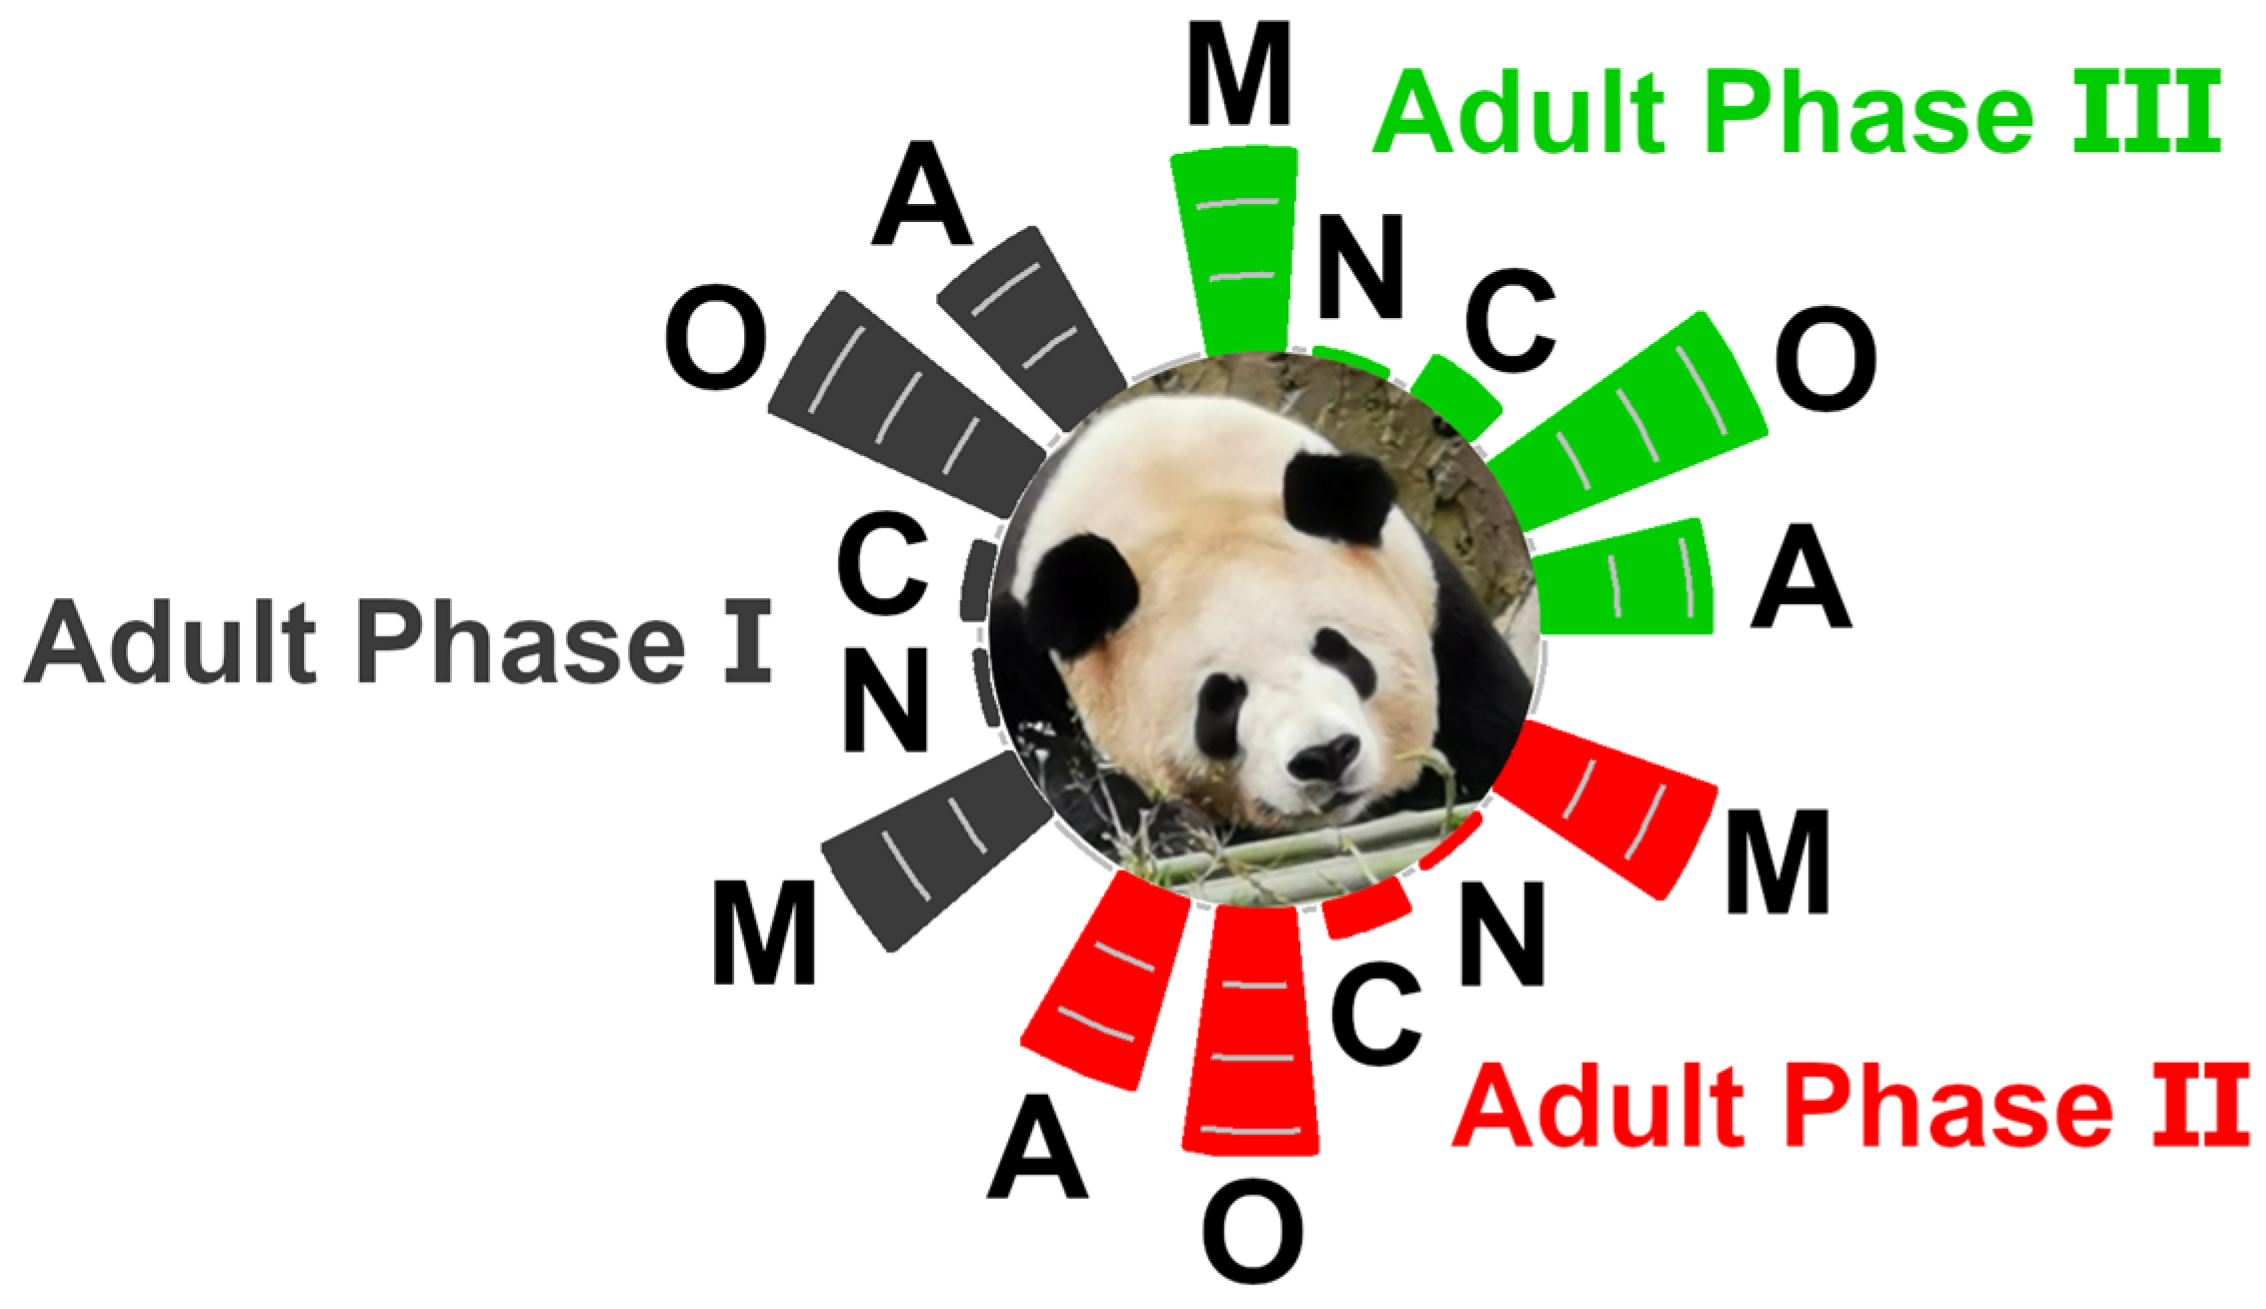
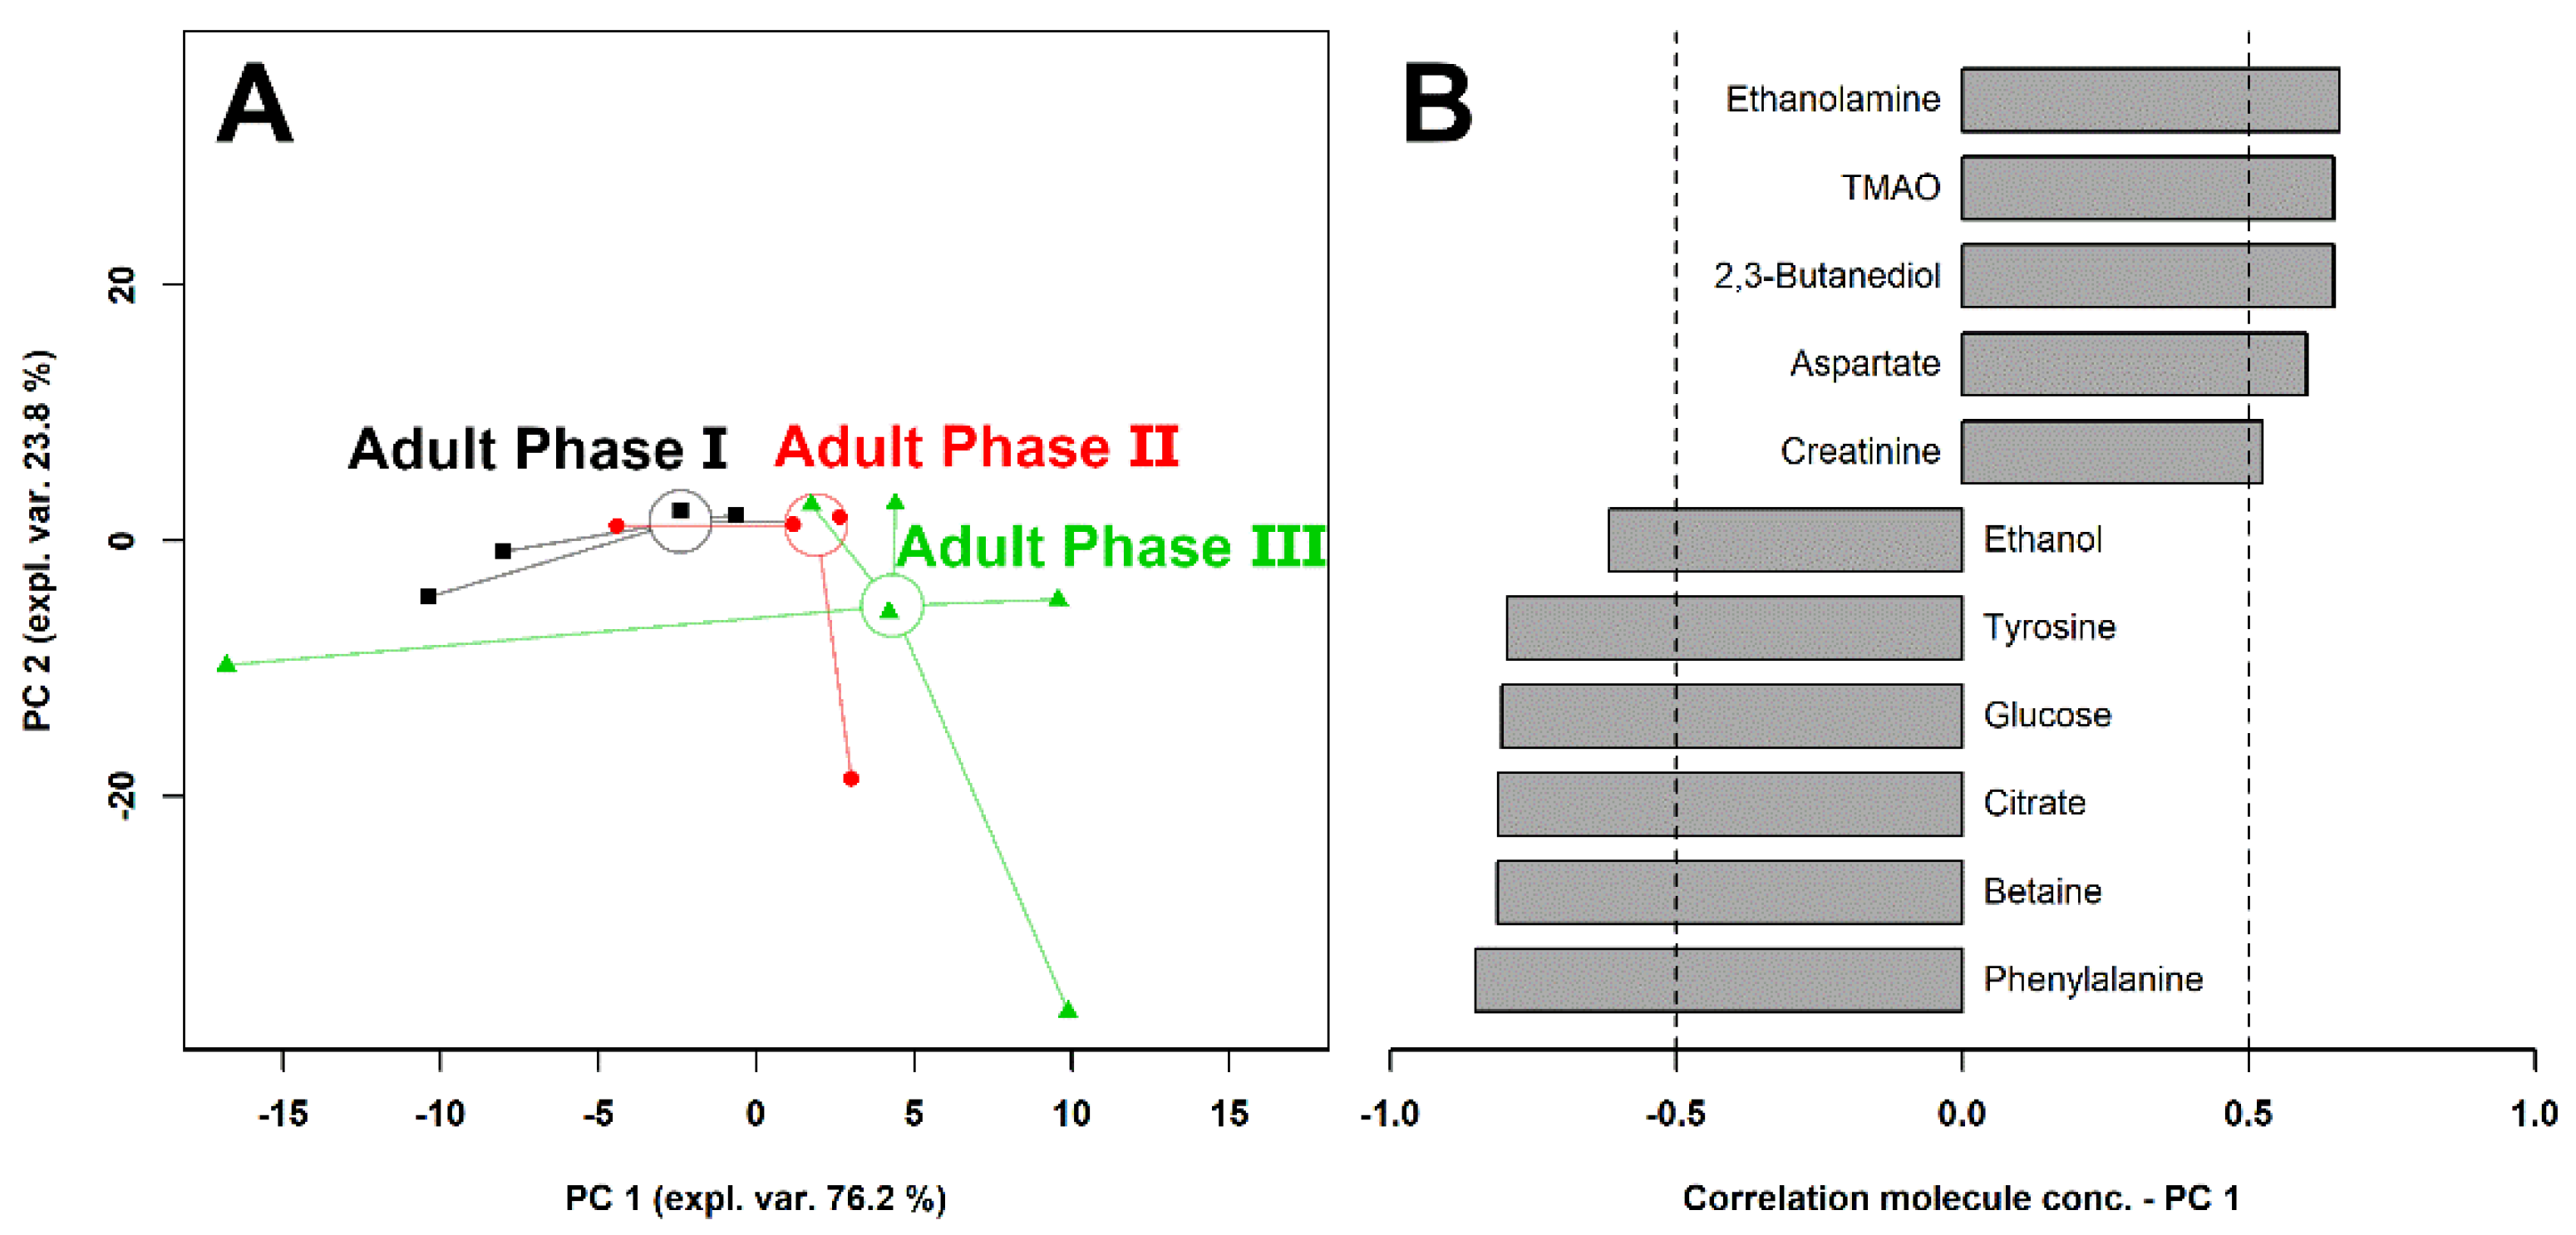
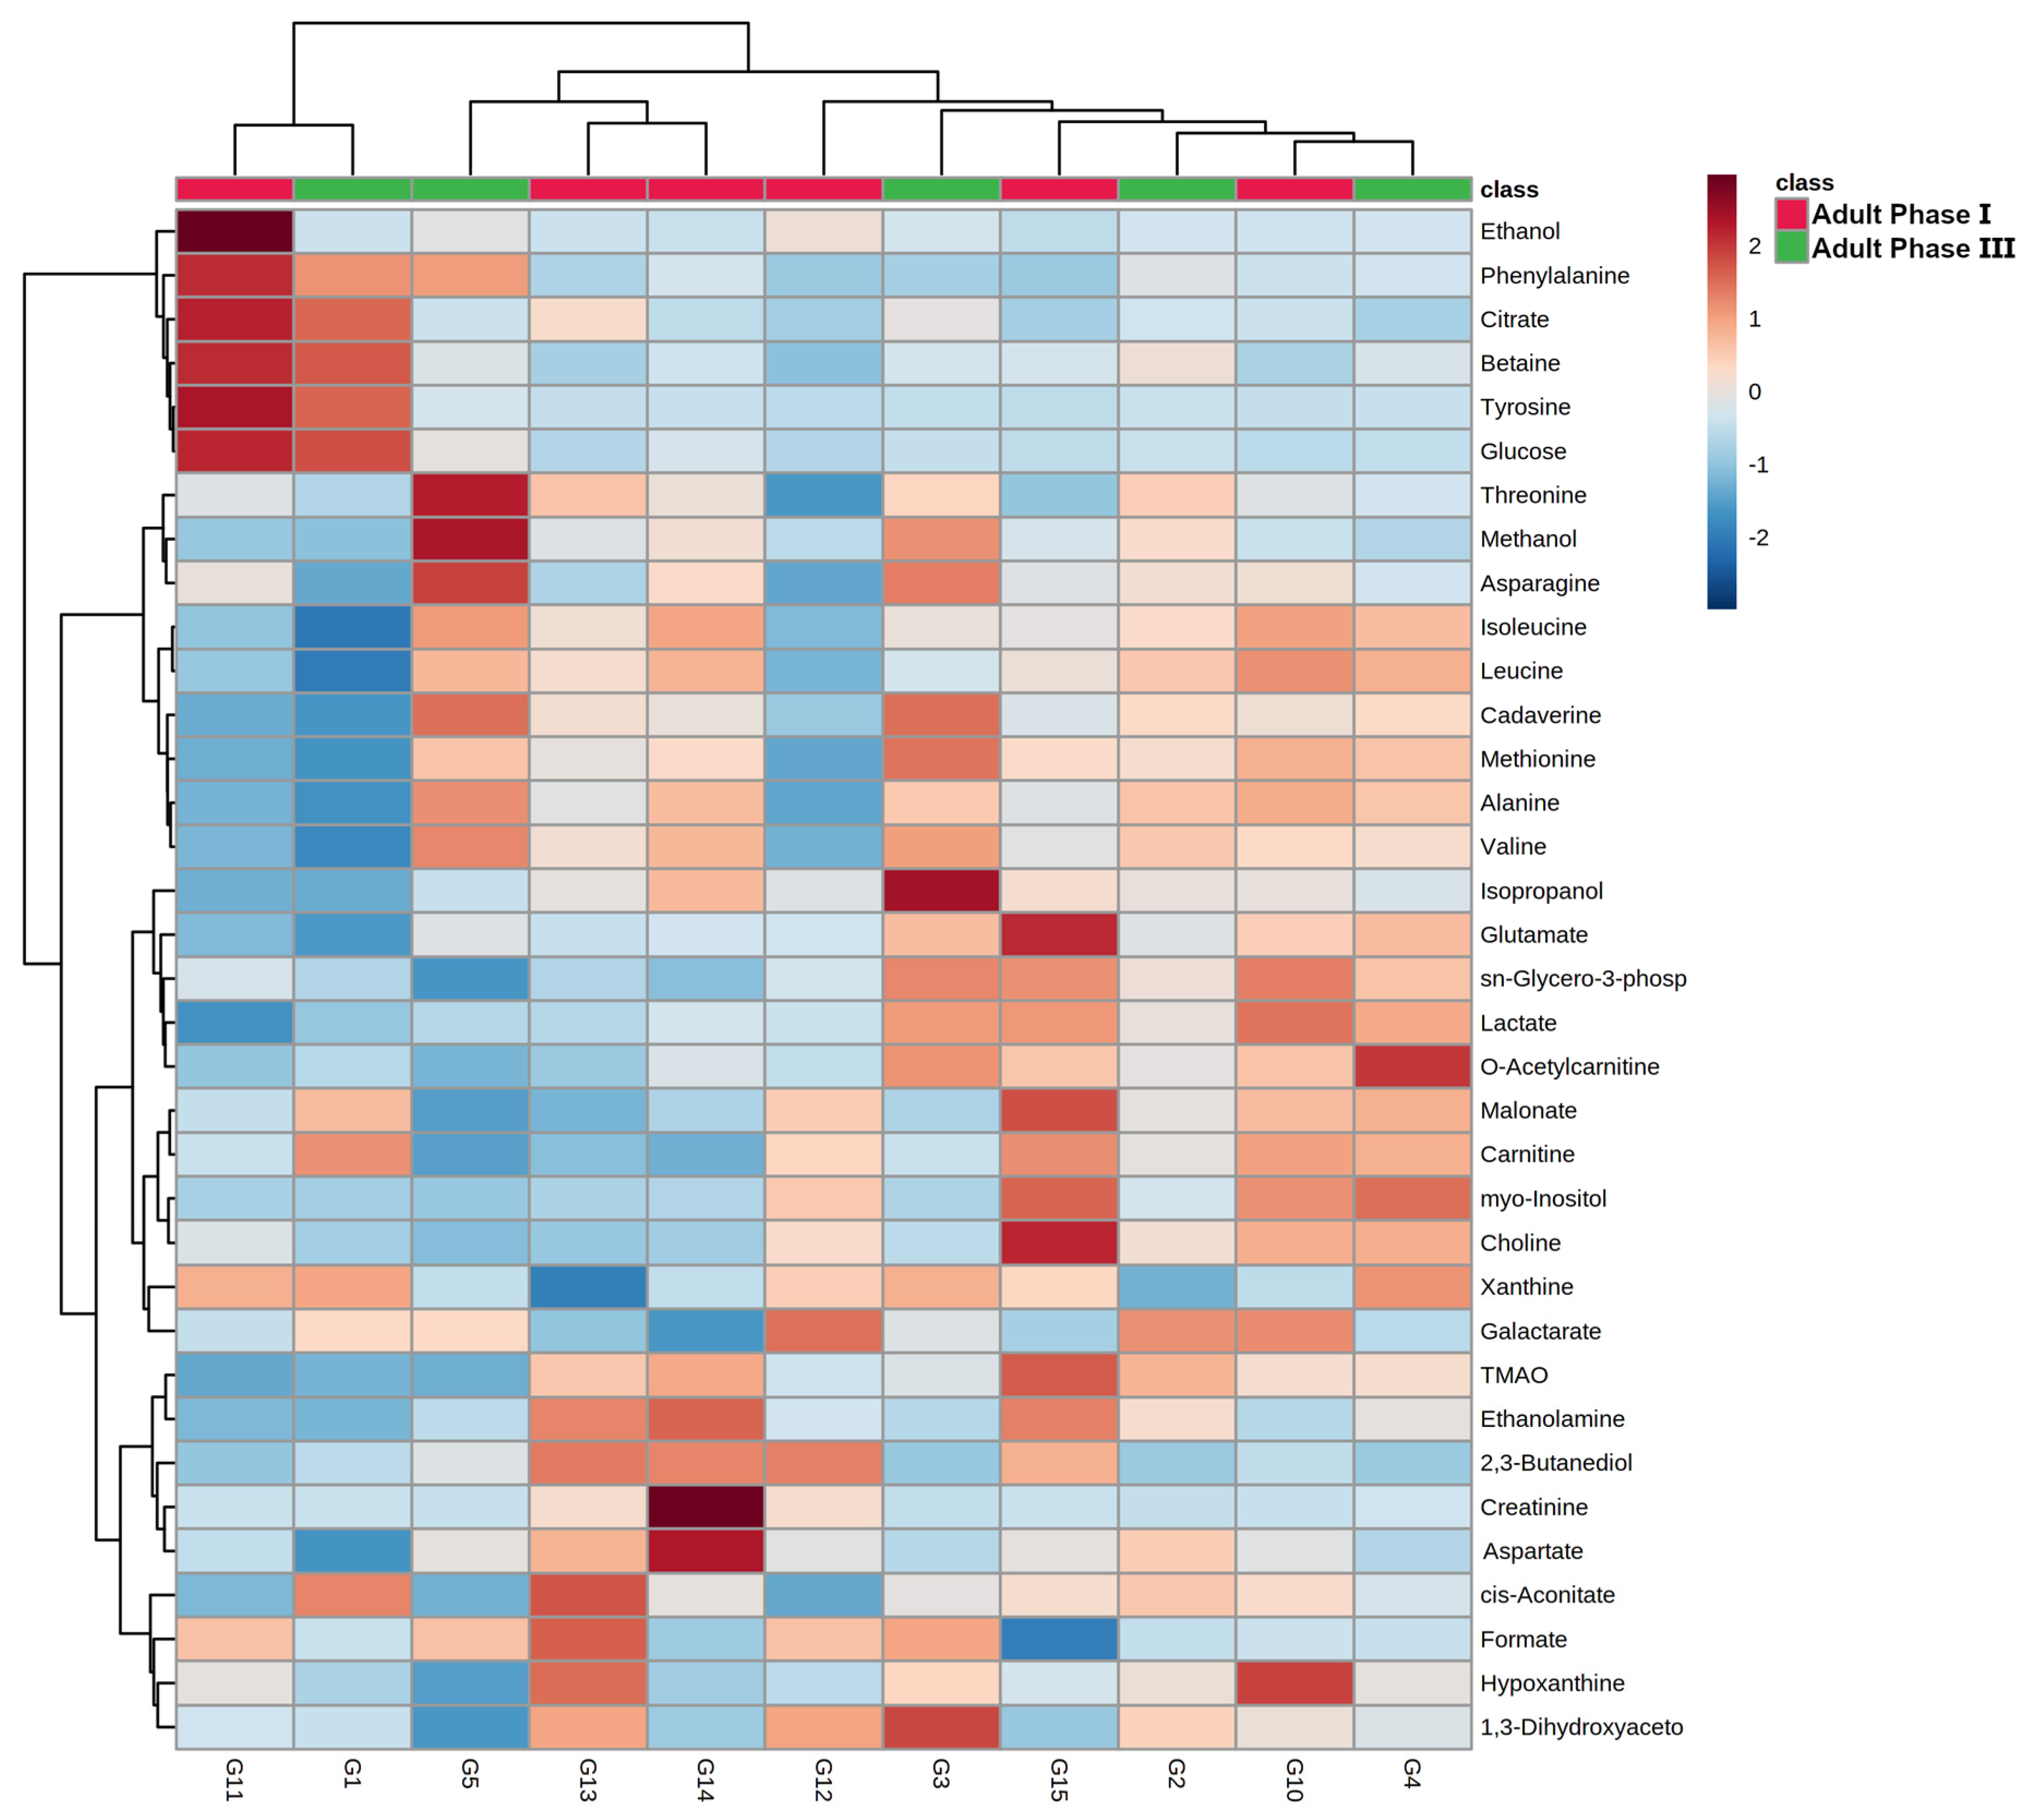
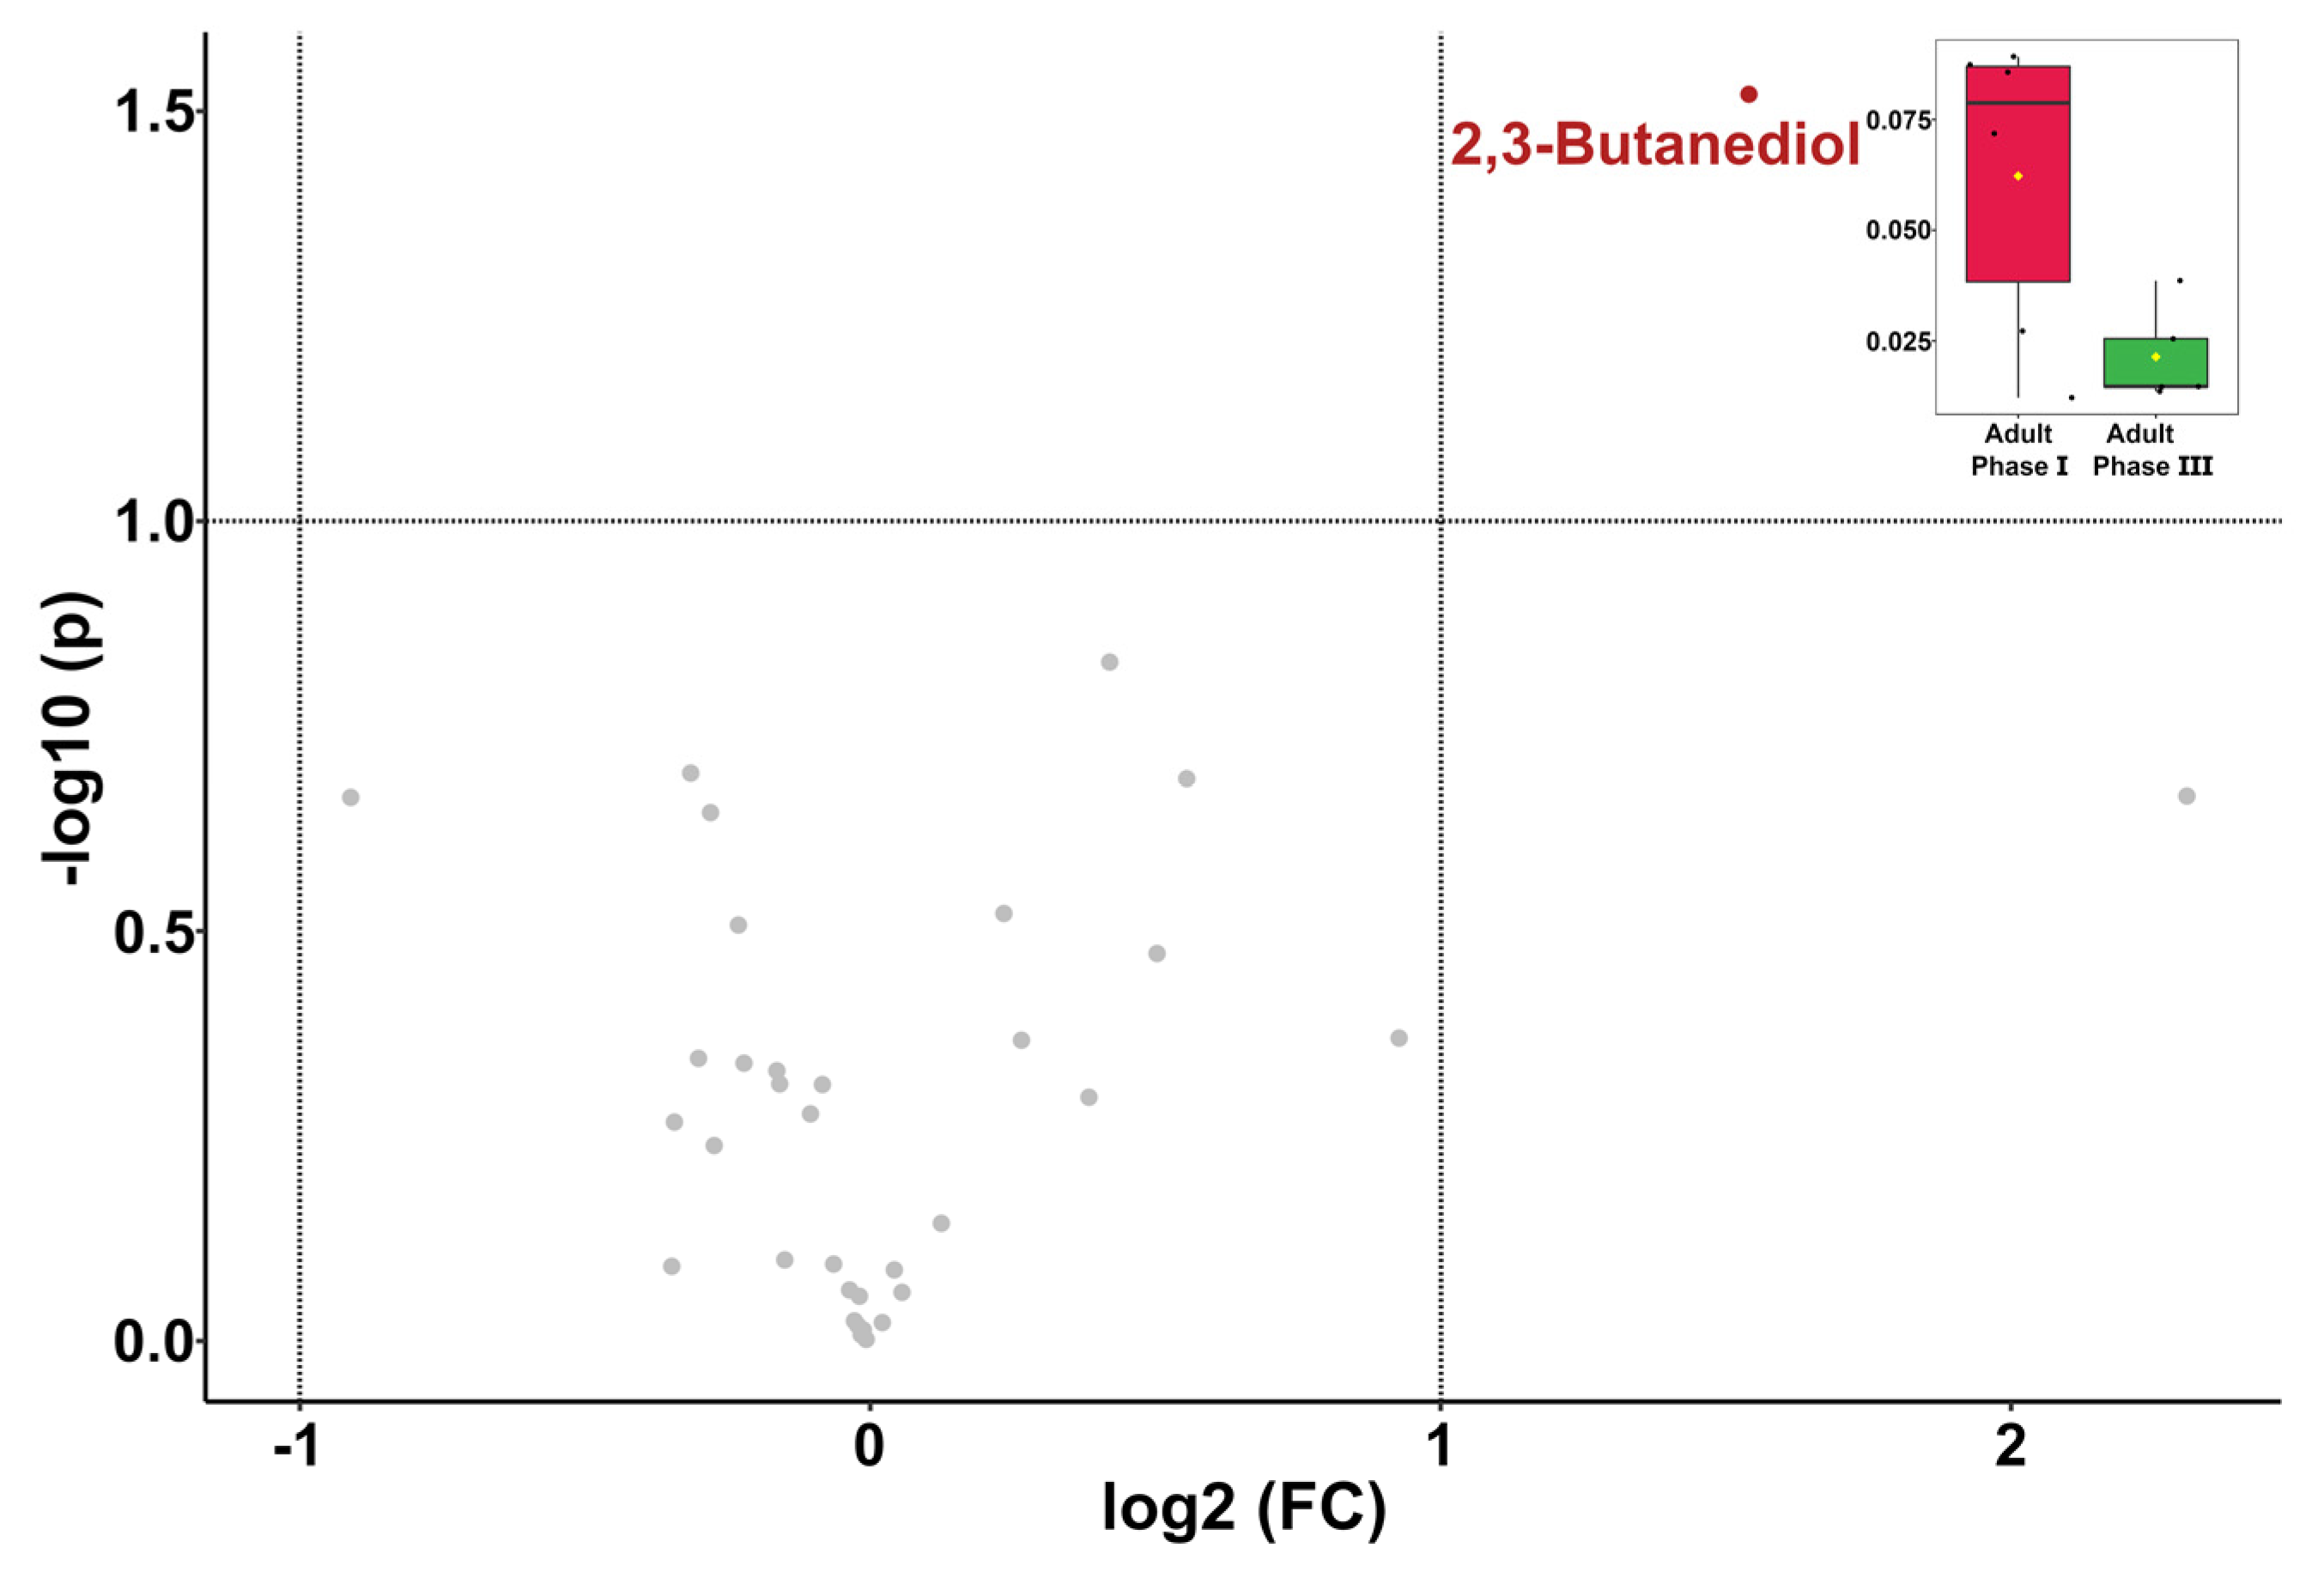
3.3. Metabolome’s Age-Related Features

To evaluate the overall molecular profile trends with age, a robust principal component analysis (rPCA) model (Figure 3) and a heatmap (Figure 4) were set up.
In terms of the rPCA model, the first component represented 76.2% of the variance, summarizing the peculiarities connected to age, with individuals pertaining to adult phase I and III appearing at the low and high PC scores, respectively, and adult phase II individuals at intermediate values. The loading plot of Figure 3B shows that samples from adult phase III were characterized by higher concentrations of ethanolamine, TMAO, 2,3-butanediol, aspartate, and creatinine, while samples from adult phase I showed higher concentrations of ethanol, tyrosine, glucose, citrate, betaine, and phenylalanine (Figure 3B). The common trends of ethanol, tyrosine, glucose, citrate, betaine, and phenylalanine can be best appreciated through a heatmap, as shown in Figure 4. The same applies to the common and opposite trends of ethanolamine, TMAO, 2,3-butanediol, aspartate, and creatinine.
A comparison between adult phase I and III individuals by a t-test highlighted a significant difference in 2,3-butanediol, as shown in the volcano plot in Figure 5.
In addition, we calculated Pearson’s correlation between the age and the concentration of each molecule we quantified. The result showed that a significant positive correlation existed only for 2,3-butanediol (r = 0.61 and p = 0.02).

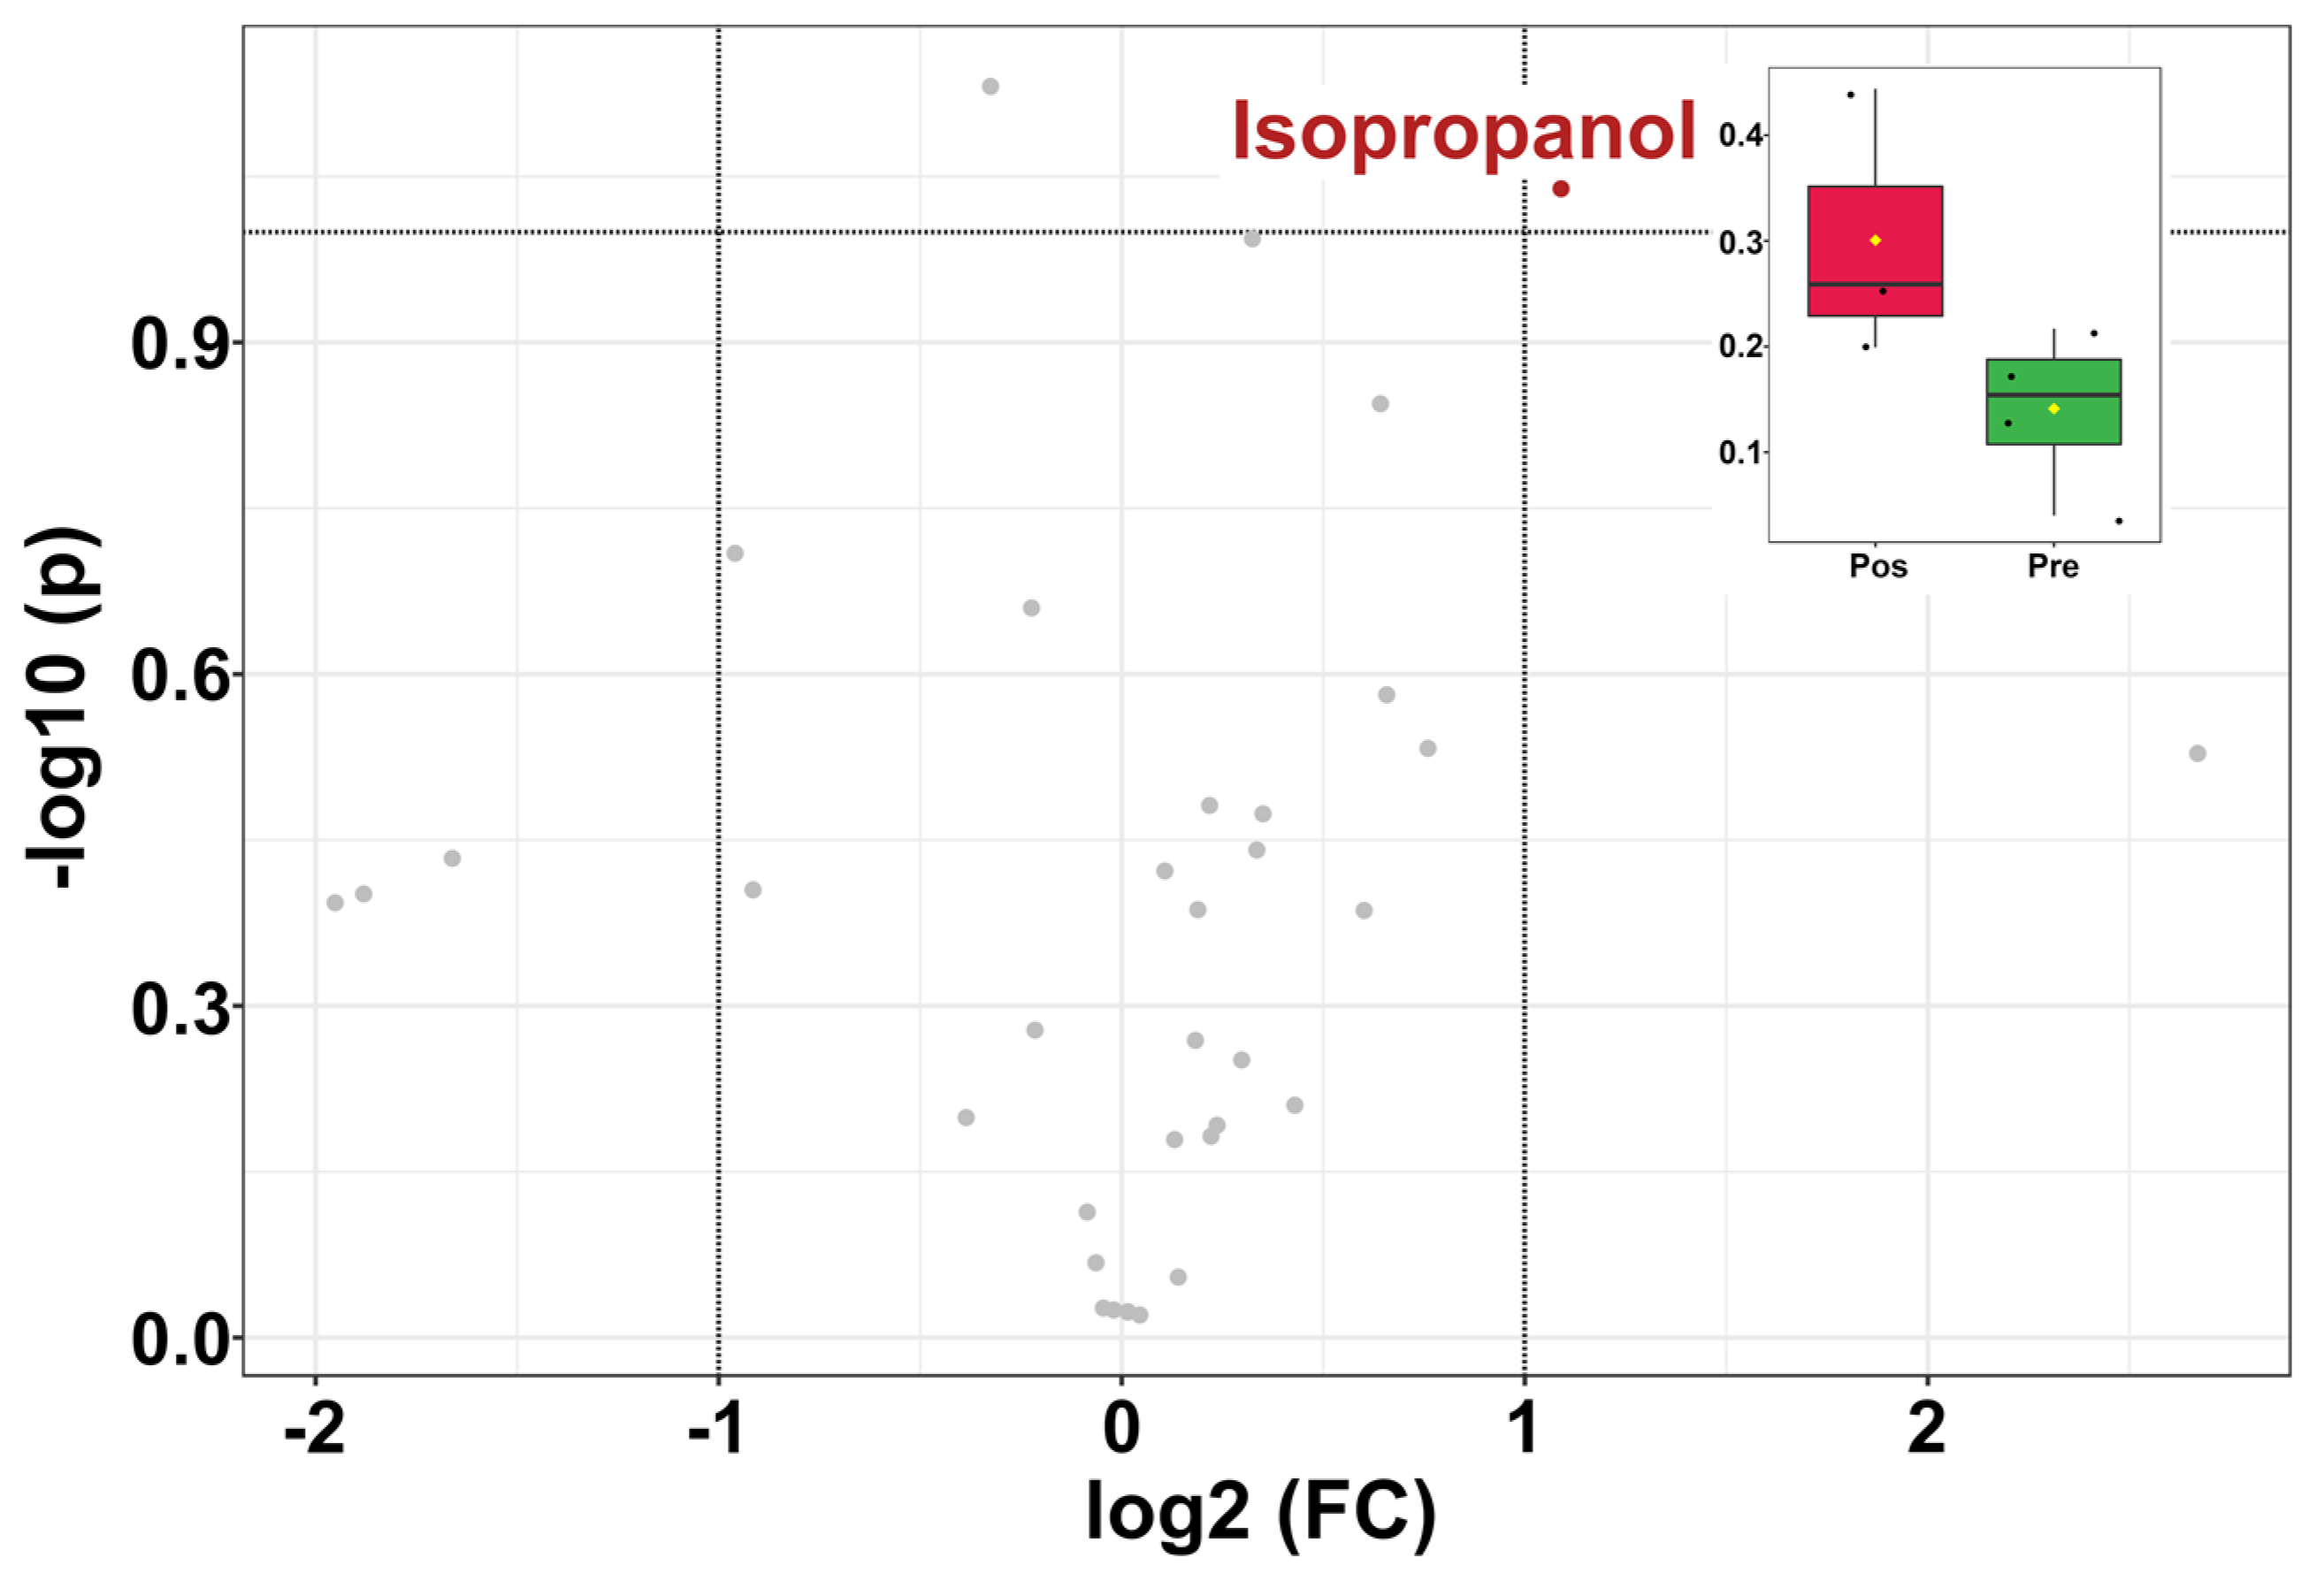
3.4. Giant Panda Seminal Plasma Metabolome Is Related to the Estrus Phases

In parallel with age, a univariate analysis (Figure 6) was set up to study the overall metabolome’s trends connected to estrus. A heatmap was also set up (Figure 7), to observe the molecules’ trend similarities.
As shown in Figure 6, one molecule, namely isopropanol, exhibited significantly higher levels post-estrus than pre-estrus. The heatmap allows us to appreciate that a list of molecules exhibited higher concentrations in the pre-estrus group, such as formate and galactarate. Other molecules, such as isopropanol and 1,3-dihydroxyacetone, were more concentrated in the post-estrus group.

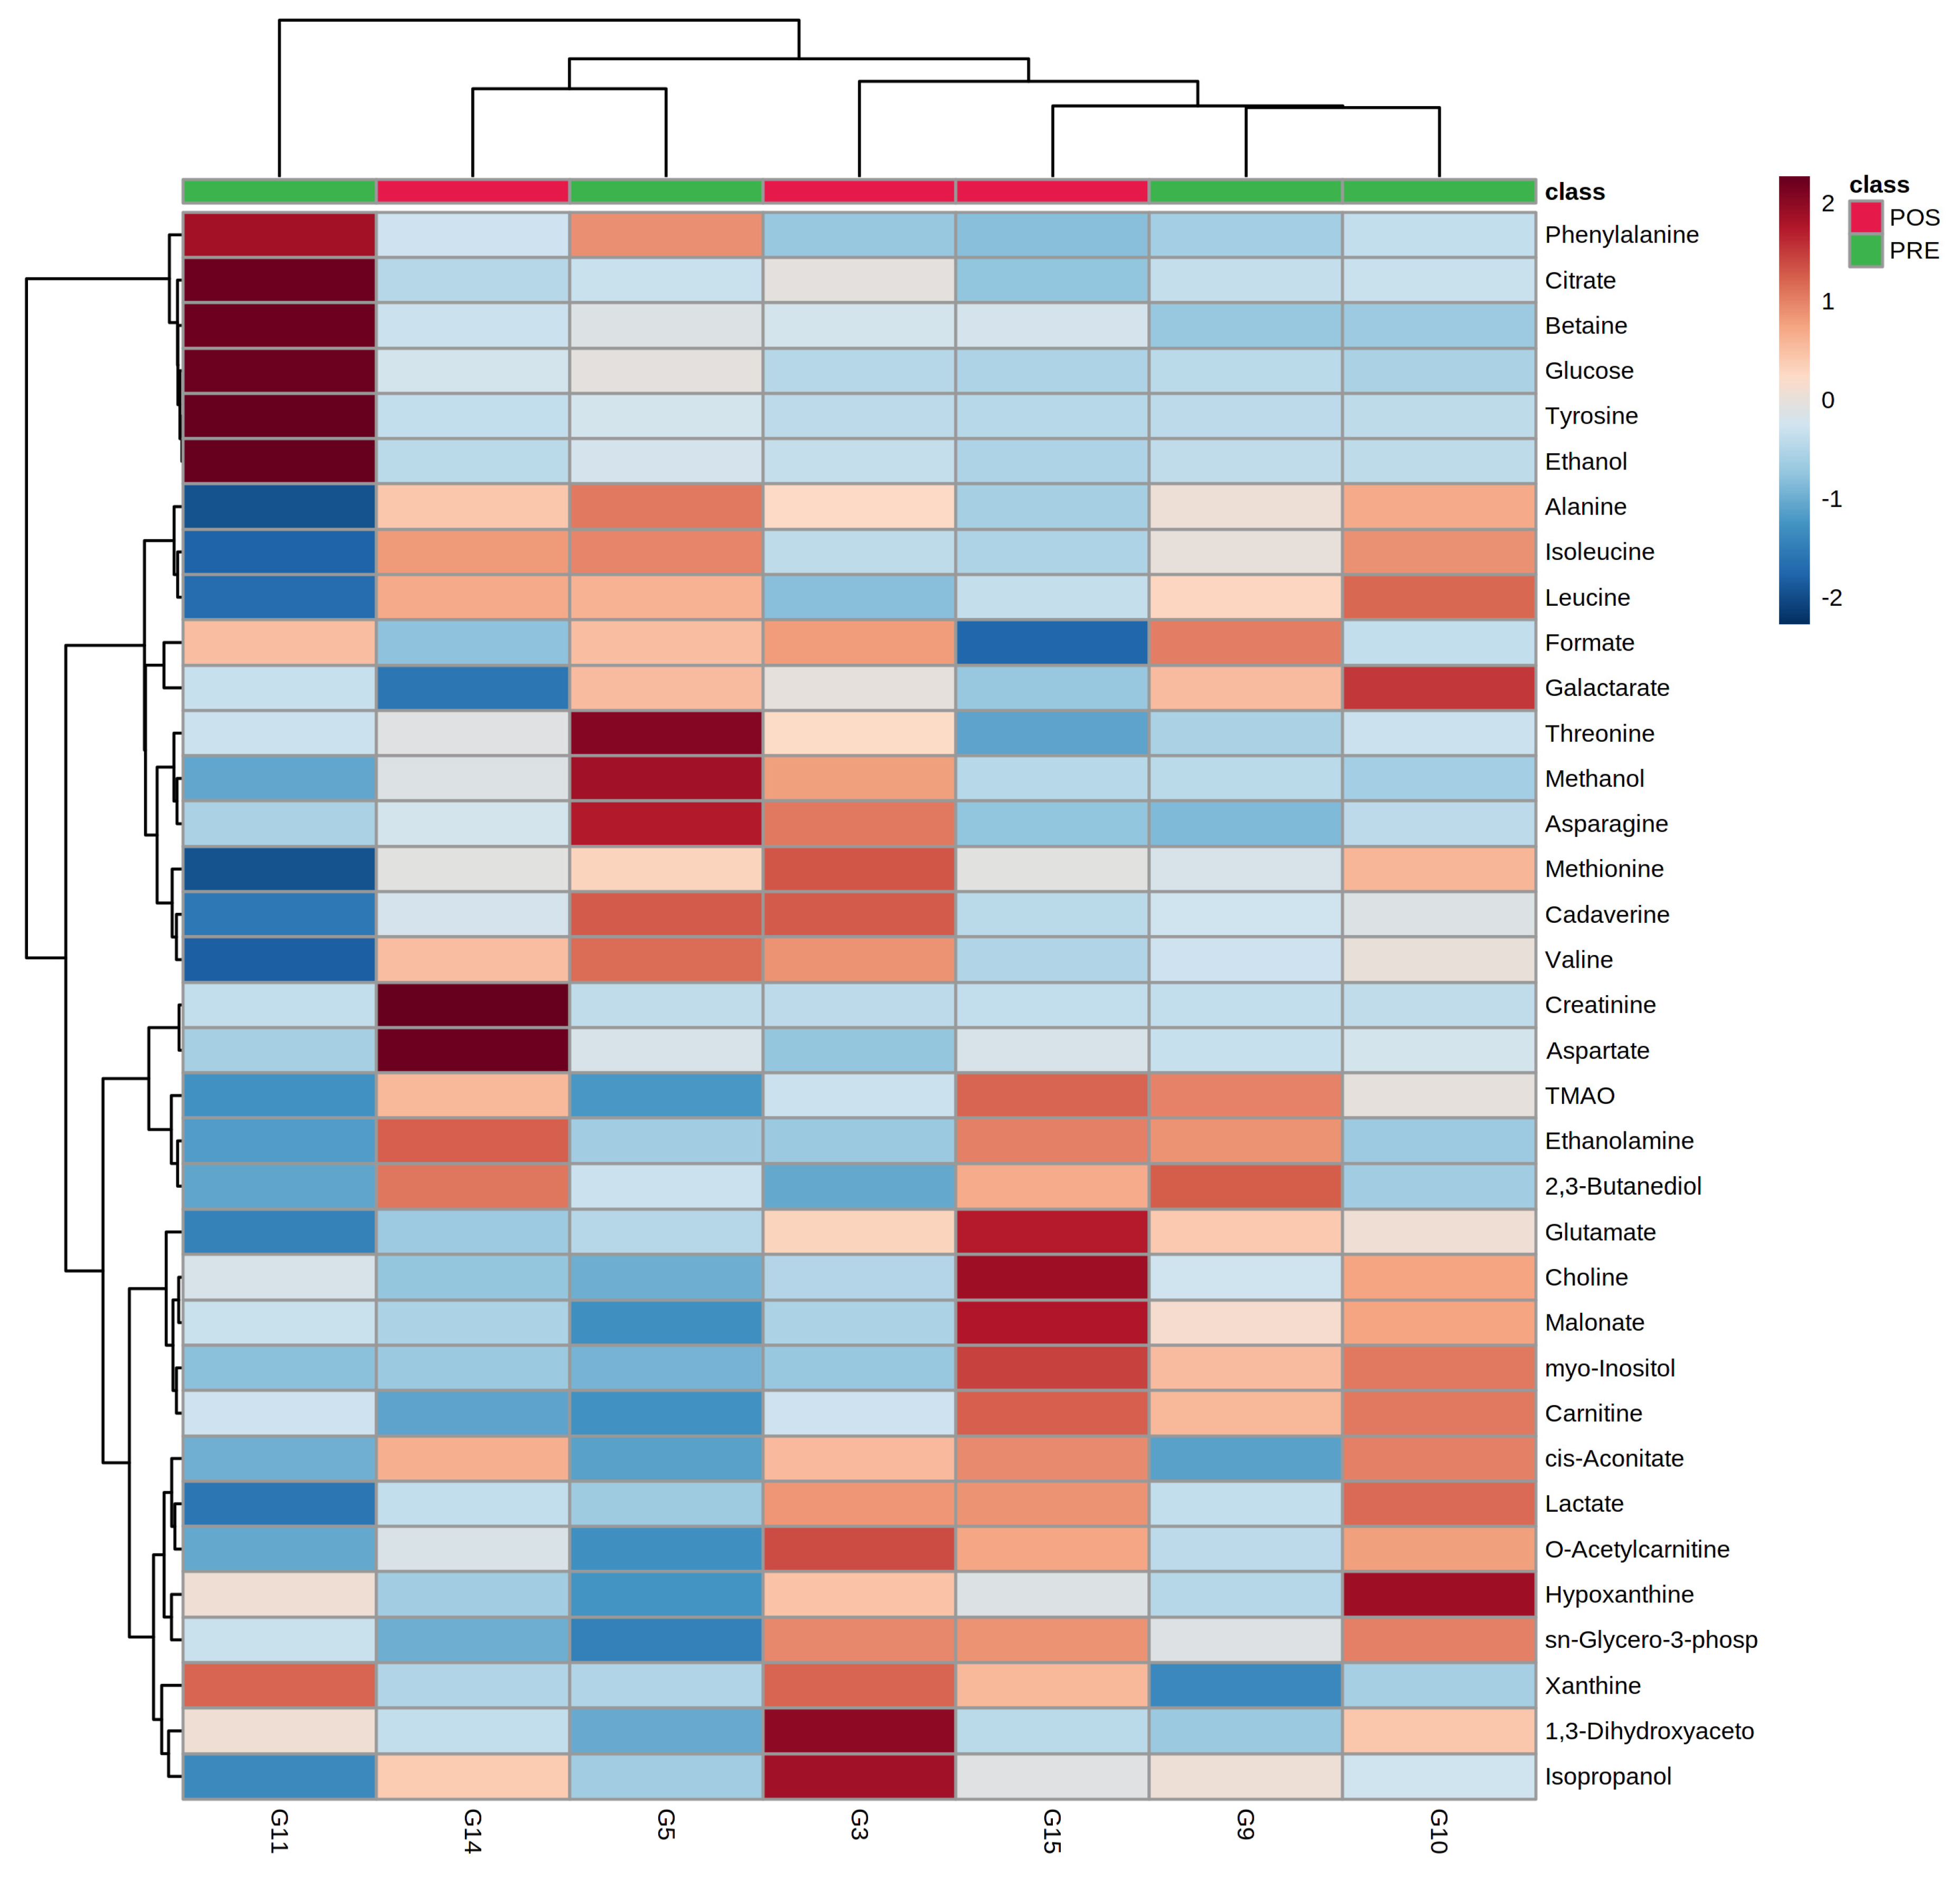
3.5. Giant Panda Seminal Plasma Metabolome Is Affected by Storage Time

In the current study, two molecules showed significant differences between the samples that underwent short and a long storage, namely, galactarate (long-storage: 4.72 × 10⁻¹ ± 5.86 × 10⁻² mmol/L, short-storage: 3.89 × 10⁻¹ ± 5.03 × 10⁻² mmol/L, p = 0.01) and ethanolamine (long-storage: 1.66 × 10⁻¹ ± 6.33 × 10⁻² mmol/L, short-storage: 2.69 × 10⁻¹ ± 9.60 × 10⁻² mmol/L, p = 0.04).

4. Discussion

Seminal plasma is a complex biological fluid that is mainly characterized by inorganic ions, low-molecular-weight organic compounds, peptides, and hormones [33]. This organic and inorganic complex mixture is secreted from different endocrine glands and is the functional reflective index of the corresponding glands [34]. In addition, the metabolites present in seminal plasma play several roles related to sperm function, such as energy production, motility, protection, pH control, and the regulation of metabolic activity [35]. To the best of our knowledge, this is the first attempt to acquire metabolomic data from giant panda seminal plasma. A total of 35 molecules were unequivocally quantified, a number much higher than previously obtained in similar studies on other animals [36] or humans [37]. With the kind help of the China Conservation and Research Center for the Giant Panda, we had the opportunity to investigate the effects of age and estrus on giant panda seminal plasma. Age has been widely regarded to be a key factor for semen or/and seminal plasma perturbations. For instance, Chen et al. found, in humans, that semen volume, spermatozoa concentration, total spermatozoa count, motility, total motile sperm, and morphology significantly decreased with age [38]. In the current study, an rPCA model based on the entire set of molecules quantified highlighted distinct trends connected to age. A comparison between age adult phase I and III and Pearson’s correlation showed a specific effect of age on the concentration of 2,3-butanediol. The presence of this molecule in mammalian seminal fluid was recently confirmed by some of the authors of the present work [39] while studying horse’s seminal plasma. It is interesting to notice that 2,3-butanediol is a catabolite of pyruvate, which could not be quantified in the present work due to the superimposition of its signal with some from glutamate. [40] Pyruvate is considered to be one of the major sources of energy for spermatozoa [41]. Higher concentrations of 2,3-butanediol in older individuals could therefore indicate a lower concentration of pyruvate, with detrimental effects on sperm quality. On the other hand, in light of the cryogenic storage practice of semen, it is worth noticing the potential protective role of this molecule, as shown by Jeyendran et al. on bovine spermatozoa [39].
Among the molecules showing trends connected to an animal’s age or estrus phase, aspartate has been demonstrated, with particular reference to its D enantiomer, to have an impact on a number of key parameters determining sperm quality [42,43,44]. 1H-NMR with water as a solvent cannot separately quantify the D and L enantiomers. However, Macchia et al. noticed that administering rabbits with increasing doses of DL-aspartate caused an increase in the D-aspartate concentration, while the concentration of L-aspartate did not vary [45]. It is therefore tempting to speculate that the higher concentration of aspartate we found in younger individuals witnessed a higher concentration of its D enantiomer with its consequent positive effects, which include increased sperm motility and concentration.
One of the main sugars in the seminal plasma is glucose, which is essential for ATP production and the motility of the spermatozoa [46]. No significant correlation has been found between glucose concentration and fertility in bulls [47]. This finding was confirmed by Cevik et al., even though a significantly higher level of glucose was found in normozoospermic bulls than in oligoasthenozoospermic bulls [48]. Gupta et al. revealed that the concentration of phenylalanine in the seminal plasma of humans can be used as a biomarker to determine infertility [33]. Engel et al. found that the concentrations of phenylalanine in seminal plasma were positively correlated with the volume of the ejaculate, reaching statistical significance. In addition, high creatinine levels were significantly positively correlated with the amount of immotile sperm [49]. This finding agrees with an NMR-based study that showed increased creatinine levels in the seminal plasma of patients with asthenozoospermia [37]. Phenylalanine is an essential aromatic amino acid. Once in the body, most of the phenylalanine is usually converted to tyrosine, which in turn is degraded to levodopa and then to dopamine [50]. Creatinine, a degradation product of creatine, is one of the most abundant biogenic amines in blood serum [23] and is cleared via the kidneys [51]. In the present context, it is worth mentioning that there are reports of elevated creatine kinase activity in subfertile patients [52,53]. Citrate is the main anion of seminal plasma, where it chelates calcium ions and limits sperm capacitation and spontaneous acrosome reactions [54]. Citrate and acid phosphatase can be considered to be markers for prostate activity [55]. Kumar et al. found that high-fertility bulls exhibited low levels of citrate [56]. Such findings are consistent with similar studies in infertile men [57].
The effects of storage time on the metabolome of biomaterials (i.e., urine and feces) have been evaluated in a limited number of papers [58,59], none of which focused on potential changes in giant panda seminal plasma with time. At present, both fresh and thawed frozen giant panda semen samples are successfully employed for AI. A real-life example is represented by the giant panda Mei Xiang, who was inseminated with frozen semen collected 14 years before and recently gave birth to Bao Bao (https://nationalzoo.si.edu/animals/news/how-artificial-insemination-helps-boost-panda populations, accessed on 15 March 2022). Our preliminary data indicate that there are indeed metabolomic changes connected to storage. Whether these modifications would affect the success rate of AI still needs further investigations.
The rarity of giant pandas has limited the availability of samples for the present investigation. To adapt to this limitation, among the various multivariate methods described to highlight the main trends underlying the data, we selected rPCA, an unsupervised method that is not prone to overfitting. This method allowed us to exclude the presence of potential outliers.

5. Conclusions

To the best of our knowledge, this is the first attempt to acquire metabolomic data of giant panda seminal plasma by means of 1H-NMR. We were able to characterize 35 molecules in giant panda seminal plasma and to illustrate, with the limits represented by a low number of samples, the effects of age, estrus stages, and storage time on the seminal plasma metabolome, with particular reference to 2,3-butandiol, isopropanol, galactarate, and ethanolamine. For some of them, such as 2,3-butandiol and aspartate, we were able to suggest direct links with sperm quality, thus offering possibilities for novel approaches to giant panda artificial insemination.

Author Contributions

Conceptualization, L.L., L.Z. and C.Z.; methodology, C.Z., L.L. and L.Z.; formal analysis, C.Z., L.L. and L.J.; investigation, C.Z.; resources, Y.H. and H.Z.; data curation, Y.H.; writing—original draft preparation, C.Z. and L.L.; writing—review and editing, C.Z., L.J., B.L., L.D., Q.Z., X.L., H.Z., Y.H., C.L., L.Z. and L.L.; funding acquisition, L.Z. All authors have read and agreed to the published version of the manuscript.

Funding

This project was funded by the Open Project of Key Laboratory of SFGA on Conservation Biology of Rare Animals in the Giant Panda National Park (CCRCGP, KLSFGAGP2020.003), the Fundamental Research Funds for the Central Universities, Southwest Minzu University (2020NTD04), and the High-level Talent Introduction Programs of Southwest Minzu University (16011211062).

Institutional Review Board Statement

Ethical review and approval were waived for this study as the samples were collected regardless of the purpose of this study during the procedures for artificial insemination and cryogenic storage that are routinely conducted at the China Conservation and Research Center for the Giant Panda.

Informed Consent Statement

Not applicable.

Data Availability Statement

The data presented in this study are available within the article.

Conflicts of Interest

The authors declare no conflict of interest.

References

  1. Swaisgood, R.; Wang, D.; Wei, F. The IUCN Red List of Threatened Species. 2016. Available online: https://www.iucnredlist.org/species/712/121745669 (accessed on 10 March 2022).
  2. Feng, W.H.; Zhao, J.; Fujihara, N. Physiological Characteristics of Electro-Ejaculated Giant Panda (Ailuropoda melanoleuca) Semen. Jpn. J. Zoo Wildl. Med. 1997, 2, 107–112. [Google Scholar] [CrossRef] [Green Version]
  3. Tsutsui, T.; Hori, T.; Nakashige, T.; Narushima, E.; Hara, T.; Akikawa, T.; Nose, N.; Saito, K.; Shichiri, S.; Hashizaki, F.; et al. Semen Quality in a Giant Panda (Ailuropoda melanoleuca) in Relation to Estrus of a Nearby Resident Female Panda. Theriogenology 2006, 66, 1803–1806. [Google Scholar] [CrossRef] [PubMed]
  4. Weixin, L. A Note on the Artificial Insemination of Giant Panda. Chin. J. Anim. Vet. Sci. 1981, 2, 73–76. [Google Scholar]
  5. Huang, Y.; Wang, P.; Zhang, G.; Zhang, H.; Li, D.; Du, J.; Wei, R.; Tang, C.; Spindler, R.E.; Wildt, D.E. Use of Artificial Insemination to Enhance Propagation of Giant Pandas at the Wolong Breeding Center. In Proceedings of the International Symposium on Assisted Reproductive Technologies (ART) for Conservation and Genetic Management of Wildlife, Omaha, NE, USA, 27–28 April 2002. [Google Scholar]
  6. Seager, S.W.J. The Breeding of Captive Wild Species by Artificial Methods. Zoo Biol. 1983, 2, 235–239. [Google Scholar] [CrossRef]
  7. Platz, C.C.; Wildt, D.E.; Howard, J.G.; Bush, M. Electroejaculation and Semen Analysis and Freezing in the Giant Panda (Ailuropoda melanoleuca). J. Reprod. Fertil. 1983, 67, 9–12. [Google Scholar] [CrossRef]
  8. Chen, M.; Zhang, G.; Mainka, S.A. Semen Evaluation of Giant Pandas (Ailuropoda melanoleuca) at the Wolong Reserve. Zoo Biol. 1994, 13, 83–86. [Google Scholar] [CrossRef]
  9. Menezes, E.B.; Velho, A.L.C.; Santos, F.; Dinh, T.; Kaya, A.; Topper, E.; Moura, A.A.; Memili, E. Uncovering Sperm Metabolome to Discover Biomarkers for Bull Fertility. BMC Genom. 2019, 20, 714. [Google Scholar] [CrossRef]
  10. Cazaux Velho, A.L.; Menezes, E.; Dinh, T.; Kaya, A.; Topper, E.; Moura, A.A.; Memili, E. Metabolomic Markers of Fertility in Bull Seminal Plasma. PLoS ONE 2018, 13, e0195279. [Google Scholar] [CrossRef]
  11. Frederiksen, H.; Jørgensen, N.; Andersson, A.M. Parabens in Urine, Serum and Seminal Plasma from Healthy Danish Men Determined by Liquid Chromatography-Tandem Mass Spectrometry (LC-MS/MS). J. Expo. Sci. Environ. Epidemiol. 2011, 21, 262–271. [Google Scholar] [CrossRef] [Green Version]
  12. Jayaraman, V.; Ghosh, S.; Sengupta, A.; Srivastava, S.; Sonawat, H.M.; Narayan, P.K. Identification of Biochemical Differences between Different Forms of Male Infertility by Nuclear Magnetic Resonance (NMR) Spectroscopy. J. Assist. Reprod. Genet. 2014, 31, 1195–1204. [Google Scholar] [CrossRef] [Green Version]
  13. Mumcu, A.; Karaer, A.; Dogan, B.; Tuncay, G. Metabolomics Analysis of Seminal Plasma in Patients with Idiopathic Oligoasthenoteratozoospermia Using High-Resolution NMR Spectroscopy. Andrology 2020, 8, 450–456. [Google Scholar] [CrossRef] [PubMed]
  14. Du Fossé, N.A.; Lashley, E.E.L.O.; van Beelen, E.; Meuleman, T.; le Cessie, S.; van Lith, J.M.M.; Eikmans, M.; van der Hoorn, M.L.P. Identification of Distinct Seminal Plasma Cytokine Profiles Associated with Male Age and Lifestyle Characteristics in Unexplained Recurrent Pregnancy Loss. J. Reprod. Immunol. 2021, 147, 103349. [Google Scholar] [CrossRef] [PubMed]
  15. Vince, S.; Žura Žaja, I.; Samardžija, M.; Majić Balić, I.; Vilić, M.; Duričić, D.; Valpotić, H.; Marković, F.; Milinković-Tur, S. Age-Related Differences of Semen Quality, Seminal Plasma, and Spermatozoa Antioxidative and Oxidative Stress Variables in Bulls during Cold and Warm Periods of the Year. Animal 2018, 12, 559–568. [Google Scholar] [CrossRef] [Green Version]
  16. El Sisy, G.A.; Abo El-Maaty, A.M.; Rawash, Z.M. Comparative Blood and Seminal Plasma Oxidant/Antioxidant Status of Arab Stallions with Different Ages and Their Relation to Semen Quality. Asian Pac. J. Reprod. 2016, 5, 428–433. [Google Scholar] [CrossRef]
  17. Souza, C.E.A.; Araújo, A.A.; Oliveira, J.T.A.; Lima Souza, A.C.; Neiva, J.N.M.; Moura, A.A. Reproductive Development of Santa Inês Rams during the First Year of Life: Body and Testis Growth, Testosterone Concentrations, Sperm Parameters, Age at Puberty and Seminal Plasma Proteins. Reprod. Domest. Anim. 2010, 45, 644–653. [Google Scholar] [CrossRef]
  18. Abou-Ahmed, M.M.; El-Belely, M.S.; Ismail, S.T.; El-Baghdady, Y.R.M.; Hemeida, N.A. Influence of Age and Season on Certain Biochemical Constituents of Seminal Plasma of Arabian Horses. Anim. Reprod. Sci. 1993, 32, 237–244. [Google Scholar] [CrossRef]
  19. Aitken-Palmer, C.; Hou, R.; Burrell, C.; Zhang, Z.; Wang, C.; Spindler, R.; Wildt, D.E.; Ottinger, M.A.; Howard, J.G. Protracted Reproductive Seasonality in the Male Giant Panda (Ailuropoda melanoleuca) Reflected by Patterns in Androgen Profiles, Ejaculate Characteristics, and Selected Behaviors. Biol. Reprod. 2012, 86, 195. [Google Scholar] [CrossRef]
  20. Kareskoski, M.; Katila, T. Components of Stallion Seminal Plasma and the Effects of Seminal Plasma on Sperm Longevity. Anim. Reprod. Sci. 2008, 107, 249–256. [Google Scholar] [CrossRef]
  21. Pavaneli, A.P.P.; Recuero, S.; Chaves, B.R.; Garcia-Bonavila, E.; Llavanera, M.; Pinart, E.; Bonet, S.; de Andrade, A.F.C.; Yeste, M. The Presence of Seminal Plasma during Liquid Storage of Pig Spermatozoa at 17 °C Modulates Their Ability to Elicit In Vitro Capacitation and Trigger Acrosomal Exocytosis. Int. J. Mol. Sci. 2020, 21, 4520. [Google Scholar] [CrossRef]
  22. Laghi, L.; Picone, G.; Capozzi, F. Nuclear Magnetic Resonance for Foodomics beyond Food Analysis. TrAC Trends Anal. Chem. 2014, 59, 93–102. [Google Scholar] [CrossRef]
  23. Zhu, C.; Li, C.; Wang, Y.; Laghi, L. Characterization of Yak Common Biofluids Metabolome by Means of Proton Nuclear Magnetic Resonance Spectroscopy. Metabolites 2019, 9, 41. [Google Scholar] [CrossRef] [PubMed] [Green Version]
  24. Zhu, C.; Faillace, V.; Laus, F.; Bazzano, M.; Laghi, L. Characterization of Trotter Horses Urine Metabolome by Means of Proton Nuclear Magnetic Resonance Spectroscopy. Metabolomics 2018, 14, 106. [Google Scholar] [CrossRef]
  25. R Development Core Team. Computational Many-Particle Physics; Springer: Berlin/Heidelberg, Germany, 2007; Volume 1, ISBN 3900051070. [Google Scholar]
  26. Kneen, M.A.; Annegarn, H.J. Algorithm for Fitting XRF, SEM and PIXE X-Ray Spectra Backgrounds. Nucl. Instrum. Methods Phys. Res. Sect. B Beam Interact. Mater. At. 1996, 109–110, 209–213. [Google Scholar] [CrossRef]
  27. Liland, K.H.; Almøy, T.; Mevik, B.H. Optimal Choice of Baseline Correction for Multivariate Calibration of Spectra. Appl. Spectrosc. 2010, 64, 1007–1016. [Google Scholar] [CrossRef] [PubMed]
  28. Dieterle, F.; Ross, A.; Schlotterbeck, G.; Senn, H. Probabilistic Quotient Normalization as Robust Method to Account for Dilution of Complex Biological Mixtures. Application in 1H NMR Metabonomics. Anal. Chem. 2006, 78, 4281–4290. [Google Scholar] [CrossRef]
  29. Box, G.E.P.; Cox, D.R. An Analysis of Transformations. J. R. Stat. Soc. Ser. B Methodol. 1964, 26, 211–243. [Google Scholar] [CrossRef]
  30. Hubert, M.; Rousseeuw, P.J.; Vanden Branden, K. ROBPCA: A New Approach to Robust Principal Component Analysis. Technometrics 2005, 47, 64–79. [Google Scholar] [CrossRef]
  31. Zhu, C.; Laghi, L.; Zhang, Z.; He, Y.; Wu, D.; Zhang, H.; Huang, Y.; Li, C.; Zou, L. First Steps toward the Giant Panda Metabolome Database: Untargeted Metabolomics of Feces, Urine, Serum, and Saliva by 1H NMR. J. Proteome Res. 2020, 19, 1052–1059. [Google Scholar] [CrossRef]
  32. Wei, F.; Hu, J. Studies on the Reproduction of Giant Panda in Wolong Natural Reserve. Acta Theriol. Sin. 1994, 14, 243–248. [Google Scholar]
  33. Gupta, A.; Mahdi, A.A.; Ahmad, M.K.; Shukla, K.K.; Jaiswer, S.P.; Shankhwar, S.N. 1H NMR Spectroscopic Studies on Human Seminal Plasma: A Probative Discriminant Function Analysis Classification Model. J. Pharm. Biomed. Anal. 2011, 54, 106–113. [Google Scholar] [CrossRef]
  34. Meeker, J.D.; Godfrey-Bailey, L.; Hauser, R. Relationships between Serum Hormone Levels and Semen Quality among Men from an Infertility Clinic. J. Androl. 2007, 28, 397–406. [Google Scholar] [CrossRef] [PubMed] [Green Version]
  35. Bieniek, J.M.; Drabovich, A.P.; Lo, K.C. Seminal Biomarkers for the Evaluation of Male Infertility. Asian J. Androl. 2016, 18, 426–433. [Google Scholar] [CrossRef] [PubMed]
  36. Hung, P.-H.; Froenicke, L.; Lin, C.Y.; Lyons, L.A.; Miller, M.G.; Pinkerton, K.E.; VandeVoort, C.A. Effects of Environmental Tobacco Smoke In Vivo on Rhesus Monkey Semen Quality, Sperm Function, and Sperm Metabolism. Reprod. Toxicol. 2009, 27, 140–148. [Google Scholar] [CrossRef] [PubMed]
  37. Zhang, X.; Diao, R.; Zhu, X.; Li, Z.; Cai, Z. Metabolic Characterization of Asthenozoospermia Using Nontargeted Seminal Plasma Metabolomics. Clin. Chim. Acta 2015, 450, 254–261. [Google Scholar] [CrossRef]
  38. Chen, Z.; Toth, T.; Godfrey-Bailey, L.; Mercedat, N.; Schiff, I.; Hauser, R. Seasonal Variation and Age-Related Changes in Human Semen Parameters. J. Androl. 2003, 24, 226–231. [Google Scholar] [CrossRef] [Green Version]
  39. Jeyendran, R.S.; Graham, E.F. An Evaluation of Cryoprotective Compounds on Bovine Spermatozoa. Cryobiology 1980, 17, 458–464. [Google Scholar] [CrossRef]
  40. Bazzano, M.; Laghi, L.; Zhu, C.; di Giambattista, A.; Tesei, B.; Laus, F. Metabolomic Analysis of Seminal Plasma in Stallions Belonging to Two Different Horse Breeds. J. Equine Vet. Sci. 2020, 89, 103038. [Google Scholar] [CrossRef]
  41. Darr, C.R.; Varner, D.D.; Teague, S.; Cortopassi, G.A.; Datta, S.; Meyers, S.A. Lactate and Pyruvate Are Major Sources of Energy for Stallion Sperm with Dose Effects on Mitochondrial Function, Motility, and ROS Production. Biol. Reprod. 2016, 95, 34. [Google Scholar] [CrossRef]
  42. D’Aniello, G.; Ronsini, S.; Notari, T.; Grieco, N.; Infante, V.; D’Angel, N.; Mascia, F.; di Fiore, M.M.; Fisher, G.; D’Aniello, A. D-Aspartate, a Key Element for the Improvement of Sperm Quality. Adv. Sex. Med. 2012, 2, 45–53. [Google Scholar] [CrossRef] [Green Version]
  43. D’Aniello, G.; Ronsini, S.; Guida, F.; Spinelli, P.; D’Aniello, A. Occurrence of D-Aspartic Acid in Human Seminal Plasma and Spermatozoa: Possible Role in Reproduction. Fertil. Steril. 2005, 84, 1444–1449. [Google Scholar] [CrossRef]
  44. D’Aniello, A.; di Cosmo, A.; di Cristo, C.; Annunziato, L.; Petrucelli, L.; Fisher, G. Involvement of D-Aspartic Acid in the Synthesis of Testosterone in Rat Testes. Life Sci. 1996, 59, 97–104. [Google Scholar] [CrossRef]
  45. Macchia, G.; Topo, E.; Mangano, N.; D’Aniello, E.; Boni, R. Dl-Aspartic Acid Administration Improves Semen Quality in Rabbit Bucks. Anim. Reprod. Sci. 2010, 118, 337–343. [Google Scholar] [CrossRef] [PubMed]
  46. Martikainen, P.; Sannikka, E.; Suominen, J.; Santti, R. Glucose Content as a Parameter of Semen Quality. Arch. Androl. 1980, 5, 337–343. [Google Scholar] [CrossRef] [PubMed] [Green Version]
  47. Assumpção, T.I.; Torres, R.A.A.; Sousa, M.V.; Ricart, C.A.O. Correlation between Fertility and Levels of Protein, Sugar and Free Amino Acids in Seminal Plasma of Nelore Bulls. Arq. Bras. Med. Vet. Zootec. 2005, 57, 55–61. [Google Scholar] [CrossRef]
  48. Çevik, M.; Tuncer, P.B.; Taşdemir, U.; Özgürtaş, T. Comparison of Spermatological Characteristics and Biochemical Seminal Plasma Parameters of Normozoospermic and Oligoasthenozoospermic Bulls of Two Breeds. Turk. J. Vet. Anim. Sci. 2007, 31, 381–387. [Google Scholar]
  49. Engel, K.M.; Baumann, S.; Rolle-Kampczyk, U.; Schiller, J.; von Bergen, M.; Grunewald, S. Metabolomic Profiling Reveals Correlations between Spermiogram Parameters and the Metabolites Present in Human Spermatozoa and Seminal Plasma. PLoS ONE 2019, 14, e0211679. [Google Scholar] [CrossRef] [Green Version]
  50. Barazzoni, R.; Zanetti, M.; Vettore, M.; Tessari, P. Relationships between Phenylalanine Hydroxylation and Plasma Aromatic Amino Acid Concentrations in Humans. Metab. Clin. Exp. 1998, 47, 669–674. [Google Scholar] [CrossRef]
  51. Edwards, K.D.G.; Whyte, H.M. Plasma Creatinine Level and Creatinine Clearance as Tests of Renal Function. Australas. Ann. Med. 1959, 8, 218–224. [Google Scholar] [CrossRef]
  52. Sidhu, R.S.; Sharma, R.K.; Agarwal, A. Relationship between Creatine Kinase Activity and Semen Characteristics in Subfertile Men. Int. J. Fertil. Women’s Med. 1998, 43, 192–197. [Google Scholar]
  53. Hallak, J.; Sharma, R.K.; Pasqualotto, F.F.; Ranganathan, P.; Thomas, A.J.; Agarwal, A. Creatine Kinase as an Indicator of Sperm Quality and Maturity in Men with Oligospermia. Urology 2001, 58, 446–451. [Google Scholar] [CrossRef]
  54. Ford, G.C.; Harrison, P.M.; Rice, D.W.; Smith, J.M.; Treffry, A.; White, J.L.; Yariv, J. Ferritin: Design and Formation of an Iron-Storage Molecule. Philos. Trans. R. Soc. B Biol. Sci. 1984, 304, 551–565. [Google Scholar] [CrossRef]
  55. Hamamah, S.; Seguin, F.; Bujan, L.; Barthelemy, C.; Mieusset, R.; Lansac, J. Quantification by Magnetic Resonance Spectroscopy of Metabolites in Seminal Plasma Able to Differentiate Different Forms of Azoospermia. Hum. Reprod. 1998, 13, 132–135. [Google Scholar] [CrossRef] [PubMed] [Green Version]
  56. Kumar, A.; Kroetsch, T.; Blondin, P.; Anzar, M. Fertility-Associated Metabolites in Bull Seminal Plasma and Blood Serum: 1H Nuclear Magnetic Resonance Analysis. Mol. Reprod. Dev. 2015, 82, 123–131. [Google Scholar] [CrossRef] [PubMed]
  57. Cooper, T.G.; Jockenhövel, F.; Nieschlag, E. Variations in Semen Parameters from Fathers. Hum. Reprod. 1991, 6, 859–866. [Google Scholar] [CrossRef]
  58. Schreier, C.; Kremer, W.; Huber, F.; Neumann, S.; Pagel, P.; Lienemann, K.; Pestel, S. Reproducibility of NMR Analysis of Urine Samples: Impact of Sample Preparation, Storage Conditions, and Animal Health Status. BioMed Res. Int. 2013, 2013, 878374. [Google Scholar] [CrossRef]
  59. O’Sullivan, V.; Madrid-Gambin, F.; Alegra, T.; Gibbons, H.; Brennan, L. Impact of Sample Storage on the NMR Fecal Water Metabolome. ACS Omega 2018, 3, 16585–16590. [Google Scholar] [CrossRef] [Green Version]
Figure 1. 1H-NMR spectrum of giant panda seminal plasma, representative of those registered in the present work. The name of each molecule appears over the signal used for its quantification. To ease the reader’s visual inspection, for each portion, a spectrum with a convenient signal-to-noise ratio has been selected.
Animals 12 01536 g001
Figure 2. Relative abundances of the classes of molecules assigned in the giant panda seminal plasma metabolome. As a reference, the lines inside the bars highlight 10% steps. C = carbohydrates and derivatives, O = organic acids and derivatives, A = amino acids, peptides, and derivatives, N = nucleosides, nucleotides, and analogues, M = miscellaneous, as suggested in the reports by Zhu et al. [23].
Animals 12 01536 g002
Figure 3. rPCA model built on the metabolomic space constituted by the concentrations of the molecules quantified by 1H-NMR. In the scoreplot (A), samples from adult phase I, II, and III giant pandas are represented with squares, circles, and triangles, respectively. The wide empty circles represent the medians of the groups. The loading plot (B) reports correlations between the concentrations of each metabolite and its importance over PC 1. For readability, only molecules showing significant correlations have been reported.
Animals 12 01536 g003
Figure 4. Heatmap built on the metabolomic space constituted by the concentrations of the molecules quantified by 1H-NMR.
Animals 12 01536 g004
Figure 5. Volcano plot showing the differences in the concentrations of molecules in giant panda seminal plasma from adult phase I and III, studied by t-test. The boxplot in the right upper part shows 2,3-butanediol concentrations for each age group.
Animals 12 01536 g005
Figure 6. Volcano plot based on the comparisons between the concentrations of molecules in giant panda seminal plasma from the PRE and POST estrus groups. The right upper part shows the comparison for isopropanol.
Animals 12 01536 g006
Figure 7. Heatmap built on the metabolomic space constituted by the concentrations of the molecules quantified by 1H-NMR.
Animals 12 01536 g007
Table 1. Giant panda seminal plasma samples information.
Sample IDAge (Years)Sample Collection Date
G16April 2010
G26April 2013
G36May 2019
G46April 2015
G57March 2016
G68April 2013
G712April 2016
G810April 2019
G99March 2019
G1013February 2012
G1113February 2012
G1218April 2010
G1313April 2018
G1414June 2018
G1514June 2018
Table 2. Molecule concentrations (mmol/L, means ± standard deviations) in different groups of giant panda seminal plasma.
Amino Acids, Peptides, and DerivativesAdult Phase IAdult Phase IIAdult Phase III
Alanine8.17 × 10−1 ± 2.07 × 10−19.41 × 10−1 ± 7.01 × 10−27.29 × 10−1 ± 1.77 × 10⁻¹
Asparagine6.63 × 10−1 ± 1.99 × 10−15.95 × 10−1 ± 8.45 × 10−25.65 × 10−1 ± 9.66 × 10⁻²
Aspartate9.67 × 10−1 ± 2.89 × 10−11.10 ± 3.77 × 10−11.29 ± 3.77 × 10⁻¹
Carnitine13.1 ± 5.8212.9 ± 5.3612.8 ± 5.83
Creatinine1.04 × 10−1 ± 2.75 × 10−23.26 × 10−1 ± 4.27 × 10−15.16 × 10−1 ± 6.86 × 10⁻¹
Glutamate4.37 ± 8.04 × 10−15.23 ± 2.54 × 10−14.50 ± 9.85 × 10⁻¹
Isoleucine5.34 × 10−1 ± 2.15 × 10−16.19 × 10−1 ± 2.21 × 10−25.29 × 10−1 ± 1.64 × 10⁻¹
Leucine9.56 × 10−1 ± 4.05 × 10−11.22 ± 1.13 × 10−19.71 × 10−1 ± 3.15 × 10⁻¹
Methionine4.41 × 10−1 ± 1.17 × 10−14.35 × 10−1 ± 2.53 × 10−23.95 × 10−1 ± 9.33 × 10⁻²
O-Acetylcarnitine1.41 ± 7.18 × 10−19.65 × 10−1 ± 1.55 × 10−11.14 ± 3.82 × 10⁻¹
Phenylalanine7.62 × 10−1 ± 3.12 × 10−16.08 × 10−1 ± 1.45 × 10−16.32 × 10−1 ± 4.21 × 10⁻¹
Threonine9.37 × 10−1 ± 2.63 × 10−18.84 × 10−1 ± 2.26 × 10−17.53 × 10−1 ± 1.81 × 10⁻¹
Tyrosine2.17 ± 2.579.62 × 10−1 ± 1.88 × 10−12.16 ± 3.35
Valine9.09 × 10−1 ± 3.31 × 10−19.87 × 10−1 ± 9.85 × 10−27.80 × 10−1 ± 2.22 × 10⁻¹
Organic acids and derivatives
cis-Aconitate3.76 × 10−1 ± 8.03 × 10−23.52 × 10−1 ± 1.30 × 10−13.67 × 10−1 ± 9.55 × 10⁻²
Citrate17.0 ± 11.711.3 ± 3.8916.9 ± 15.1
Formate8.74 × 10−1 ± 8.09 × 10−29.67 × 10−1 ± 1.02 × 10−18.63 × 10−1 ± 1.50 × 10⁻¹
Galactarate4.45 × 10−1 ± 5.01 × 10−24.28 × 10−1 ± 4.33 × 10−24.14 × 10−1 ± 9.55 × 10⁻²
Lactate24.8 ± 6.0025.8 ± 5.4523.7 ± 7.77
Malonate7.43 × 10−1 ± 2.79 × 10−16.93 × 10−1 ± 2.46 × 10−18.11 × 10−1 ± 3.13 × 10⁻¹
Carbohydrates
Glucose6.95 ± 9.302.39 ± 2.90 × 10−15.47 ± 10.5
Nucleosides, nucleotides, and analogs
Hypoxanthine3.53 × 10−1 ± 7.11 × 10−23.42 × 10−1 ± 1.23 × 10−14.15 × 10−1 ± 1.08 × 10⁻¹
Xanthine1.33 × 10−1 ± 1.75 × 10−21.47 × 10−1 ± 4.38 × 10−21.26 × 10−1 ± 1.67 × 10⁻²
Miscellaneous
1,3-Dihydroxyacetone8.21 × 10−1 ± 4.47 × 10−16.49 × 10−1 ± 2.55 × 10−18.08 × 10−1 ± 2.97 × 10⁻¹
2,3-Butanediol2.14 × 10−2 ± 1.08 × 10−24.10 × 10−2 ± 3.42 × 10−26.22 × 10−2 ± 3.39 × 10⁻²
Betaine3.69 × 10−1 ± 1.66 × 10−12.49 × 10−1 ± 6.09 × 10−22.91 × 10−1 ± 2.28 × 10⁻¹
Cadaverine5.10 × 10−1 ± 1.51 × 10−15.23 × 10−1 ± 4.58 × 10−24.21 × 10−1 ± 7.30 × 10⁻²
Choline5.13 × 10−1 ± 1.61 × 10−15.78 × 10−1 ± 1.42 × 10−16.16 × 10−1 ± 2.36 × 10⁻¹
Ethanol2.92 × 10−1 ± 5.09 × 10−22.85 × 10−1 ± 5.15 × 10−25.56 × 10−1 ± 7.00 × 10⁻¹
Ethanolamine1.56 × 10−1 ± 5.11 × 10−22.89 × 10−1 ± 7.71 × 10−22.29 × 10−1 ± 1.10 × 10⁻¹
Isopropanol1.88 × 10−1 ± 1.53 × 10−12.11 × 10−1 ± 6.18 × 10−21.70 × 10−1 ± 7.19 × 10⁻²
Methanol9.94 × 10−1 ± 8.35 × 10−11.23 ± 1.145.28 × 10−1 ± 2.15 × 10⁻¹
myo-Inositol1.68 ± 1.182.34 ± 8.57 × 10−12.18 ± 1.24
sn-Glycero-3-phosphocholine28.2 ± 11.825.3 ± 6.7029.3 ± 10.4
TMAO7.27 × 10−2 ± 4.52 × 10−21.46 × 10−1 ± 1.22 × 10−21.03 × 10−1 ± 5.23 × 10⁻²
Publisher’s Note: MDPI stays neutral with regard to jurisdictional claims in published maps and institutional affiliations.

