Precision Feeding in Ecological Pig-Raising Systems with Maize Silage
Abstract
Simple Summary
Abstract
1. Introduction
2. Materials and Methods
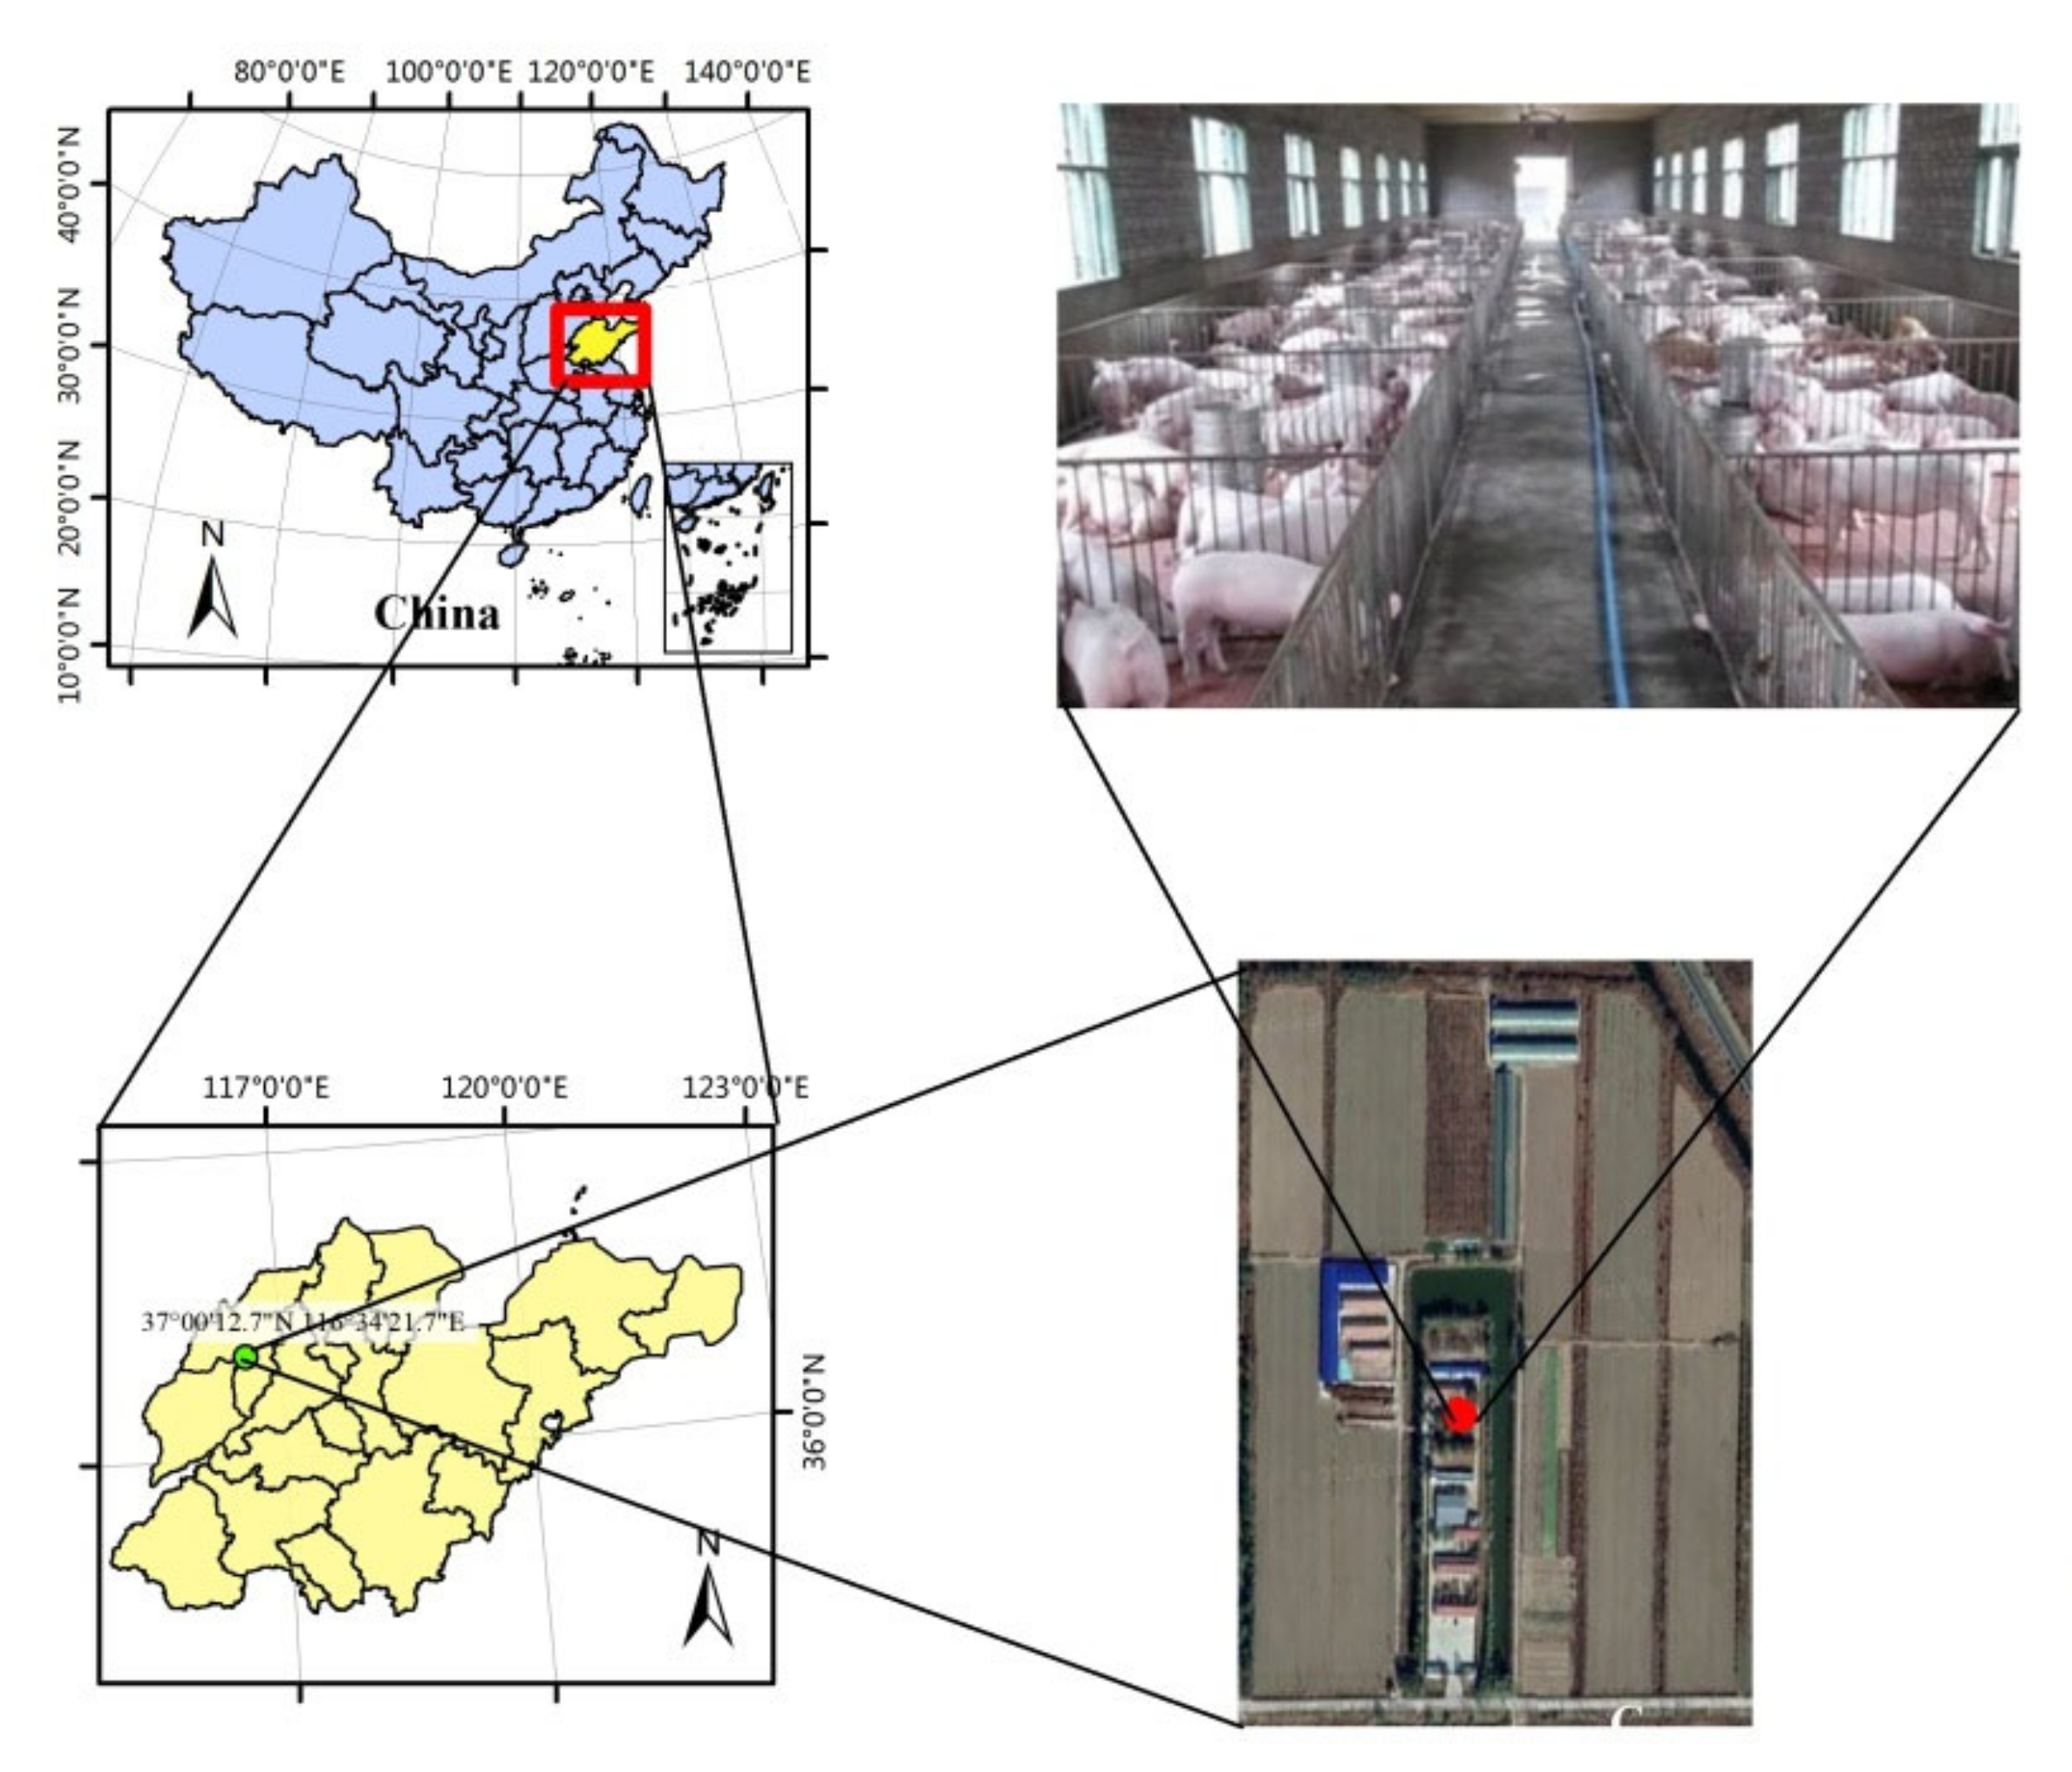
2.1. Study Site
2.2. Experimental Design
2.3. Data Collection
2.4. Pig Growth Modeling
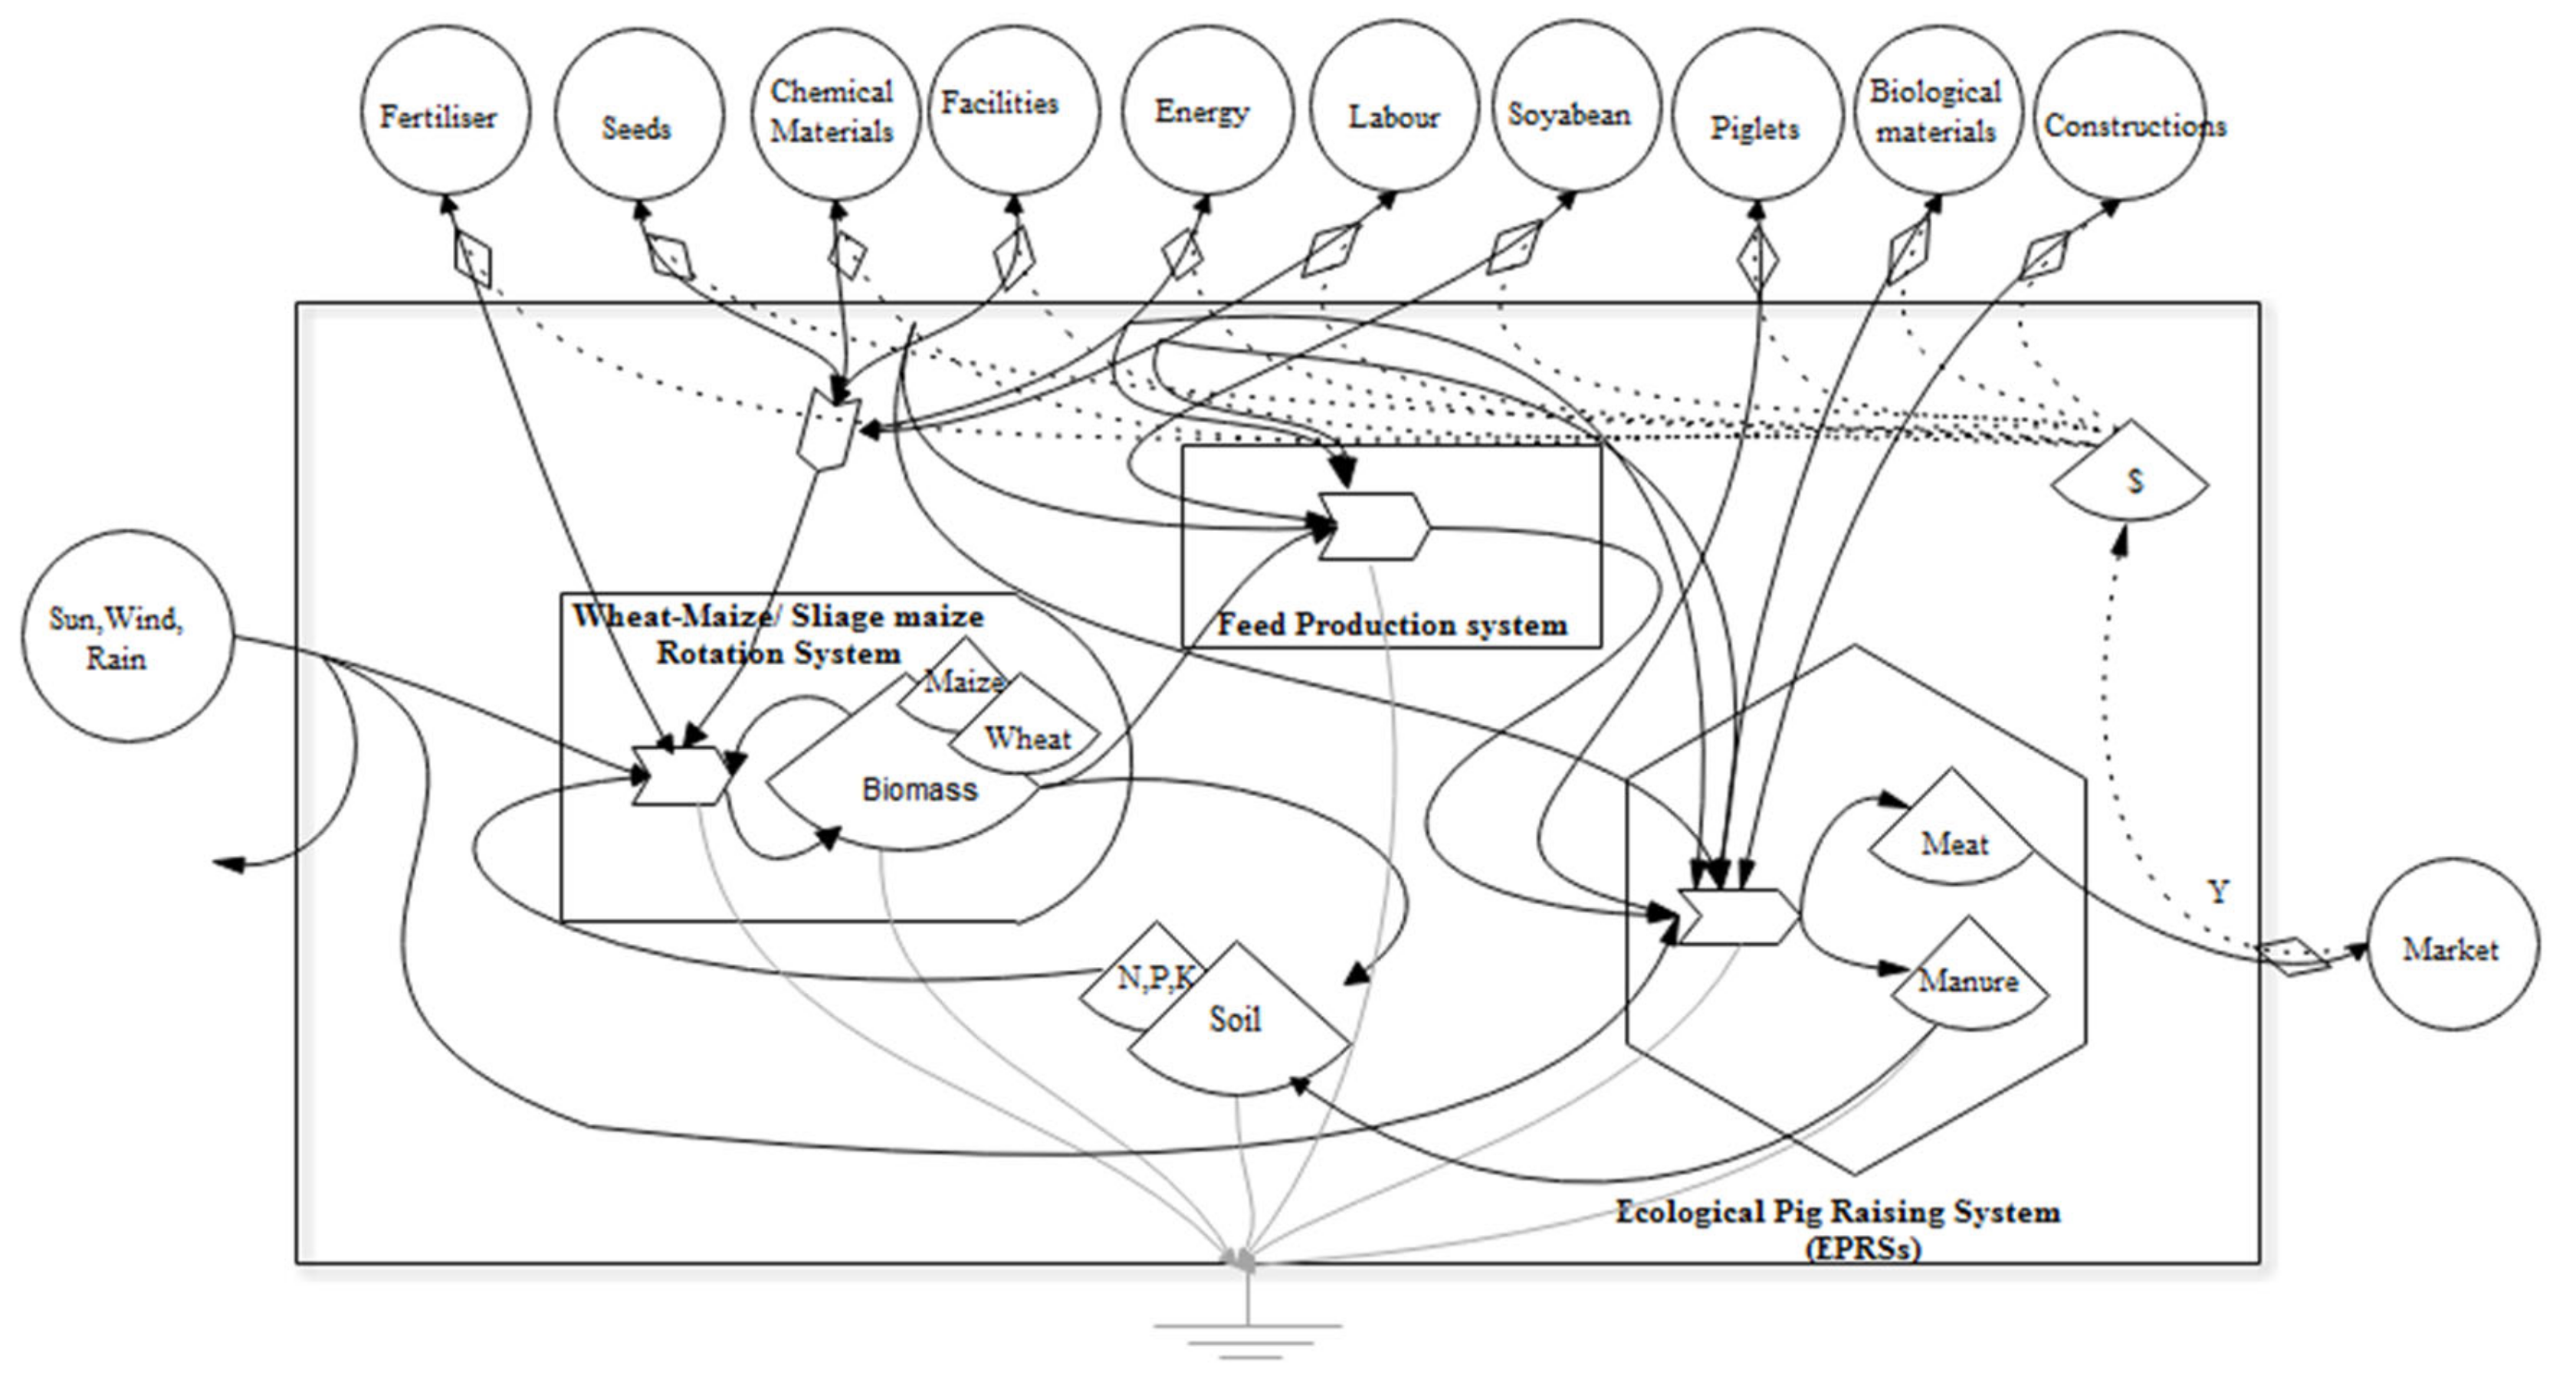
2.5. Emergy Analysis
2.6. Economic Analysis
3. Results
3.1. Pig Growth Modeling
3.2. Emergy Analysis
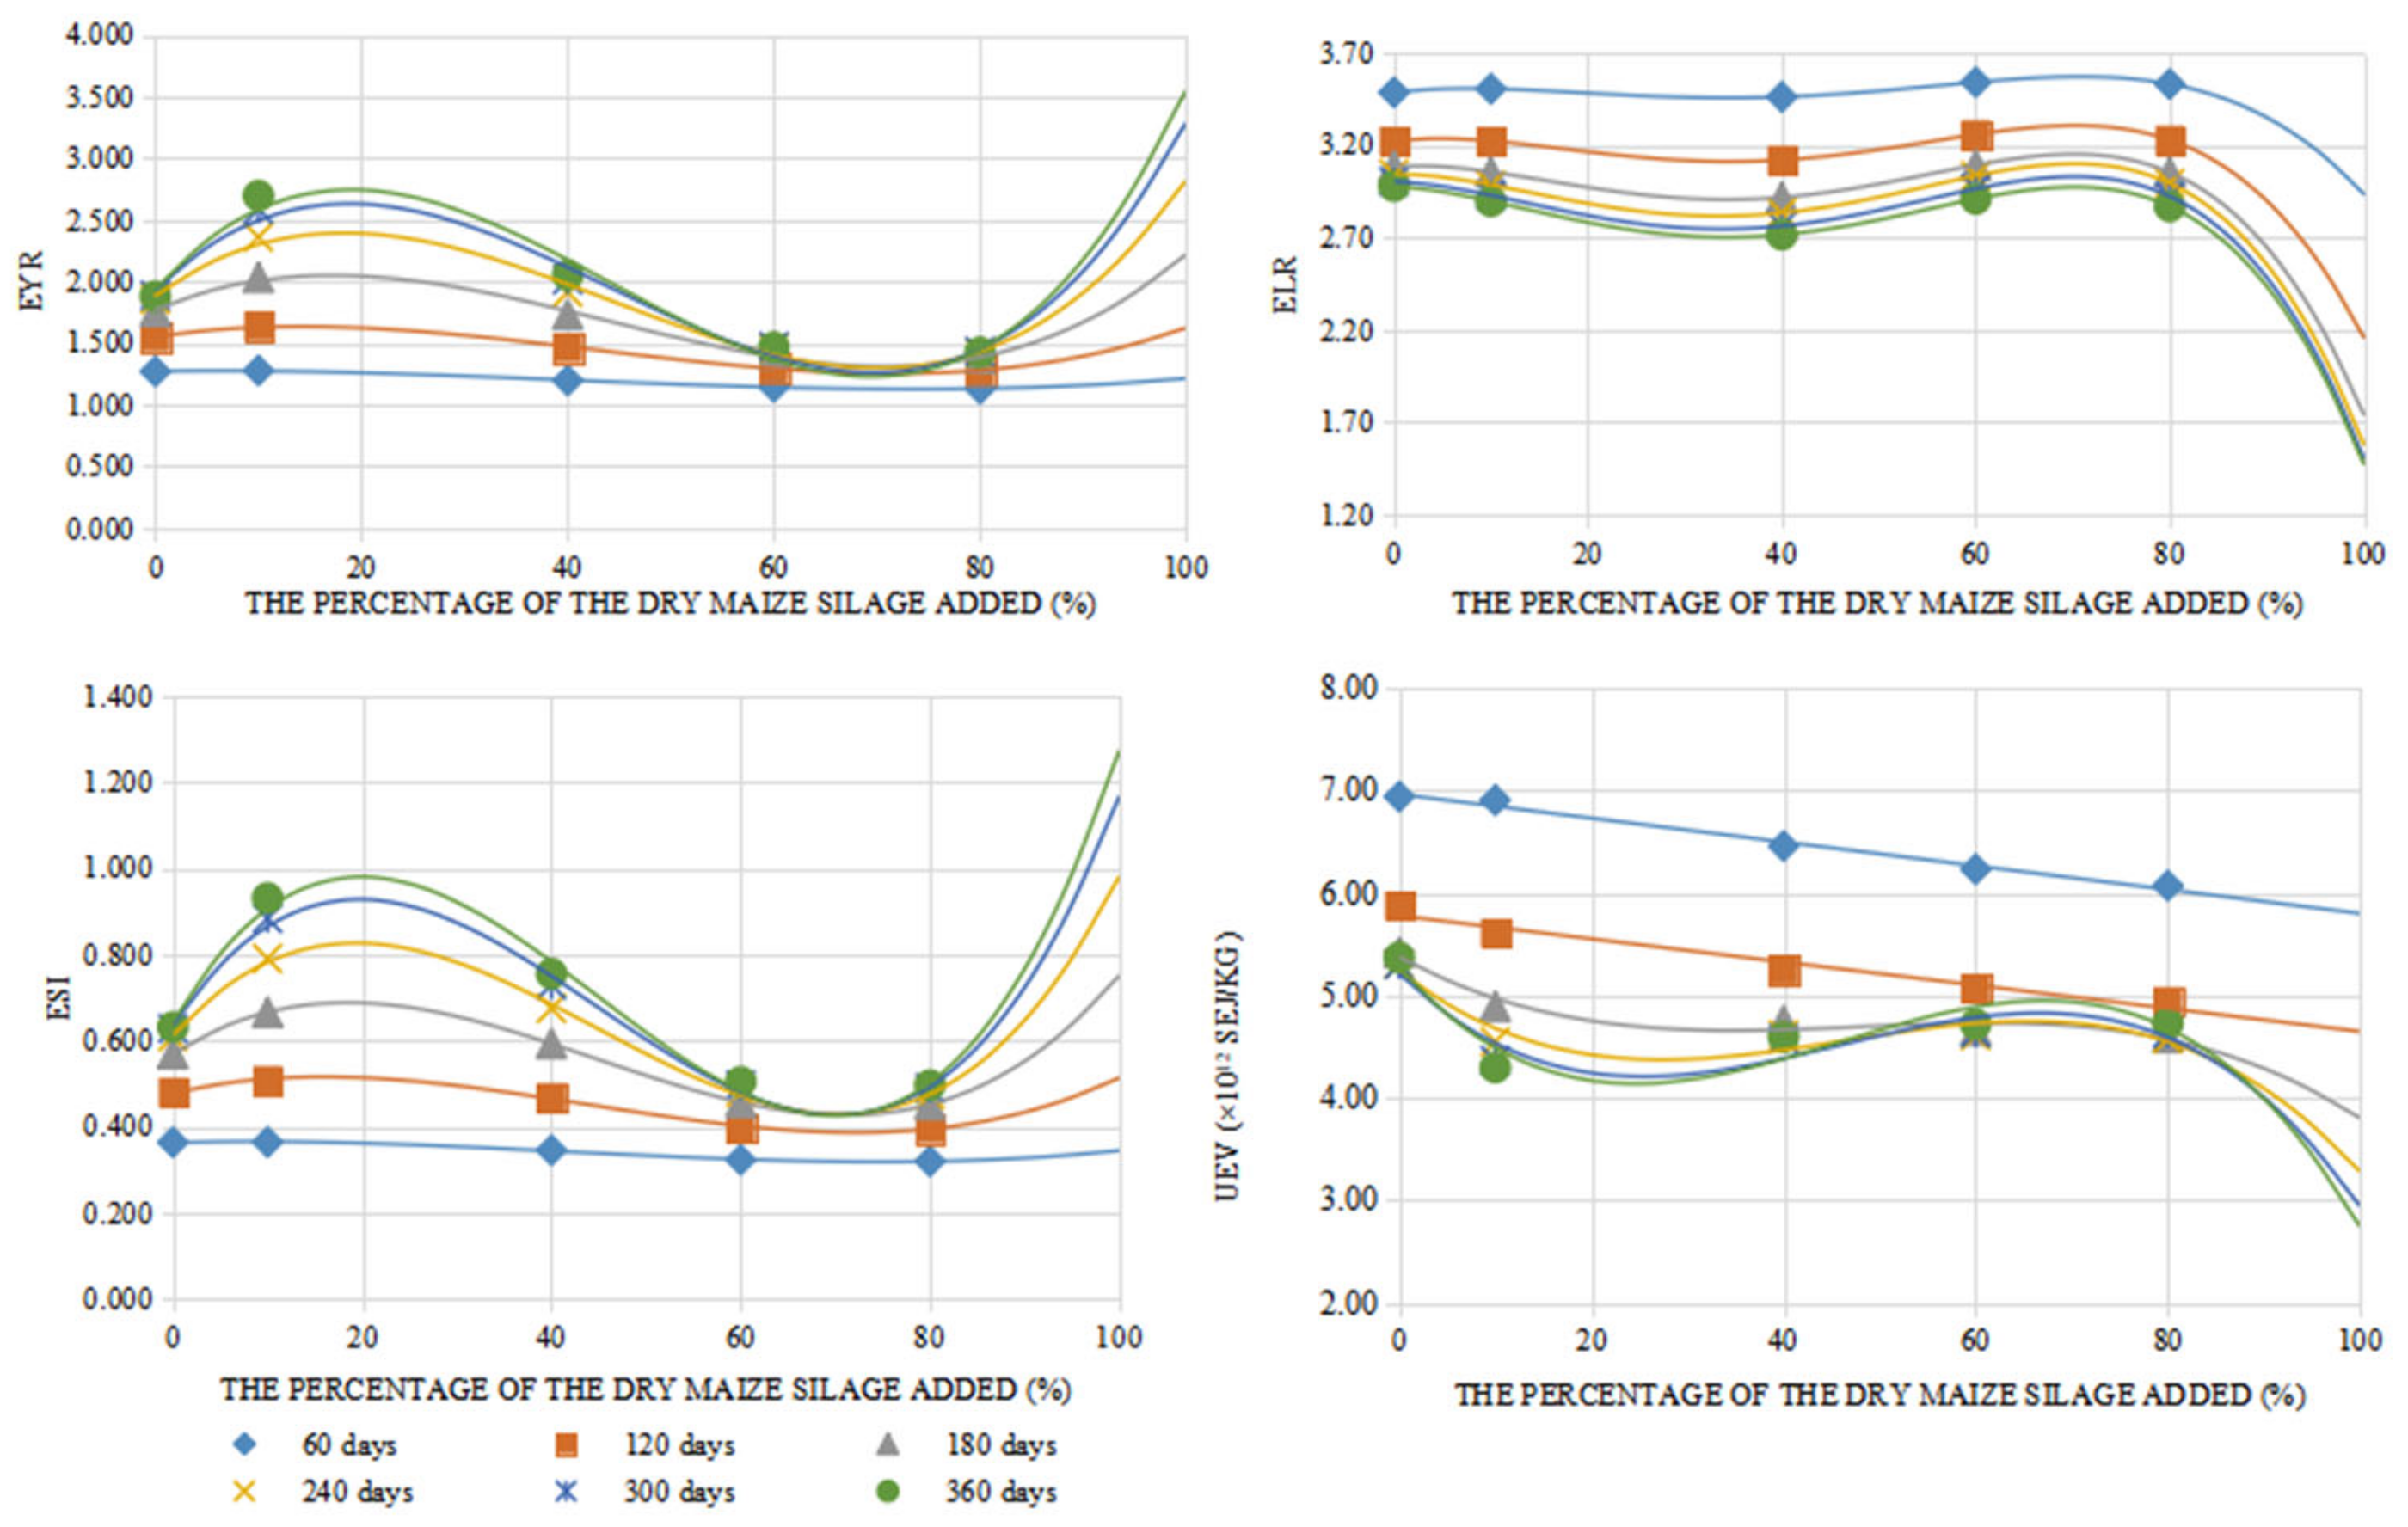
3.2.1. EYR Trend
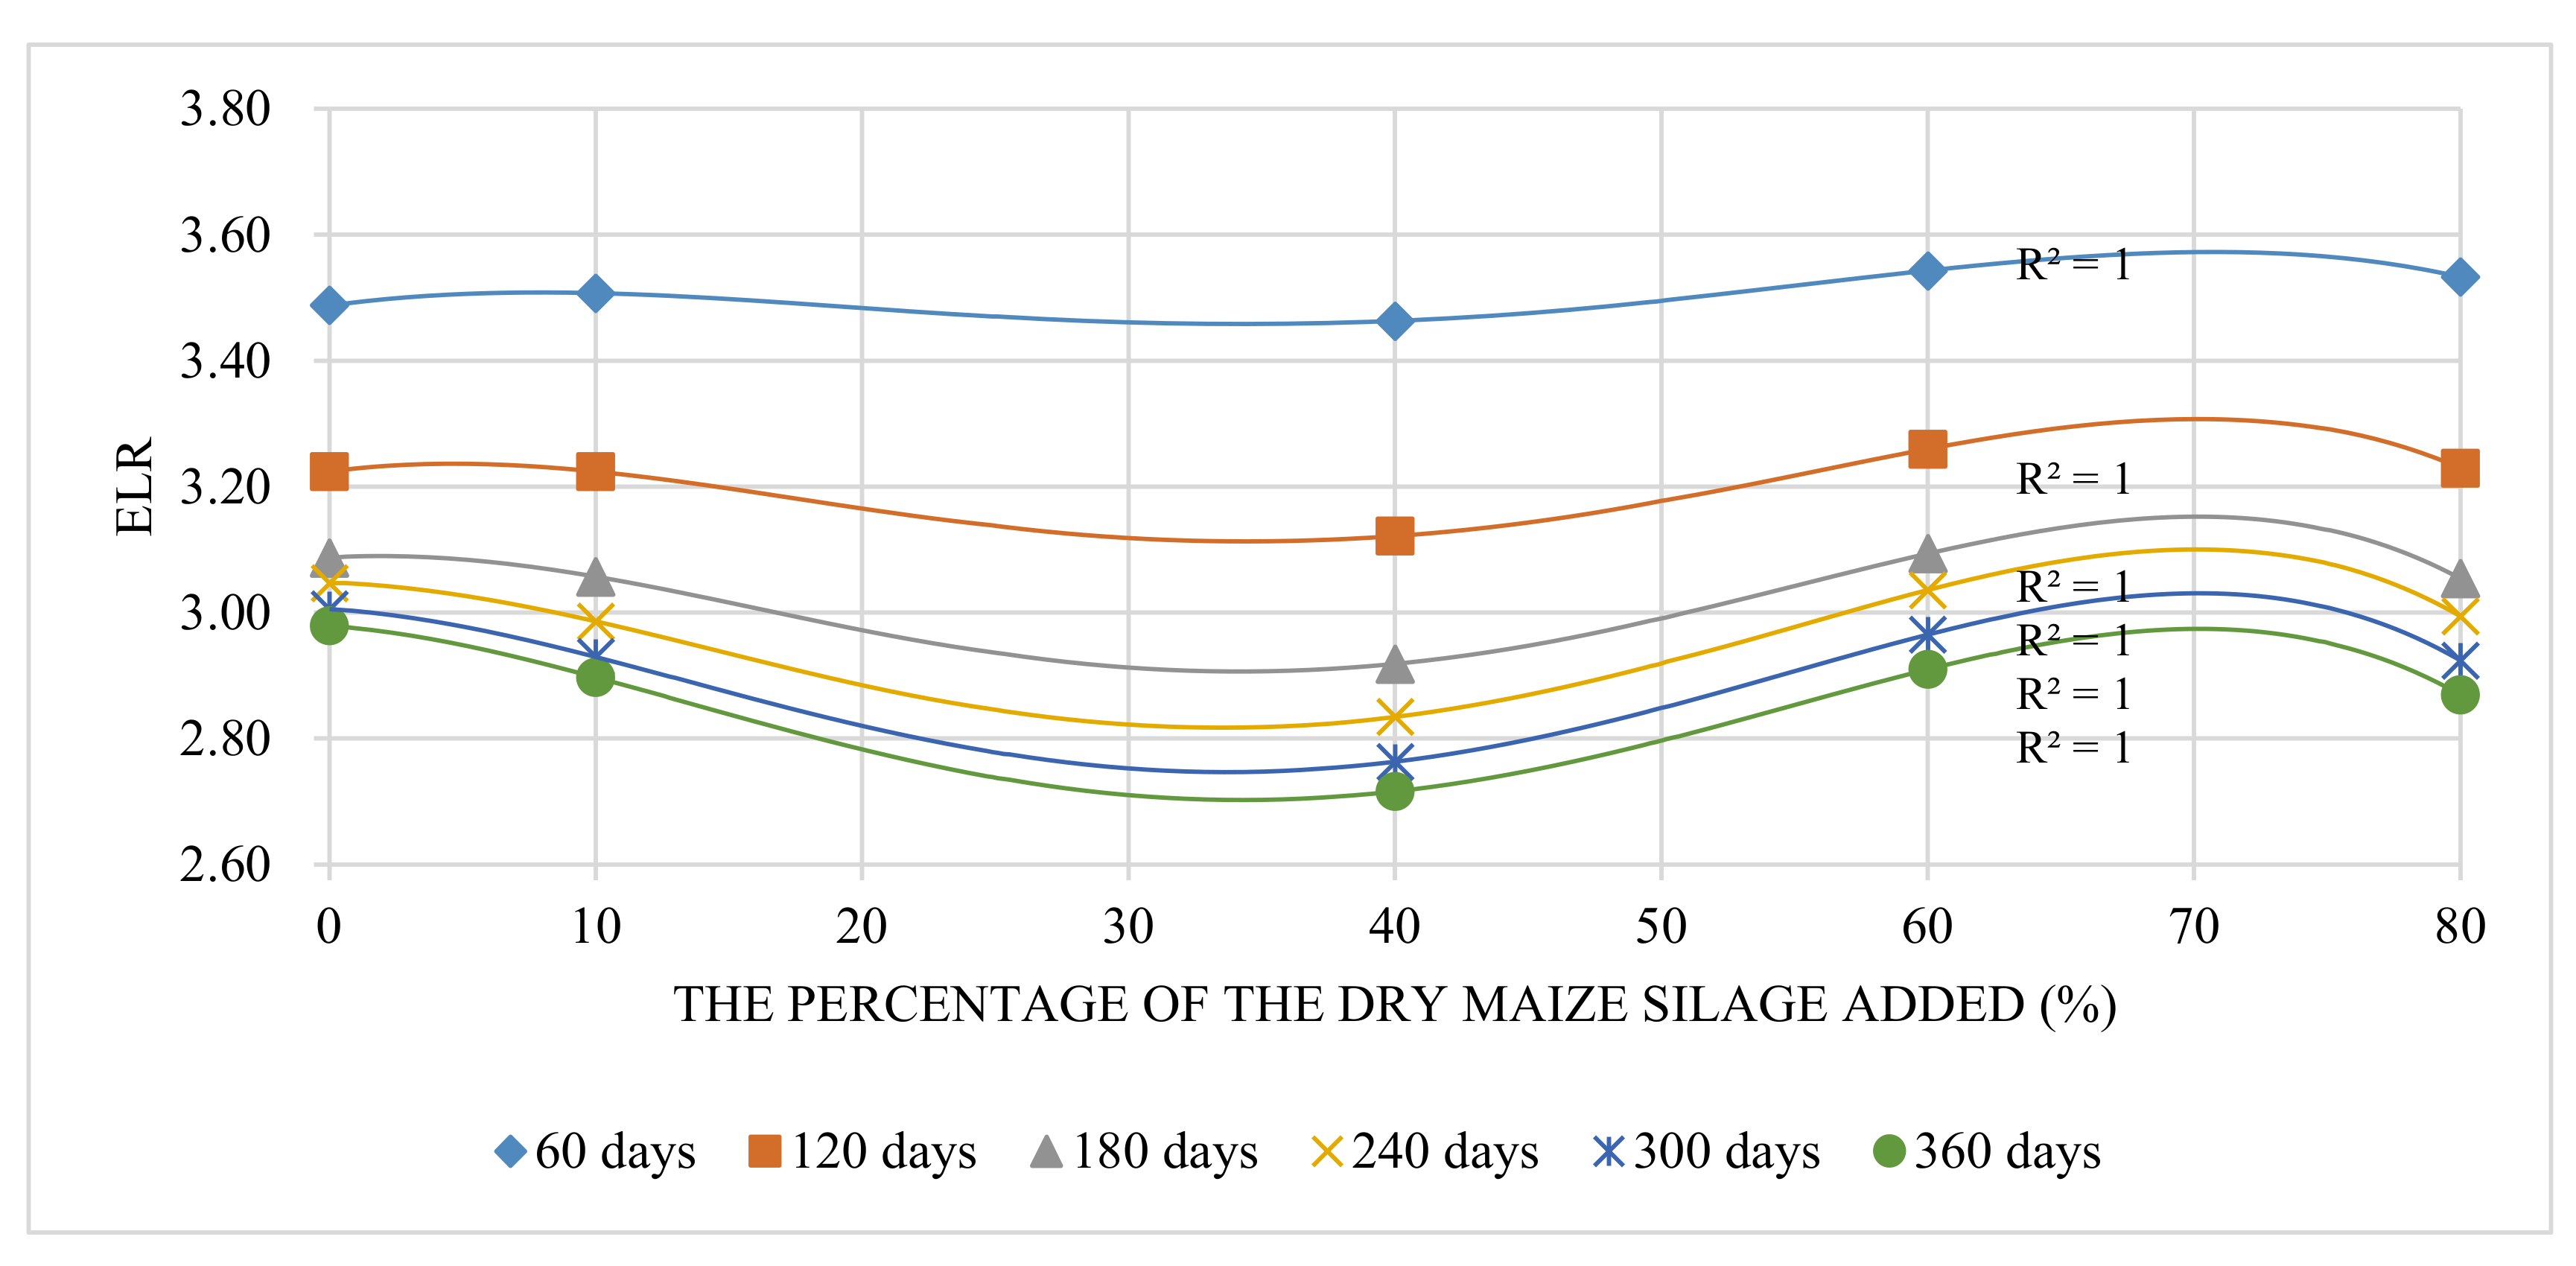
3.2.2. ELR Trend
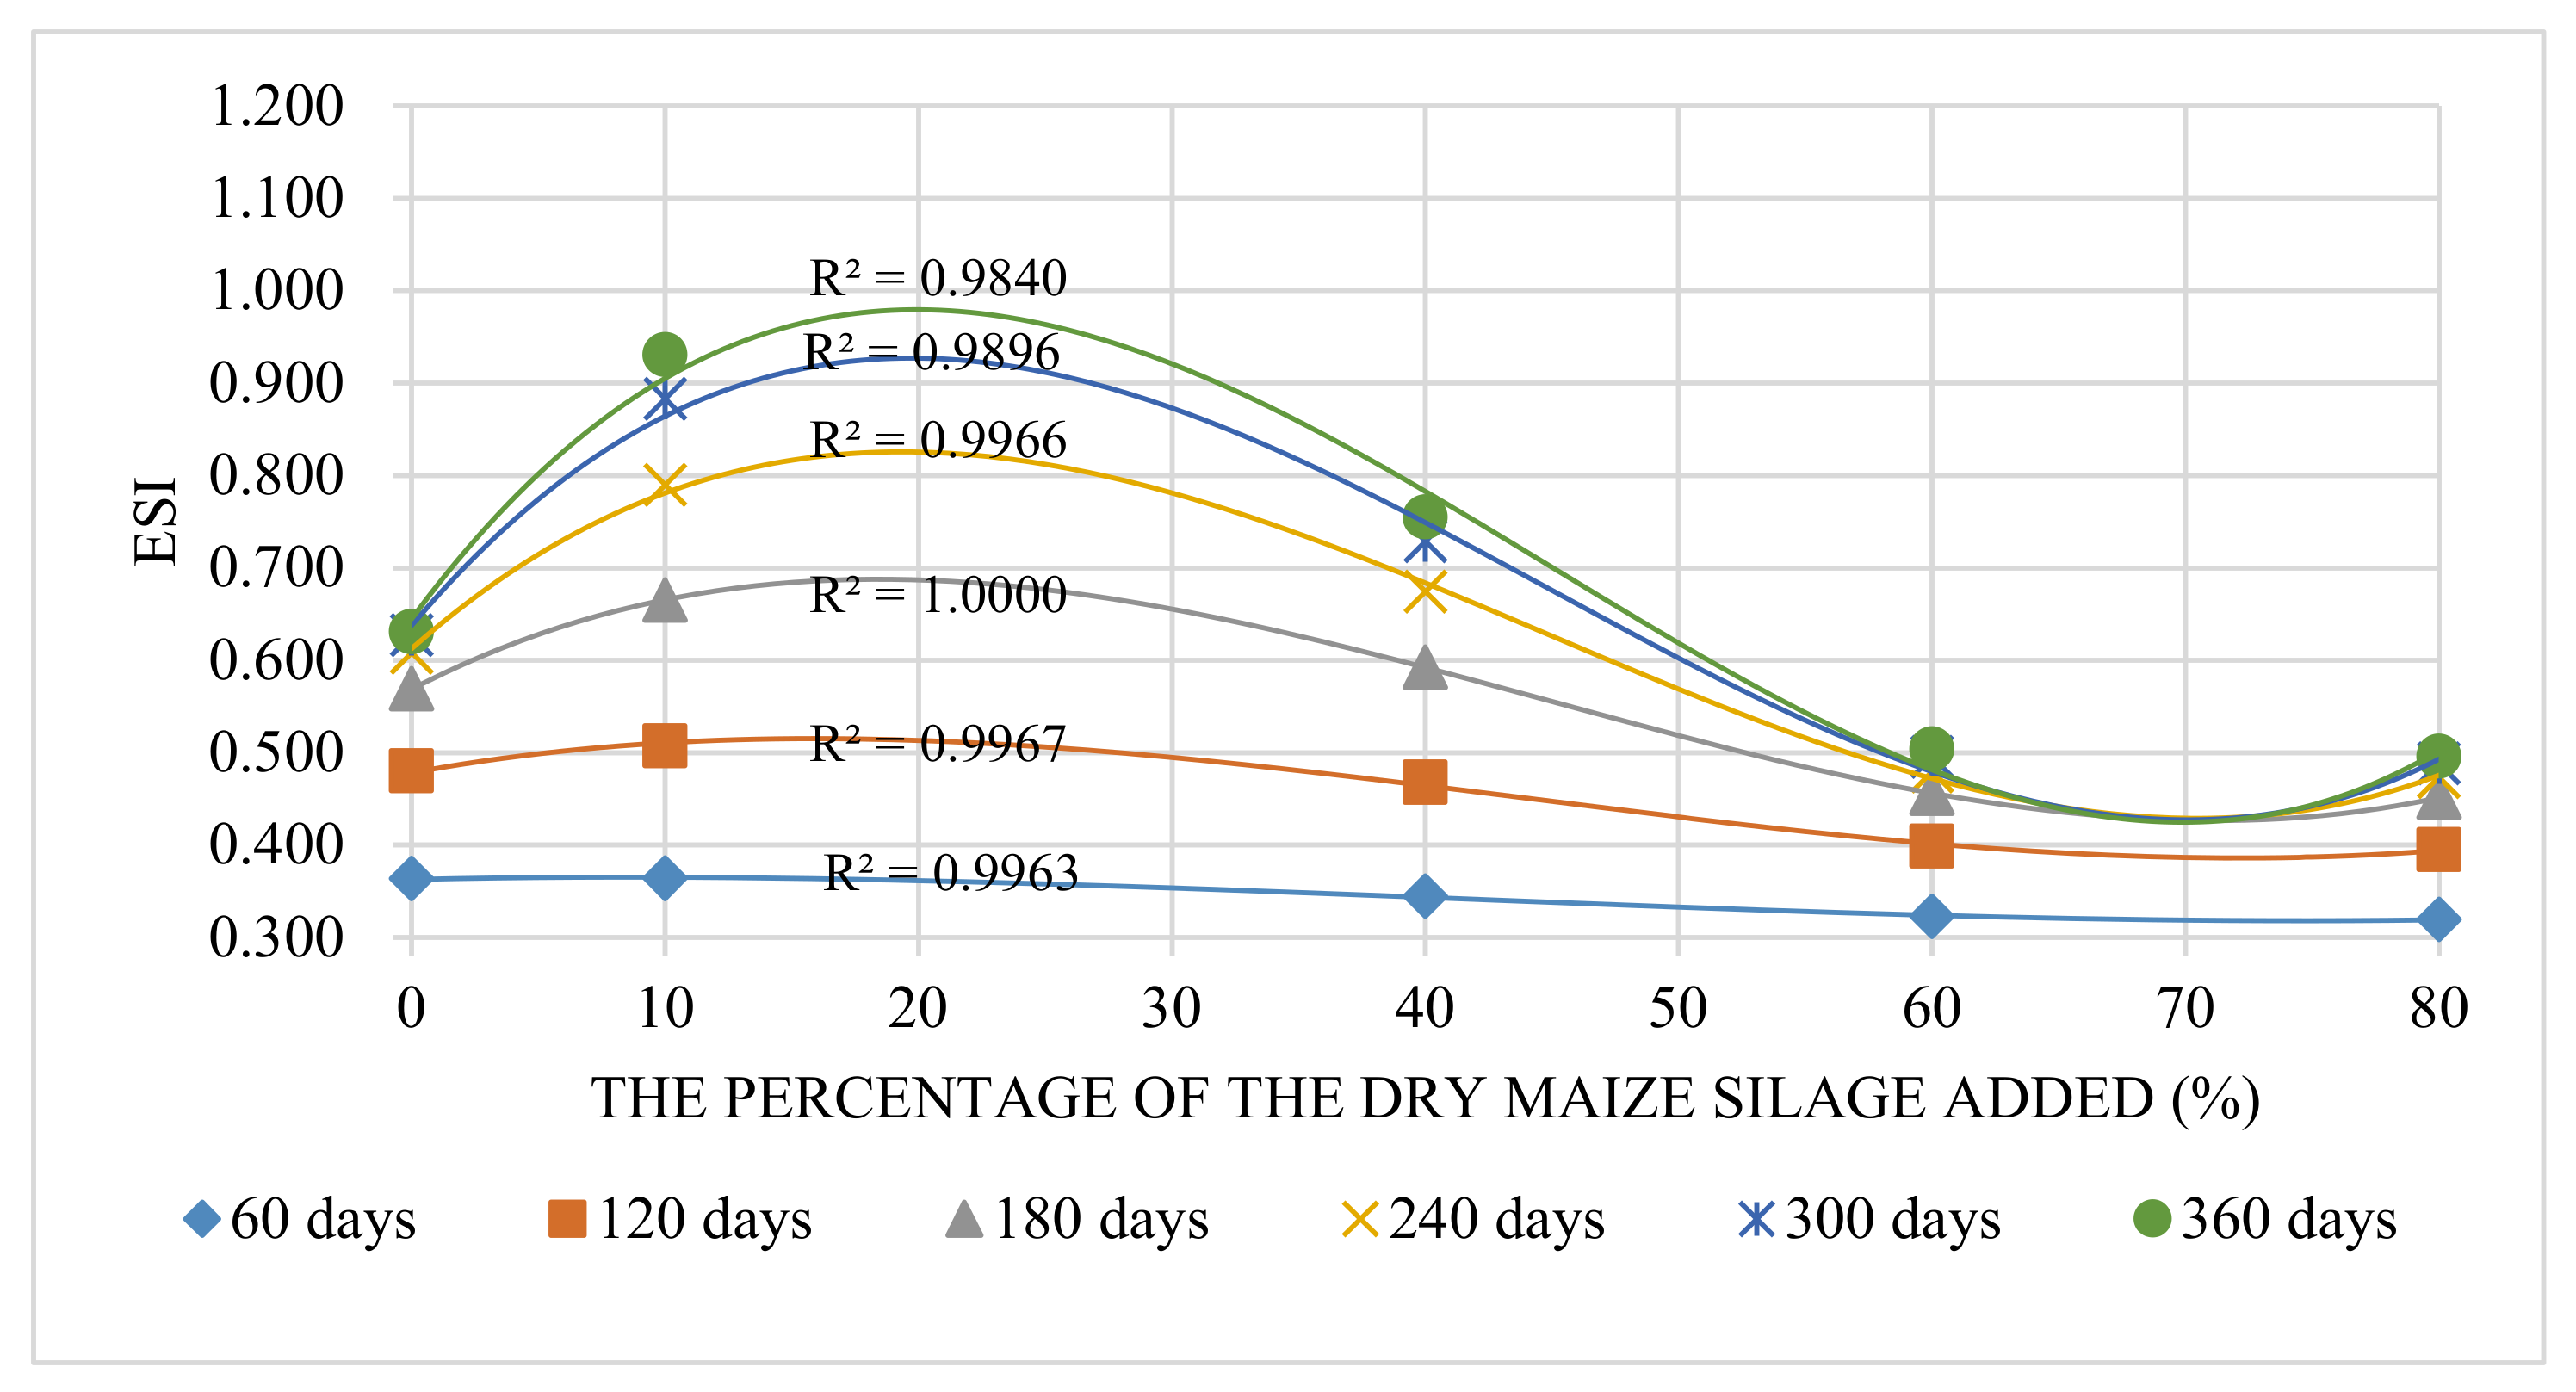
3.2.3. ESI Trend
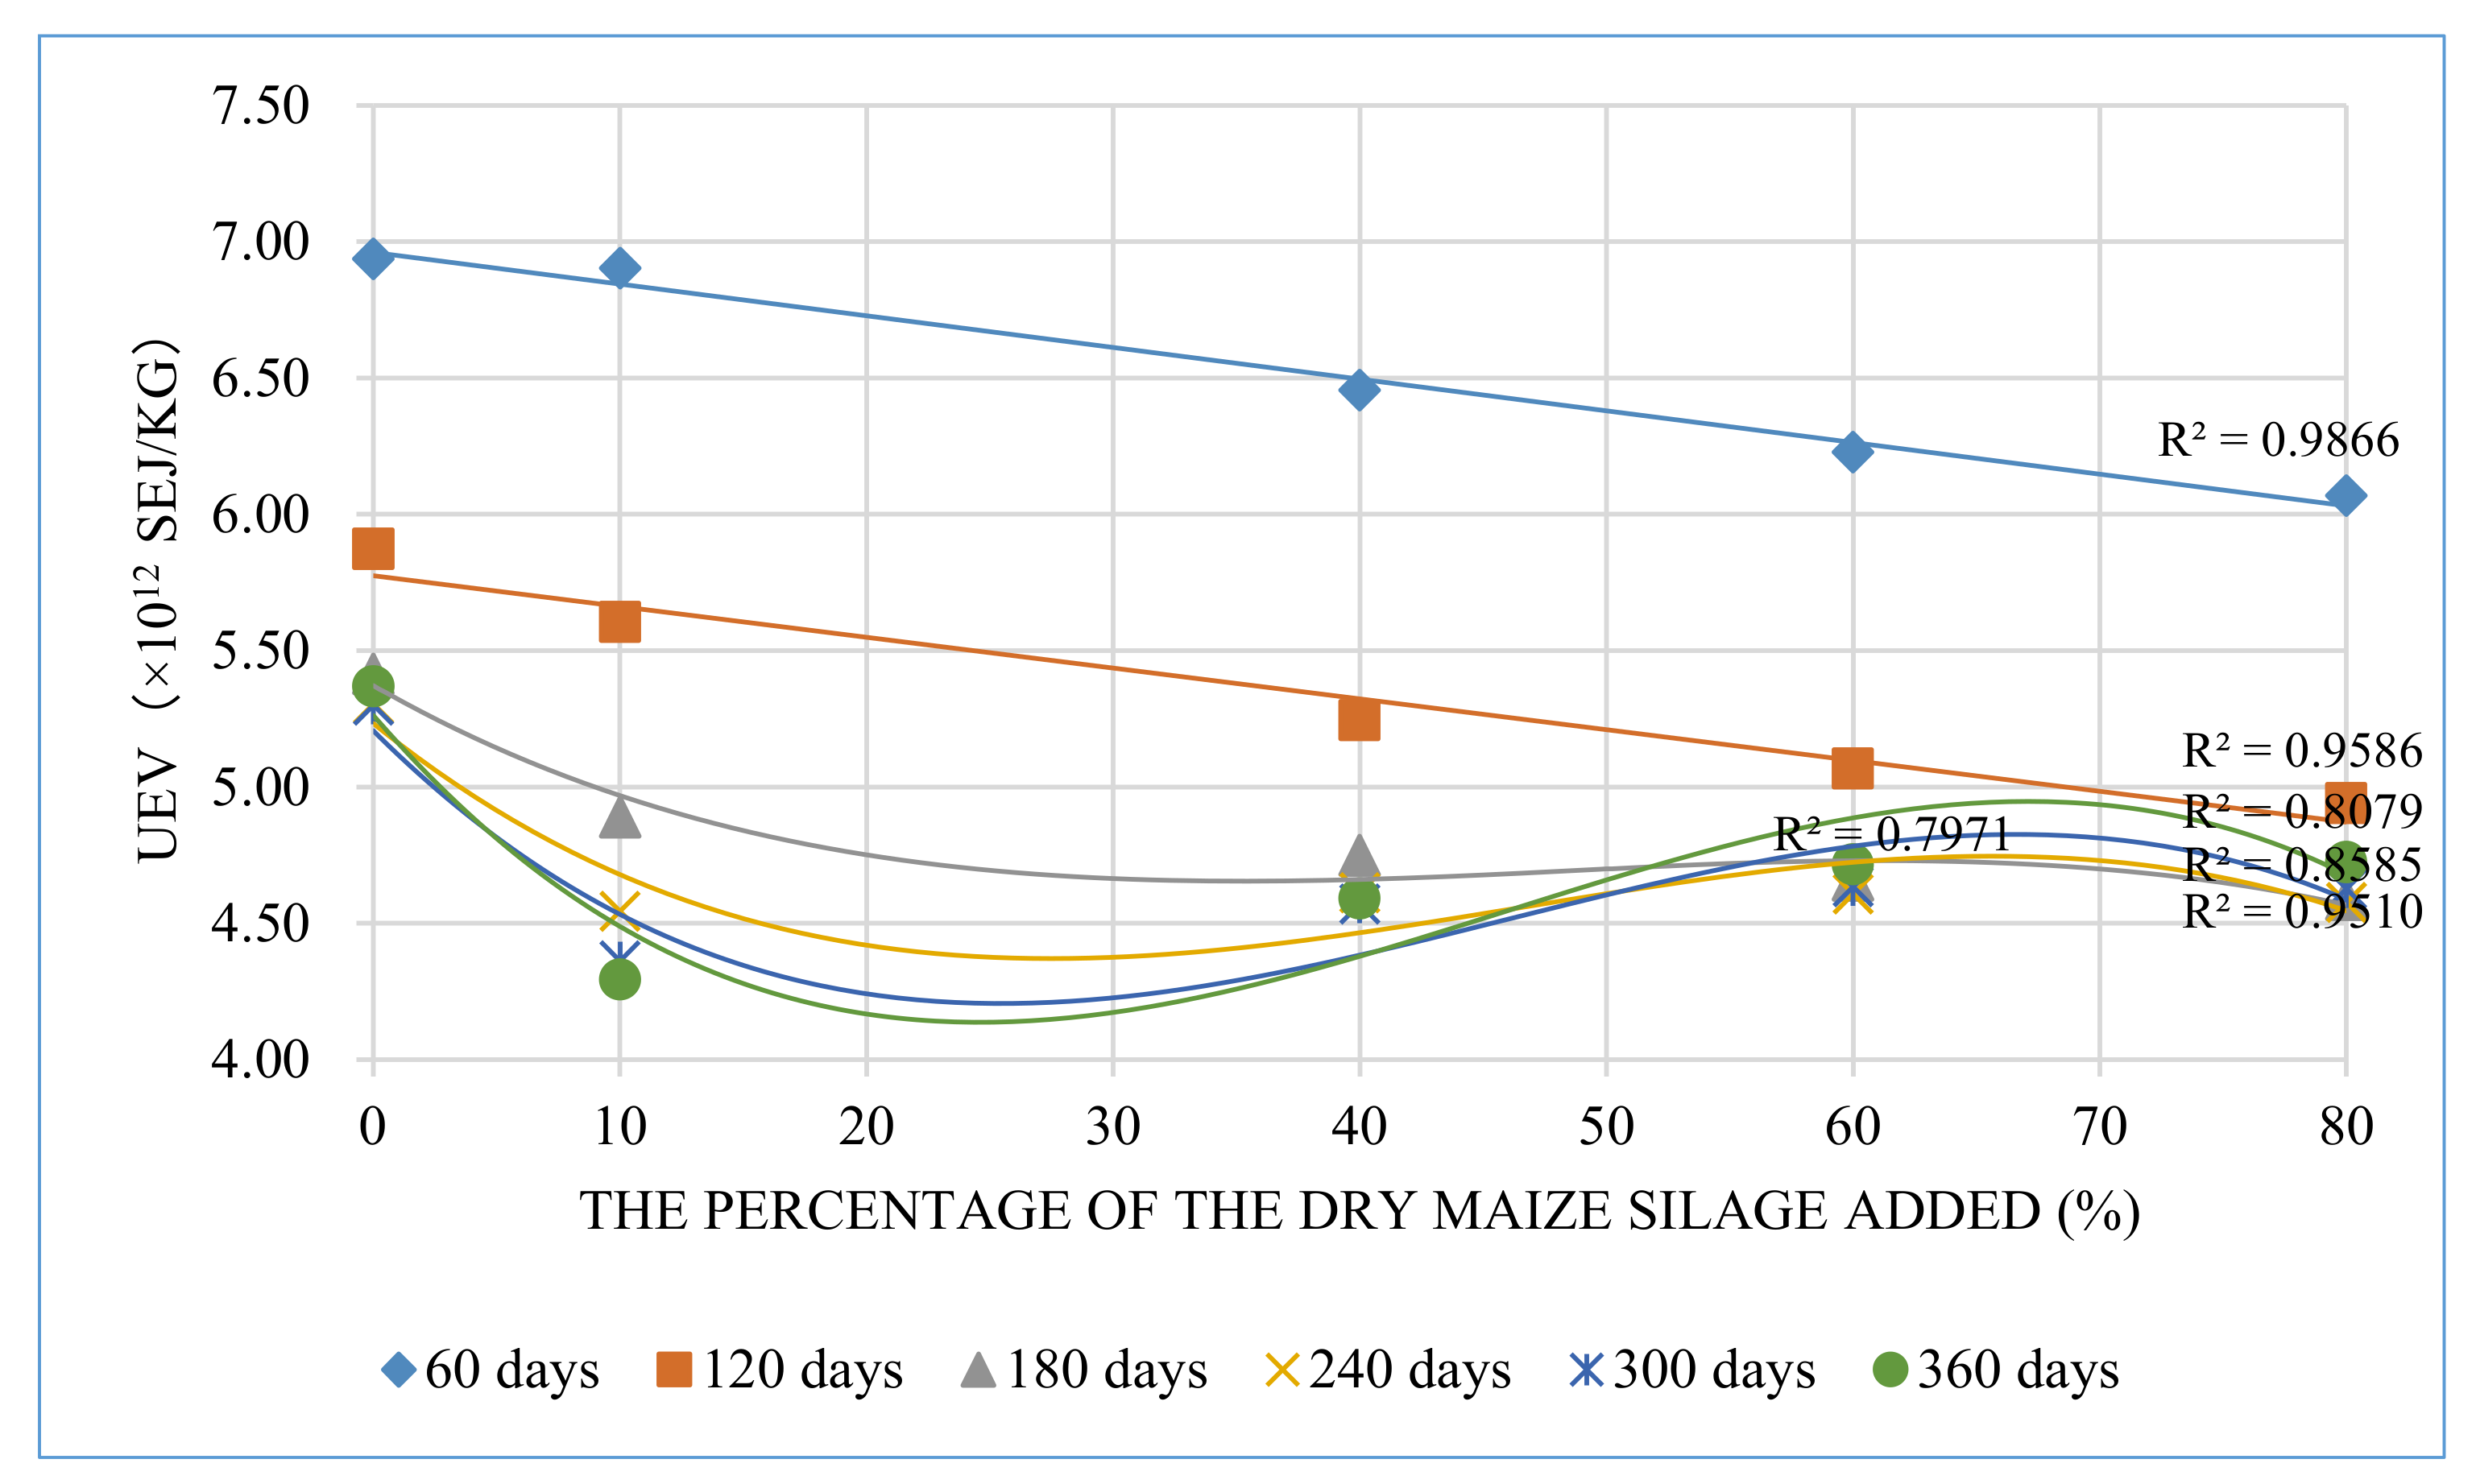
3.2.4. UEV Trend
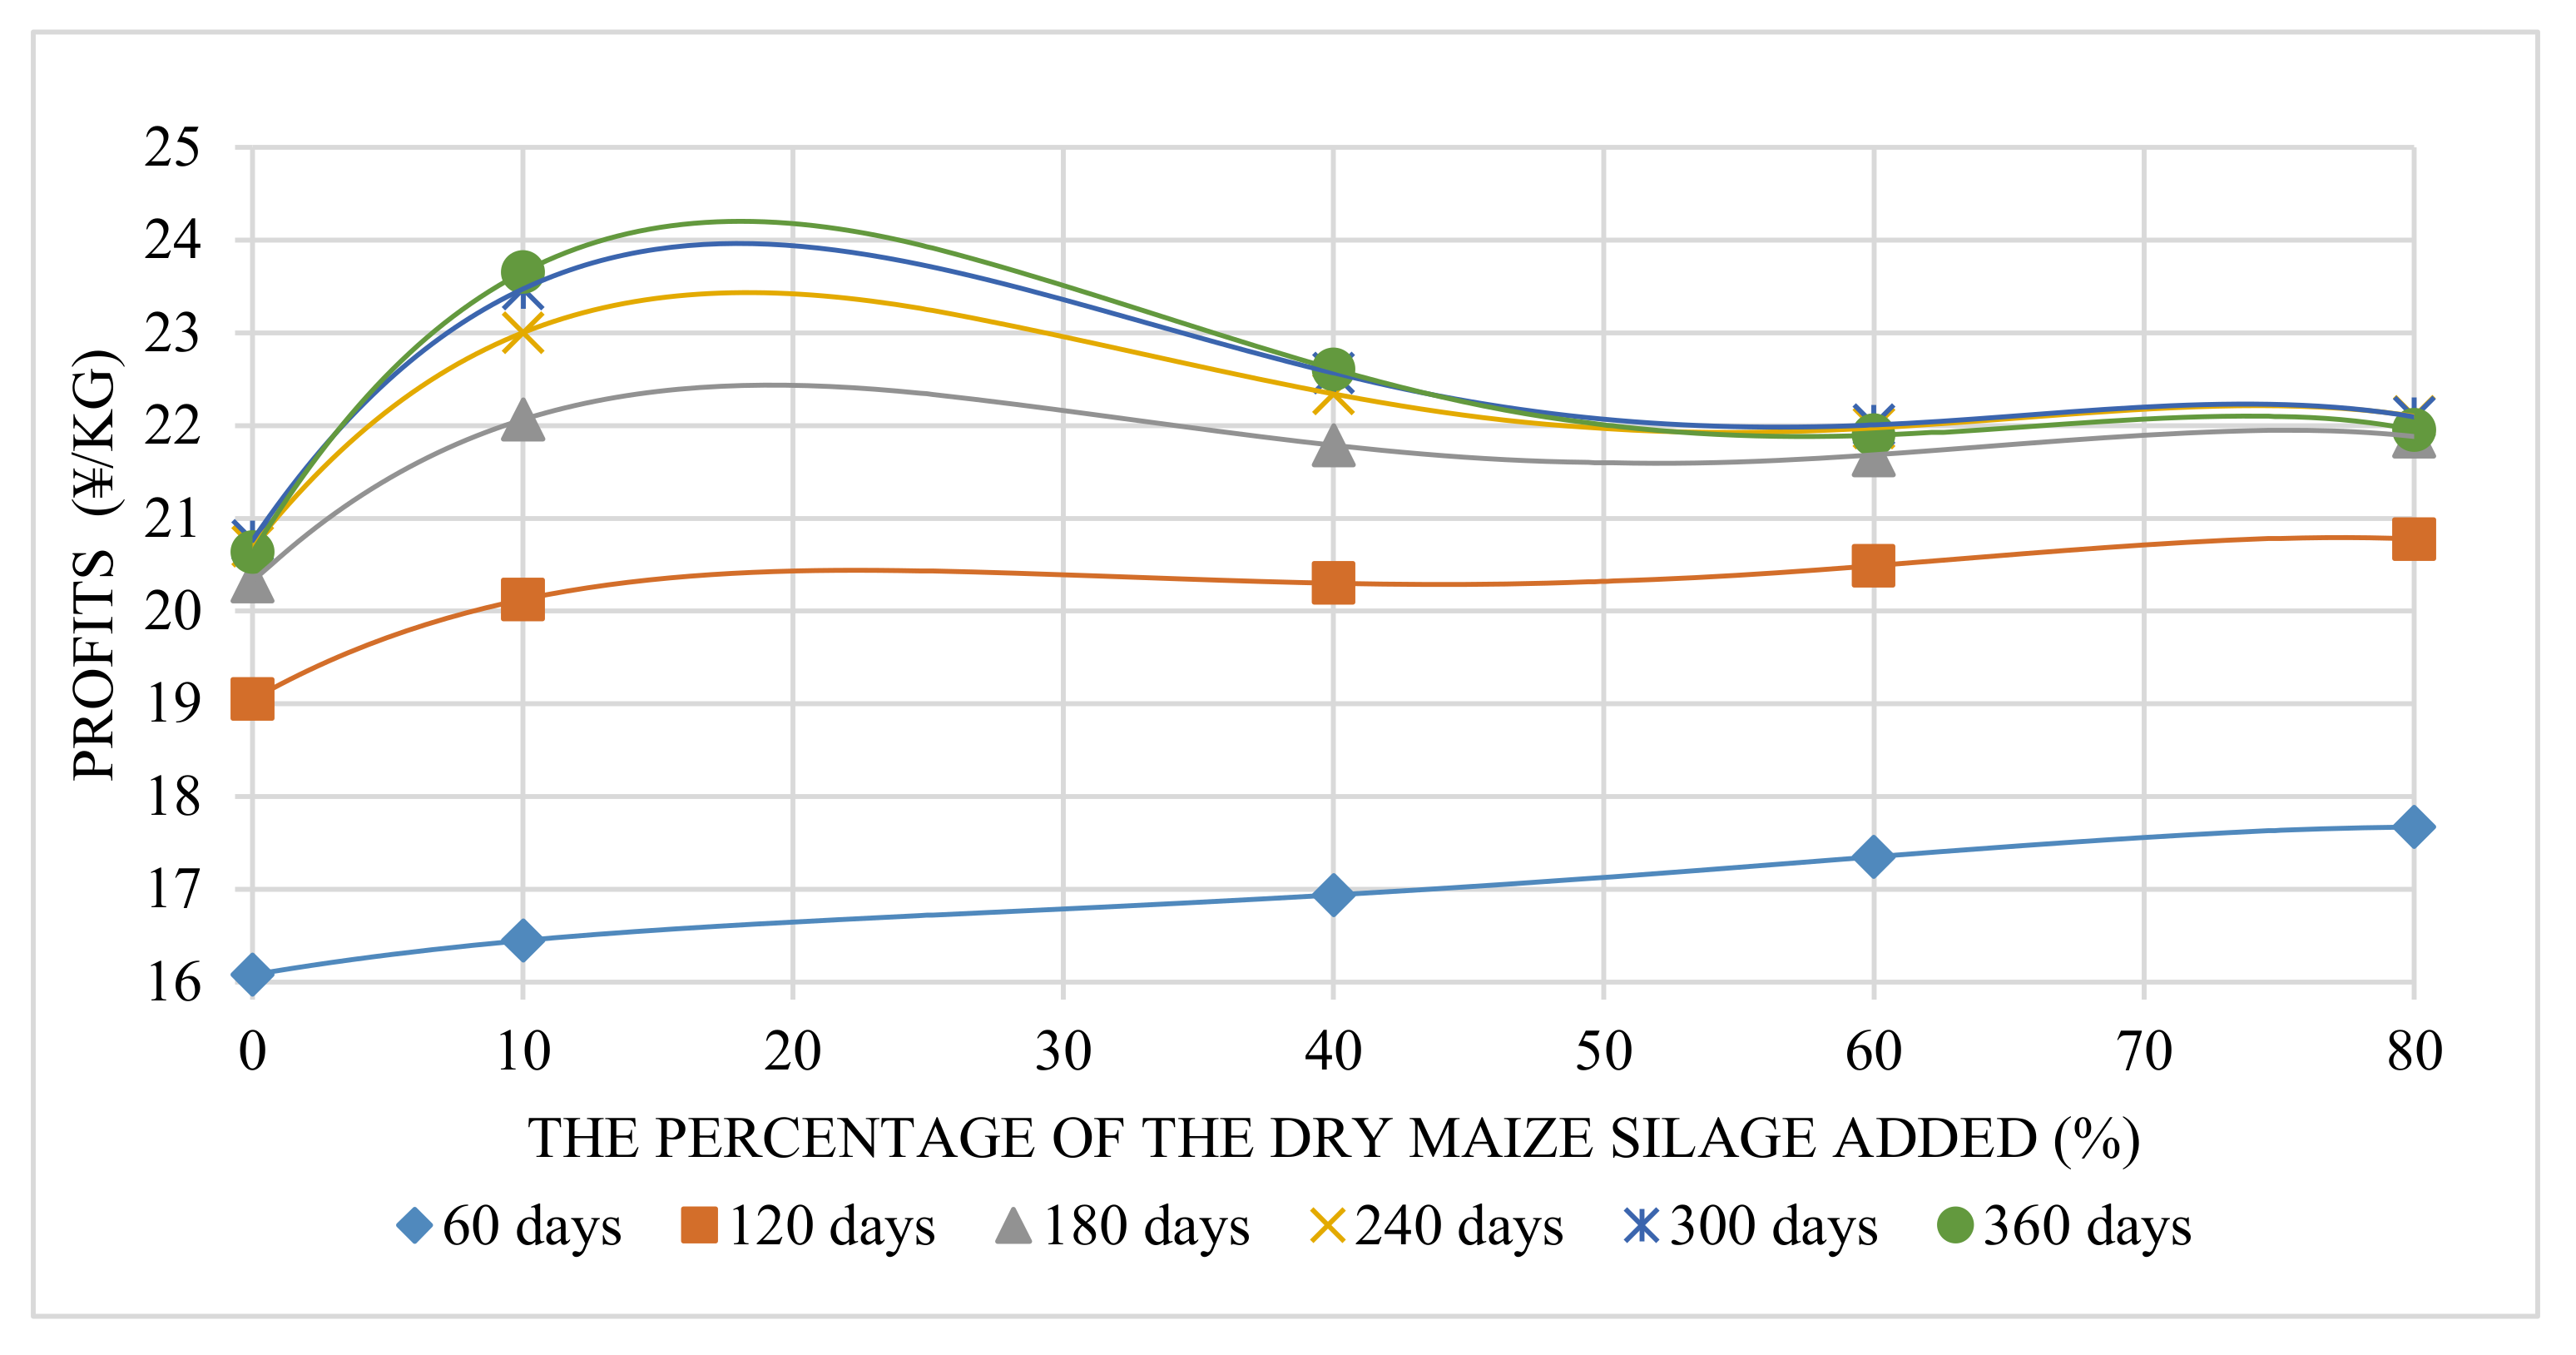
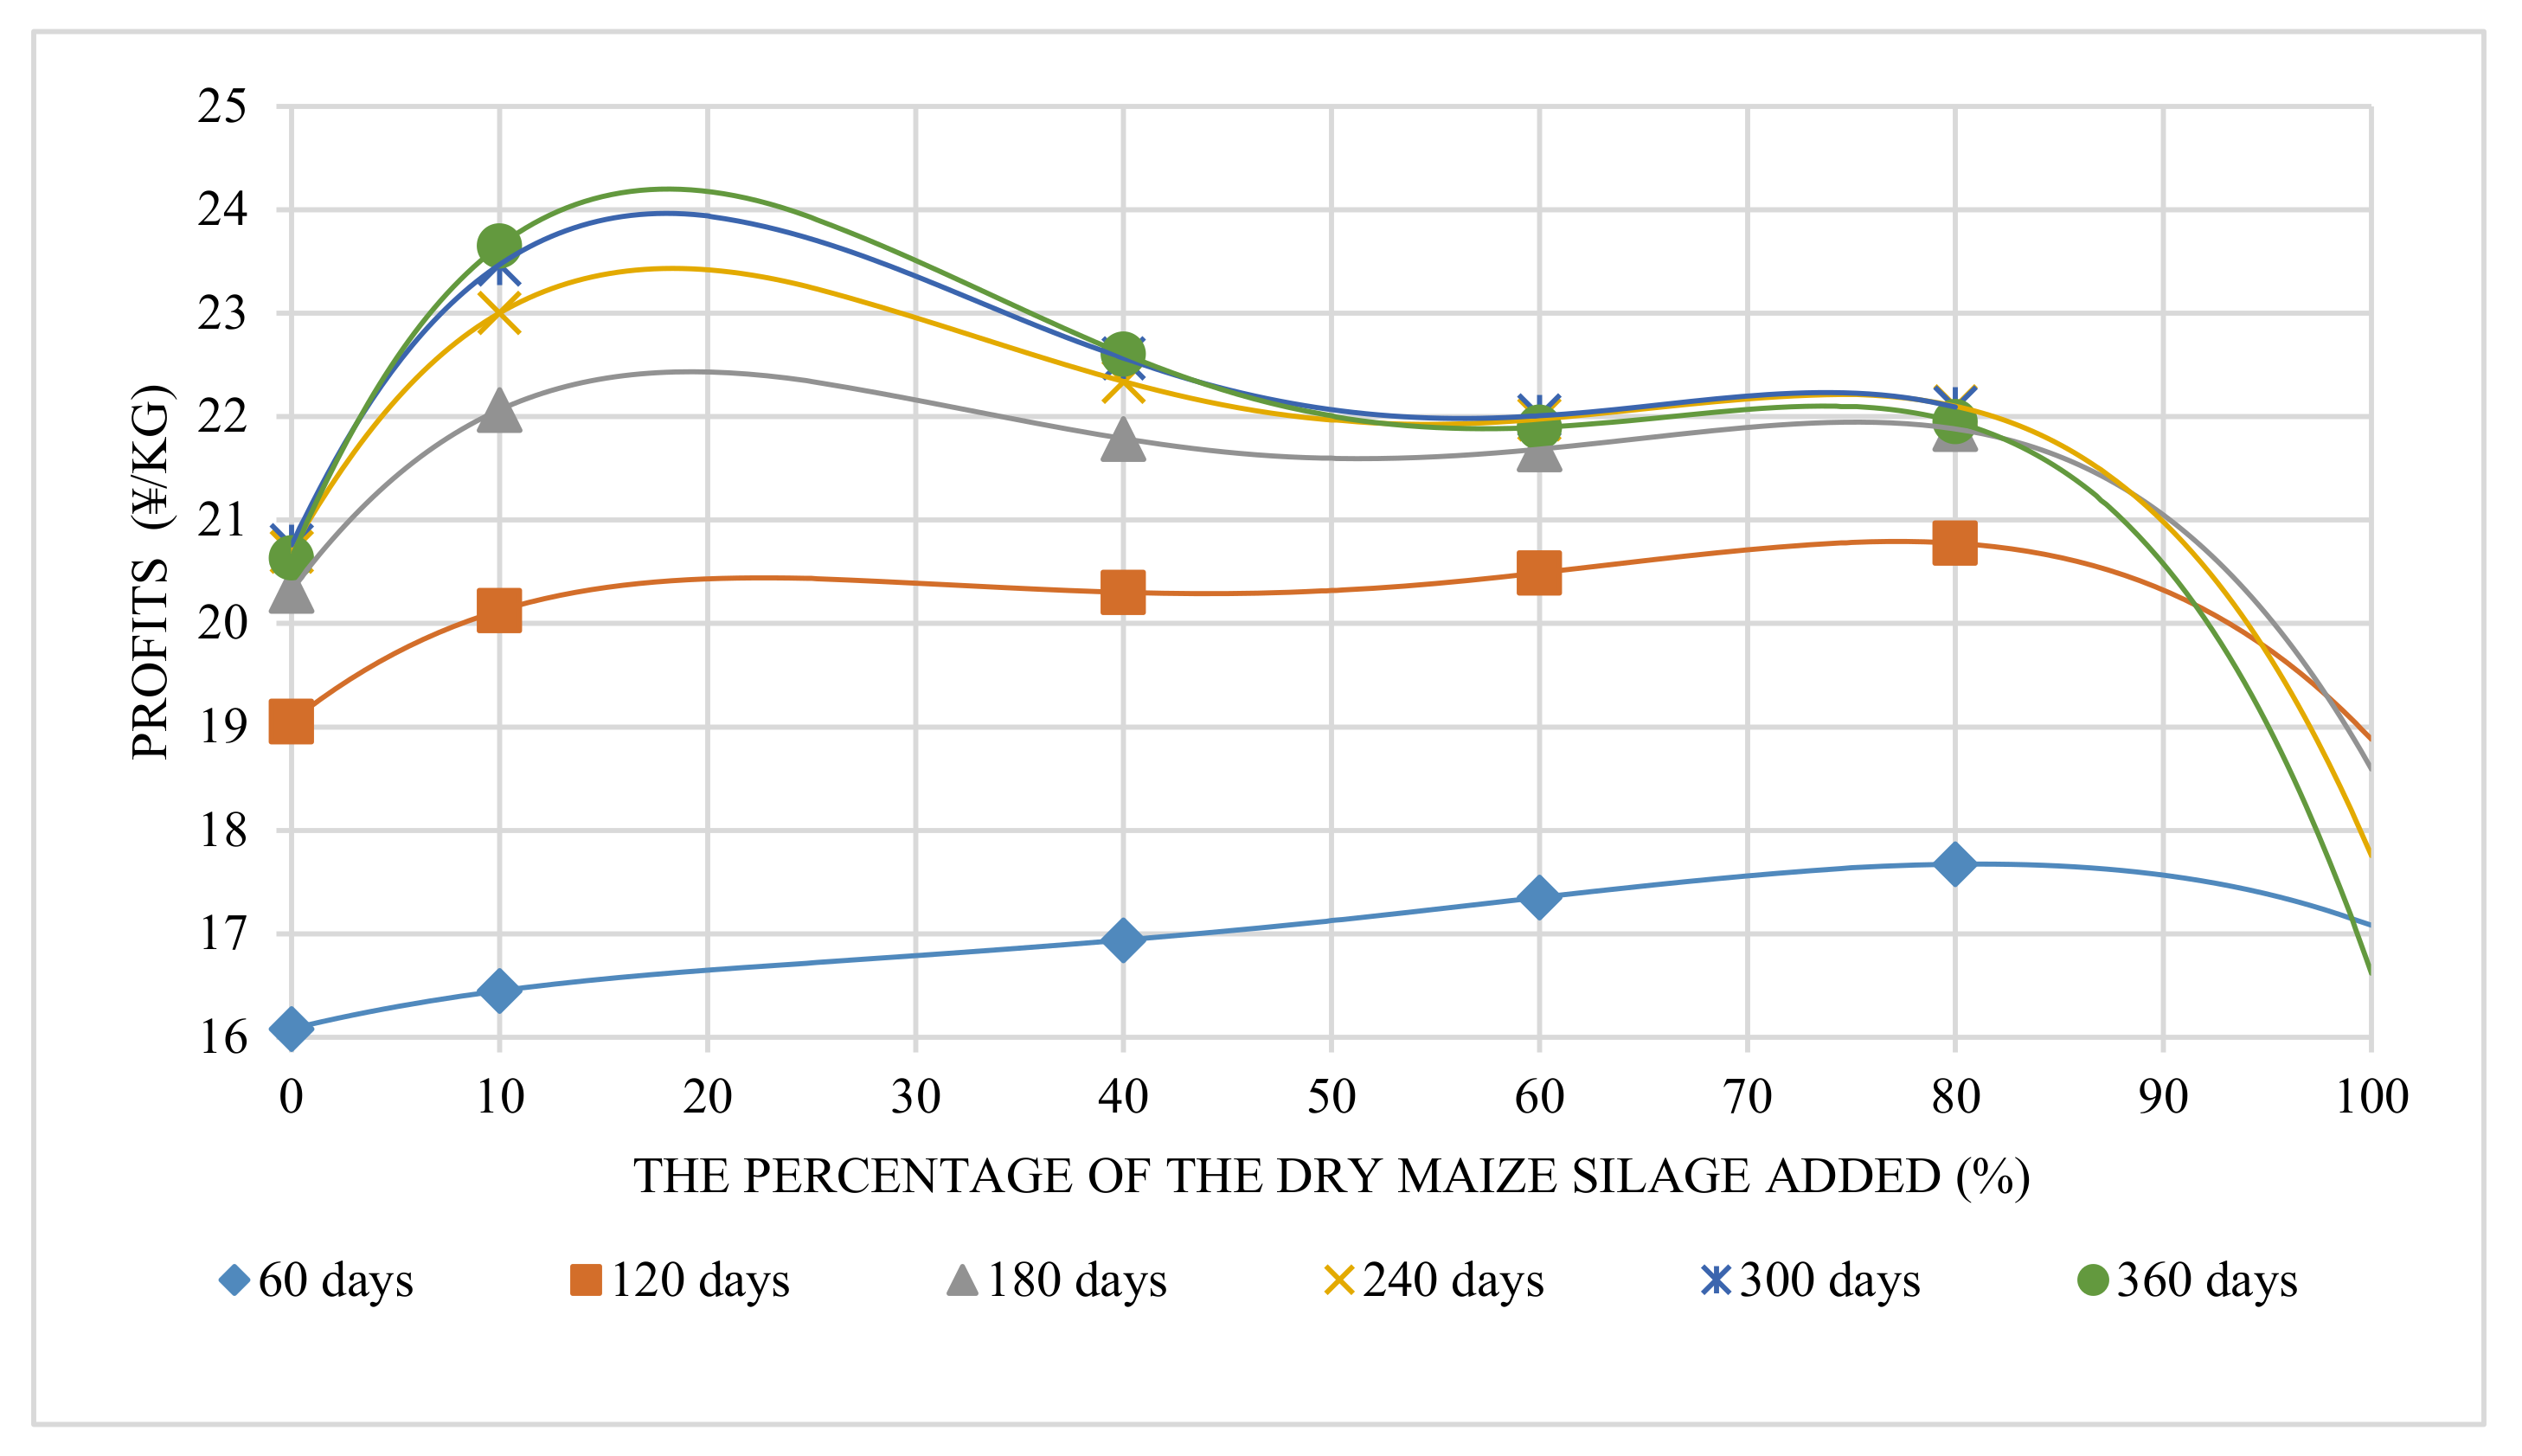
3.3. Economic Analysis
3.4. Balance Point of EPRSs
4. Discussion
4.1. Predictions of Feed with More Than 80% Maize Silage Added
4.2. Performance of Feed with Maize Silage Added in Pig Raising Systems
4.3. Policy of Forage Planting
4.4. Guidelines for Farmers
5. Conclusions
Supplementary Materials
Author Contributions
Funding
Institutional Review Board Statement
Data Availability Statement
Acknowledgments
Conflicts of Interest
References
- FAO. Food and Agriculture Organization of the United Nations (FAO). 2016. Available online: http://www.fao.org/faostat/zh/#data/QL (accessed on 3 May 2020).
- Wang, X.; Dadouma, A.; Chen, Y.; Sui, P.; Gao, W.; Jia, L. Sustainability evaluation of the large-scale pig farming system in North China: An emergy analysis based on life cycle assessment. J. Clean. Prod. 2015, 102, 144–164. [Google Scholar] [CrossRef]
- Qian, Y.; Song, K.; Hu, T.; Ying, T. Environmental status of livestock and poultry sectors in China under current transformation stage. Sci. Total Environ. 2018, 622–623, 702–709. [Google Scholar] [CrossRef]
- Petersen, S.O.; Dorno, N.; Lindholst, S.; Feilberg, A.; Eriksen, J. Emissions of CH4, N2O, NH3 and odorants from pig slurry during winter and summer storage. Nutr. Cycl. Agroecosyst. 2013, 95, 103–113. [Google Scholar] [CrossRef]
- Zhu, Y.G.; Johnson, T.A.; Su, J.Q.; Qiao, M.; Guo, G.X.; Stedtfeld, R.D.; Hashsham, S.A.; Tiedje, J.M. Diverse and abundant antibiotic resistance genes in Chinese swine farms. Proc. Natl. Acad. Sci. USA 2013, 110, 3435–3440. [Google Scholar] [CrossRef]
- Gutierrez, A.S.; Eras, J.J.C.; Billen, P.; Vandecasteele, C. Environmental assessment of pig production in Cienfuegos, Cuba: Alternatives for manure management. J. Clean. Prod. 2016, 112, 2518–2528. [Google Scholar] [CrossRef]
- M.O.A. Measures for the Administration of Green Food Marks; The Ministry of Agriculture of the People’s Republic of China (MOA): Beijing, China, 2012. [Google Scholar]
- Li, C. Research on the Theory and Practice of Green Stockbreeding Industry; China Agriculture Press: Beijing, China, 2006. [Google Scholar]
- Lyu, Y.; Li, J.; Hou, R.; Zhu, H.; Zhu, W.; Hang, S.; Ouyang, Z. Goats or pigs? Sustainable approach of different raising systems fed by maize silage. J. Clean. Prod. 2020, 254, 120151. [Google Scholar] [CrossRef]
- CGFDC. The Latest Green Food Standard of China; China Green Food Development Center, China Agriculture Press: Beijing, China, 2017. [Google Scholar]
- Dinis, I.; Ortolani, L.; Bocci, R.; Brites, C. Organic agriculture values and practices in Portugal and Italy. Agric. Syst. 2015, 136, 39–45. [Google Scholar] [CrossRef]
- Yun, L.; Li, J.; Hou, R.; Sun, Z.; Cong, P.; Liang, R.; Hang, S.; Gong, H.; Ouyang, Z. Emergy-Based Sustainability Analysis of an Ecologically Integrated Model with Maize Planting for Silage and Pig-Raising in the North China Plain. Sustainability 2019, 11, 6485. [Google Scholar] [CrossRef]
- Wang, J.W.; Qin, C.F.; He, T.; Qiu, K.; Sun, W.J.; Zhang, X.; Jiao, N.; Zhu, W.; Yin, J. Alfalfa-containing diets alter luminal microbiota structure and short chain fatty acid sensing in the caecal mucosa of pigs. J. Anim. Sci. Biotechnol. 2018, 9, 11. [Google Scholar] [CrossRef]
- Wustholz, J.; Carrasco, S.; Berger, U.; Sundrum, A.; Bellof, G. Fattening and slaughtering performance of growing pigs consuming high levels of alfalfa silage (Medicago sativa) in organic pig production. Livest. Sci. 2017, 200, 46–52. [Google Scholar] [CrossRef]
- Vittoz, P.; Hainard, P. Impact of free-range pigs on mountain pastures in the Swiss Jura. Appl. Veg. Sci. 2002, 5, 247–254. [Google Scholar] [CrossRef]
- Kanengoni, A.T.; Chimonyo, M.; Ndimba, B.K.; Dzama, K. Potential of Using Maize Cobs in Pig Diets—A Review. Asian-Australas. J. Anim. Sci. 2015, 28, 1669–1679. [Google Scholar] [CrossRef]
- Mackenzie, S.G.; Leinonen, I.; Ferguson, N.; Kyriazakis, I. Can the environmental impact of pig systems be reduced by utilising co-products as feed? J. Clean. Prod. 2016, 115, 172–181. [Google Scholar] [CrossRef]
- Castellini, C.; Bastianoni, S.; Granai, C.; Bosco, A.D.; Brunetti, M. Sustainability of poultry production using the emergy approach: Comparison of conventional and organic rearing systems. Agric. Ecosyst. Environ. 2006, 114, 343–350. [Google Scholar] [CrossRef]
- Yu, X.H. Meat consumption in China and its impact on international food security: Status quo, trends, and policies. J. Integr. Agric. 2015, 14, 989–994. [Google Scholar] [CrossRef]
- Veysset, P.; Lherm, M.; Bebin, D. Energy consumption, greenhouse gas emissions and economic performance assessments in French Charolais suckler cattle farms: Model-based analysis and forecasts. Agric. Syst. 2010, 103, 41–50. [Google Scholar] [CrossRef]
- Wang, X.; Chen, Y.; Sui, P.; Gao, W.; Qin, F.; Zhang, J.; Wu, X. Emergy analysis of grain production systems on large-scale farms in the North China Plain based on LCA. Agric. Syst. 2014, 128, 66–78. [Google Scholar] [CrossRef]
- Johansson, L.; Lundstrom, K.; Jonsall, A. Effects of RN genotype and silage feed on fat content and fatty acid composition of fresh and cooked pork loin. Meat Sci. 2002, 60, 17–24. [Google Scholar] [CrossRef]
- Mason, F.; Pascotto, E.; Zanfi, C.; Spanghero, M. Effect of dietary inclusion of whole ear corn silage on stomach development and gastric mucosa integrity of heavy pigs at slaughter. Vet. J. 2013, 198, 717–719. [Google Scholar] [CrossRef]
- Presto, M.; Rundgren, M.; Wallenbeck, A. Inclusion of grass/clover silage in the diet of growing/finishing pigs—Influence on pig time budgets and social behaviour. Acta Agric. Scand. Sect. A-Anim. Sci. 2013, 63, 84–92. [Google Scholar] [CrossRef][Green Version]
- Boumans, I.; Bokkers, E.A.M.; Hofstede, G.J.; de Boer, I.J.M. Understanding feeding patterns in growing pigs by modelling growth and motivation. Appl. Anim. Behav. Sci. 2015, 171, 69–80. [Google Scholar] [CrossRef]
- De Lange, C.F.M.; Marty, B.J.; Birkett, S.; Morel, P.; Szkotnicki, B. Application of pig growth models in commercial pork production. Can. J. Anim. Sci. 2001, 81, 1–8. [Google Scholar] [CrossRef]
- Vincek, D.; Sabo, K.; Kusec, G.; Kralik, G.; Durkin, I.; Scitovski, R. Modeling of pig growth by S-function—Least absolute deviation approach for parameter estimation. Arch. Fur Tierz.-Arch. Anim. Breed. 2012, 55, 364–374. [Google Scholar] [CrossRef]
- Yuan, M.; Yi, X.; Chen, Y.; Zhao, K.; Wu, X.; Yang, X.; Liu, L.; Wang, Q. The current stitution, development problems and cultivating suggestion of family farms in china based on the ministry of agriculture special investigation of 343000 sample data. J. China Agric. Resour. Reg. Plan. 2017, 38, 184–188, (Chinese Edition with English Abstract). [Google Scholar]
- Montagne, L.; Le Floc’h, N.; Arturo-Schaan, M.; Foret, R.; Urdaci, M.C.; Le Gall, M. Comparative effects of level of dietary fiber and sanitary conditions on the growth and health of weanling pigs. J. Anim. Sci. 2012, 90, 2556–2569. [Google Scholar] [CrossRef]
- Chen, L.; Gao, L.X.; Zhang, H.F. Effect of Graded Levels of Fiber from Alfalfa Meal on Nutrient Digestibility and Flow of Fattening Pigs. J. Integr. Agric. 2014, 13, 1746–1752. [Google Scholar] [CrossRef]
- Chen, L.; Zhang, H.F.; Gao, L.X.; Zhao, F.; Lu, Q.P.; Sa, R.N. Effect of graded levels of fiber from alfalfa meal on intestinal nutrient and energy flow, and hindgut fermentation in growing pigs. J. Anim. Sci. 2013, 91, 4757–4764. [Google Scholar] [CrossRef]
- Paternostre, L.; De Boever, J.; Millet, S. Interaction between fat and fiber level on nutrient digestibility of pig feed. Anim. Feed. Sci. Technol. 2021, 282, 115126. [Google Scholar] [CrossRef]
- Van Milgen, J.; Valancogne, A.; Dubois, S.; Dourmad, J.Y.; Seve, B.; Noblet, J. InraPorc: A model and decision support tool for the nutrition of growing pigs. Anim. Feed. Sci. Technol. 2008, 143, 387–405. [Google Scholar] [CrossRef]
- Wellock, I.J.; Emmans, G.C.; Kyriazakis, I. Describing and predicting potential growth in the pig. Anim. Sci. 2004, 78, 379–388. [Google Scholar] [CrossRef]
- Nascimento, M.; Nascimento, A.C.C.; Dekkers, J.C.M.; Serao, N.V.L. Using quantile regression methodology to evaluate changes in the shape of growth curves in pigs selected for increased feed efficiency based on residual feed intake. Animal 2019, 13, 1009–1019. [Google Scholar] [CrossRef] [PubMed]
- Tao, Z.; Xiang, Y. Study on the growth cureves of Jinhua Pig. Acta Agric. Zhejiangensis 2004, 16, 99–101. [Google Scholar]
- Waiz, H.A.; Gautam, L.; Waiz, S.A. Appraisal of growth curve in Sirohi goat using non-linear growth curve models. Trop. Anim. Health Prod. 2019, 51, 1135–1140. [Google Scholar] [CrossRef] [PubMed]
- Canaza-Cayo, A.W.; Huanca, T.; Gutierrez, J.P.; Beltran, P.A. Modelling of growth curves and estimation of genetic parameters for growth curve parameters in Peruvian young llamas (Lama glama). Small Rumin. Res. 2015, 130, 81–89. [Google Scholar] [CrossRef]
- Fisher, A.V.; Green, D.M.; Whittemore, C.T.; Wood, J.D.; Schofield, C. Growth of carcass components and its relation with conformation in pigs of three types. Meat Sci. 2003, 65, 639–650. [Google Scholar] [CrossRef]
- Strathe, A.B.; Sorensen, H.; Danfaer, A. A new mathematical model for combining growth and energy intake in animals: The case of the growing pig. J. Theor. Biol. 2009, 261, 165–175. [Google Scholar] [CrossRef][Green Version]
- Odum, H.T.; Brown, M.T.; Brandt-Williams, S. Folio #1. Handbook of Emergy Evaluation; Center for Environmental Policy, University of Florida: Gainesville, FL, USA, 2000. [Google Scholar]
- Odum, H.T. Ecological engineering—The necessary use of ecological self-design. Ecol. Eng. 1994, 3, 115–118. [Google Scholar]
- Brown, M.T.; Ulgiati, S. Energy quality, emergy, and transformity: H.T. Odum’s contributions to quantifying and understanding systems. Ecol. Model. 2004, 178, 201–213. [Google Scholar] [CrossRef]
- Brown, M.T.; Ulgiati, S. Emergy-based indices and ratios to evaluate sustainability: Monitoring economies and technology toward environmentally sound innovation. Ecol. Eng. 1997, 9, 51–69. [Google Scholar] [CrossRef]
- Odum, H.T. Environmental Accounting: Emergy and Environmental Decision Making; Wiley: New York, NY, USA, 1996. [Google Scholar]
- Odum, H.T.; Peterson, N. Simulation and evaluation with energy systems blocks. Ecol. Model. 1996, 93, 155–173. [Google Scholar] [CrossRef]
- Yang, Z.F.; Jiang, M.M.; Chen, B.; Zhou, J.B.; Chen, G.Q.; Li, S.C. Solar emergy evaluation for Chinese economy. Energy Policy 2010, 38, 875–886. [Google Scholar] [CrossRef]
- NBSC. National Bureau of Statistics of China; Gross Domestic Product Deflator of China in 2018 and 2017 Based on 1978. Available online: http://data.stats.gov.cn/search.htm?s=GDP2019 (accessed on 3 May 2020).
- Brambillasca, S.; Fernandez-Garcia, M.; Aguerre, M.; Repetto, J.L.; Cajarville, C. Characterization of the in vitro digestion of starch and fermentation kinetics of dry sorghum grains soaked or rehydrated and ensiled to be used in pig nutrition. J. Cereal Sci. 2019, 89, 102817. [Google Scholar] [CrossRef]
- Bui, H.N.P. Tropical forages for growing pigs. Digestion and nutritive value. Acta Univ. Agric. Suec.-Agrar. 2000, 235. [Google Scholar]
- Dong, Y.; Li, Z.; Wang, R.; Bu, X.; Fu, J.; Dong, X. Study on the problems and countermeasures of returning wheat and corn stalks into the soil in north China. Soil Fertil. Sci. China 2018, 1, 159–163. [Google Scholar]
- Li, X.; Zhu, Z.; Dong, H.; Yang, L.; Guo, H. Characteristics of greenhouse gas emissions from the wheat fields with different returning methods of maize straws. J. Agric. Resour. Environ. 2016, 33, 176–181. [Google Scholar]
- Gao, F.; Li, B.; Ren, B.Z.; Zhao, B.; Liu, P.; Zhang, J.W. Effects of residue management strategies on greenhouse gases and yield under double cropping of winter wheat and summer maize. Sci. Total Environ. 2019, 687, 1138–1146. [Google Scholar] [CrossRef]

| Component | Units | A | B | C | D | E |
|---|---|---|---|---|---|---|
| Sun-dried maize silage | % | 0 | 10 | 40 | 60 | 80 |
| Maize grain | % | 75 | 70 | 35 | 20 | 0 |
| Wheat bran meal | % | 10 | 5 | 10 | 5 | 5 |
| Soya bean meal | % | 15 | 15 | 15 | 15 | 15 |
| Group | Raising Period (Days) | Wt 1 (kg) | CFI 2(kg) |
|---|---|---|---|
| A | 0 | 36.19 ± 6.45 | 0.00 |
| 32 | 48.88 ± 8.17 | 65.58 | |
| 62 | 67.19 ± 12.93 | 138.18 | |
| 138 | 114.67 ± 15.96 | 349.37 | |
| B | 0 | 29.06 ± 5.10 | 0.00 |
| 37 | 43.10 ± 6.99 | 60.40 | |
| 78 | 64.72 ± 12.04 | 177.56 | |
| 122 | 96.87 ± 17.90 | 322.73 | |
| C | 0 | 34.13 ± 10.24 | 0.00 |
| 32 | 44.06 ± 13.10 | 47.55 | |
| 62 | 62.81 ± 17.47 | 116.29 | |
| 138 | 112.00 ± 12.94 | 350.04 | |
| D | 0 | 24.50 ± 1.17 | 0.00 |
| 37 | 42.21 ± 3.32 | 50.91 | |
| 78 | 58.78 ± 3.84 | 122.80 | |
| 122 | 85.33 ± 8.37 | 223.06 | |
| E | 0 | 23.00 ± 3.35 | 0.00 |
| 37 | 39.96 ± 3.86 | 49.28 | |
| 78 | 57.57 ± 4.51 | 119.42 | |
| 122 | 84.10 ± 7.04 | 234.25 |
| Group | Growth Model | R2 | CFI Model | R2 |
|---|---|---|---|---|
| A | Wt = 188.79/(1 + 4.31 × exp(−0.014 × t)) | 0.9994 | CFI = 5.75 × Wt^0.95 − 171.45 | 0.9993 |
| B | Wt = 370.75/(1 + 11.73 × exp(−0.012 × t)) | 0.9999 | CFI = 6.96 × Wt^0.93 − 161.83 | 0.9986 |
| C | Wt = 224.63/(1 + 5.81 × exp(−0.013 × t)) | 0.9981 | CFI = 1.24 × Wt^1.25 − 98.27 | 0.9992 |
| D | Wt = 153.83/(1 + 4.95 × exp(−0.015 × t)) | 0.9953 | CFI = 1.10 × Wt^1.25 − 62.06 | 0.9977 |
| E | Wt = 148.62/(1 + 5.16 × exp(−0.016 × t)) | 0.9970 | CFI = 0.47 × Wt^1.44 − 43.96 | 0.9997 |
| Raising Period (Days) | Item | Unit | A | B | C | D | E |
|---|---|---|---|---|---|---|---|
| 60 | Final weight | kg | 71.78 | 72.59 | 71.27 | 70.95 | 71.86 |
| Total feed consumed | kg | 142.11 | 157.93 | 130.91 | 116.28 | 126.57 | |
| 120 | Final weight | kg | 110.12 | 121.93 | 112.14 | 103.97 | 104.68 |
| Total feed consumed | kg | 309.38 | 387.86 | 324.78 | 255.49 | 286.22 | |
| 180 | Final weight | kg | 143.78 | 184.11 | 153.06 | 128.53 | 127.58 |
| Total feed consumed | kg | 453.74 | 668.25 | 537.66 | 366.72 | 411.97 | |
| 240 | Final weight | kg | 166.01 | 246.57 | 184.43 | 142.33 | 139.58 |
| Total feed consumed | kg | 548.16 | 943.05 | 711.02 | 431.68 | 482.04 | |
| 300 | Final weight | kg | 178.08 | 296.55 | 203.91 | 148.89 | 144.93 |
| Total feed consumed | kg | 599.14 | 1159.30 | 822.52 | 463.13 | 514.20 | |
| 360 | Final weight | kg | 183.94 | 329.76 | 214.47 | 151.76 | 147.15 |
| Total feed consumed | kg | 623.83 | 1301.50 | 884.10 | 477.01 | 527.67 |
| Index | Units | Days | 60 | 120 | 180 | 240 | 300 | 360 | |
|---|---|---|---|---|---|---|---|---|---|
| Groups | |||||||||
| Emergy yield ratio (EYR) | - | A | 1.267 | 1.547 | 1.757 | 1.853 | 1.886 | 1.879 | |
| B | 1.275 | 1.635 | 2.033 | 2.358 | 2.586 | 2.696 | |||
| C | 1.194 | 1.460 | 1.729 | 1.911 | 2.014 | 2.050 | |||
| D | 1.143 | 1.299 | 1.410 | 1.455 | 1.469 | 1.465 | |||
| E | 1.128 | 1.275 | 1.379 | 1.418 | 1.428 | 1.423 | |||
| Emergy sustainability index (ESI) | - | A | 0.363 | 0.480 | 0.569 | 0.608 | 0.627 | 0.631 | |
| B | 0.364 | 0.507 | 0.665 | 0.790 | 0.883 | 0.931 | |||
| C | 0.345 | 0.468 | 0.592 | 0.674 | 0.729 | 0.755 | |||
| D | 0.323 | 0.399 | 0.456 | 0.479 | 0.496 | 0.504 | |||
| E | 0.319 | 0.395 | 0.451 | 0.473 | 0.488 | 0.496 | |||
| Environmental loading ratio (ELR) | - | A | 3.488 | 3.224 | 3.087 | 3.047 | 3.006 | 2.979 | |
| B | 3.507 | 3.224 | 3.057 | 2.986 | 2.929 | 2.897 | |||
| C | 3.463 | 3.121 | 2.919 | 2.834 | 2.763 | 2.716 | |||
| D | 3.543 | 3.260 | 3.094 | 3.036 | 2.965 | 2.910 | |||
| E | 3.533 | 3.230 | 3.054 | 2.994 | 2.924 | 2.869 | |||
| Unit emergy value (UEV) | seJ/kg | A | 6.94 × 10¹² | 5.87 × 10¹² | 5.42 × 10¹² | 5.31 × 10¹² | 5.30 × 10¹² | 5.37 × 10¹² | |
| B | 6.90 × 10¹² | 5.60 × 10¹² | 4.89 × 10¹² | 4.54 × 10¹² | 4.36 × 10¹² | 4.29 × 10¹² | |||
| C | 6.46 × 10¹² | 5.24 × 10¹² | 4.75 × 10¹² | 4.61 × 10¹² | 4.57 × 10¹² | 4.59 × 10¹² | |||
| D | 6.23 × 10¹² | 5.07 × 10¹² | 4.66 × 10¹² | 4.61 × 10¹² | 4.63 × 10¹² | 4.72 × 10¹² | |||
| E | 6.07 × 10¹² | 4.94 × 10¹² | 4.59 × 10¹² | 4.58× 10¹² | 4.63 × 10¹² | 4.72 × 10¹² | |||
| Days | Units | 60 | 120 | 180 | 240 | 300 | 360 | |
|---|---|---|---|---|---|---|---|---|
| Group | ||||||||
| A | ¥/kg | 16.08 | 19.05 | 20.32 | 20.70 | 20.76 | 20.63 | |
| B | ¥/kg | 16.45 | 20.13 | 22.06 | 23.00 | 23.47 | 23.65 | |
| C | ¥/kg | 16.94 | 20.30 | 21.79 | 22.34 | 22.57 | 22.61 | |
| D | ¥/kg | 17.35 | 20.49 | 21.68 | 21.97 | 22.01 | 21.89 | |
| E | ¥/kg | 17.67 | 20.78 | 21.88 | 22.10 | 22.09 | 21.95 | |
Publisher’s Note: MDPI stays neutral with regard to jurisdictional claims in published maps and institutional affiliations. |
© 2022 by the authors. Licensee MDPI, Basel, Switzerland. This article is an open access article distributed under the terms and conditions of the Creative Commons Attribution (CC BY) license (https://creativecommons.org/licenses/by/4.0/).
Share and Cite
Lyu, Y.; Li, J.; Hou, R.; Zhang, Y.; Hang, S.; Zhu, W.; Zhu, H.; Ouyang, Z. Precision Feeding in Ecological Pig-Raising Systems with Maize Silage. Animals 2022, 12, 1446. https://doi.org/10.3390/ani12111446
Lyu Y, Li J, Hou R, Zhang Y, Hang S, Zhu W, Zhu H, Ouyang Z. Precision Feeding in Ecological Pig-Raising Systems with Maize Silage. Animals. 2022; 12(11):1446. https://doi.org/10.3390/ani12111446
Chicago/Turabian StyleLyu, Yun, Jing Li, Ruixing Hou, Yitao Zhang, Sheng Hang, Wanxue Zhu, He Zhu, and Zhu Ouyang. 2022. "Precision Feeding in Ecological Pig-Raising Systems with Maize Silage" Animals 12, no. 11: 1446. https://doi.org/10.3390/ani12111446
APA StyleLyu, Y., Li, J., Hou, R., Zhang, Y., Hang, S., Zhu, W., Zhu, H., & Ouyang, Z. (2022). Precision Feeding in Ecological Pig-Raising Systems with Maize Silage. Animals, 12(11), 1446. https://doi.org/10.3390/ani12111446


