Simple Summary
Advances in proteomics and bioinformatics analysis offer the potential to investigate nutrients’ influence on protein expression profiles, and consequently on biological processes, molecular functions, and cellular components. However, knowledge in this area, particular about the exact way selenium modulates protein expression, remains limited. Therefore, in this project, global differential proteomic experiments were carried out in order to identify changes in the expression of proteins in animal tissues obtained from lambs on a specific diet involving the addition of a combination of different supplements, namely, inorganic selenium compounds, fish oil, and carnosic acid. Following inorganic selenium supplementation, a protein-protein interaction network analysis of forty differentially-expressed proteins indicated two significant clusters.
Abstract
Selenium is an essential nutrient, building twenty five identified selenoproteins in humans known to perform several important biological functions. The small amount of selenium in the earth’s crust in certain regions along with the risk of deficiency in organisms have resulted in increasingly popular dietary supplementation in animals, implemented via, e.g., inorganic selenium compounds. Even though selenium is included in selenoproteins in the form of selenocysteine, the dietary effect of selenium may result in the expression of other proteins or genes. Very little is known about the expression effects modulated by selenium. The present study aimed to examine the significance of protein expression in lamb tissues obtained after dietary supplementation with selenium (sodium selenate) and two other feed additives, fish oil and carnosic acid. Label-free mass spectrometry-based proteomic analysis was successfully applied to examine the animal tissues. Protein-protein interaction network analysis of forty differently-expressed proteins following inorganic selenium supplementation indicated two significant clusters which are involved in cell adhesion, heart development, actin filament-based movement, plasma membrane repair, and establishment of organelle localization.
1. Introduction
Selenium (Se) is an essential nutrient important for biological functions [1]. Selenium plays a notable role in the antioxidant defense system [2]. The various selenium compounds are known to possess anti-cancer properties [3] and have the ability to reduce the activity of viruses, including HIV [4]. Small Se amounts in the earth’s crust in certain regions [5] along with the risk its deficiency poses to living organisms has resulted in the increased popularity of dietary supplementation in animals, implemented via inorganic or organic selenium compounds [6,7,8,9,10] and even elemental selenium nanoparticles [11,12] present in food additives. The evidence for an effect of selenium supplementation on increased selenoenzymes activity exists, although any association with physiological and clinical effects is not well defined [13]. The effect of a selenium-rich diet on selenoprotein gene expression has been determined in various animals and in different tissues [14,15,16,17,18], and has been proven to depend on supplemented forms of Se [16]; investigation of chicken tissues has demonstrated that 2-hydroxy-4-methylselenobutanoic acid takes part in the regulation of selenoprotein gene expression (SELENOP, SELENOU and GPX4) when compared to other selenium forms, such as sodium selenate and selenised yeast. Several studies have confirmed that Se may predominantly affect the genes encoding proteins and plays a role in protein biosynthesis, e.g., increased Se consumption caused the growth of selenoproteins production and strengthened lymphocyte function, which is related to the upregulation of ribosomal protein and translation factor genes [19]. Even though Se is incorporated into selenoproteins as selenocysteine during translation, the dietary effects of selenium supplementation may result in the expression of other proteins or genes. Although knowledge on the modulation of expression as a result of Se nutrition remains unexplained, advanced genomic technology provides the opportunity to examine gene expression profiles and their influence on cellular function. Therefore, in order to identify changes in protein expression, the evaluation of the results of quantitative protein analysis is carried out here using powerful bioinformatics software tools [20,21,22].
Naturally low selenium concentrations in biological samples as well as their complex matrix make speciation analysis challenging, especially when quantitative analysis is considered. The determination of the total content of trace amounts of Se, which is essential in respect of the extraction efficiency, is not problematic if a sufficiently sensitive and selective detection method is used [23,24,25,26,27,28]. When thinking about speciation, one must consider the combination of an effective separation followed by well-designed detection. First, high-pressure liquid chromatography (HPLC) seems to be most suitable, especially when combined with ICP-MS (HPLC-ICP-MS) [15,29,30]. In the case of HPLC-ICP-MS, the compatibility of the retention times of respective standards with those of the compounds used is considered to be proof of its presence in a sample. Although this is admittedly sufficient evidence of the presence of a particular substance for which standards are available, many signals remain unspecified due to lack of availability of the corresponding standards [30]. Thus, HPLC-ICP-MS as such is not suitable for proteomic analysis and needs to be verified by additional studies in order to avoid mistakes resulting from overlapping signals from different compounds occurring at the same retention time. Essential confirmation is possible with the use of tandem mass spectrometry (MS/MS) equipped with an electrospray ionization source (ESI) [30].
Mass spectrometry-based (MS) proteomics has grown significantly within the last several years. The preparation of samples, the efficiency of separation techniques, and the continuously evolving and improving performance of instruments for accurate high-resolution mass analysis (HRMA) play an important role in proteomic analysis. Furthermore, newly developed computational algorithms as along with progressively improving development and validation of databases have enhanced the effectiveness and reliability of protein identification. Recent rapidly-developing innovative labelling [31] and label-free [14,32,33,34] techniques and appropriate proteomic software have strengthened the accuracy of quantitative analysis. In fact, such development and expansion have provided the opportunity to identify more up- or downregulated proteins, e.g., in experiments exploring the effects of different supplemental components, thereby advancing a deeper comprehension of biological processes. Considering the extensive amount of data generated from a single proteomic analysis, it is crucial to use specific algorithms in order to identify expression patterns that correlate with a particular biological/pathological phenotype from multiple samples [35]. The methodology described above can be used to explain how different forms of nutrients moderate their impact on tissue Se content and gene expression in animals. Moreover, advanced technologies can be used both to indicate changes in protein expression as a result of diet [36] and to identify specific biomarkers related to meat production [37,38]. Proteomic or metabolomic assays can additionally be used to monitor the health of farm animals, such as horses [39,40,41], greyhounds [42,43], camels [44] and chicken [38].
The objective of the project was to utilize advanced bioinformatics tools in order to evaluate results obtained via label-free proteomics analysis of heart tissues retrieved from lambs fed a diet enriched with an inorganic selenium compound, sodium selenate (Se(VI)), with the addition of fish oil (FO) and carnosic acid (CA). The additives in the lambs’ diets did not adversely affect the animal’s well-being or overall state of health, as no pathological or macroscopic variation was observed in the examined lambs in our previous studies [7,8,9,15]. According to the current literature, no previous studies have examined the effects of a combination of FO and CA with selenium compound supplementation on global changes in protein expression. Considering the few publications with results in farm animal samples, a continuation of the earlier studies [14,15] was proposed.
2. Materials and Methods
2.1. Sheep, Rations, Dietary Supplementation, and Tissue Collection
All nutritional experiments were carried out on male sheep (Corriedale) fed with rations including extra Se supplementation. All investigations were conducted on sheep in accordance with the guidelines of the third Local Commission of Animal Experiment Ethics located at the Warsaw University of Life Sciences (WULS), Poland. Welfare guidelines and animal handling dealing were carefully adhered to throughout the whole period of our investigations conducted on animals. All nutritional studies on sheep and heart collections were performed in professional farm animal laboratory rooms located at the Kielanowski Institute of Animal Physiology and Nutrition (Polish Academy of Sciences) in Jabłonna near Warsaw (Poland) [14,16,37].
Thirty sheep in the age range of 82–90 days (average body weight of sheep: 24.3 kg ± 1.6 kg) at the start of studies were individually located in pens; the length, width, and height of each pen were 170 cm, 130 cm, and 150 cm, respectively. During a three-week initial period, all sheep had free and unlimited access to drinking water (tap water) as well as to a basal diet (BD) supplemented with a mixture containing vitamins and minerals (20 g/kg of the BD), rapeseed oil (30 g/kg of the BD or 20 g/kg of the BD), and odourless FO (10 g/kg of the BD) [15].
The BD is the standard ration (a concentrated hay ration) consisting of the following components: meadow hay, a mixture of barley meal and soybean meal, wheat starch, and a mixture containing vitamins and minerals (aPL–1 405 002 p). The chemical composition of the ingredients in the BD and the fatty acid levels in rapeseed oil (RO) and odourless FO have been presented in previous papers [15].
Individuals (six per each experimental group) from the following groups were randomly selected for the study: Group 0 (20 g of RO, 10 g of FO and 1 g of CA in 1 kg of the BD) was the control group and Group SeVI (20 g of RO, 10 of FO, 1 g of CA and 0.35 mg Se as Se(VI) in 1 kg of the BD) was named the inorganic selenium supplementation group. Importantly, Se(VI) is a less reactive compound than selenite. In fact, dietary selenite can react in the digestive tract, particularly in a rumen, with dietary components, especially those with thiol groups or disulfide groups like cystine [9,45,46]. The product of these reactions is elemental Se (Se0), which in the anaerobic ruminal environment is unreactive. As a consequence, Se0 is efficiently excreted in faeces of lambs.
After a 35-day period of feeding with the experimental diets followed by fasting for 12 h, all sheep were rendered unconscious via xylazine (i.e., intra-muscular injections: ~ 0.4 mg xylazine per kg of lambs’ body mass). Next, animals were rapidly slaughtered. Anaesthesia of the sheep and collection of selected tissues were performed in accordance with the Regulation of the European Union Council (No. 130 1099/2009; 24 September 2009) on the Protection of Animals at the Time of Killing and in accordance with the third Local Commission of Animal Experiment Ethics located at WULS (Warsaw, Poland; protocol code: 41/2013; date of approval: 17 July 2013). After the sheep were euthanized, heart tissues were removed immediately from each animal along with the internal organs and then each organ was homogenized. All tissue samples for proteomics analysis were placed into tightly closed containers. These containers were immediately frozen to −80 °C to await analytical investigation. Only heart samples were used for these experiments. The total content of selenium in heart tissues in Group 0 and in Group SeVI was, respectively, (871.2 ± 59.5) µg/kg and (1138.5 ± 103.5) µg/kg, as previously published [15]. The details concerning the chemical profiles of the heart tissues from both groups have been well-described in previously published studies [15].
2.2. Dietary Supplements, Reagents, and Analytical Tools
Analytical-grade reagents, chromatographic solvents, and standards were obtained from Promega (Madison, WI, USA), Merck (Darmstadt, Germany), Thermo Scientific (Bartlesville, OK, USA), and EMD Millipore (Madison, WI, Germany). Deionized water obtained from the Milli-Q system (18.2 MΩ cm; EMD Millipore; Darmstadt Germany) was used for samples and standard dilution. The dietary supplement carnosic acid (CA) was supplied by Hunan Geneham Biomedical Technology Ltd. (The People’s Republic of China; Changsha Road), and odourless FO (enriched in n-3LPUFA) and RO were obtained from the company “AGSOL” (Pacanów, Poland). The energy levels of RO and odourless FO were 37.02 MJ/kg of RO and 36.81 MJ/kg of FO. Samples of the vitamin and mineral premix were purchased from POLFAMIX OK by Trouw-Nutrition (Grodzisk-Mazowiecki, Poland).
The analytical instrumentation used for sample preparation was as follows: an Ultra-Turrax mechanical homogenizer (IKA, Königswinter, Germany), CLN 240 laboratory incubator (MultiSerw, Brzeźnica, Poland), SpeedVac Concentrator Plus vacuum concentrator (Eppendorf, Enfield, CT, USA), 5804/5804 R centrifuge (Eppendorf, Enfield, CT, USA), vortex shaker (IKA, Königswinter, Germany), and Eppendorf Comfort thermomixer (Eppendorf, Enfield, CT, USA). An in-house-packed capillary C-18 column (75 μm × 500 mm, particle size 1.9 μm) (Dr. Maisch, Ammerbuch, Germany) was employed for peptide separations using a nano-UHPLC system (Dionex Ultimate 3000 RSLC, Thermo Scientific, Enfield, CT, USA) coupled to a high-resolution tandem mass spectrometer (Orbitrap Fusion Tribrid™ Mass Spectrometer, Thermo Scientific, Enfield, CT, USA).
2.3. Sample Preparation, LC-MS/MS Analysis, and Data Analysis for Relative Protein Quantification
Sample preparation for proteomics study and the conditions of liquid chromatography with tandem mass spectrometry (LC-MS/MS) were described in detail in our recent paper [34]. Analysis of MS/MS raw data was performed using MaxQuant version 1.6.1.0 (Max-Planck-Institute of Biochemistry, Martinsried, Germany) and searched by the Andromeda search engine [47,48]. The Ovis aries sequence was obtained from the UniProt database (n = 23,111 protein isoforms, retrieved December 2021). Fixed modification, which derived from acrylamide as an alkylating agent, was as follows: for propionamidation on cysteine, Se-cysteine, Se-methionine, and oxidation of Se-cysteine, Se-methionine and oxidation of methionine and acetylation of protein N-terminal were set as variable modifications. Trypsin was set as a site-specific enzyme with no more than two missed cleavage sites. In the main search, mass tolerances of 5 ppm for parent ions and 10 ppm for fragment ions were acceptable. As an instrument type, an Orbitrap was selected. Due to the fact that labelling was not carried out, the multiplicity was set at one. Only peptides at least seven amino acids in length were used for evaluation. The search for common contaminants is considered in the operating protocol of the MaxQuant algorithm. The IDs were each filtered at a false discovery rate (FDR) of 0.01 at the PSM (peptide spectrum matching) level as well as at the protein level, using a target–decoy method to search for false discoveries. The quantification of proteins was assessed using label-free quantification (LFQ), including only razor and unique peptides. In this case, LFQ was chosen, with MS/MS as required for LFQ matching. Concerning protein quantification, a minimum ratio count of two was set. However, the other settings of MaxQuant were configured as their defaults, following the protocol proposed by Tyanova et al. [48]. The intensity of LFQ is the relative quantification of the protein within all samples, and is used instead being represented by the normalised intensity profile generated following the MaxQuant algorithms [49].
Any files retrieved using MaxQuant were subsequently analysed using the Perseus framework, available online at http://www.perseus-framework.org [50], accessed on 31 December 2021. Perseus software (version 1.6.14.0, Max-Planck-Institute of Biochemistry, Martinsried, Germany) was utilised to complete the bioinformatics and statistical analysis, employing the output files from MaxQuant. All MaxQuant data were further filtered for protein identifications based on sites only, potential contaminants, and reverse identifications (false positives). Converted LFQ intensities were then transformed into logarithmic values, and missing data were overwritten by the imputation of missing values following a normal distribution. An additional stage was the conversion of the LFQ intensity ratio into log2. After that, the rows were filtered against valid values, with at least eight values in at least one group. Any missing values were replaced by a normal distribution using the imputation feature. Finally, the mean LFQ intensity and standard error of the mean were computed for all experimental groups. In order to achieve an estimation of the variabilities between biological replicates of the examined tissue samples, Student’s t-test was implemented using Perseus software with very stringent statistical criteria: FDR = 1%; s0 = 1; adjusted p < 0.01.
2.4. Metrological Aspects of Relative Protein Quantification
A reproducible chromatographic separation is the most essential requirement in reliably comparing different runs, and provides sufficient quantitative information concerning the analysed proteome. Prior to analysis, it is important to check and examine the working conditions for the chromatography and the stability of the selected parameters, such as peak widths, peak shapes, resolution, and retention time. The LC-MS/MS instrument was verified on a daily basis while performing accurate mass measurements of peptides and proteins. In order to check the stability of mass spectrometry during measuring sequences, a quality control sample (QC) was prepared by mixing all the samples from the whole experiment. The use of complex control solutions increases the probability of peptide co-elution, which impedes the process of data analysis. The QC sample was measured before and after experiments and between each experimental group.
3. Results
In the course of LC–MS/MS analysis in the present study, 2230 proteins (13764 unique peptides) and 2308 proteins (13858 unique peptides) were detected in Group 0 and Group SeVI, respectively. The overview of the proteomic analysis shown in Figure 1 indicates less than 20% characteristic for each group of proteins among all identified. There were 1917 proteins common to groups 0 and SeVI, while 313 proteins (14%) were unique to Group 0 and 391 (17%) to Group SeVI (Figure 1a). Through data analysis, a significant difference in the expression level of forty proteins was found between the examined groups (Figure 1b; Table 1) after applying very stringent statistical criteria (FDR = 1%; s0 = 1; adjusted p < 0.01).
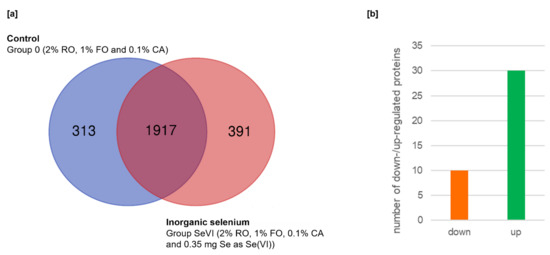
Figure 1.
Overview of proteomics analysis: (a) the overlap between all identified proteins in Group 0 and Group SeVI, shown as a Venn diagram; (b) The number of up- and downregulated proteins obtained by comparing Group 0 and Group SeVI.

Table 1.
The list of up- (↑) and down- (↓) regulated proteins in Group 0 (2% RO, 1% FO and 0.1% CA) in comparison with Group SeVI (2% RO, 1% FO, 0.1% CA and 0.35 mg Se as Se(VI) in 1 kg BD); FDR = 1%; s0 = 1; adjusted p < 0.01.
Following this step, a gene ontology (GO) enrichment analysis was applied to the identified differentially-expressed proteins. Gene ontology analysis classifies function into the categories of cellular components, molecular function, and biological process. The top ten enrichments in (i) the biological processes category were regulation of cardiac muscle cell action potential, cytoskeleton organization, muscle structure development, regulation of cardiac muscle cell contraction, plasma membrane repair, muscle cell differentiation, regulation of ventricular cardiac muscle cell action potential, regulation of heart contraction, actin filament-based process, and regulation of actin filament-based process (Figure 2a); in (ii) the molecular function category they were actin filament binding, actin binding, cytoskeletal protein binding, cell adhesion molecule binding, actin-dependent ATPase activity, microfilament motor activity, protein-containing complex binding, cadherin binding, structural molecule activity, and kinase binding (Figure 2b); and in (iii) the cellular component category they were cytoskeleton, actin cytoskeleton, supramolecular complex, supramolecular fiber, intracellular non-membrane-bounded organelle, fascia adherens, sarcomere, protein-containing complex, cytoplasm, and myosin complex (Figure 2c). A GO classification was performed for all identified high-confidence differentially-expressed proteins using the STRING environment (http://string-db.org/), accessed on 31 December 2021.
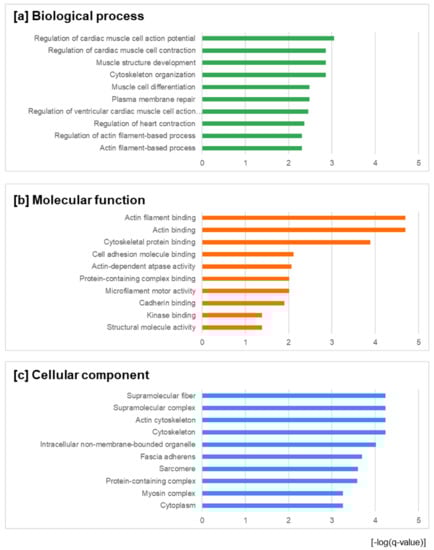
Figure 2.
Gene ontology enrichment analysis of the identified differentially-expressed proteins in three categories: (a) biological process; (b) molecular function; and (c) cellular components. The abscissa was the –log (q-value) in order to show the significance between the proteins involved in feature function and annotation; this parameter describes the significance of the enrichment. The displayed q-values are corrected FDR values for multiple testing within each category, for which the Benjamini–Hochberg procedure was used.
Protein-protein interaction (PPI) network analysis supports an understanding of the biological responses of inorganic selenium supplementation. The STRING framework [22] was employed to establish comprehensive networks using the same criteria as applied in the GO analysis. Regarding protein interactions, the minimum required interaction score was assigned a high confidence of 0.7, and the maximum additional interactors were determined to be 0. Abbreviated protein names used in the networks are listed in Table 1. The protein-protein interaction results obtained from the STRING environment illustrate the association of differentially-expressed proteins, with other major associations shown in Figure 3.
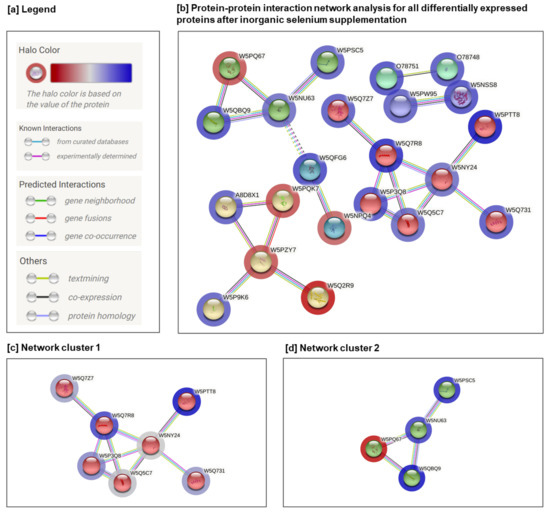
Figure 3.
Protein-protein interaction network of differentially regulated proteins after inorganic selenium supplementation with the addition of 2% RO, 1% FO, 0.1% CA: (a) legend; (b) protein–protein interaction network analysis for all differentially expressed proteins; (c,d) two interactions between protein complexes from the STRING database formed by means of the Markov Cluster Algorithm. The number of lines represents the strength of predicted functional interactions between proteins.
The PPI analysis demonstrated 40 nodes (proteins) and 157 edges, with the following statistical parameters: (i) average node degree, 2.7; (ii) average local clustering coefficient, 0.494; (iii) expected number of edges, 28; and (iv) PPI enrichment p-value, 1.29 × 10⁻⁵ Essentially, this means that proteins have significantly more interactions among themselves than was expected from a random set of proteins of the same size and degree distribution drawn from the genome. However, such enrichment highlights that these proteins are at least in part biologically associated as a group. The identified clusters are shown coloured in red, green, and yellow. The solid and dotted lines indicate connections within the same and different clusters, respectively. Different colours indicate different types of interaction: cyan were from curated databases; pink were experimentally determined; blue from gene co-occurrence; red from gene fusion; green from gene neighbourhood; light blue from protein homology; black from co-expression; and yellow from text mining. The level of expression is depicted with a coloured halo of proteins (Figure 3a,b).
The cluster analysis of forty differentially-expressed proteins indicated several significant clusters found with the Markov Cluster Algorithm (MCL) [51]. Among these, network cluster 1 (Figure 3c) contained seven proteins (average local clustering coefficient: 0.829; PPI enrichment p-value: 3.8 × 10⁻¹⁰) network cluster 2 (Figure 3d) contained four proteins (average local clustering coefficient: 0.833; PPI enrichment p-value: 8.07 × 10⁻⁹), respectively. Other identified clusters (yellow, blue, and violet) either consisted of a small number of proteins or no significant enrichment was detected between interactions.
4. Discussion
The function analysis of cluster 1 indicated the following group of proteins: junction plakoglobin (W5Q7R8); four and a half LIM domains 2 (W5PTT8); and desmoplakin (W5Q7Z7). In the GO analysis of the biological processes, cluster 1 was mostly enriched in cell adhesion (FDR = 0.00026); bundle of cell purkinje myocyte adhesion, involved in cell communication (FDR = 0.0074); and heart development (FDR = 0.0083). The abundance of these proteins respectively increased by ↑+2.11, ↑+2.43, ↑+1.50 when comparing the control group with the inorganic selenium supplementation group. The four and a half LIM domains 2 (W5PTT8) protein belongs to a large family of LIM domain-containing proteins that are involved in a broad spectrum of functions, including cell identity, differentiation, and growth control [52]. The LIM domain is a cysteine-rich zinc-binding motif that contains a double zinc finger domain (C2CH and C4). Reflecting this dual nature of the FHL2 is that it can act as a repressor or activator of transcriptional activity depending on the cell- type [53]. This functional diversity of the FHL2 is a result of its structural configuration as an LIM-only protein. The LIM domains are non-enzymatically active in protein–protein interaction as well as being crucial for the function of LIM proteins as adaptor molecules or scaffold proteins. As a result of the selective utilisation of different LIM-domains for protein–protein interactions, FHL2 can interact with a wide range of functionally unrelated proteins, activating various signalling pathways [52].
Another key protein in cluster 1 is junction plakoglobin (W5Q7R8), which is a common junctional plaque protein. The membrane-associated plaques are strategic structural elements that affect the distribution and function of either the cytoskeleton or the cells [54]. However, the presence of plakoglobin in the desmosomes as well as in the intermediate junctions strongly suggests a major role of plakoglobin in the structure and function of submembrane plaques. A plakoglobin acts as a substrate for the vascular endothelial protein tyrosine phosphatase (VE-PTP), and is needed to promote VE-cadherin function in endothelial cells. The plakoglobin can substitute beta-catenin in E-cadherin/catenin adhesion complexes, considered to be a conjugating factor between cadherins and the actin cytoskeleton. The last protein of interest in network cluster 1 is desmoplakin DSP (W5Q7Z7), which is encoded by the DSP gene. It is a major desmosome component that is abundant and richly presented in myocardial tissue. As such, three isoforms of DSP exist, which perform a functional role in contributing to structural stability via intercellular adhesion [55]. In addition, desmoplakin has been reported [55] to regulate the transcription of adipogenic and fibrogenic genes and to maintain proper electrical conductivity through the regulation gap junctions and ion channels. A desmoplakin is essential for normal myocardial development and the maintenance of its structural functions [56]. The increased abundance of the mentioned proteins in cluster 1 in the control group in comparison with inorganic selenium supplementation suggests that the process of cell adhesion and maintenance of structural functions in the heart become less efficient after inorganic selenium supplementation.
Interestingly, the myosin family proteins myosin light chain 4 (W5PQ67; ↑↓−1.51), myosin heavy chain 10 (W5NU63; ↑+1.26), myosin IC (W5PSC5; ↑+1.46), and myosin heavy chain 9 (W5QBQ9; ↑+1.69), which have close interactions, were found in the network as cluster 2 (Figure 3d) in the GO analysis, indicating actin filament-based movement (FDR = 0.0017), plasma membrane repair (FDR = 0.0117), and establishment of organelle localization (FDR = 0.0470). All of the mentioned proteins belong to the myosin superfamily, which is a large and diverse protein family involved in several cellular pathways [57,58]. Myosin family proteins are mostly associated with membranes [58]; thus, they play additional roles as motors, especially for the transport of membranous organelles within actin filaments. Transport of vesicles to their destinations is executed by motor proteins, which move along microtubules or microfilaments. One of the superfamilies of such motor proteins are the myosins [59]. While kinesins and dyneins transport vesicles along microtubules, myosins carry out the transport along microfilaments. Nedvetsky et al. [59] have reported that the myosin Vb plays a crucial role in the aquaporin-2 recycling cycle. Aquaporins are transmembrane channel proteins, which facilitate the passive and bidirectional diffusion of water and/or small and noncharged compounds across biological membranes [60], including the selenium compounds [61] that may be associated in this study with a selenium-containing diet.
However, the expression of myosin chain family proteins was found to either increase or decrease depending on the type of proteins, which is in contrast to the results reported in the literature [62]. Fernández-Lázaro et al. [62] found that no significant effects were observed in myosin heavy chain expression in muscle tissue after oral selenium supplementation with 180 µg/day or 240 µg/day in the form of selenomethionine or with 200 µg/day in the form of sodium selenite, although the changes in protein expression observed in their study might have been different if the analysis was done on heart tissues only, as in the present study. Gene ontology enrichment analysis performed for the identified differentially-expressed proteins (Figure 2) indicated biological processes including plasma membrane repair, muscle structure development, and cytoskeleton organization, which confirms the positive effects of a diet enriched in Se on body function reported in several previous studies [15,63,64,65,66,67,68,69,70,71]. The cytoskeleton has been indicated as a biological process in functional annotation analysis of differentially expressed genes as a result of high dietary selenium supplementation in sheep reported by Elgendy et al. [72].as.
It is worth emphasizing that similar proteomic studies of the effects of selenium supplementation have been conducted on humans, although these were limited to plasma samples. Sinha et al. [73] reported that in healthy male subjects, 22 proteins were significantly altered following Se-Yeast supplementation compared to 13 proteins that were significantly changed after placebo-yeast supplementation. In their study, the differentially expressed proteins were involved in complementary and coagulation pathways, immune functions, lipid metabolism, and insulin resistance.
In general, the above-mentioned studies demonstrate that Se nutrition has a significant effect on protein expression in animals. The results of the conducted studies indicate the of changes in protein expression under the action of diets enriched in selenium in addition to other supplements. The performed proteomic analysis and protein–protein interactions may be useful in exploring the effects of this type of supplementation on the body for further studies in this field.
5. Conclusions
A label-free mass spectrometry-based proteomic approach was performed for the identification of several differentially-expressed proteins following inorganic selenium supplementation. An application of protein–protein interaction network analysis on forty differentially-expressed proteins indicated two significant clusters involved in cell adhesion, heart development, actin filament-based movement, plasma membrane repair, and establishment of organelle localization. A number of biological processes in which the identified proteins are involved were confirmed in the relevant literature. Furthermore, the elevated expression of proteins was found to be connected in two significant clusters involved in cell adhesion, heart development, actin filament-based movement, plasma membrane repair, and establishment of organelle localization.
Author Contributions
Conceptualization, E.B., M.C., A.R. and A.G.; methodology, E.B., A.R., A.K. and A.G.; software, A.R., A.K. and A.G.; validation, E.B., A.R., A.K. and A.G.; formal analysis, E.B., A.R., G.W. and A.G.; investigation, M.C., E.B. and A.G.; resources, E.B. and M.C.; data curation, M.C., E.B. and A.G.; writing—original draft preparation, A.R., M.C., E.B. and A.G.; writing—review and editing, A.R., M.C., A.K., E.B. and A.G.; visualization, A.R., G.W. and A.G.; supervision, E.B.; funding acquisition, A.R., A.G. and E.B. All authors have read and agreed to the published version of the manuscript.
Funding
The study was co-financed by “Excellence Initiative–Research University (2020–2026)” under the programme of the Ministry of Science and Higher Education of Poland.
Institutional Review Board Statement
The animal study protocol was approved by the Third Local Commission of Animal Experiment Ethics at the Warsaw University of Life Sciences (protocol code: 41/2013; date of approval: 17 July 2013).
Informed Consent Statement
Not applicable.
Data Availability Statement
The authors confirm that the data supporting the findings of this study are available within the article. Raw data that support the findings of this study are available from the first author upon reasonable request.
Acknowledgments
The study was carried out at the Biological and Chemical Research Centre, University of Warsaw, established within the project co-financed by the European Union from the European Regional Development Fund under the Operational Programme Innovative Economy 2007–2013. The study was carried out in the laboratories of the University of Warsaw, accredited in accordance with ISO/IEC 17025. General requirements for the competence of testing and calibration laboratories (accreditation number: AB 1525) by the Polish Centre for Accreditation.
Conflicts of Interest
The authors declare no conflict of interest.
References
- Hoffmann, P.R.; Berry, M.J. The Influence of Selenium on Immune Responses. Mol. Nutr. Food Res. 2008, 52, 1273–1280. [Google Scholar] [CrossRef] [PubMed]
- Sentkowska, A.; Pyrzyńska, K. Investigation of Antioxidant Activity of Selenium Compounds and Their Mixtures with Tea Polyphenols. Mol. Biol. Rep. 2019, 46, 3019–3024. [Google Scholar] [CrossRef] [PubMed] [Green Version]
- Yoshizawa, K.; Willett, W.C.; Morris, S.J.; Morris, S.J.; Stampfer, M.J.; Spiegelman, D.; Rimm, E.B.; Giovannucci, E. Study of Prediagnostic Selenium Level in Toenails and the Risk of Advanced Prostate Cancer. J. Natl. Cancer Inst. 1998, 90, 1219–1224. [Google Scholar] [CrossRef] [PubMed]
- Stone, C.A.; Kawai, K.; Kupka, R.; Fawzi, W.W. Role of Selenium in HIV Infection. Nutr. Rev. 2010, 68, 671–681. [Google Scholar] [CrossRef]
- McNeal, J.M.; Balistrieri, L.S. Geochemistry and Occurrence of Selenium: An Overview. Selenium Agric. Environ. 2015, 23, 1–13. [Google Scholar] [CrossRef]
- Davis, T.Z.; Tiwary, A.K.; Stegelmeier, B.L.; Pfister, J.A.; Panter, K.E.; Hall, J.O. Comparative Oral Dose Toxicokinetics of Sodium Selenite and Selenomethionine. J. Appl. Toxicol. 2017, 37, 231–238. [Google Scholar] [CrossRef]
- Czauderna, M.; Białek, M.; Krajewska, K.; Ruszczyńska, A.; Bulska, E. Selenium Supplementation into Diets Containing Carnosic Acid, Fish and Rapeseed Oils Affects the Chemical Profile of Whole Blood in Lambs. J. Anim. Feed Sci. 2017, 26, 192–203. [Google Scholar] [CrossRef]
- Rozbicka-Wieczorek, A.; Czauderna, M.; Więsyk, E.; Radzik-Rant, A. Selenium Species in Diet Containing Carnosic Acid, Fish and Rapeseed Oils Affect Fatty Acid Profiles in Lamb Muscles. J. Anim. Feed Sci. 2016, 25, 216–225. [Google Scholar] [CrossRef] [Green Version]
- Czauderna, M.; Ruszczyńska, A.; Bulska, E.; Krajewska, K.A. Seleno-compounds and Carnosic Acid Added to Diets with Rapeseed and Fish Oils Affect Concentrations of Selected Elements and Chemical Composition in the Liver, Heart and Muscles of Lambs. Biol. Trace Elem. Res. 2018, 184, 378–390. [Google Scholar] [CrossRef]
- Hoefig, C.S.; Renko, K.; Köhrle, J.; Birringer, M.; Schomburg, L. Comparison of Different Selenocompounds with Respect to Nutritional Value vs. Toxicity Using Liver Cells in Culture. J. Nutr. Biochem. 2011, 22, 945–955. [Google Scholar] [CrossRef]
- Zhang, K.; Zhao, Q.; Zhan, T.; Han, Y.; Tang, C.; Zhang, J. Effect of Different Selenium Sources on Growth Performance, Tissue Selenium Content, Meat Quality, and Selenoprotein Gene Expression in Finishing Pigs. Biol. Trace Elem. Res. 2020, 196, 463–471. [Google Scholar] [CrossRef]
- Kojouri, G.A.; Jahanabadi, S.; Shakibaie, M.; Ahadi, A.M.; Shahverdi, A.R. Effect of Selenium Supplementation with Sodium Selenite and Selenium Nanoparticles on Iron Homeostasis and Transferrin Gene Expression in Sheep: A Preliminary Study. Res. Vet. Sci. 2012, 93, 275–278. [Google Scholar] [CrossRef]
- Whanger, P.D. Selenium and Its Relationship to Cancer: An Update. Br. J. Nutr. 2004, 91, 11–28. [Google Scholar] [CrossRef] [Green Version]
- Gawor, A.; Konopka, A.; Torres Elguera, J.C.; Ruszczyńska, A.; Czauderna, M.; Bulska, E. Label-Free Proteomic Approach to Identification and Quantification of Proteins in Animal Tissue Samples. In Proceedings of the 14th ISC “Modern Analytical Chemistry”; Nesmӗrák, K., Ed.; Charles University, Faculty of Science: Prague, Czech Republic, 2018; pp. 25–30. [Google Scholar]
- Gawor, A.; Ruszczynska, A.; Czauderna, M.; Bulska, E. Determination of Selenium Species in Muscle, Heart, and Liver Tissues of Lambs Using Mass Spectrometry Methods. Animals 2020, 10, 808. [Google Scholar] [CrossRef]
- Zhao, L.; Sun, L.-H.; Huang, J.-Q.; Briens, M.; Qi, D.-S.; Xu, S.-W.; Lei, X.G. A Novel Organic Selenium Compound Exerts Unique Regulation of Selenium Speciation, Selenogenome, and Selenoproteins in Broiler Chicks. J. Nutr. 2017, 147, 789–797. [Google Scholar] [CrossRef] [Green Version]
- Liu, Y.; Zhao, H.; Zhang, Q.; Tang, J.; Li, K.; Xia, X.-J.; Wang, K.-N.; Li, K.; Lei, X.G. Prolonged Dietary Selenium Deficiency or Excess Does Not Globally Affect Selenoprotein Gene Expression and/or Protein Production in Various Tissues of Pigs. J. Nutr. 2012, 142, 1410–1416. [Google Scholar] [CrossRef] [Green Version]
- Touat-Hamici, Z.; Bulteau, A.-L.; Bianga, J.; Jean-Jacques, H.; Szpunar, J.; Lobinski, R.; Chavatte, L. Selenium-Regulated Hierarchy of Human Selenoproteome in Cancerous and Immortalized Cells Lines. Biochim. Biophys. Acta—Gen. Subj. 2018, 1862, 2493–2505. [Google Scholar] [CrossRef]
- Pagmantidis, V.; Méplan, C.; van Schothorst, E.M.; Keijer, J.; Hesketh, J.E. Supplementation of Healthy Volunteers with Nutritionally Relevant Amounts of Selenium Increases the Expression of Lymphocyte Protein Biosynthesis Genes. Am. J. Clin. Nutr. 2008, 87, 181–189. [Google Scholar] [CrossRef] [Green Version]
- Cox, J.; Mann, M. MaxQuant Enables High Peptide Identification Rates, Individualized p.p.b.-Range Mass Accuracies and Proteome-Wide Protein Quantification. Nat. Biotechnol. 2008, 26, 1367–1372. [Google Scholar] [CrossRef]
- Tyanova, S.; Cox, J. Perseus: A Bioinformatics Platform for Integrative Analysis of Proteomics Data in Cancer Research. Methods Mol. Biol. 2018, 1711, 133–148. [Google Scholar]
- Szklarczyk, D.; Gable, A.L.; Nastou, K.C.; Lyon, D.; Kirsch, R.; Pyysalo, S.; Doncheva, N.T.; Legeay, M.; Fang, T.; Bork, P.; et al. The STRING Database in 2021: Customizable Protein–Protein Networks, and Functional Characterization of User-Uploaded Gene/Measurement Sets. Nucleic Acids Res. 2021, 49, D605–D612. [Google Scholar] [CrossRef] [PubMed]
- Lloyd, B.; Holt, P.; Delves, H.T. Determination of Selenium in Biological Samples by Hydride Generation and Atomic-Absorption Spectroscopy. Analyst 1982, 107, 927. [Google Scholar] [CrossRef] [PubMed]
- Foster, L.; Sumar, S. Hydride Generation Atomic Absorption Spectrometric (HGAAS) Determination of Selenium in Term and Preterm Infant Formulae Available in the United Kingdom. Food Chem. 1996, 55, 293–298. [Google Scholar] [CrossRef]
- Martinis, E.M.; Escudero, L.B.; Berton, P.; Monasterio, R.P.; Filippini, M.F.; Wuilloud, R.G. Determination of Inorganic Selenium Species in Water and Garlic Samples with On-Line Ionic Liquid Dispersive Microextraction and Electrothermal Atomic Absorption Spectrometry. Talanta 2011, 85, 2182–2188. [Google Scholar] [CrossRef]
- Shaltout, A.A.; Bouslimi, J.; Besbes, H. The Challenges of SE Quantification in Bean Samples Using Line and Continuum Sources Atomic Absorption Spectrometry. Food Chem. 2020, 328, 127124. [Google Scholar] [CrossRef]
- Garg, A.N.; Weginwar, R.G.; Chutke, N.L. Radiochemical Neutron Activation Analysis of Fe, Co, Zn, SB and SE in Biomedical and Environmental Samples. Sci. Total Environ. 1993, 139–140, 421–430. [Google Scholar] [CrossRef]
- Hannan, M.A.; Dogadkin, N.N.; Ashur, I.A.; Markus, W.M. Copper, Selenium, and Zinc Concentrations in Human Milk During the First Three Weeks of Lactation. Biol. Trace Elem. Res. 2005, 107, 11–20. [Google Scholar] [CrossRef]
- Rusiniak, P.; Ruszczyńska, A.; Wątor, K.; Bulska, E.; Kmiecik, E. Methodological Aspects Concerning Sampling and Determination of Total Selenium and Selenium Species in Geothermal Waters. Bull. Geogr. Phys. Geogr. Ser. 2020, 18, 5–16. [Google Scholar] [CrossRef]
- Ruszczyńska, A.; Konopka, A.; Kurek, E.; Torres Elguera, J.C.; Bulska, E. Investigation of Biotransformation of Selenium in Plants Using Spectrometric Methods. Spectrochim. Acta—Part B At. Spectrosc. 2017, 130, 7–16. [Google Scholar] [CrossRef]
- Chahrour, O.; Cobice, D.; Malone, J. Stable Isotope Labelling Methods in Mass Spectrometry-Based Quantitative Proteomics. J. Pharm. Biomed. Anal. 2015, 113, 2–20. [Google Scholar] [CrossRef]
- Zhu, W.; Smith, J.W.; Huang, C.-M. Mass Spectrometry-Based Label-Free Quantitative Proteomics. J. Biomed. Biotechnol. 2010, 2010, 840518. [Google Scholar] [CrossRef]
- Gawor, A.; Konopka, A.; Ruszczyńska, A.; Pączek, L.; Gajewski, Z.; Bulska, E. Molecular Absorption and Mass Spectrometry for Complementary Analytical Study of Fluorinated Drugs in Animal Organisms. J. Anal. At. Spectrom. 2020, 35, 1840–1847. [Google Scholar] [CrossRef]
- Gawor, A.; Gajewski, Z.; Paczek, L.; Czarkowska-Paczek, B.; Konopka, A.; Wryk, G.; Bulska, E. Fluorine-Containing Drug Administration in Rats Results in Fluorination of Selected Proteins in Liver and Brain Tissue. Int. J. Mol. Sci. 2022, 23, 4202. [Google Scholar] [CrossRef]
- Bensmail, H.; Golek, J.; Moody, M.M.; Semmes, J.O.; Haoudi, A. A Novel Approach for Clustering Proteomics Data Using Bayesian Fast Fourier Transform. Bioinformatics 2005, 21, 2210–2224. [Google Scholar] [CrossRef]
- Warensjö Lemming, E.; Byberg, L.; Stattin, K.; Ahmad, S.; Lind, L.; Elmståhl, S.; Larsson, S.C.; Wolk, A.; Michaëlsson, K. Dietary Pattern Specific Protein Biomarkers for Cardiovascular Disease: A Cross-Sectional Study in 2 Independent Cohorts. J. Am. Heart Assoc. 2019, 8, e011860. [Google Scholar] [CrossRef]
- Pas, M.F.W.; Keuning, E.; Kruijt, L.; Hortós, M.; Diestre, A.; Evans, G.J.; Hoving-Bolink, A.H.; Hoekman, A.J.W. Biomarker Development for Meat Quality in Pork Production Chains for Spanish Dry Cured Ham Using Proteomics Technology. In Book of Abstracts of the 60th Annual Meeting of the European Association for Animal Production EAAP, Barcelona, Spain, 24–27 August 2009; Wageningen Academic Publishers: Wageningen, The Netherlands, 2009; p. 33. [Google Scholar] [CrossRef]
- Cao, C.; Xiao, Z.; Ge, C.; Wu, Y. Application and Research Progress of Proteomics in Chicken Meat Quality and Identification: A Review. Food Rev. Int. 2022, 38, 313–334. [Google Scholar] [CrossRef]
- Mann, S.; Ramsay, J.D.; Wakshlag, J.J.; Stokol, T.; Reed, S.; Divers, T.J. Investigating the Pathogenesis of High-Serum Gamma-Glutamyl Transferase Activity in Thoroughbred Racehorses: A Series of Case-Control Studies. Equine Vet. J. 2022, 54, 39–51. [Google Scholar] [CrossRef]
- Houben, R.; Leleu, C.; Fraipont, A.; Serteyn, D.; Votion, D. High-Resolution Respirometry May Identify Early Indicators for Exertional Rhabdomyolysis in Standardbred Racehorses. Equine Vet. J. 2014, 46, 28. [Google Scholar] [CrossRef] [Green Version]
- Chiaradia, E.; Pepe, M.; Tartaglia, M.; Scoppetta, F.; D’Ambrosio, C.; Renzone, G.; Avellini, L.; Moriconi, F.; Gaiti, A.; Bertuglia, A.; et al. Gambling on Putative Biomarkers of Osteoarthritis and Osteochondrosis by Equine Synovial Fluid Proteomics. J. Proteom. 2012, 75, 4478–4493. [Google Scholar] [CrossRef]
- Hill, R.C.; Lewis, D.D.; Scott, K.C.; Omori, M.; Jackson, M.; Sundstrom, D.A.; Jones, G.L.; Speakman, J.R.; Doyle, C.A.; Butterwick, R.F. Effect of Increased Dietary Protein and Decreased Dietary Carbohydrate on Performance and Body Composition in Racing Greyhounds. Am. J. Vet. Res. 2001, 62, 440–447. [Google Scholar] [CrossRef]
- Fayos, M.; Couto, C.G.; Iazbik, M.C.; Wellman, M.L. Serum Protein Electrophoresis in Retired Racing Greyhounds. Vet. Clin. Pathol. 2005, 34, 397–400. [Google Scholar] [CrossRef] [PubMed]
- Ali, A.; Baby, B.; Vijayan, R. From Desert to Medicine: A Review of Camel Genomics and Therapeutic Products. Front. Genet. 2019, 10, 17. [Google Scholar] [CrossRef] [PubMed]
- Jaworska, D.; Czauderna, M.; Przybylski, W.; Rozbicka-Wieczorek, A.J. Sensory Quality and Chemical Composition of Meat from Lambs Fed Diets Enriched with Fish and Rapeseed Oils, Carnosic Acid and Seleno-Compounds. Meat Sci. 2016, 119, 185–192. [Google Scholar] [CrossRef] [PubMed]
- Czauderna, M.; Samochocka, K. Selenium Incorporation into Sulphur Amino Acids and Glutathione and the Stability of the Incorporation Products. J. Label. Compd. Radiopharm. 1981, 18, 829–854. [Google Scholar] [CrossRef]
- Iovinella, I.; Caputo, B.; Michelucci, E.; Dani, F.R.; della Torre, A. Candidate Biomarkers for Mosquito Age-Grading Identified by Label-Free Quantitative Analysis of Protein Expression in Aedes Albopictus Females. J. Proteom. 2015, 128, 272–279. [Google Scholar] [CrossRef]
- Tyanova, S.; Temu, T.; Cox, J. The MaxQuant Computational Platform for Mass Spectrometry-Based Shotgun Proteomics. Nat. Protoc. 2016, 11, 2301–2319. [Google Scholar] [CrossRef]
- Cox, J.; Hein, M.Y.; Luber, C.A.; Paron, I.; Nagaraj, N.; Mann, M. Accurate Proteome-Wide Label-Free Quantification by Delayed Normalization and Maximal Peptide Ratio Extraction, Termed MaxLFQ. Mol. Cell. Proteom. 2014, 13, 2513–2526. [Google Scholar] [CrossRef] [Green Version]
- Tyanova, S.; Temu, T.; Sinitcyn, P.; Carlson, A.; Hein, M.Y.; Geiger, T.; Mann, M.; Cox, J. The Perseus Computational Platform for Comprehensive Analysis of (Prote)Omics Data. Nat. Methods 2016, 13, 731–740. [Google Scholar] [CrossRef]
- Brohée, S.; van Helden, J. Evaluation of Clustering Algorithms for Protein-Protein Interaction Networks. BMC Bioinform. 2006, 7, 488. [Google Scholar] [CrossRef] [Green Version]
- Ng EK, O.; Chan, K.K.; Wong, C.H.; Tsui, S.K.W.; Ngai, S.M.; Lee, S.M.Y.; Kotaka, M.; Lee, C.Y.; Waye, M.M.Y.; Fung, K.P. Interaction of the Heart-Specific LIM Domain Protein, FHL2, with DNA-Binding Nuclear Protein, hNP220. J. Cell. Biochem. 2002, 84, 556–566. [Google Scholar]
- Li, H.Y.; Ng, E.K.; Lee, S.M.; Kotaka, M.; Tsui, S.K.; Lee, C.Y.; Fung, K.P.; Waye, M.M. Protein-Protein Interaction of FHL3 with FHL2 and Visualization of Their Interaction by Green Fluorescent Proteins (GFP) Two-Fusion Fluorescence Resonance Energy Transfer (FRET). J. Cell. Biochem. 2001, 80, 293–303. [Google Scholar] [CrossRef]
- Junction Plakoglobin—UniprotKB Description. Available online: https://www.uniprot.org/uniprot/W5Q7R8 (accessed on 15 December 2021).
- Yuan, Z.-Y.; Cheng, L.-T.; Wang, Z.-F.; Wu, Y.-Q. Desmoplakin and Clinical Manifestations of Desmoplakin Cardiomyopathy. Chin. Med. J. 2021, 134, 1771–1779. [Google Scholar] [CrossRef]
- Badu-Nkansah, K.A.; Lechler, T. Proteomic Analysis of Desmosomes Reveals Novel Components Required for Epidermal Integrity. Mol. Biol. Cell 2020, 31, 1140–1153. [Google Scholar] [CrossRef]
- Krendel, M.; Mooseker, M.S. Myosins: Tails (and Heads) of Functional Diversity. Physiology 2005, 20, 239–251. [Google Scholar] [CrossRef] [Green Version]
- Woolner, S.; Bement, W.M. Unconventional Myosins Acting Unconventionally. Trends Cell Biol. 2009, 19, 245–252. [Google Scholar] [CrossRef] [Green Version]
- Nedvetsky, P.I.; Stefan, E.; Frische, S.; Santamaria, K.; Wiesner, B.; Valenti, G.; Hammer, J.A.; Nielsen, S.; Goldenring, J.R.; Rosenthal, W.; et al. A Role of Myosin Vb and Rab11-FIP2 in the Aquaporin-2 Shuttle. Traffic 2007, 8, 110–123. [Google Scholar] [CrossRef]
- Sutka, M.; Amodeo, G.; Ozu, M. Plant and Animal Aquaporins Crosstalk: What Can Be Revealed from Distinct Perspectives. Biophys. Rev. 2017, 9, 545–562. [Google Scholar] [CrossRef] [Green Version]
- Bienert, G.P.; Chaumont, F. Selenium and Aquaporins. In Encyclopedia of Metalloproteins 1891–1893; Springer: New York, NY, USA, 2013. [Google Scholar] [CrossRef]
- Fernández-Lázaro, D.; Fernandez-Lazaro, C.I.; Mielgo-Ayuso, J.; Navascués, L.J.; Córdova Martínez, A.; Seco-Calvo, J. The Role of Selenium Mineral Trace Element in Exercise: Antioxidant Defense System, Muscle Performance, Hormone Response, and Athletic Performance. A Systematic Review. Nutrients 2020, 12, 1790. [Google Scholar] [CrossRef]
- Juniper, D.T.; Phipps, R.H.; Ramos-Morales, E.; Bertin, G. Selenium Persistency and Speciation in the Tissues of Lambs Following the Withdrawal of Dietary High-Dose Selenium-Enriched Yeast. Animal 2008, 2, 375–380. [Google Scholar] [CrossRef] [Green Version]
- Katarzyna, Z.; Sobiech, P.; Radwińska, J.; Rekawek, W. Effects of Selenium on Animal Health. J. Elem. 2013, 18, 329–340. [Google Scholar]
- Bierla, K.; Dernovics, M.; Vacchina, V.; Szpunar, J.; Bertin, G.; Lobinski, R. Determination of Selenocysteine and Selenomethionine in Edible Animal Tissues by 2D Size-Exclusion Reversed-Phase HPLC-ICP MS Following Carbamidomethylation and Proteolytic Extraction. Anal. Bioanal. Chem. 2008, 390, 1789–1798. [Google Scholar] [CrossRef] [PubMed]
- Tóth, R.J.; Csapó, J. The Role of Selenium in Nutrition—A Review. Acta Univ. Sapientiae Aliment. 2018, 11, 128–144. [Google Scholar] [CrossRef] [Green Version]
- Finley, J.W. Increased Intakes of Selenium-Enriched Foods May Benefit Human Health. J. Sci. Food Agric. 2007, 87, 1620–1629. [Google Scholar] [CrossRef]
- Kieliszek, M.; Bano, I.; Zare, H. A Comprehensive Review on Selenium and Its Effects on Human Health and Distribution in Middle Eastern Countries. Biol. Trace Elem. Res. 2022, 200, 971–987. [Google Scholar] [CrossRef] [PubMed]
- Kieliszek, M.; Błażejak, S. Current Knowledge on the Importance of Selenium in Food for Living Organisms: A Review. Molecules 2016, 21, 609. [Google Scholar] [CrossRef] [PubMed] [Green Version]
- Kieliszek, M. Selenium in the Prevention of SARS-CoV-2 and Other Viruses. Biol. Trace Element Res. 2022, 6. [Google Scholar] [CrossRef] [PubMed]
- Fakhrolmobasheri, M.; Mazaheri-Tehrani, S.; Kieliszek, M.; Zeinalian, M.; Abbasi, M.; Karimi, F.; Mozafari, A.M. COVID-19 and Selenium Deficiency: A Systematic Review. Biol. Trace Element Res. 2021. [Google Scholar] [CrossRef] [PubMed]
- Elgendy, R.; Giantin, M.; Castellani, F.; Grotta, L.; Palazzo, F.; Dacasto, M.; Martino, G. Transcriptomic Signature of High Dietary Organic Selenium Supplementation in Sheep: A Nutrigenomic Insight Using a Custom Microarray Platform and Gene Set Enrichment Analysis. J. Anim. Sci. 2016, 94, 3169–3184. [Google Scholar] [CrossRef] [Green Version]
- Sinha, I.; Karagoz, K.; Fogle, R.L.; Hollenbeak, C.S.; Zea, A.H.; Arga, K.Y.; Stanley, A.E.; Hawkes, W.C.; Sinha, R. “Omics” of Selenium Biology: A Prospective Study of Plasma Proteome Network Before and After Selenized-Yeast Supplementation in Healthy Men. Omi. A J. Integr. Biol. 2016, 20, 202–213. [Google Scholar] [CrossRef]
Publisher’s Note: MDPI stays neutral with regard to jurisdictional claims in published maps and institutional affiliations. |
© 2022 by the authors. Licensee MDPI, Basel, Switzerland. This article is an open access article distributed under the terms and conditions of the Creative Commons Attribution (CC BY) license (https://creativecommons.org/licenses/by/4.0/).