
Evaluation of Biochemical Composition of Amniotic and Allantoic Fluids at Different Stages of Pregnancy in Queens

 , , and
Abstract
Simple Summary
Abstract
1. Introduction
2. Materials and Methods
2.1. Animals
2.2. Surgical Procedure
2.3. Sample Collection
2.4. Biochemical Analysis
2.5. Statistical Analysis
3. Results
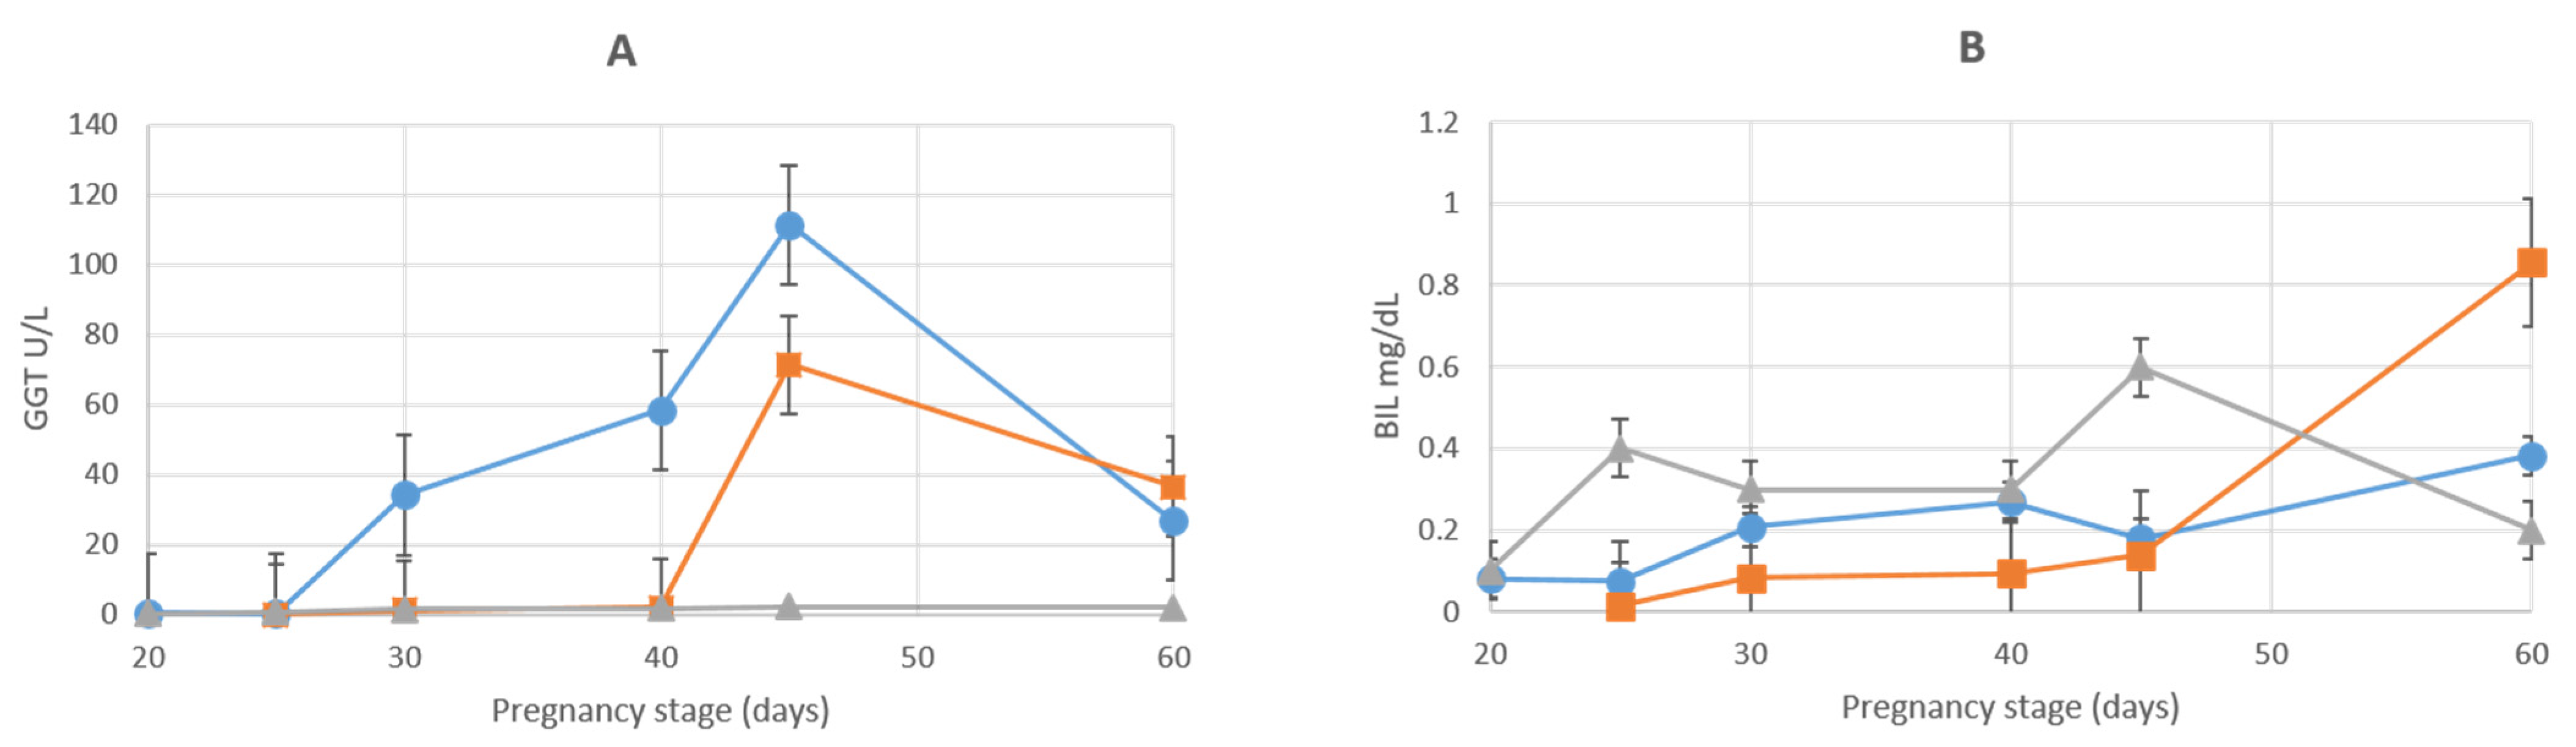
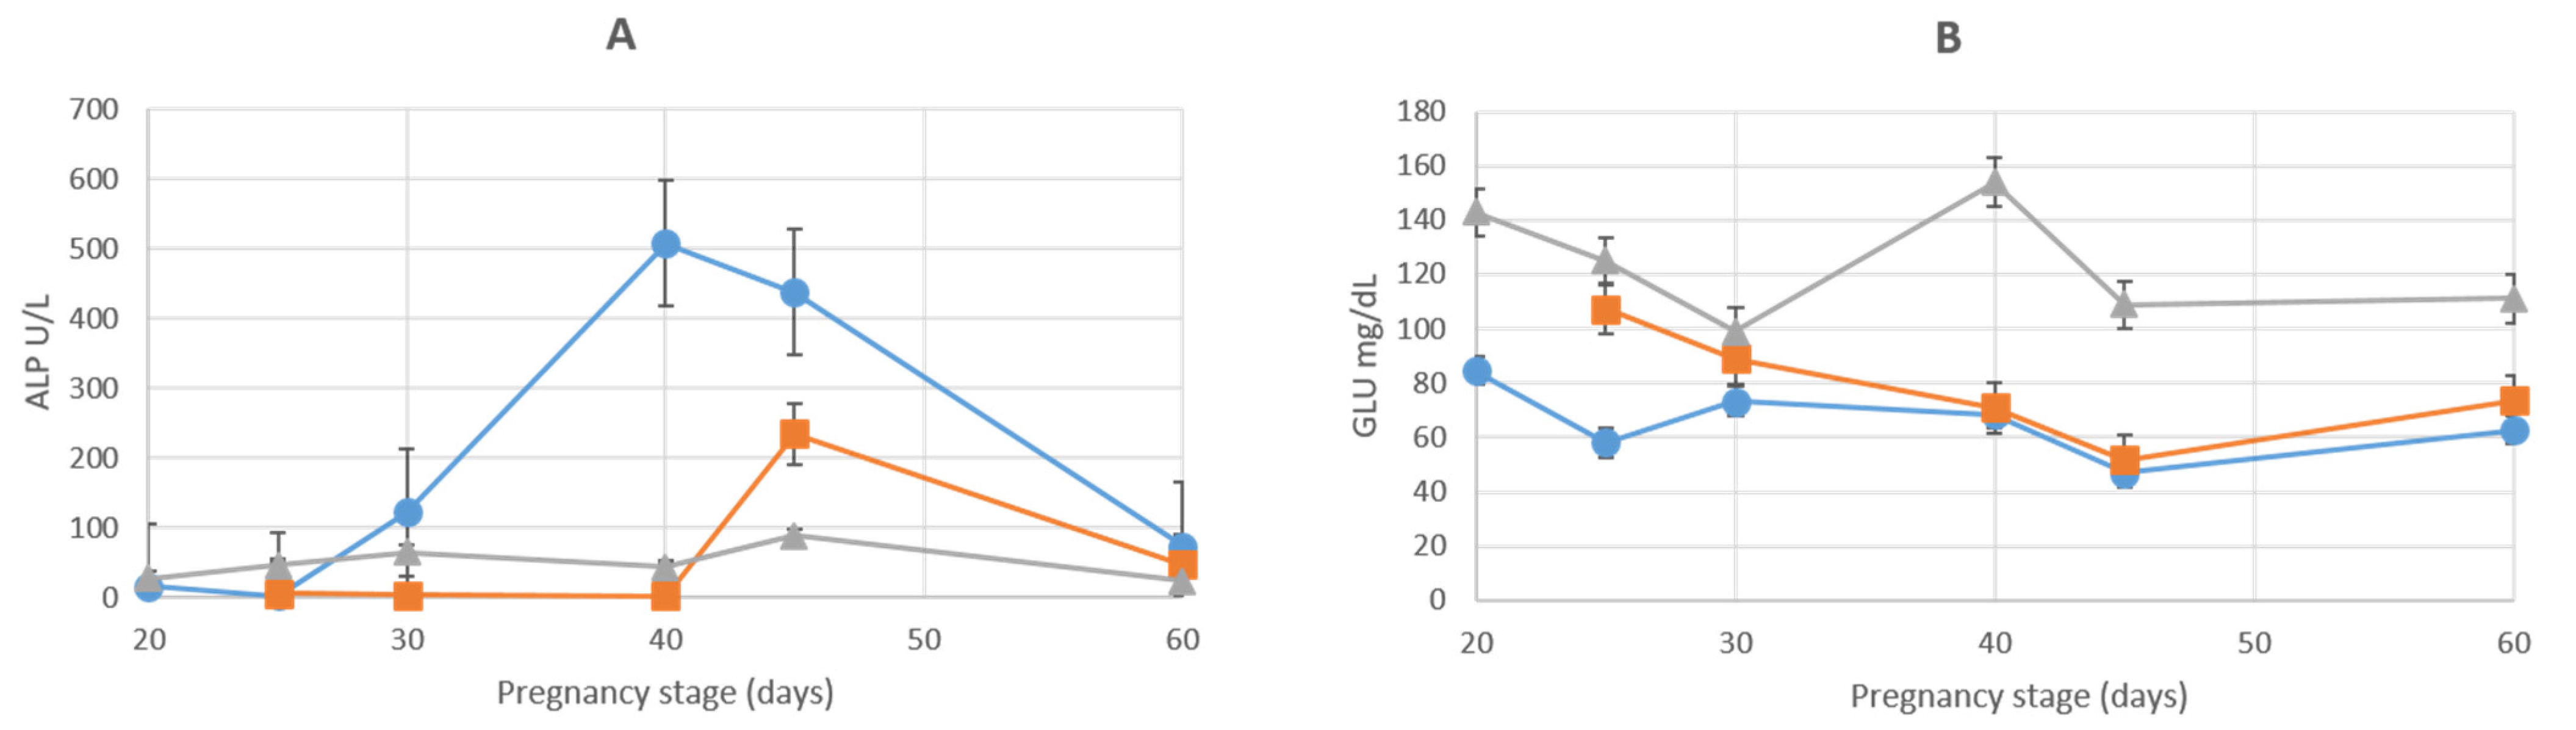
3.1. Liver Enzymes
3.2. Kidney Enzymes
3.3. Pancreatic Enzymes
3.4. Muscular Enzymes
3.5. Lipid Metabolism Enzymes
3.6. Total Proteins, Glucose and Globulins
3.7. Specific Gravity
4. Discussion
5. Conclusions
Author Contributions
Funding
Institutional Review Board Statement
Informed Consent Statement
Data Availability Statement
Conflicts of Interest
References
- Minazaki, C.K.; Gagioti, S.; Zago, D.; Terra, W.; Araujo, V.C.; Oliveira, R.A.; Bevilacqua, E. Acid phosphatase and cathepsin D are active expressed enzymes in the placenta of the cat. Res. Vet. Sci. 2008, 84, 326–334. [Google Scholar] [CrossRef] [PubMed]
- Pelagalli, G.V.; Castaldo, L.; Lucini, C.; Patruno, M.; Scocco, P. Embriologia—Morfogenesi e Anomalie Dello Sviluppo, 3rd ed.; Idelson-Gnocchi: Napoli, Italy, 2014; pp. 128–130, 269–271. [Google Scholar]
- Brace, R.A. Foetal fluid balance. In Textbook of Foetal Physiology, 1st ed.; Thorburn, G.D., Harding, R., Eds.; Oxford University Press: New York, NY, USA, 1994; pp. 205–218. [Google Scholar]
- Underwood, M.A.; Gilbert, W.M.; Sherman, M.P. Amniotic fluid: Not just fetal urine anymore. J. Perinatol. 2005, 25, 341–348. [Google Scholar] [CrossRef] [PubMed]
- Liu, H.; Zheng, Z.; Wintour, E.M. Aquaporins and fetal fluid balance. Placenta 2008, 29, 804–847. [Google Scholar] [CrossRef] [PubMed]
- Bor, N.M.; Karpuzoglu, T.; Hamzadi, T.; Edguer, E.; Kis, M. Role of fetal skin in circulation of amniotic fluid. Arch. Int. Physiol. Biochim. 1970, 78, 69–78. [Google Scholar] [CrossRef] [PubMed]
- Li, N.; Wells, D.N.; Peterson, A.J.; Lee, R.S.F. Perturbations in the biochemical composition of foetal fluids are apparent in surviving bovine somatic cell nuclear transfer pregnancies in the first half of pregnancy. Biol. Reprod. 2005, 73, 139–148. [Google Scholar] [CrossRef] [PubMed]
- Baetz, A.L.; Hubbert, W.T.; Gram, C.K. Changes of biochemical constituents in bovine foetal fluids with gestational age. Am. J. Vet. Res. 1976, 37, 1047–1052. [Google Scholar] [PubMed]
- Wales, R.G.; Murdoch, R.N. Changes in the composition of sheep foetal fluids during early pregnancy. J. Reprod. Fertil. 1973, 33, 197–205. [Google Scholar] [CrossRef] [PubMed][Green Version]
- Veronesi, M.C.; Bolis, B.; Faustini, M.; Rota, A.; Mollo, A. Biochemical composition of fetal fluids in at term, normal developed, healty, viable dogs and preliminary data from pathologic littermates. Theriogenology 2018, 108, 277–283. [Google Scholar] [CrossRef] [PubMed]
- Knospe, C. Periods and stages of the prenatal development of the domestic cat. Anat. Histol. Embryol. 2002, 31, 37–51. [Google Scholar] [CrossRef] [PubMed]
- Zambelli, D.; Prati, F. Ultrasonography for pregnancy diagnosis and evaluation in queens. Theriogenology 2006, 66, 135–144. [Google Scholar] [CrossRef] [PubMed]
- Fresno, L.; Rodriguez-Gil, J.E.; Rigau, T.; Pastor, J.; Riviera del Alamo, M.M. Modulation of the biochemical composition of amniotic and allantoic fluids as a control mechanism of feline foetal development. Placenta 2012, 33, 522–527. [Google Scholar] [CrossRef] [PubMed]
- Miglino, M.A.; Ambrósio, C.E.; dos Santos Martins, D.; Valverde Wenceslau, C.; Pfarrer, C.; Leiser, R. The carnivore pregnancy: The development of the embryo and foetal membranes. Theriogenology 2006, 66, 1699–1702. [Google Scholar] [CrossRef] [PubMed]
- Hoffman, W.E.; Solter, P.F. Diagnostic enzymology of domestic animals. In Clinical Biochemistry of Domestic Animals, 6th ed.; Kaneko, J.J., Harvey, J.W., Bruss, M.L., Eds.; Elsevier Inc.: Amsterdam, The Netherlands, 2008; pp. 351–378. [Google Scholar]
- Tong, X.L.; Wang, L.; Gao, Y.G.; Qin, Y.G.; Xu, Y.P. Potential function of amniotic fluid in foetal development—Novel Insight by comparing the composition of human amniotic fluid with umbilical cord and maternal serum at mid and late pregnancy. J. Chin. Med. Assoc. 2009, 72, 368–373. [Google Scholar] [CrossRef]
- Macias, R.I.; Marin, J.J.; Serrano, M.A. Excretion of biliary compounds during intrauterine life. World J. Gastroenterol. 2009, 15, 817–828. [Google Scholar] [CrossRef] [PubMed]
- Bigliardi, E.; Bresciani, C.; Callegari, D.; Di Ianni, F.; Morini, G.; Parmigiani, E.; Bianchi, E. Use of aglepristone for the treatment of P4 induced insulin resistance in dogs. J. Vet. Sci. 2014, 15, 267–271. [Google Scholar] [CrossRef] [PubMed]
- Cho, C.-K.J.; Shan, S.J.; Winsor, E.J.; Diamandis, E.P. Proteomics Analysis of Human Amniotic Fluid. Mol. Cell Proteom. 2007, 6, 1406–1415. [Google Scholar] [CrossRef] [PubMed]
- Loux, S.C.; Ball, B.A. The proteome of fetal fluids in mares with experimentally-induced placentitis. Placenta 2018, 64, 71–78. [Google Scholar] [CrossRef] [PubMed]
- Boy, G.F.T.; Codognoto, V.M.; Faleiros-Lima, M.C.M.; Yamada, P.H.; de Ruediger, F.R.; Paranzini, C.S.; Souza, F.F.; do Carmo, L.M.; Vieira, A.F.; Oba, E. Proteomic analysis of amniotic and allantoic fluid from buffaloes during foetal development. Reprod. Domest. Anim. 2019, 54, 1507–1515. [Google Scholar] [CrossRef] [PubMed]


| D20 | D25 | D30 | D40 | D45 | D60 | DOG | |
| ALBUMIN (G/L) | |||||||
| AMN | 0.3 ± 0.1 | 0.09 ± 0.02 | 0.14 ± 0.05 | 0.16 ± 0.05 | 0.15 ± 0.05 | 0.49 ± 0.1 | 0.8 ± 0.05 |
| ALL | 0.1 ± 0.06 | 0.08 ± 0.07 | 0.1 ± 0.02 | 0.55 ± 0.15 | 0.86 ± 0.05 | 0.9 ± 0.05 | |
| ALP (U/L) | |||||||
| AMN | 15.8 ± 2.8 | 2.4 ± 0.5 | 121.7 ± 27.6 | 507.1 ± 9.6 | 437.2 ± 66.5 | 74 ± 7.9 | 126.0 ± 6.76 |
| ALL | 5.8 ± 2 | 3.9 ± 1.9 | 2.7 ± 0.6 | 234.1 ± 30.8 | 46.9 ± 6.5 | 25.7 ± 3.29 | |
| AMY (U/L) | |||||||
| AMN | 2.5 ± 0.1 | 2.88 ± 0.19 | 13.75 ± 6.3 | 13.3 ± 6.3 | 25.47 ± 5.5 | 64.3 ± 9.3 | 40.0 ± 3.01 |
| ALL | 7.2 ± 1.6 | 8.7 ± 7.3 | 8.4 ± 5.5 | 37.5 ± 9.7 | 172 ± 10.6 | 33.2 ± 1.9 | |
| BIL (MG/DL) | |||||||
| AMN | 0.08 ± 0.007 | 0.07 ± 0.005 | 0.21 ± 0.02 | 0.27 ± 0.04 | 0.18 ± 0.02 | 0.38 ± 0.6 | 0.2 ± 0.02 |
| ALL | 0.02 ± 0.005 | 0.08 ± 0.04 | 0.09 ± 0.05 | 0.14 ± 0.02 | 0.86 ± 0.04 | 0.6 ± 0.05 | |
| CHOL (MG/DL) | |||||||
| AMN | 0.67 ± 0.5 | 2.11 ± 1.01 | 2.33 ± 3.21 | 1.33 ± 1.53 | 1.47 ± 0.5 | 3.34 ± 0.58 | 3.3 ± 0.41 |
| ALL | 2.2 ± 0.8 | 0.7 ± 0.6 | 0.7 ± 0.5 | 5.2 ± 1 | 2.6 ± 0.5 | 3.7 ± 0.56 | |
| CREA (MG/DL) | |||||||
| AMN | 0.58 ± 0.01 | 0.84 ± 0.01 | 0.74 ± 0.23 | 0.68 ± 0.04 | 0.51 ± 0.04 | 13.93 ± 6.12 | 2.8 ± 0.15 |
| ALL | 0.65 ± 0.01 | 0.98 ± 0.4 | 2.8 ± 1.6 | 0.6 ± 0.07 | 11.2 ± 3.4 | 28.3 ± 2.33 | |
| CK (U/L) | |||||||
| AMN | 36.5 ± 2.2 | 5.3 ± 1.5 | 2.4 ± 1.1 | 2.7 ± 0.6 | 1 ± 0 | 5.7 ± 1.6 | 3.2 ± 0.41 |
| ALL | 13.5 ± 6 | 23.25 ± 25.6 | 7.7 ± 7.2 | 2.9 ± 1.6 | 35.4 ± 11.3 | 10.3 ± 1.72 | |
| GGT (U/L) | |||||||
| AMN | 0.5 ± 0.1 | 0.2 ± 0.04 | 34.2.5 ± 1.89 | 58.4 ± 10.72 | 111.3 ± 13.05 | 26.8 ± 4.67 | 3.7 ± 0.24 |
| ALL | 0.1 ± 0.05 | 1.1 ± 0.25 | 1.99 ± 1 | 71.4 ± 7 | 36.5 ± 2.2 | 59.8 ± 8 | |
| GLO (G/L) | |||||||
| AMN | 0.1 ± 0 | 0.1 ± 0 | 0.11 ± 0.01 | 0.1 ± 0 | 0.09 ± 0.02 | 1.08 ± 0.8 | 1.0 ± 0.19 |
| ALL | 0 ± 0 | 0.07 ± 0.05 | 0.4 ± 0.5 | 0.47 ± 0.1 | 2.7 ± 0.1 | 5.3 ± 0.46 | |
| GLU (MG/DL) | |||||||
| AMN | 84.5 ± 1.3 | 58 ± 2 | 73.3 ± 19.8 | 68.5 ± 1.38 | 47 ± 3 | 62.7 ± 3.5 | 24.5 ± 1.38 |
| ALL | 107.2 ± 4.5 | 89.1 ± 28.4 | 71 ± 13.7 | 51.6 ± 2.1 | 73.7 ± 4 | 26.6 ± 2.22 | |
| AST (U/L) | |||||||
| AMN | 7.3 ± 1.5 | 3.2 ± 0.7 | 1.7 ± 0.7 | 3 ± 3 | 4 ± 1 | 14.3 ± 1.6 | 9.4 ± 0.58 |
| ALL | 4 ± 1 | 3.4 ± 1.2 | 5 ± 2.6 | 3.4 ± 0.5 | 22.2 ± 0.7 | 11.4 ± 1.16 | |
| ALT (U/L) | |||||||
| AMN | 2.5 ± 1.3 | 1 ± 0 | 1.8 ± 0.7 | 1 ± 0 | 1 ± 0 | 1 ± 0 | 1.10 ± 0.11 |
| ALL | 0.9 ± 0.3 | 2.7 ± 2 | 4 ± 2.6 | 1.1 ± 0.1 | 1.4 ± 0.5 | 2.5 ± 0.8 | |
| LDH (U/L) | |||||||
| AMN | 382.5 ± 6.2 | 113.4 ± 10.2 | 21.5 ± 12.2 | 81.4 ± 50.7 | 12.2 ± 1.7 | 283 ± 18.7 | 29.8 ± 2.8 |
| ALL | 63.2 ± 5.5 | 82.6 ± 7.2 | 53.9 ± 5.5 | 26.9 ± 3.5 | 510 ± 23.1 | 116.6 ± 16.62 | |
| LIPA (U/L) | |||||||
| AMN | 2.6 ± 1.5 | 3.1 ± 1.6 | 8.5 ± 1.5 | 8.7 ± 1.5 | 22 ± 2 | 9.9 ± 1 | 5.8 ± 0.25 |
| ALL | 1.8 ± 1 | 3.2 ± 1 | 5 ± 1 | 17.7 ± 2.5 | 20.1 ± 1 | 11.6 ± 0.99 | |
| PT (G/L) | |||||||
| AMN | 0.4 ± 0.01 | 0.19 ± 0.02 | 0.25 ± 0.05 | 0.26 ± 0.05 | 0.2 ± 0.05 | 1.9 ± 0.3 | 1.5 ± 0.18 |
| ALL | 0.1 ± 0.05 | 0.2 ± 0.07 | 0.2 ± 0.02 | 1.2 ± 0.4 | 3.4 ± 0.2 | 5.2 ± 0.51 | |
| TRIG (MG/DL) | |||||||
| AMN | 7.4 ± 0.1 | 3 ± 1 | 5.25 ± 2.6 | 5.7 ± 2.1 | 2.6 ± 0.5 | 17.6 ± 3.4 | 13.7 ± 2.31 |
| ALL | 1.5 ± 0.5 | 2.2 ± 0.3 | 2 ± 0 | 3.5 ± 1.5 | 6.6 ± 0.5 | 17.5 ± 3.28 | |
| UREA (MG/DL) | |||||||
| AMN | 62.7 ± 3 | 53.9 ± 0.4 | 64.7 ± 15.4 | 60.1 ± 1.8 | 45.8 ± 0.9 | 64.9 ± 0.25 | 40.7 ± 2.03 |
| ALL | 41.8 ± 3.3 | 62.1 ± 13.8 | 64.1 ± 6.1 | 44.5 ± 1.9 | 63.7 ± 4 | 74.6 ± 7.43 | |
| SG | |||||||
| AMN | 1008 ± 0 | 1007.1 ± 0.210 | 1006.75 ± 1.3 | 1006.1 ± 1.9 | 1006.5 ± 0.5 | 1010.4 ± 2.6 | |
| ALL | 09.5 ± 0.5 | 1006.7 ± 1.1 | 1006.9 ± 1.54 | 1006.6 ± 0.5 | 1020.5 ± 1.2 |
Publisher’s Note: MDPI stays neutral with regard to jurisdictional claims in published maps and institutional affiliations. |
© 2022 by the authors. Licensee MDPI, Basel, Switzerland. This article is an open access article distributed under the terms and conditions of the Creative Commons Attribution (CC BY) license (https://creativecommons.org/licenses/by/4.0/).
Share and Cite
Bigliardi, E.; Rizzi, M.; Bertocchi, M.; Denti, L.; Bresciani, C.; Vetere, A.; Di Ianni, F. Evaluation of Biochemical Composition of Amniotic and Allantoic Fluids at Different Stages of Pregnancy in Queens. Animals 2022, 12, 1414. https://doi.org/10.3390/ani12111414
Bigliardi E, Rizzi M, Bertocchi M, Denti L, Bresciani C, Vetere A, Di Ianni F. Evaluation of Biochemical Composition of Amniotic and Allantoic Fluids at Different Stages of Pregnancy in Queens. Animals. 2022; 12(11):1414. https://doi.org/10.3390/ani12111414
Chicago/Turabian StyleBigliardi, Enrico, Matteo Rizzi, Mara Bertocchi, Laura Denti, Carla Bresciani, Alessandro Vetere, and Francesco Di Ianni. 2022. "Evaluation of Biochemical Composition of Amniotic and Allantoic Fluids at Different Stages of Pregnancy in Queens" Animals 12, no. 11: 1414. https://doi.org/10.3390/ani12111414
APA StyleBigliardi, E., Rizzi, M., Bertocchi, M., Denti, L., Bresciani, C., Vetere, A., & Di Ianni, F. (2022). Evaluation of Biochemical Composition of Amniotic and Allantoic Fluids at Different Stages of Pregnancy in Queens. Animals, 12(11), 1414. https://doi.org/10.3390/ani12111414