
The Dynamics of Lepus granatensis and Oryctolagus cuniculus in a Mediterranean Agrarian Area: Are Hares Segregating from Rabbit Habitats after Disease Impact?

 ,
,  , and
, and
Abstract
:Simple Summary
Abstract
1. Introduction
2. Methods
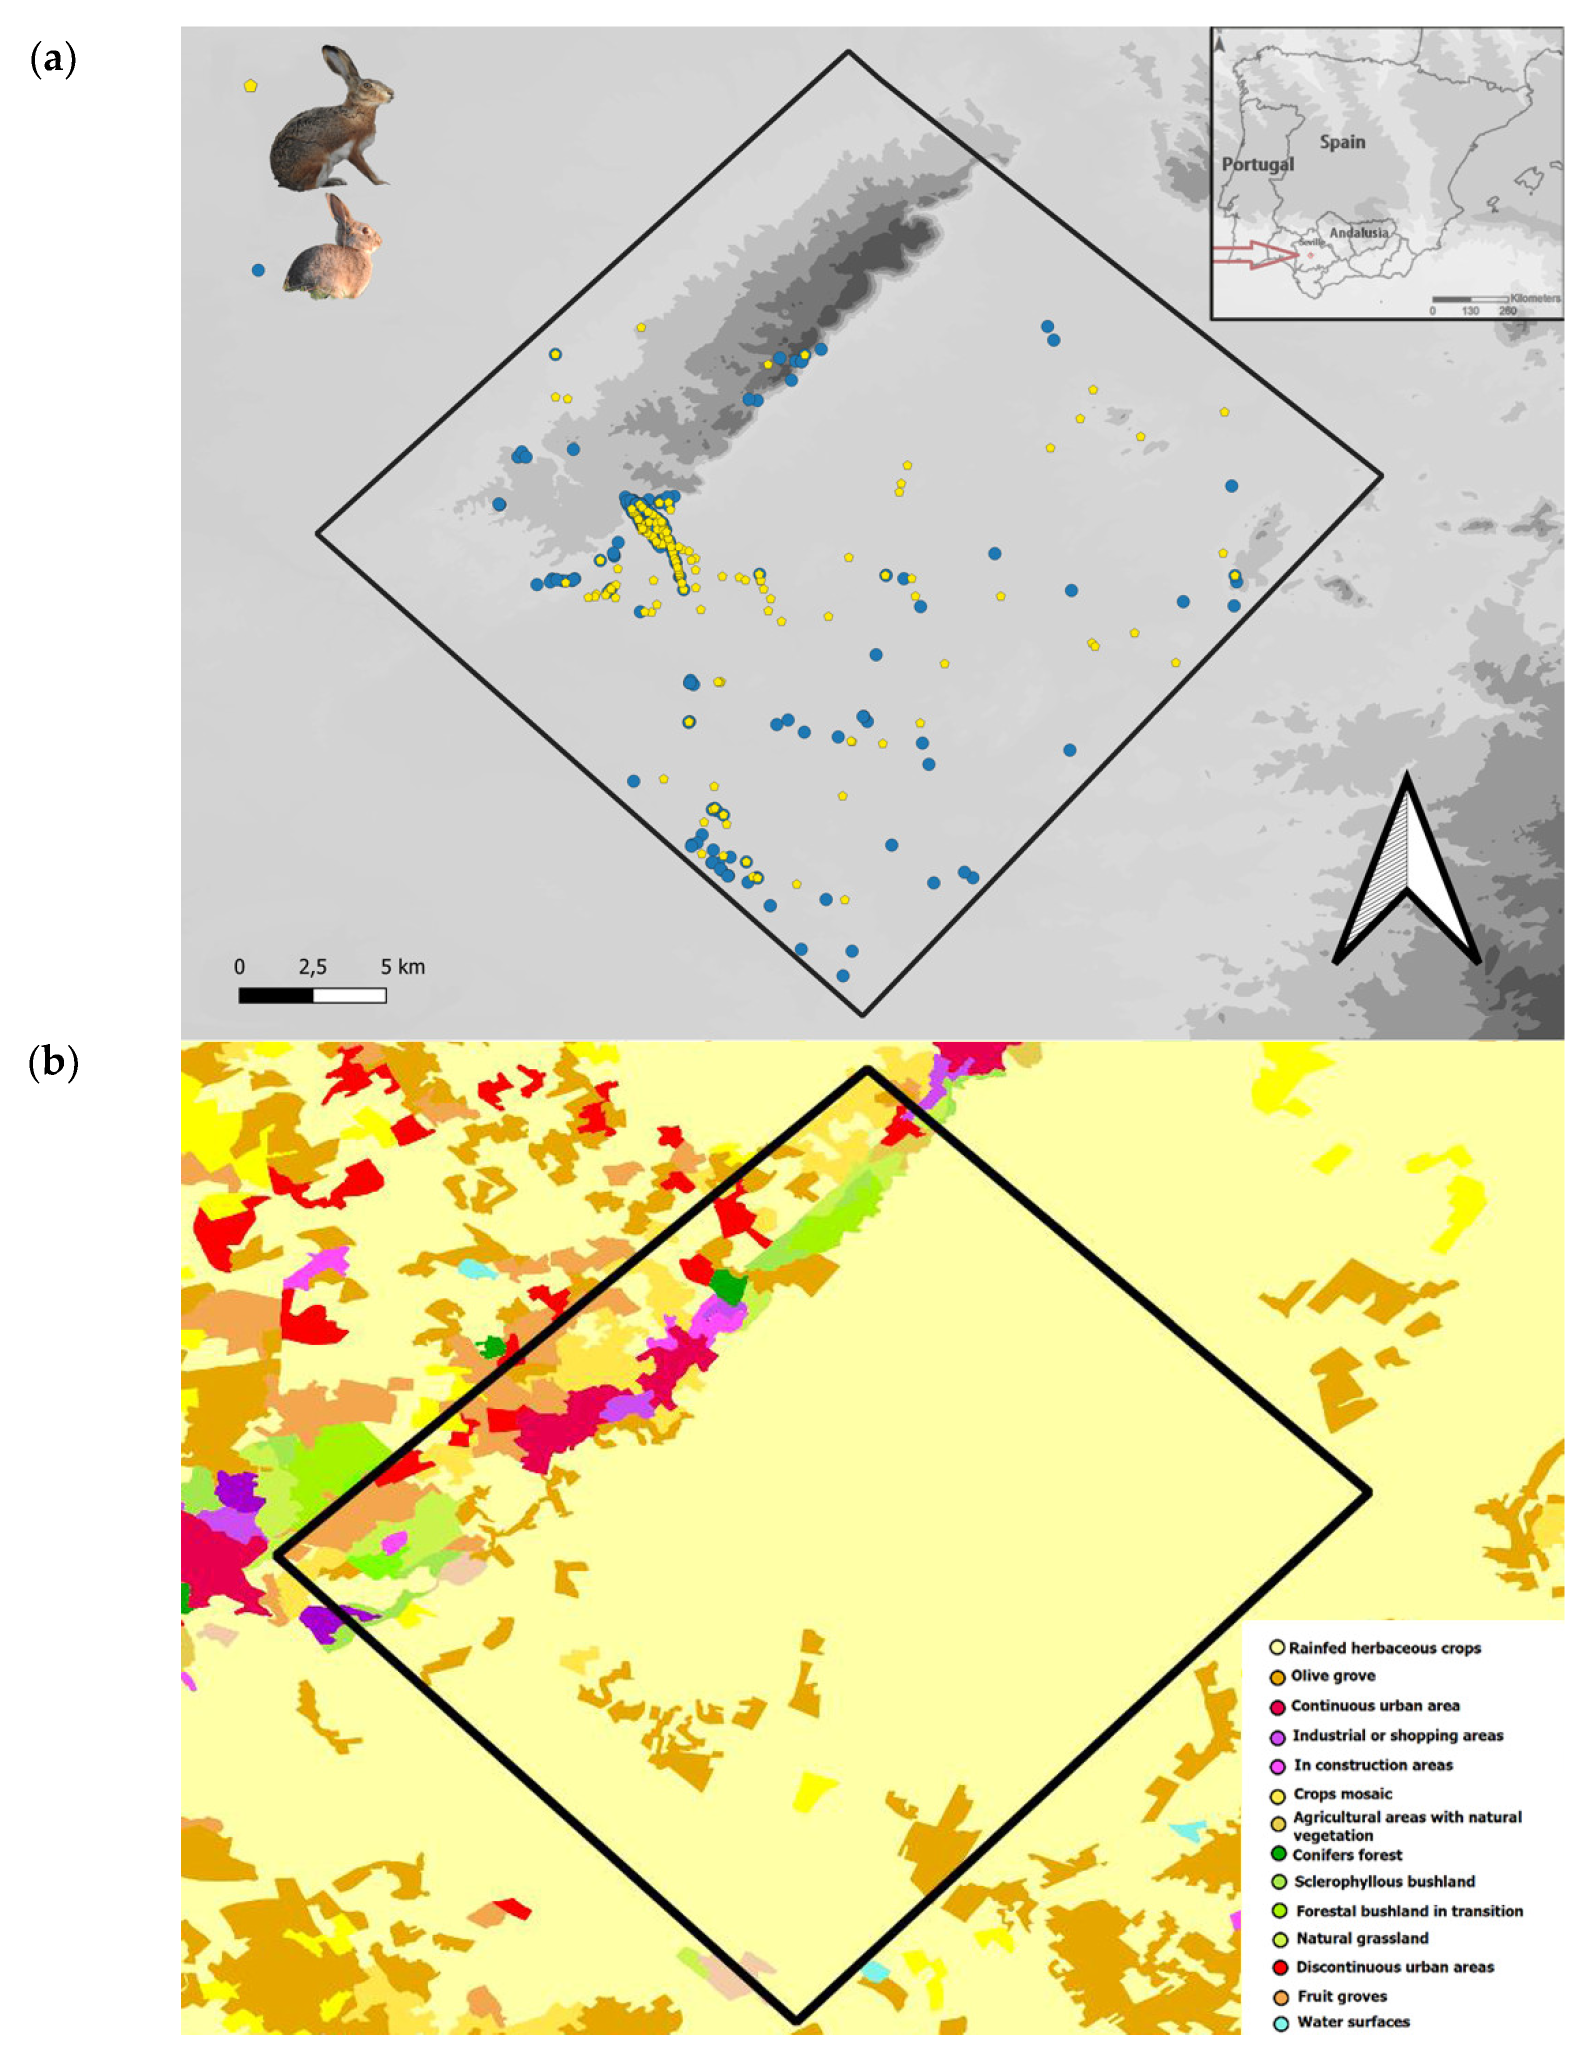
2.1. Study Area
2.2. Lagomorph Censuses
2.3. Data Analysis
3. Results
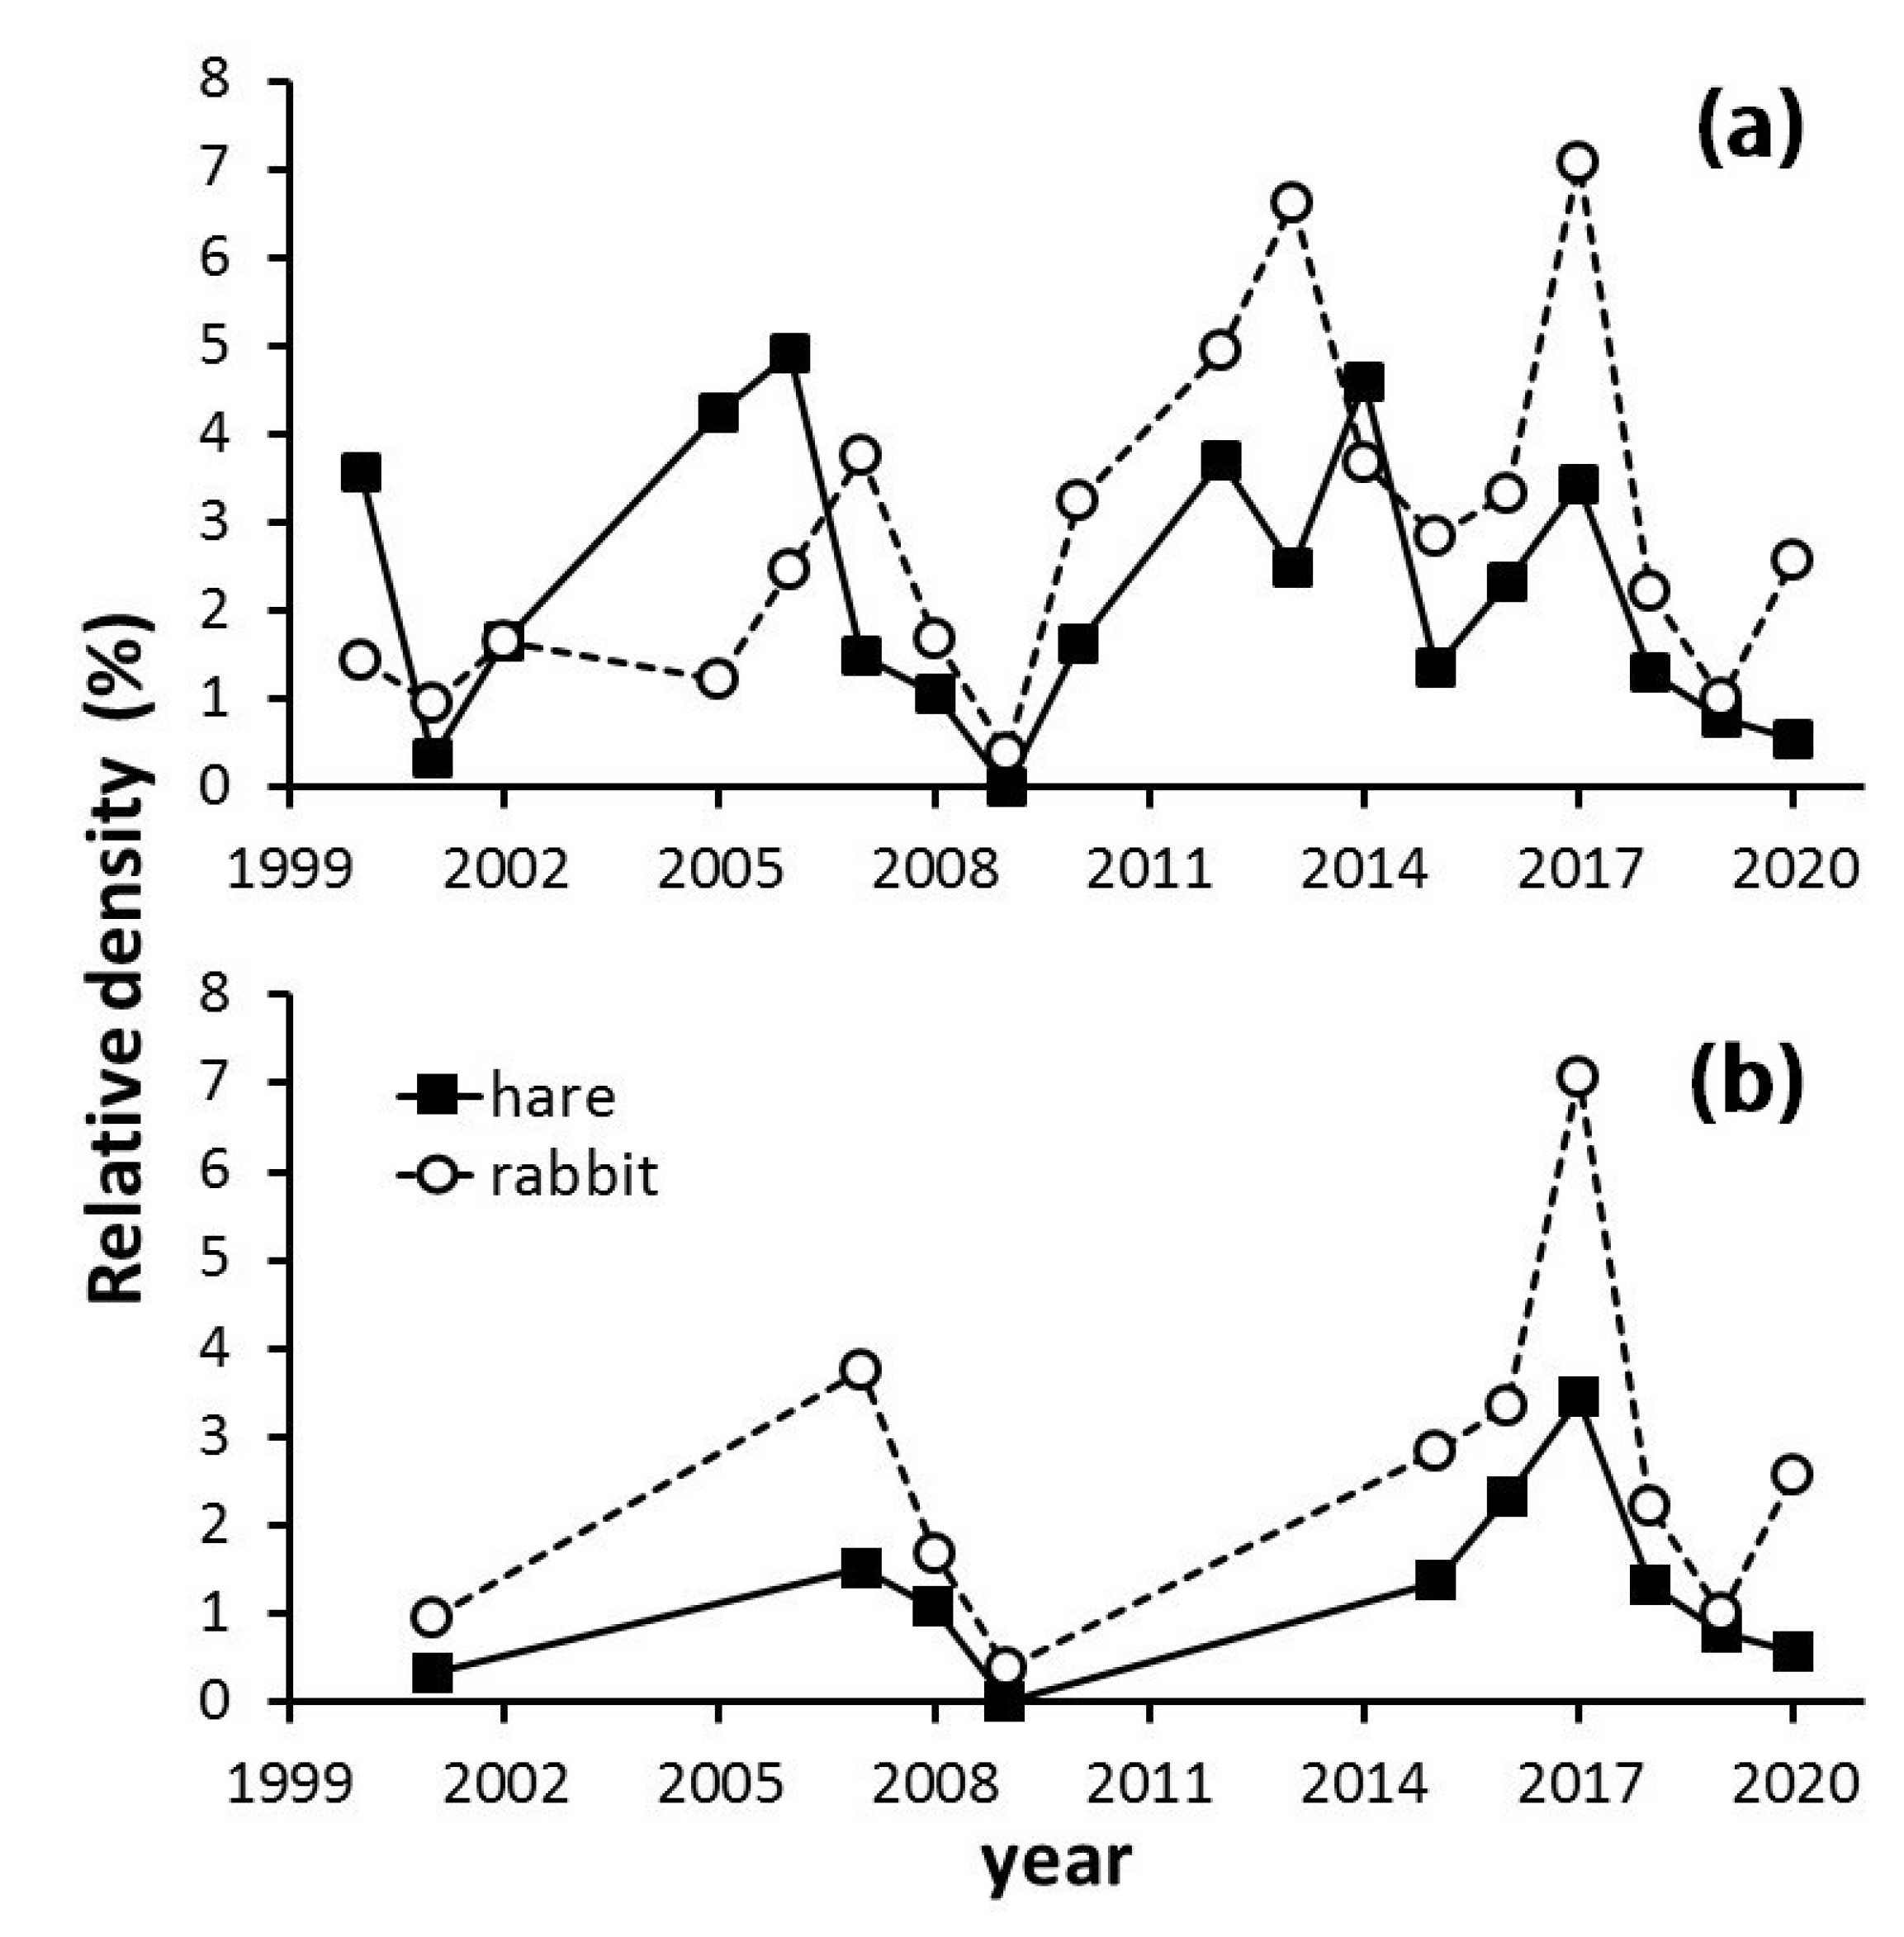
3.1. Long-Term Population Tendencies of Hare and Rabbit
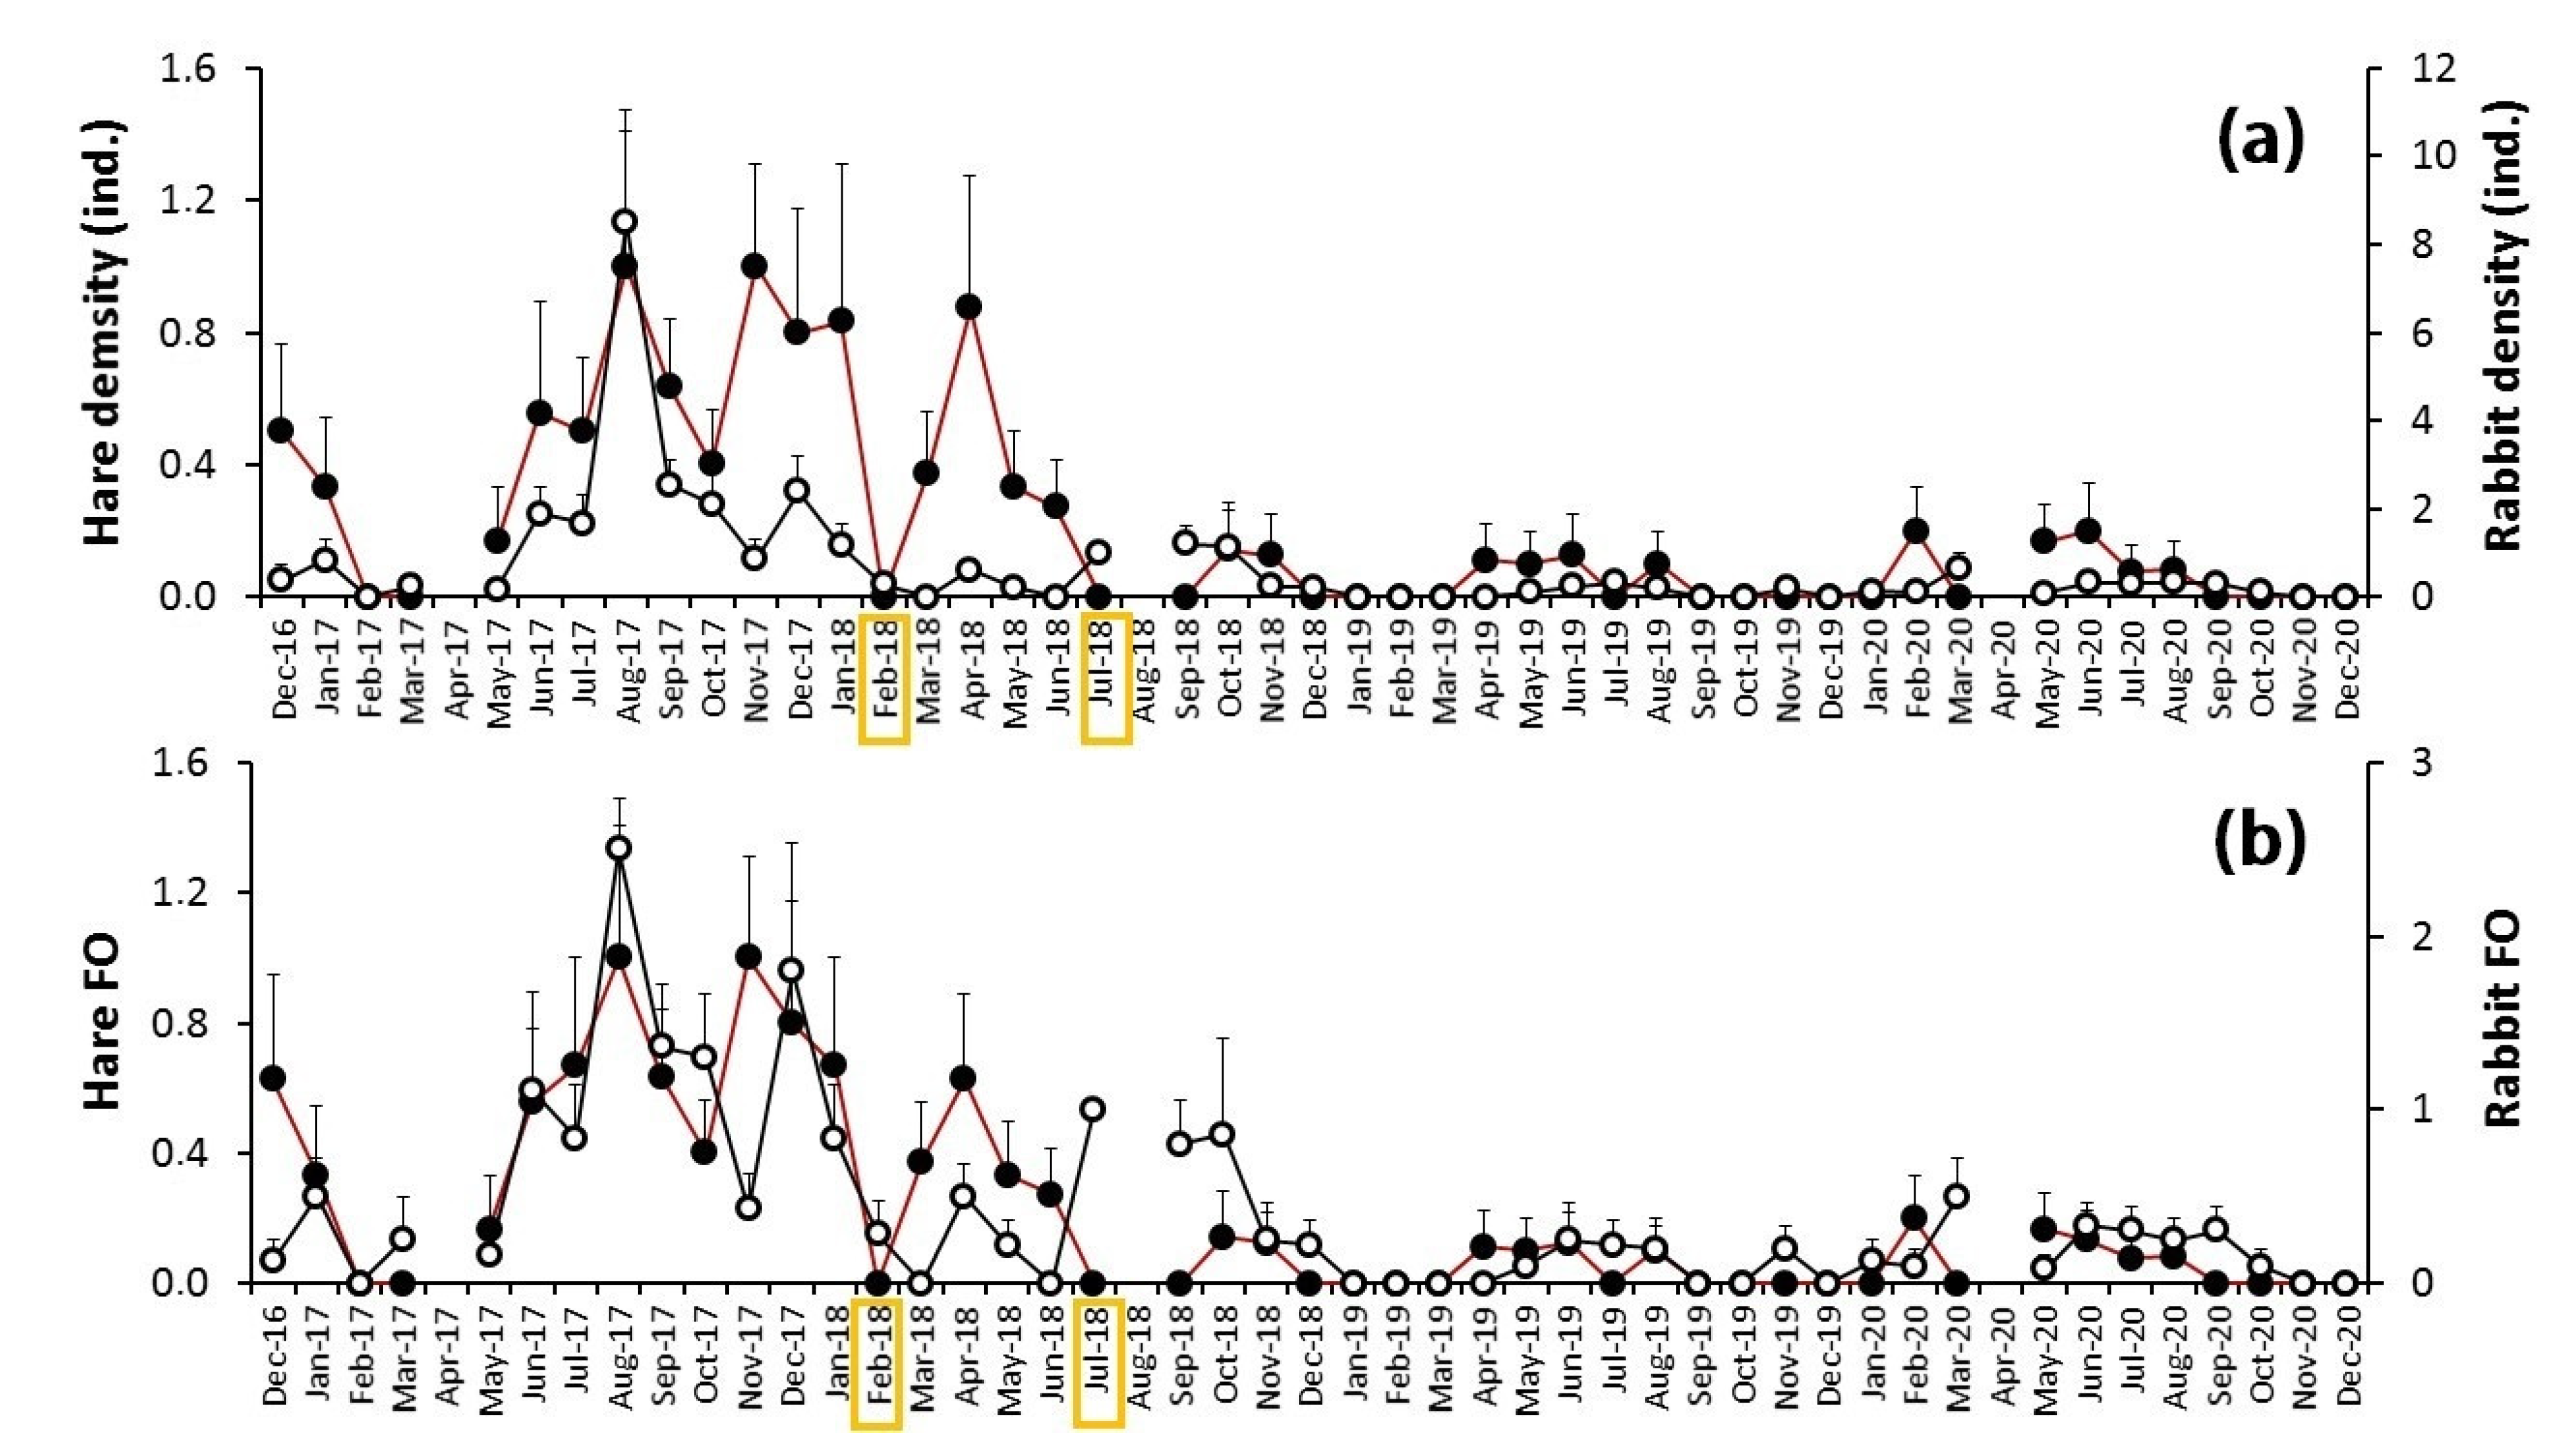
3.2. The Myxomatosis Outbreak
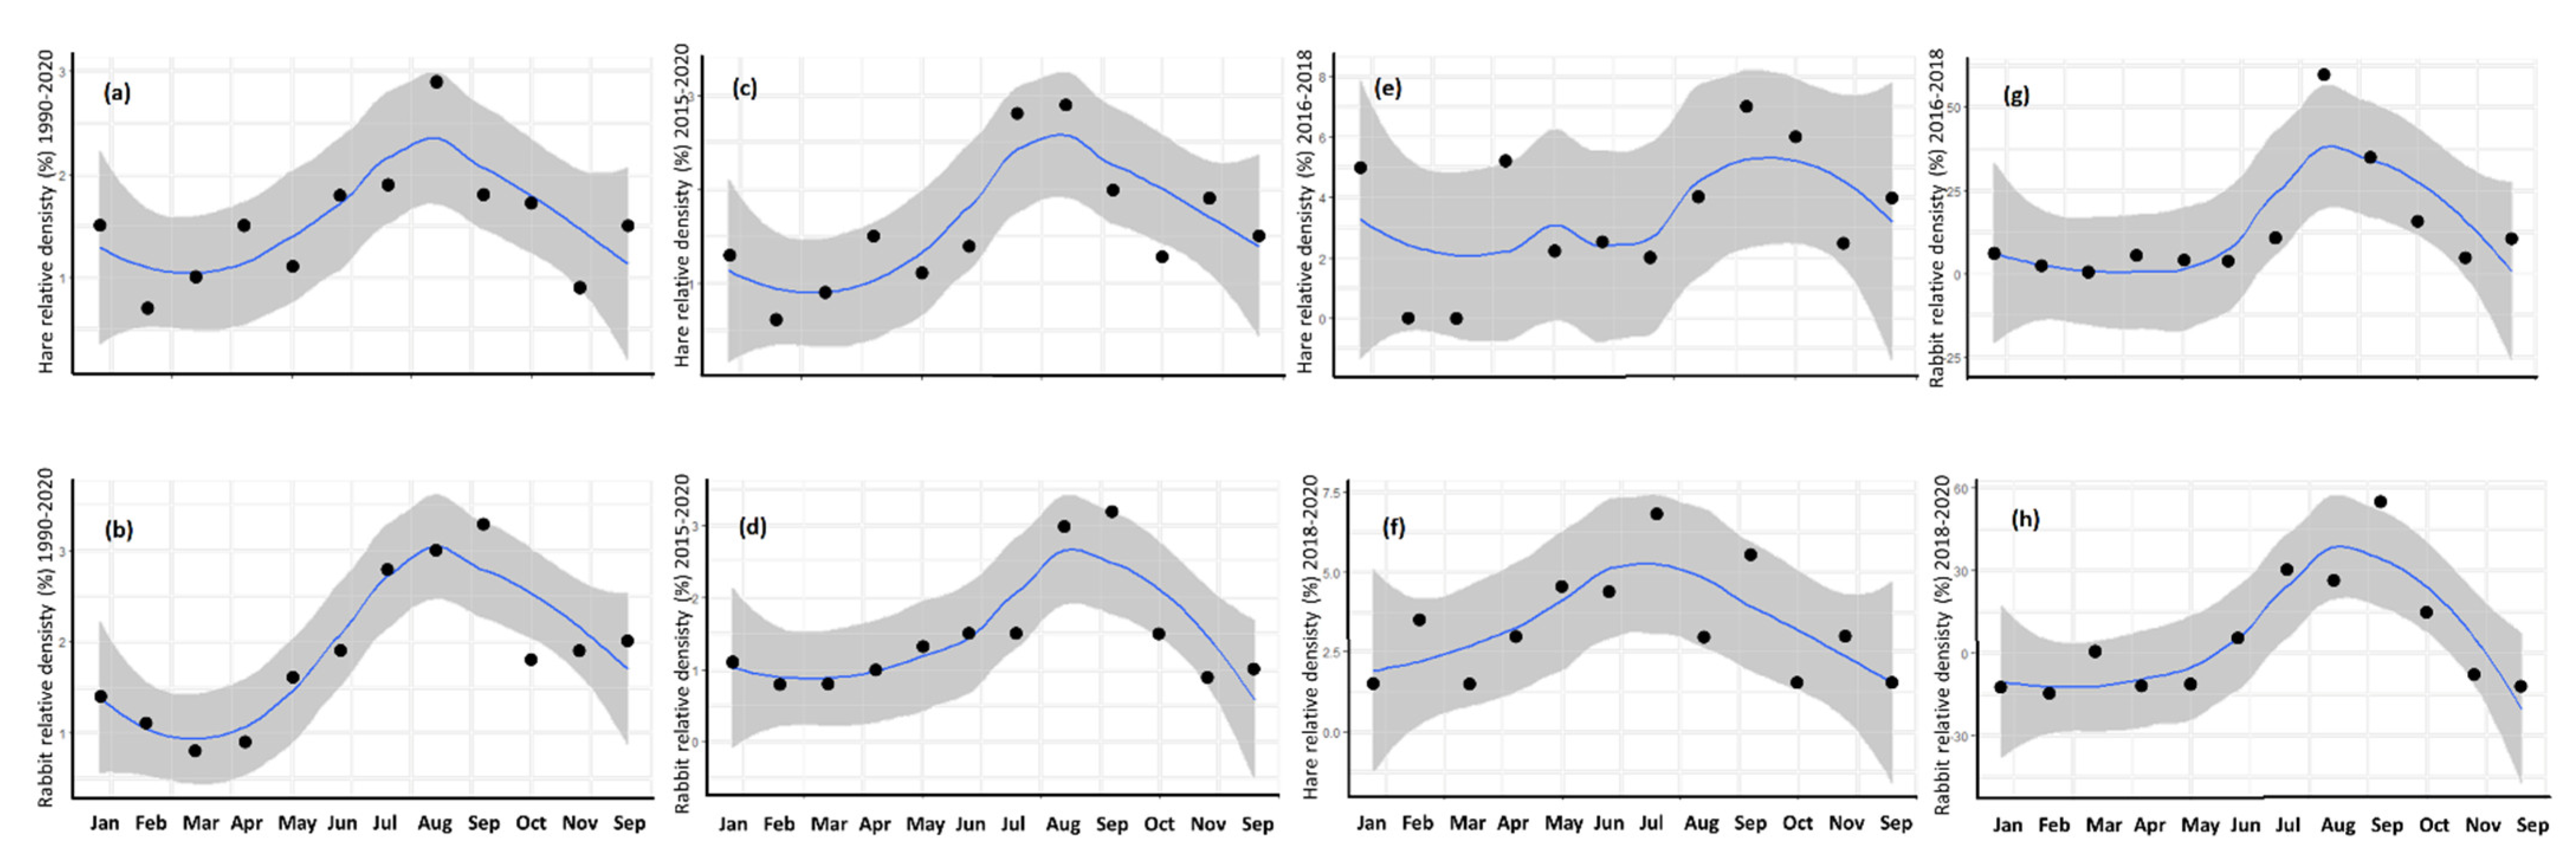
3.3. Annual Cycle
3.4. Daily Cycle
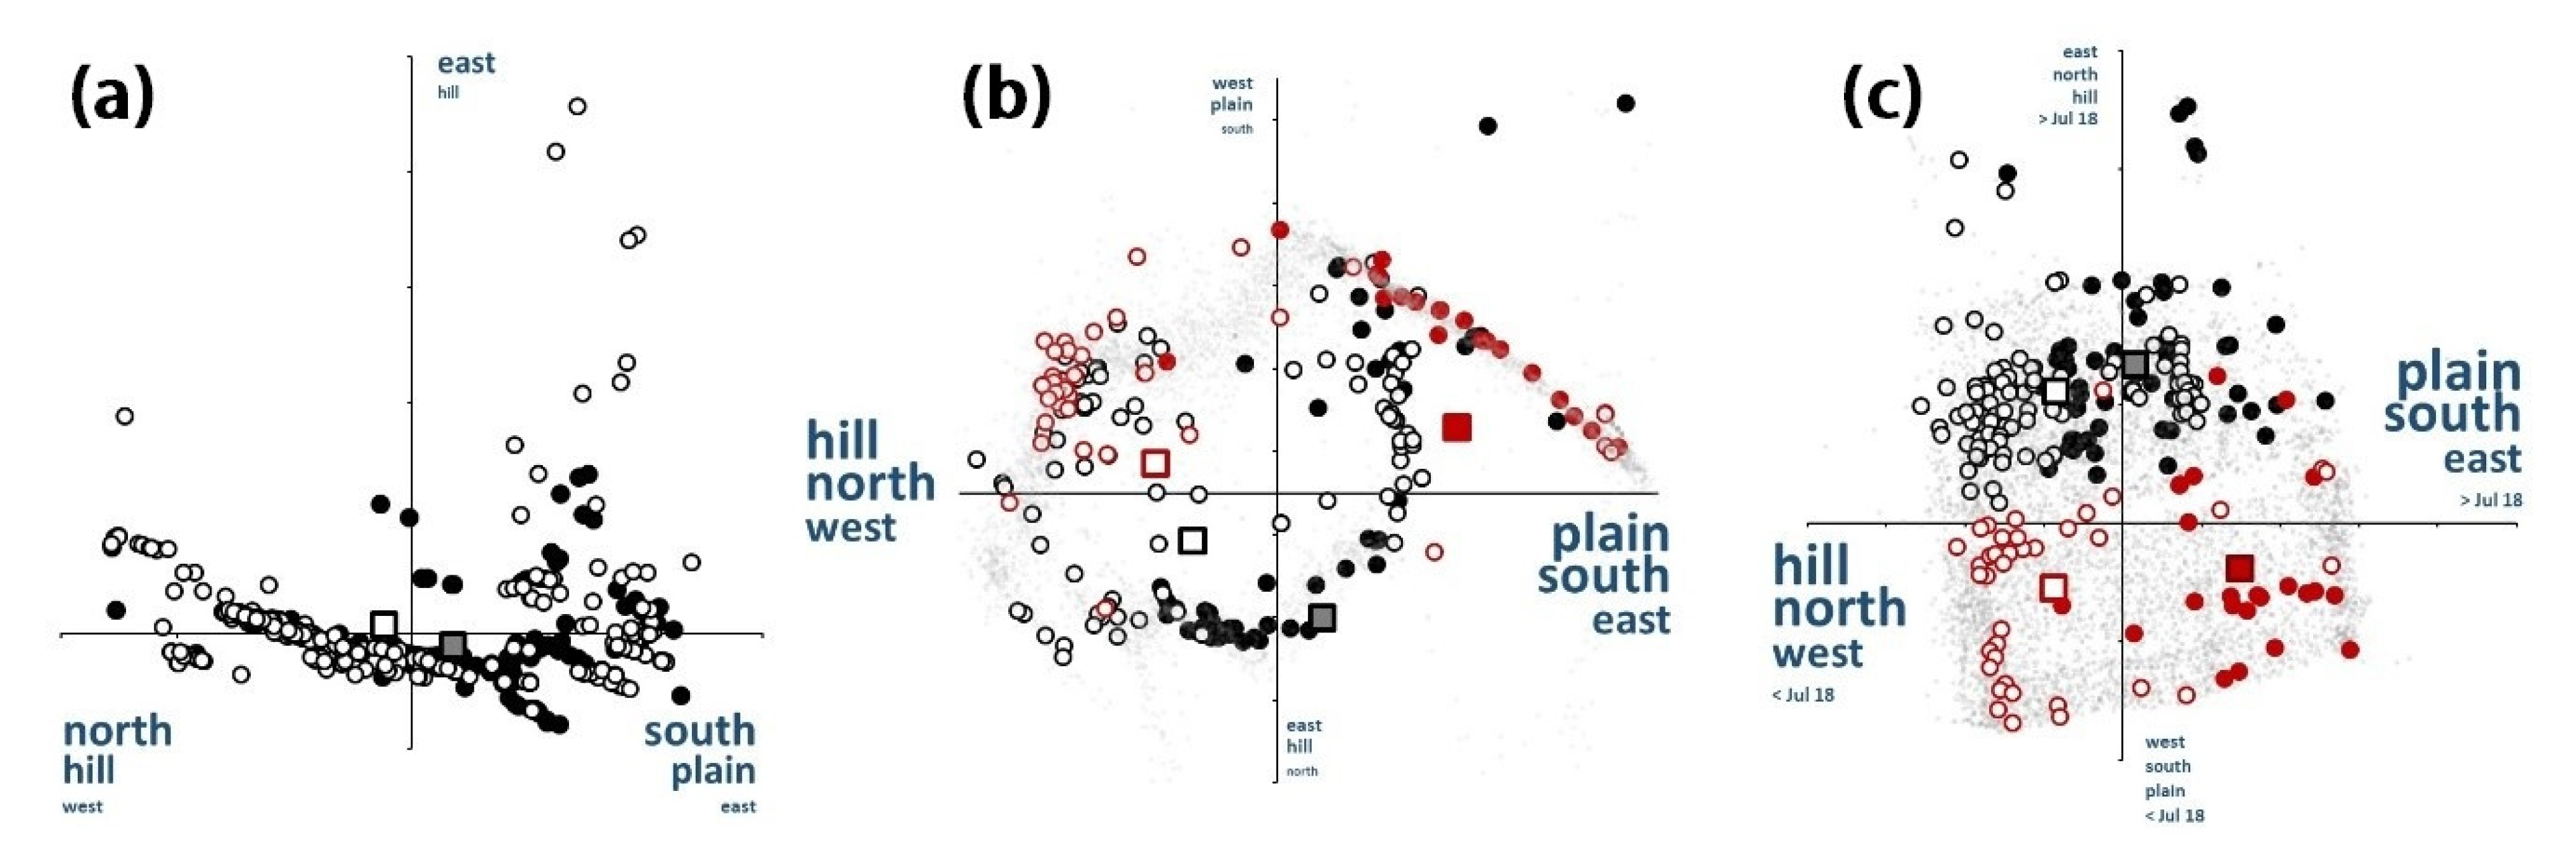
3.5. Spatio-Temporal Relationships
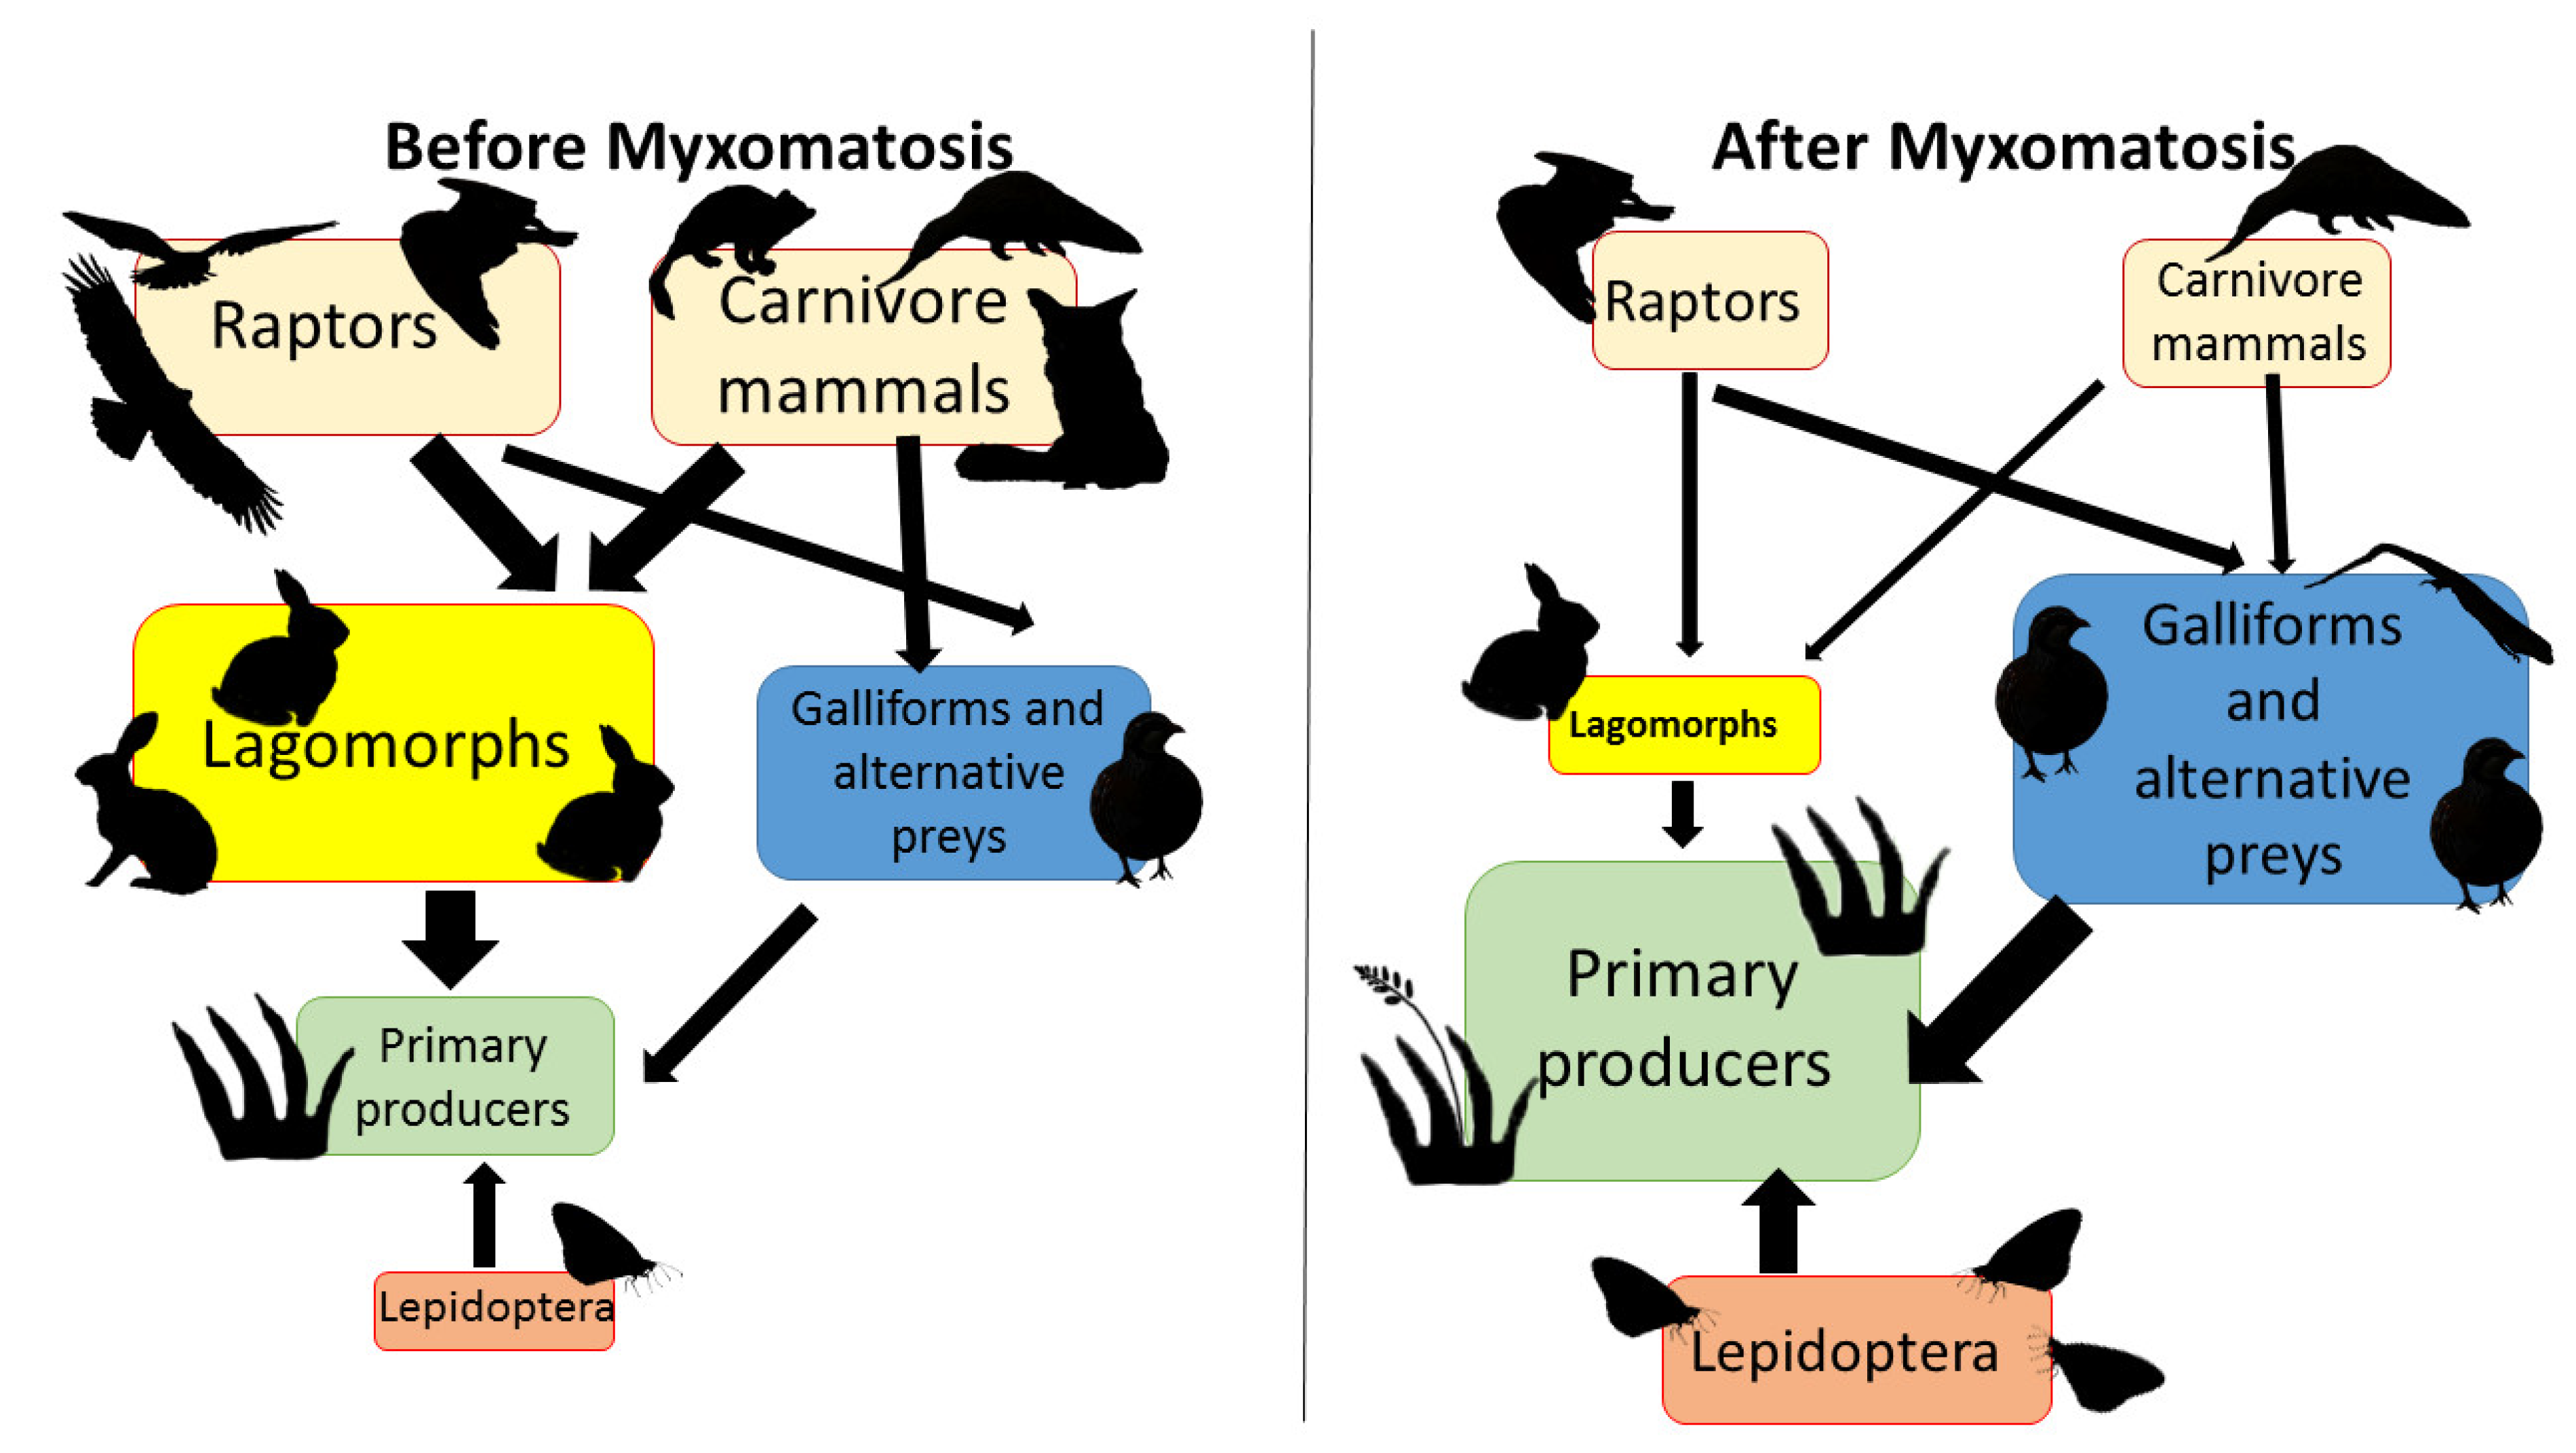
3.6. Niche Assemblage Consequences
4. Discussion
4.1. Long-Term Population Tendencies of Hare and Rabbit
4.2. The Myxomatosis Outbreak (2018–2020)
4.3. Annual Cycle
4.4. Daily Cycle
4.5. Spatio-Temporal Relationships
4.6. Niche Assemblages
5. Conclusions
Supplementary Materials
Author Contributions
Funding
Institutional Review Board Statement
Informed Consent Statement
Data Availability Statement
Conflicts of Interest
References
- Lees, A.C.; Bell, D.J. A conservation paradox for the 21st century: The European wild rabbit Oryctolagus cuniculus, an invasive alien and an endangered native species. Mammal Rev. 2008, 38, 304–320. [Google Scholar] [CrossRef]
- Delibes-Mateos, M.; Redpath, S.M.; Angulo, E.; Ferreras, P.; Villafuerte, R. Rabbits as a keystone species in southern Europe. Biol. Conserv. 2007, 137, 149–156. [Google Scholar] [CrossRef]
- Delibes, M.; Palacios, F.; Garzón, J.; Castroviejo, J. Notes sur l’alimentation et la biologie du lynx pardelle, Lynx pardina (Temminck, 1824) en Espagne. Mammalia 1975, 39, 387–393. [Google Scholar] [CrossRef]
- Aymerich, M. Étude comparative des régimes alimentaires du lynx pardelle (Lynx pardina Temminck, 1824) et du chat sauvage (Felis silvestris Schreber, 1777) au centre de la péninsule Ibérique. Mammalia 1982, 46, 515–521. [Google Scholar] [CrossRef]
- Valverde, J.A. Estructura de una comunidad de vertebrados terrestres. Monogr. Estac. Biológica Doñana 1967, 1, 218. [Google Scholar]
- Moren, L.M. Historia Natural del Águila Imperial Ibérica (Aquila Adalberti Brehm, 1861). Taxonomía, Población, Análisis de la Distribución Geográfica, Alimentación, Reproducción y Conservación. Colección Técnica; Publicaciones del Instituto Nacional para la Conservación de la Naturaleza: Madrid, Spain, 1991; p. 208. [Google Scholar]
- Palomo, L.J.; Gisbert, J.; Blanco, J.C. (Eds.) Atlas y Libro Rojo de los Mamíferos Terrestres de España; Organismo Autónomo de Parques Nacionales: Madrid, Spain, 2007. [Google Scholar]
- Palacios, F.; Meijide, M. Distribución geográfica y hábitat de las liebres en la península Ibérica. Nat. Hisp. 1979, 19, 1–40. [Google Scholar]
- Tapia, L.; Domínguez, J.; Rodriguez, L. Modelling habitat use by Iberian hare Lepus granatensis and European wild rabbit Oryctolagus cuniculus in a mountainous area in northwestern Spain. Acta Thériol. 2010, 55, 73–79. [Google Scholar] [CrossRef]
- Flux, J.E. A review of competition between rabbits (Oryctolagus cuniculus) and hares (Lepus europaeus). In Lagomorph Biology—Evolution, Ecology and Conservation; Alves, P.C., Ferrand, N., Hackländer, K., Eds.; Springer: Berlin/Heidelberg, Germany, 2008; pp. 241–249. [Google Scholar] [CrossRef]
- Barnes, R.F.W.; Tapper, S.C. Consequences of the myxomatosis epidemic in Britain’s rabbit (Oryctolagus cuniculus L.) population on the numbers of brown hares (Lepus europaeus Pallas). Mammal Rev. 1986, 16, 111–116. [Google Scholar] [CrossRef]
- Broekhuizen, S. The Position of the Wild Rabbit in the Life System of the European Hare; XII Congress of the International Union of Game Biologists: Cernier, Switzerland, 1975; pp. 75–80. [Google Scholar]
- Águeda-Pinto, A.; Kraberger, S.; Everts, A.; Gutierrez-Jensen, A.; Glenn, H.L.; Dalton, K.P.; Podadera, A.; Parra, F.; Martinez-Haro, M.; Viñuelas, J.A.; et al. Identification of a Novel Myxoma Virus C7-Like Host Range Factor That Enabled a Species Leap from Rabbits to Hares. mBio 2022, 13, e03461-21. [Google Scholar] [CrossRef]
- García-Bocanegra, I.; Camacho-Sillero, L.; Risalde, M.A.; Dalton, K.P.; Caballero-Gómez, J.; Agüero, M.; Zorrilla, I.; Gómez-Guillamón, F. First outbreak of myxomatosis in Iberian hares (Lepus granatensis). Transbound. Emerg. Dis. 2019, 66, 2204–2208. [Google Scholar] [CrossRef]
- García-Bocanegra, I.; Díaz-Cao, J.M.; Gómez-Guillamón, F.; Camacho-sillero, L. Estudio Epidemiológico de los Brotes de Mixomatosis en Liebre Ibérica (Lepus granatensis) en España. Informe de Resultados. Master’s Thesis, University of Cordoba, Córdoba, Spain, 2019; p. 10. [Google Scholar]
- Purroy, F.J. Liebre ibérica—Lepus granatensis. In Enciclopedia Virtual de los Vertebrados Españoles; Salvador, A., Barja, I., Eds.; Museo Nacional de Ciencias Naturales: Madrid, Spain, 2017; Available online: http://www.vertebradosibericos.org/ (accessed on 2 February 2022).
- Calvete, C.; Estrada, R.; Villafuerte, R.; Osácar, J.J.; Lucientes, J. Epidemiology of viral haemorrhagic disease and myxomatosis in a free-living population of wild rabbits. Veter. Rec. 2002, 150, 776–782. [Google Scholar] [CrossRef] [PubMed] [Green Version]
- Moreno, S.; Beltrán, J.F.; Cotilla, I.; Kuffner, B.; Laffite, R.; Jordán, G.; Ayala, J.; Quintero, C.; Jiménez, A.; Castro, F.; et al. Long-term decline of the European wild rabbit (Oryctolagus cuniculus) in south-western Spain. Wildl. Res. 2007, 34, 652–658. [Google Scholar] [CrossRef] [Green Version]
- González, L.M.; Margalida, A.; Sanchez, R.; Oria, J. Supplementary feeding as an effective tool for improving breeding success in the Spanish imperial eagle (Aquila adalberti). Biol. Conserv. 2006, 129, 477–486. [Google Scholar] [CrossRef]
- López-Bao, J.V.; Rodríguez, A.; Palomares, F. Behavioural response of a trophic specialist, the Iberian lynx, to supplementary food: Patterns of food use and implications for conservation. Biol. Conserv. 2008, 141, 1857–1867. [Google Scholar] [CrossRef]
- Carvalho, C.L.; Abade dos Santos, F.A.; Monteiro, M.; Carvalho, P.; Mendonça, P.; Duarte, M.D. First cases of myxomatosis in Iberian hares (Lepus granatensis) in Portugal. Vet. Rec. Case Rep. 2020, 8, e001044. [Google Scholar] [CrossRef]
- García-Bocanegra, I.; Camacho-Sillero, L.; Caballero-Gómez, J.; Agüero, M.; Gómez-Guillamón, F.; Ruiz-Casas, J.M.; Díaz-Cao, J.M.; García, E.; Ruano, M.J.; de la Haza, R. Monitoring of emerging myxoma virus epidemics in Iberian hares (Lepus granatensis) in Spain, 2018–2020. Transbound. Emerg. Dis. 2020, 68, 1275–1282. [Google Scholar] [CrossRef]
- González, C. La Mixomatosis Ataca: Imposible Cazar Liebres. ABC de Sevilla (PROVINCIA). 2018. Available online: https://sevilla.abc.es/provincia/sevi-mixomatosis-ataca-imposible-cazar-liebres-201810140937_noticia.html (accessed on 14 January 2022).
- Langbein, J.; Hutchings, M.; Harris, S.; Stoate, C.; Tapper, S.C.; Wray, S. Techniques for assessing the abundance of Brown Hares Lepus europaeus. Mammal Rev. 1999, 29, 93–116. [Google Scholar] [CrossRef]
- Broenniman, O.; Di Cola, V.; Petitpierre, B.; Breiner, F.; Scherrer, D.; D’ Amen, M.; Randin, C.; Engler, R.; Hordijk, W.; Mod, H.; et al. Ecospat: Spatial Ecology Miscellaneous Methods; R Package: Netanya, Israel, 2016. [Google Scholar]
- R Development Core Team 2013. R: A Language and Environment for Statistical Computing. R Foundation for Statistical Computing, Vienna, Austria. Available online: https://www.R-project.org/ (accessed on 14 January 2022).
- Di Cola, V.; Brönnimann, O.; Petitpierre, B.; Breiner, F.T.; D’Amen, M.; Randin, C.; Engler, R.; Pottier, J.; Pio, D.; Dubuis, A.; et al. ecospat: An R package to support spatial analyses and modeling of species niches and distributions. Ecography 2017, 40, 774–787. [Google Scholar] [CrossRef]
- Fick, S.E.; Hijmans, R.J. WorldClim 2, New 1-km spatial resolution climate surfaces for global land areas. Int. J. Climatol. 2017, 37, 4302–4315. [Google Scholar] [CrossRef]
- REDIAM. WMS Modelo Digital de Elevaciones (MDE) de Andalucía. 2021. Available online: http://www.juntadeandalucia.es/medioambiente/mapwms/REDIAM_mde_andalucia? (accessed on 10 February 2022).
- REDIAM. WMS CORINE Land Cover de Andalucía, escala 1,100.000, año 2000. 2021. Available online: http://www.ideandalucia.es/catalogo/inspire/static/api/records/d00ce145bdde13312b9ee9bcf80a8d7fab3f0525 (accessed on 27 December 2021).
- MAPA, Ministerio de Agricultura, Pesca y Alimentación. 2020. Available online: https://www.mapa.gob.es/es/desarrollo-rural/estadisticas/Est_Anual_Caza.aspx (accessed on 6 February 2022).
- Petrovan, S.O. The Landscape Ecology of Brown Hares and European Rabbits in Pastures in the North East of England. Ph.D. Thesis, University of Hull, Hull, UK, 2011. [Google Scholar]
- Viviano, A.; Mori, E.; Fattorini, N.; Mazza, G.; Lazzeri, L.; Panichi, A.; Strianese, L.; Mohamed, W. Spatiotemporal Overlap between the European Brown Hare and Its Potential Predators and Competitors. Animals 2021, 11, 562. [Google Scholar] [CrossRef]
- Carro, F.; Soriguer, R. Long-term patterns in Iberian hare population dynamics in a protected area (Doñana National Park) in the southwestern Iberian Peninsula: Effects of weather conditions and plant cover. Integr. Zoöl. 2017, 12, 49–60. [Google Scholar] [CrossRef] [PubMed]
- Martins, H.; Milne, J.A.; Rego, F. Seasonal and spatial variation in the diet of the wild rabbit (Oryctolagus cuniculus L.) in Portugal. J. Zool. 2002, 258, 395–404. [Google Scholar] [CrossRef] [Green Version]
- Sæther, B.-E. Environmental stochasticity and population dynamics of large herbivores: A search for mechanisms. Trends Ecol. Evol. 1997, 12, 143–149. [Google Scholar] [CrossRef]
- Hunter, L.M. The Environmental Implications of Population Dynamics; Rand Corporation: Chicago, IL, USA, 2000. [Google Scholar]
- Hernández, Ó.; Sánchez-García, C.; Tizado, E.J. Impact of myxomatosis on densities of Iberian hares (Lepus granatensis) in North-western Spain: Implications for management and sustainable hunting. Eur. Zoöl. J. 2022, 89, 211–216. [Google Scholar] [CrossRef]
- Fenner, F.; Marshall, I.D.; Woodroofe, G.M. Studies in the epidemiology of infectious myxomatosis of rabbits: I. Recovery of Australian wild rabbits (Oryctolagus Cuniculus) from myxomatosis under field conditions. J. Hyg. 1953, 51, 225–244. [Google Scholar] [CrossRef]
- Gálvez-Bravo, L. Conejo—Oryctolagus Cuniculus. In Enciclopedia Virtual de los Vertebrados Españoles; Salvador, A., Barja, I., Eds.; Museo Nacional de Ciencias Naturales: Madrid, Spain, 2017. Available online: http://www.vertebradosibericos.org/ (accessed on 12 January 2022).
- Abade dos Santos, F.A.; Santos, N.; Carvalho, C.; Martinez, M.; Gortazar, C.; García-Bocanegra, I.; Duarte, M.; Alves, P. Serology Unveils Decades-Long Contact of the Iberian Hare, Lepus Granatensis, with Myxoma or Antigenically-Related Virus; Authorea Preprints: Hoboken, NJ, USA, 2020. [Google Scholar]
- Edwards, P.J.; Fletcher, M.R.; Berny, P. Review of the factors affecting the decline of the European brown hare, Lepus europaeus (Pallas, 1778) and the use of wildlife incident data to evaluate the significance of paraquat. Agric. Ecosyst. Environ. 2000, 79, 95–103. [Google Scholar] [CrossRef]
- Pepin, D.; Cargnelutti, B. Dispersion and home range acquisition of restocked hares (Lepus europaeus). Biol. Behav. Fr. 1985, 10, 4. [Google Scholar]
- Andre, J.; Beltrán, J.F.; Iborra, O.; Soriguer, R.C. Lepus granatensis density and distribution in the Doñana National Park (Spain). In Proceedings of the XIIth Lagomorph Workshop; Marboutin, E., Berthos, J.-C., Eds.; Abstract; Gibier Faune Sauvage: Paris, France, 1997; Volume 14, p. 497. [Google Scholar]
- Wibbelt, G.; Frölich, K. Infectious Diseases in European Brown Hare (Lepus europaeus). Portuguese Wildlife Society: Braga, Portugal, 2005; pp. 86–93. [Google Scholar]
- Mead-Briggs, A.R.; Vaughan, J.A. The differential transmissibility of myxoma virus strains of differing virulence grades by the rabbit flea Spilopsyllus cuniculi (Dale). J. Hyg. 1975, 75, 237–247. [Google Scholar] [CrossRef] [Green Version]
- Alves, P.; Gonçalves, H.; Santos, M.; Rocha, A. Reproductive biology of the Iberian hare, Lepus granatensis, in Portugal. Mamm. Biol. 2002, 67, 358–371. [Google Scholar] [CrossRef]
- Flux, J.E.C. Timing of the breeding season in the hare, Lepus europaeus Pallas, and rabbit, Oryctolagus cuniculus (L.). Mammalia 1965, 29, 557–562. [Google Scholar] [CrossRef]
- Alves, P.C.; Rocha, A. Environmental factors have little influence on the reproductive activity of the Iberian hare (Lepus granatensis). Wildl. Res. 2003, 30, 639–647. [Google Scholar] [CrossRef]
- Watson, J.S. Reproduction of the wild rabbit, Oryctolagus cuniculus (L.) in Hawke’s Bay, New Zealand. N. Z. J. Sci. Tech. B 1957, 38, 451–482. [Google Scholar]
- Shipp, E.; Keith, K.; Hughes, L.R.; Myers, K. Reproduction in a free-living population of domestic rabbits, Oryctolagus cuniculus (L.), on a sub-antarctic island. Nat. Lond 1963, 200, 858–860. [Google Scholar] [CrossRef]
- Rogers, P.M.; Arthur, A.D.; Soriguer, R.C. The rabbit in continental Europe. In The European Rabbit. The History and Biology of a Successful Colonizer; Thompson, K., King, C.M., Eds.; Oxford University Press: Oxford, UK, 1994; pp. 22–57. [Google Scholar]
- Monterroso, P.; Alves, P.C.; Ferreras, P. Catch Me If You Can: Diel Activity Patterns of Mammalian Prey and Predators. Ethology 2013, 119, 1044–1056. [Google Scholar] [CrossRef] [Green Version]
- Pépin, D.; Cargnelutti, B. Studies on the European hare. 51. Individual variations of daily activity patterns in radiotracked European hares during winter. Acta Thériol. 1994, 39, 399–409. [Google Scholar] [CrossRef] [Green Version]
- Carro, F.; Fernández, A.; Castién, E.; Andreu, A.C.; Beltrán, J.F.; Díaz, R.; Soriguer, R.C. El uso del espacio y del tiempo por las liebres. In La liebre Ibérica. Naturaleza y Parques Nacionales. Serie Técnica; Carro, F., Soriguer, R.C., Eds.; Organismo Autónomo Parques Nacionales: Madrid, Spain, 2010; pp. 134–165, 364. [Google Scholar]
- Rodríguez, M.; Palacios, J.; Martín, J.A.; Yanes, T.; Martín García, P.; Sánchez, C.; Navesco, M.A.; Muñoz, R. La Liebre; Ediciones Mundi-Prensa: Madrid, Spain, 1997. [Google Scholar]
- Villafuerte, R.; Kufner, M.B.; Delibes, M.; Moreno, S. Environmental factors influencing the seasonal daily activity of the European rabbit (Oryctolagus cuniculus) in a Mediterranean area. Mammalia 1993, 57, 341–347. [Google Scholar] [CrossRef] [Green Version]
- Díez, C.; Pérez, J.A.; Prieto, R.; Alonso, M.E.; Olmedo, J.A. Activity patterns of wild rabbit (Oryctolagus cuniculus L. 1758), under semi-freedom conditions, during autumn and winter. Wildl. Biol. Pract. 2005, 1, 41–46. [Google Scholar]
- Laguna, E.; Barasona, J.A.; Triguero-Ocaña, R.; Mulero-Pázmány, M.; Negro, J.J.; Vicente, J.; Acevedo, P. The relevance of host overcrowding in wildlife epidemiology: A new spatially explicit aggregation index. Ecol. Indic. 2018, 84, 695–700. [Google Scholar] [CrossRef]
- Stott, P. Use of space by sympatric European hares (Lepus europaeus) and European rabbits (Oryctolagus cuniculus) in Australia. Mamm. Biol. 2003, 68, 317–327. [Google Scholar] [CrossRef]
- Lush, L.; Ward, A.I.; Wheeler, P. Dietary niche partitioning between sympatric brown hares and rabbits. J. Zool. 2017, 303, 36–45. [Google Scholar] [CrossRef]
- Sobrino, R.; Acevedo, P.; Escudero, M.A.; Marco, J.; Gortázar, C. Carnivore population trends in Spanish agrosystems after the reduction in food availability due to rabbit decline by rabbit haemorrhagic disease and improved waste management. Eur. J. Wildl. Res. 2009, 55, 161–165. [Google Scholar] [CrossRef]
- Ferreras, P.; Travaini, A.; Zapata, S.C.; Delibes, M. Short-term responses of mammalian carnivores to a sudden collapse of rabbits in Mediterranean Spain. Basic Appl. Ecol. 2011, 12, 116–124. [Google Scholar] [CrossRef] [Green Version]
- Gamfeldt, L.; Hillebrand, H.; Jonsson, P.R. Species richness changes across two trophic levels simultaneously affect prey and consumer biomass. Ecol. Lett. 2005, 8, 696–703. [Google Scholar] [CrossRef]
- Sumption, K.J.; Flowerdew, J.R. The ecological effects of the decline in rabbits (Oryctolagus cuniculus L.) due to myxomatosis. Mammal Rev. 1985, 15, 151–186. [Google Scholar] [CrossRef]
- Fenner, F.; Ross, J. Myxomatosis. In The European Rabbit. The History and Biology of a Successful Colonizer; Thompson, H.V., King, C.M., Eds.; Oxford University Press: Oxford, UK, 1994; pp. 205–240. [Google Scholar]
- Martinez-Haro, M.; Chinchilla, J.M.; Camarero, P.R.; Viñuelas, J.A.; Crespo, M.J.; Mateo, R. Determination of glyphosate exposure in the Iberian hare: A potential focal species associated to agrosystems. Sci. Total Environ. 2022, 823, 153677. [Google Scholar] [CrossRef]


| Spearman rs | t (N-2) | p-Level | |
|---|---|---|---|
| Hare density–hare FO | 0.98 | 30.77 | 0.000000 |
| Rabbit density–rabbit FO | 1.00 | 73.03 | 0.000000 |
| Hare density–rabbit density | 0.54 | 4.29 | 0.000096 |
| Hare FO–rabbit FO | 0.50 | 3.80 | 0.000440 |
| Hare density–rabbit FO | 0.50 | 3.84 | 0.000387 |
| Hare FO–rabbit density | 0.54 | 4.30 | 0.000095 |
| 17 June–18 January | 18 March–18 July | ||||||||
|---|---|---|---|---|---|---|---|---|---|
| Hare | Rabbit | Hare | Rabbit | ||||||
| Median | 8:08:56 | 8:49:23 | 7:31:01 | 8:06:43 | |||||
| Minimum | 5:16:50 | 5:14:31 | 5:41:36 | 5:27:53 | |||||
| Maximum | 10:29:14 | 13:53:10 | 10:16:53 | 10:10:02 | |||||
| Cv (%) | 18.7 | 24.5 | 14.9 | 19.4 | |||||
| n | 32 | 61 | 14 | 7 | |||||
| Glm (time~date + species) | Estimate | Std. Error | T value | Pr(>|t|) | Estimate | Std. Error | T value | Pr(>|t|) | |
| Intercept | −3.652 × 10 | 3.694 | −9.886 | 4.92 × 10⁻¹⁶ *** | 3.554 | 1.909 | 1.861 | 0.0642 . | |
| Date | 8.560 × 10⁻⁴ | 8.586 × 10⁻⁵ | 9.970 | 9.970 3.30 × 10⁻¹⁶ *** | −7.209 × 10⁻⁵ | 4.438 × 10⁻⁵ | −1.625 | 0.1058 | |
| Species | 4.024 × 10⁻² | 1.246 × 10⁻² | 3.229 | 0.00174 ** | −2.621 × 10⁻³ | 2.430 × 10⁻² | −0.108 | 0.9142 | |
| PCAs | Factor | Eigenvalue | % Total Variance | Cumulative Variance (%) |
|---|---|---|---|---|
| (1) Coordinates (x, y, z) of lagomorph observations during the entire study period (1995–2020) | 1 | 1.50 | 50.1 | 50.1 |
| 2 | 1.02 | 33.9 | 84.0 | |
| (2) Coordinates (x, y, z) of every sampling point during the intensive survey period (2016–2020) | 1 | 2.28 | 76.1 | 76.1 |
| 2 | 0.62 | 20.7 | 96.8 | |
| (3) Coordinates (x, y, z) plus date of every sampling point during the intensive survey period (2016–2020) | 1 | 2.34 | 57.8 | 57.8 |
| 2 | 1.03 | 25.9 | 83.7 |
| PCA 1 (n = 535) | PCA 2 (n = 5867) | PCA 3 (n = 5867) | ||||
|---|---|---|---|---|---|---|
| FACTOR 1 (50.1%) | FACTOR 2 (33.9%) | FACTOR 1 (76.1%) | FACTOR 2 (20.7%) | FACTOR 1 (57.8%) | FACTOR 2 (25.9%) | |
| UTMx coordinate | 0.37 * | 0.90 * | 0.74 * | −0.24 * | 0.73 * | 0.68 * |
| UTMy coordinate | −0.87 * | −0.02 | −0.91 * | −0.19 * | −0.91 * | 0.35 * |
| Altitude (m) | −0.77 * | 0.46 * | −0.94 * | −0.23 * | −0.96 * | 0.19 * |
| Date | −0.36 * | −0.01 | 0.22 * | −0.94 * | 0.13 * | 0.19 * |
| Variable Contribution | Schoener’s D | Equivalence Test | Similarity Test | |
|---|---|---|---|---|
| Prior to the myxomatosis outbreak | Bio1 (0.24); Bio3 (0.27); Bio2 (0.13); Bio4 (0.18); altitude (0.18) | 0.24 | p = 0.79 | p = 0.07 |
| After Myxomatosis outbreak | Bio1 (0.27); Bio3 (0.19); Bio2 (0.17); Bio4 (0.14); altitude (0.23) | 0.26 | p = 0.82 | p = 0.24 |
Publisher’s Note: MDPI stays neutral with regard to jurisdictional claims in published maps and institutional affiliations. |
© 2022 by the authors. Licensee MDPI, Basel, Switzerland. This article is an open access article distributed under the terms and conditions of the Creative Commons Attribution (CC BY) license (https://creativecommons.org/licenses/by/4.0/).
Share and Cite
Prenda, J.; Rodríguez-Rodríguez, E.J.; Negro, J.J.; Muñoz-Pichardo, J.M. The Dynamics of Lepus granatensis and Oryctolagus cuniculus in a Mediterranean Agrarian Area: Are Hares Segregating from Rabbit Habitats after Disease Impact? Animals 2022, 12, 1351. https://doi.org/10.3390/ani12111351
Prenda J, Rodríguez-Rodríguez EJ, Negro JJ, Muñoz-Pichardo JM. The Dynamics of Lepus granatensis and Oryctolagus cuniculus in a Mediterranean Agrarian Area: Are Hares Segregating from Rabbit Habitats after Disease Impact? Animals. 2022; 12(11):1351. https://doi.org/10.3390/ani12111351
Chicago/Turabian StylePrenda, José, Eduardo J. Rodríguez-Rodríguez, Juan J. Negro, and Juan Manuel Muñoz-Pichardo. 2022. "The Dynamics of Lepus granatensis and Oryctolagus cuniculus in a Mediterranean Agrarian Area: Are Hares Segregating from Rabbit Habitats after Disease Impact?" Animals 12, no. 11: 1351. https://doi.org/10.3390/ani12111351
APA StylePrenda, J., Rodríguez-Rodríguez, E. J., Negro, J. J., & Muñoz-Pichardo, J. M. (2022). The Dynamics of Lepus granatensis and Oryctolagus cuniculus in a Mediterranean Agrarian Area: Are Hares Segregating from Rabbit Habitats after Disease Impact? Animals, 12(11), 1351. https://doi.org/10.3390/ani12111351